How Bridging the Gap Between VB6 and .NET Provides ... · How Bridging the Gap Between VB6 and .NET...
26
Michelle Esterly Northrop Grumman Under Contract to NPCR Joseph D. Rogers, Team Lead Applications, Statistics, and Informatics Support Team (ASIST) NAACCR 2016 Annual Conference St. Louis, Missouri How Bridging the Gap Between VB6 and .NET Provides Efficiency for Automated Tumor Linkage Procedures in Registry Plus Central Registry Database Software National Center for Chronic Disease Prevention and Health Promotion Division of Cancer Prevention and Control
How Bridging the Gap Between VB6 and .NET Provides ... · How Bridging the Gap Between VB6 and .NET Provides Efficiency for Automated Tumor Linkage Procedures in Registry Plus Central
Michelle EsterlyNorthrop Grumman Under Contract to NPCR
Joseph D. Rogers, Team Lead Applications, Statistics, and Informatics Support Team
(ASIST)
NAACCR 2016 Annual ConferenceSt. Louis, Missouri
How Bridging the Gap Between VB6 and .NET Provides Efficiency for Automated
Tumor Linkage Procedures in Registry Plus Central Registry Database Software
National Center for Chronic Disease Prevention and Health PromotionDivision of Cancer Prevention and Control
Presenter
Presentation Notes
I will be presenting Automated Tumor Linkage in Registry Plus Central Registry Software. I know it is late in the day and it is difficult to compete with the fascinating topics and co-presenters in this concurrent session, but I will try to make this interesting.
Acknowledgments
Jennifer E. SeiffertCDC/NPCR Contractor
Sanjeev BaralCDC/NPCR Contractor
John JordanCDC/NPCR Contractor
Presenter
Presentation Notes
First, I would like to acknowledge my colleagues for this project. Jennifer Seiffert and I served as the subject matter experts defining the business rules and logic for the automated tumor linkage process. Sanjeev Baral programmed the tumor linkage logic in .NET and John Jordan is the current programmer for CRS Plus who is re-writing the overall software program in .NET.
Project Overview
Background
Automated Tumor Linkage Process
Initial Deployment
Transition to .NET
Future Plans
Presenter
Presentation Notes
I will provide background for this project, explain our automated tumor linkage process, describe our initial deployment, transition to .NET and future plans.
Background
Limited Automation for Tumor Linkage
Registry Automation Needs Increasing Rapidly
Records Sent for Manual Review
Presenter
Presentation Notes
Those of you using the Registry Plus central registry plus program, CRS Plus, can attest to this… so just to provide a little bit of background for all, NPCR’s Registry Plus software was programmed in VB6 and included limited automated logic for linking multiple reports for the same tumor. Manual decisions were necessary for the majority of reports linking to an existing patient. We all know Registry automation needs are increasing rapidly so we need to try to enhance automation to reduce the number of records requiring manual review.
Initial Deployment
External Program programmed in .NET
Not optimal; allowed for partial automation and testing
Abstracts needed to be processed in VB6 for Consolidation
Presenter
Presentation Notes
Since the overall plan was to re-program the database software in .NET, this Tumor Linkage module was programmed in .NET and set up as an external program that could be run against the Visual Basic application. We wanted users to be able to take advantage of the automation; however, the use was not optimal. Abstracts still needed to be processed for consolidation in VB6 so abstracts were still sent to pending and were still a burden to registries.
Automated Tumor Linkage Process
Abstract links to a patient and runs through the automated tumor linkage process
Based on SEER’s 2007 “Multiple Primary and Histology Coding Rules”
Utilized Existing Table Structure to Draft Logic Added tables to define logic
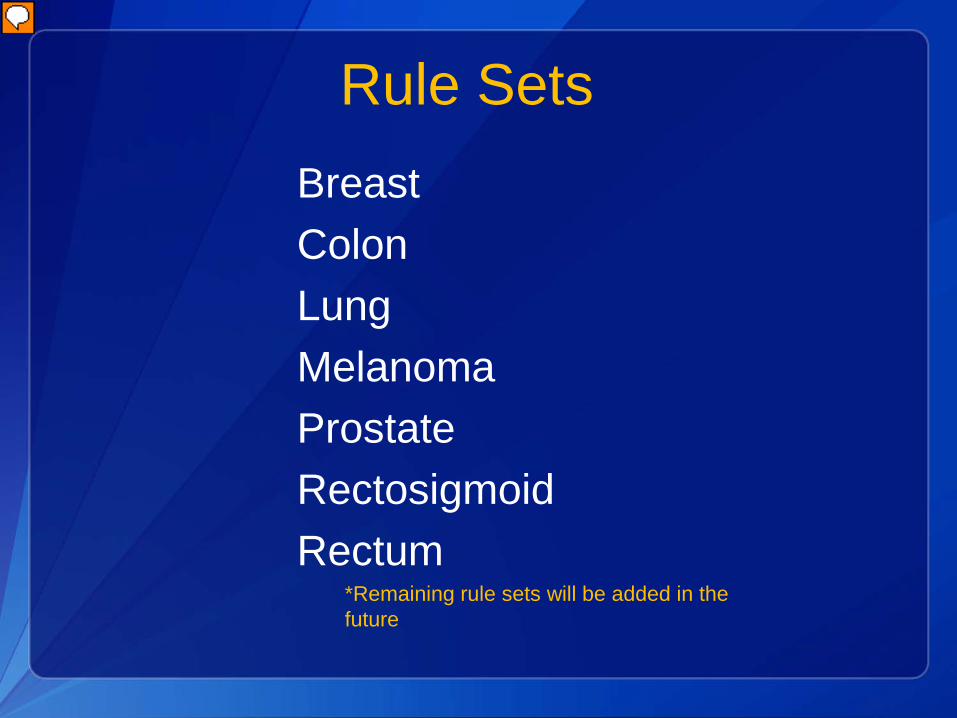
Created Rule Sets – focused on higher volume sites
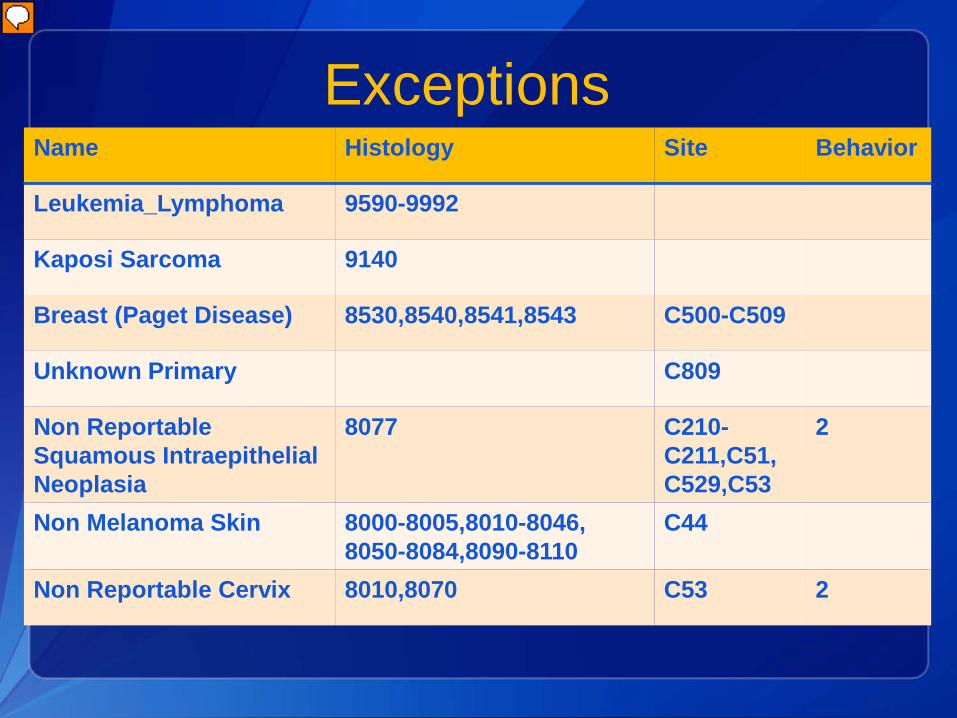
ExceptionsName Histology Site Behavior
Leukemia_Lymphoma 9590-9992
Kaposi Sarcoma 9140
Breast (Paget Disease) 8530,8540,8541,8543 C500-C509
Unknown Primary C809
Non ReportableSquamous Intraepithelial Neoplasia
8077 C210-C211,C51,C529,C53
2
Non Melanoma Skin 8000-8005,8010-8046, 8050-8084,8090-8110
C44
Non Reportable Cervix 8010,8070 C53 2
Presenter
Presentation Notes
We defined exceptions and determined we would re-evaluate these at a later time
Site and Histology Pairs
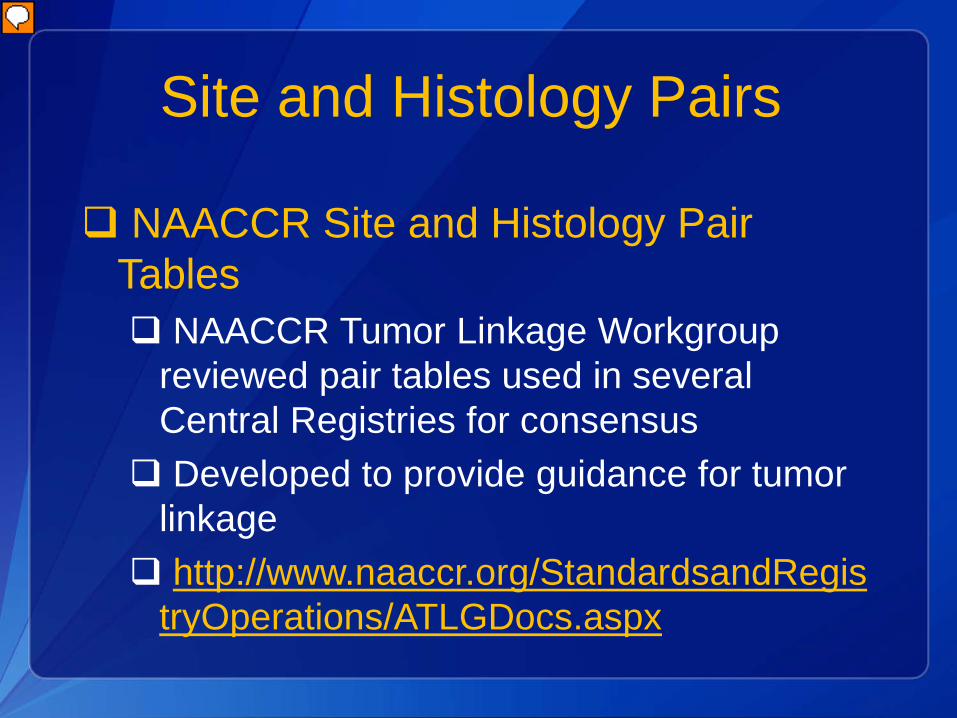
NAACCR Site and Histology Pair Tables NAACCR Tumor Linkage Workgroup
reviewed pair tables used in several Central Registries for consensus Developed to provide guidance for tumor
linkage http://www.naaccr.org/StandardsandRegis
tryOperations/ATLGDocs.aspx
Presenter
Presentation Notes
A workgroup was convened by NAACCR several years ago to develop Primary Site and Histology Pair tables to provide guidance to Central Registries. Several registries participated in the project and developed a site-pair table arranged in order of agreement. The tables and Executive Summary are available on the NAACCR website.
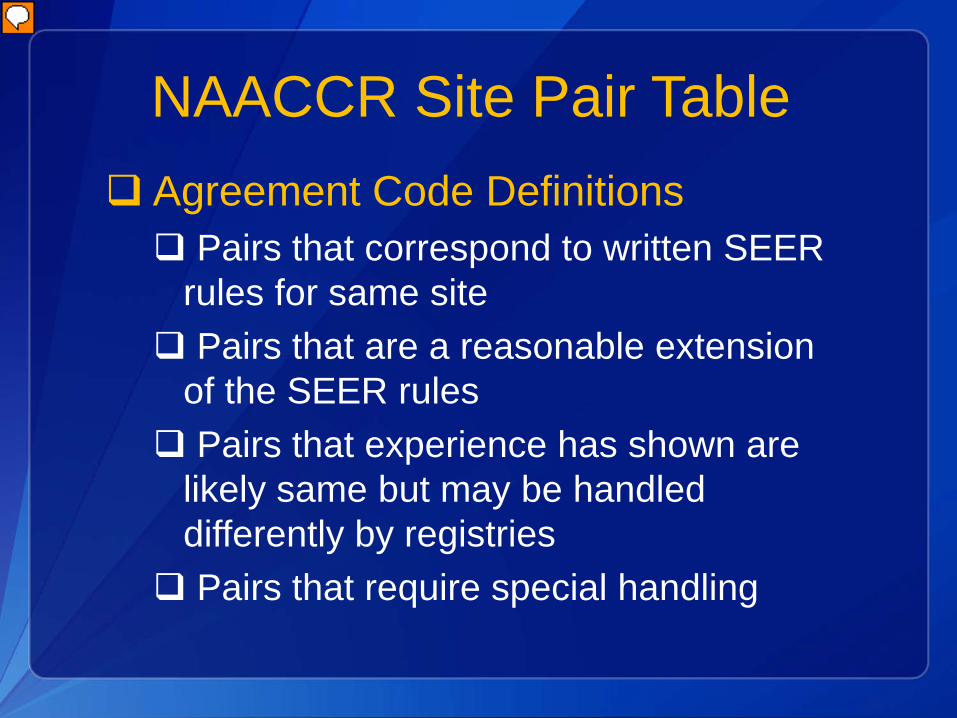
NAACCR Site Pair Table Agreement Code Definitions Pairs that correspond to written SEER
rules for same site Pairs that are a reasonable extension
of the SEER rules Pairs that experience has shown are
likely same but may be handled differently by registries Pairs that require special handling
Presenter
Presentation Notes
The NAACCR Workgroup defined agreement codes as follows…
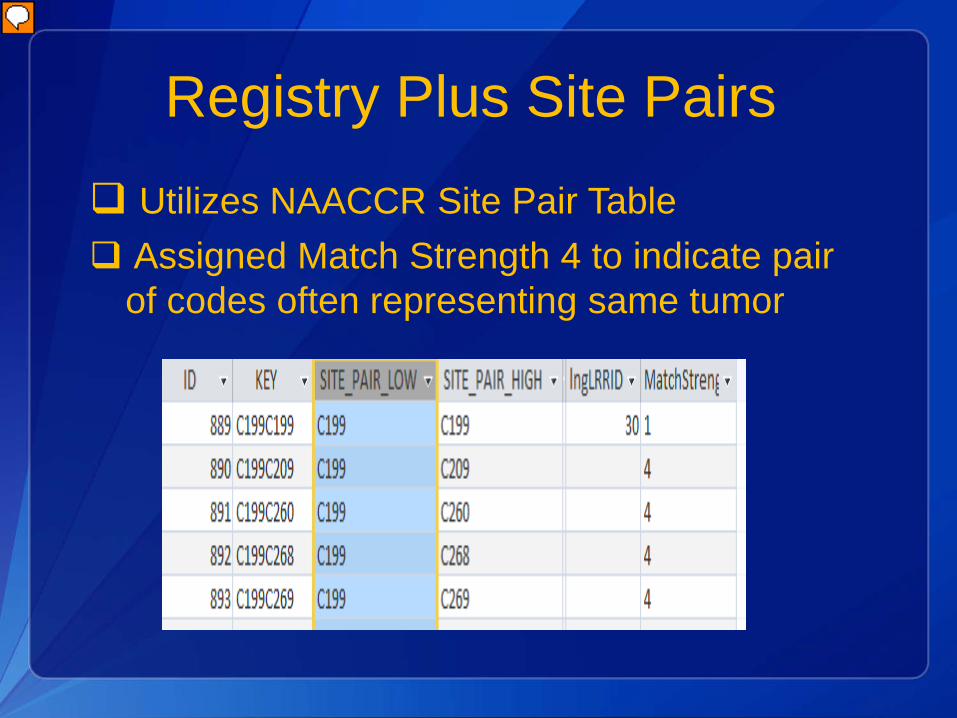
Registry Plus Site Pairs Utilizes NAACCR Site Pair Table Assigned Match Strength 4 to indicate pair
of codes often representing same tumor
Presenter
Presentation Notes
We have integrated the NAACCR Site Pair Table into CRS Plus, but we have added a Match Strength column and have assigned a Match Strength code of 4 to evaluate site pairs that often represent the same tumor even though they are not the same. Pairs with Match Strength 4 require manual review in CRS Plus. In this example…
Programmed Rules
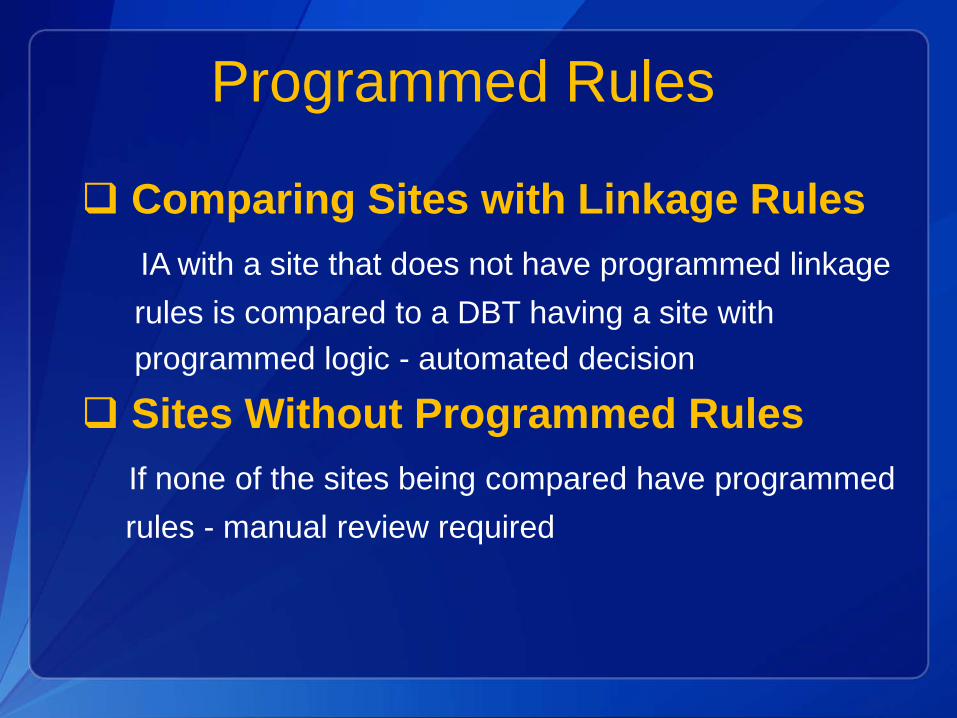
Comparing Sites with Linkage RulesIA with a site that does not have programmed linkage rules is compared to a DBT having a site with programmed logic - automated decision
Sites Without Programmed RulesIf none of the sites being compared have programmed rules - manual review required
Rule Set Timing Tables
Based on SEER Timing Interval Rules Developed Rule Sets Associated with
DX Timing Rule and Behavior Timing Rule If Behavior differs, time interval between
DxDates and sequence of occurrence reviewed
Presenter
Presentation Notes
Each rule set is associated with a DX Timing Rule and a Behavior Timing Rule as derived from the SEER rules.
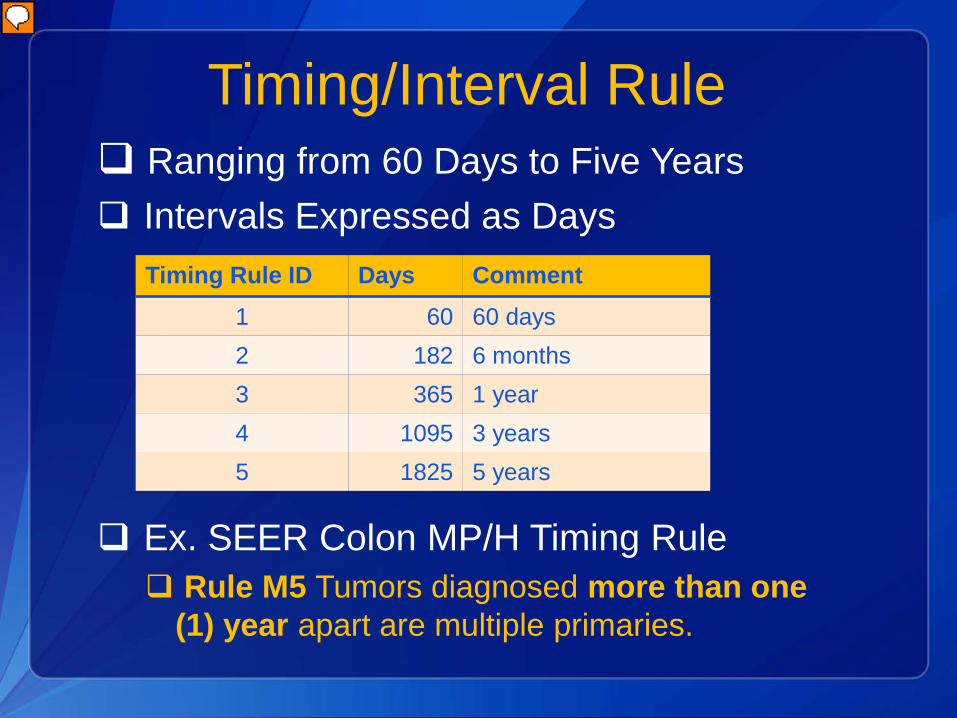
Timing/Interval Rule Ranging from 60 Days to Five Years Intervals Expressed as Days
Ex. SEER Colon MP/H Timing Rule Rule M5 Tumors diagnosed more than one
(1) year apart are multiple primaries.
Timing Rule ID Days Comment1 60 60 days2 182 6 months3 365 1 year4 1095 3 years5 1825 5 years
Presenter
Presentation Notes
For Diagnosis, the timing rules range from 60 days to five years. A timing rule table was added to CRS Plus and the intervals were expressed in days. As an example, the SEER Timing Rule for Colon is tumors diagnosed more than one year apart are multiple primaries. The Timing Rule ID assigned for the Colon rule set is 3 based on the SEER Timing Rule for Colon. If the day part of either date being compared is missing, the month difference is calculated and converted to days. If the month or year is missing on either date, the incoming abstract (IA) is sent to Pending for manual review.
General Description
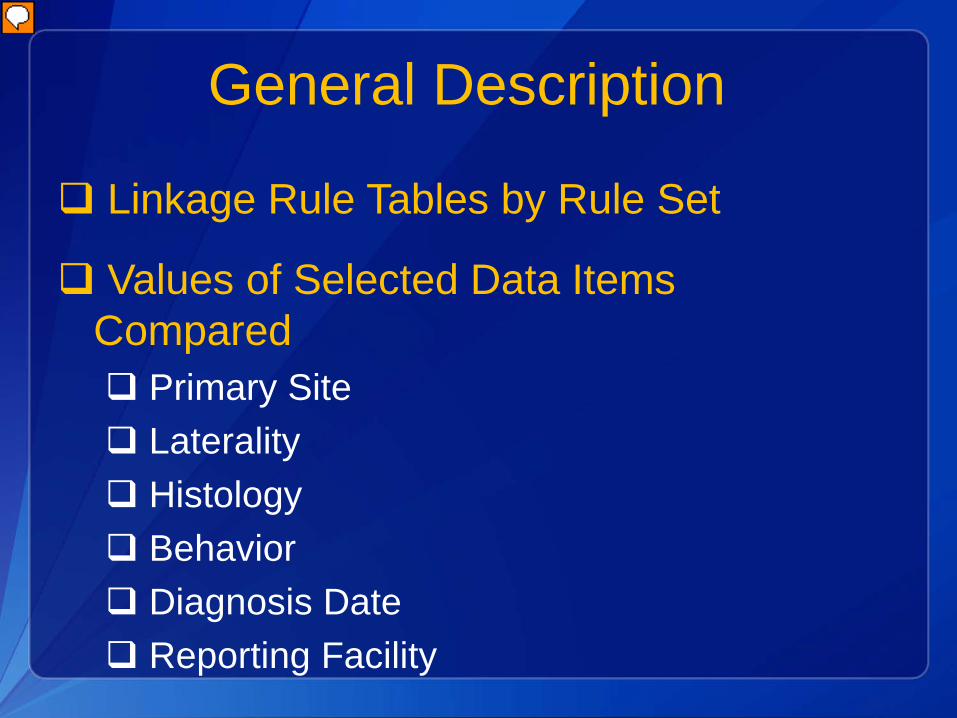
Linkage Rule Tables by Rule Set
Values of Selected Data Items Compared Primary Site Laterality Histology Behavior Diagnosis Date Reporting Facility
Presenter
Presentation Notes
Next step was to create linkage rule tables by rule set. In this table, values of selected data items are compared against the corresponding values in the consolidated tumor records for the patient.
General Description
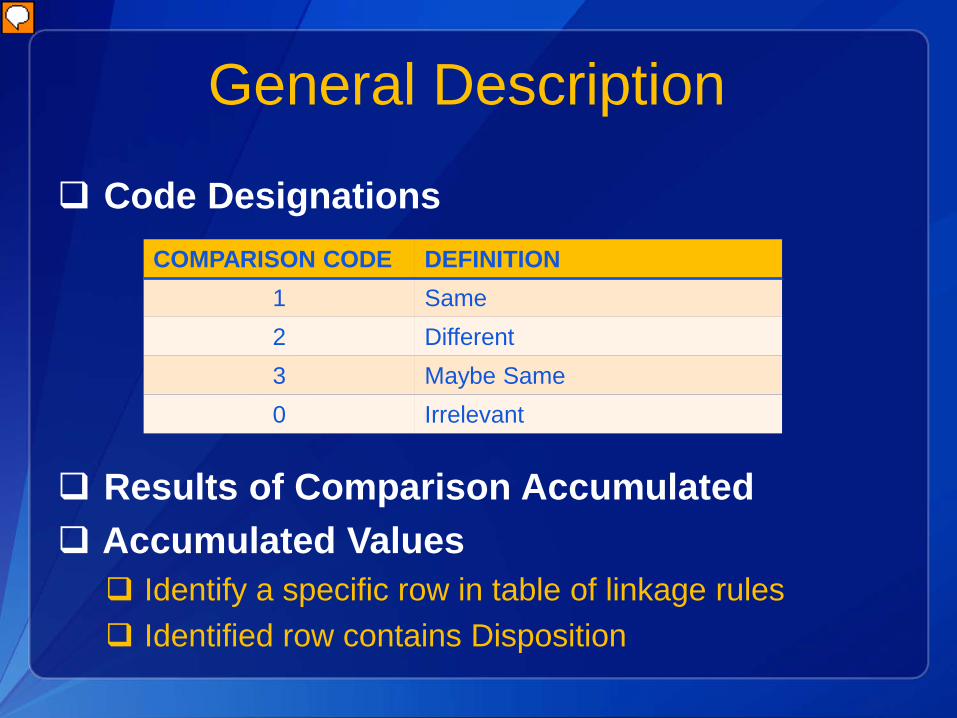
Code Designations
Results of Comparison Accumulated Accumulated Values Identify a specific row in table of linkage rules Identified row contains Disposition
The results of the comparisons (same, different, etc.) against each tumor are accumulated. The accumulated values identify a specific row in the table of linkage rules, and the identified row contains a disposition indicating whether the IA represents the same or a different tumor, or whether further manual review is needed.
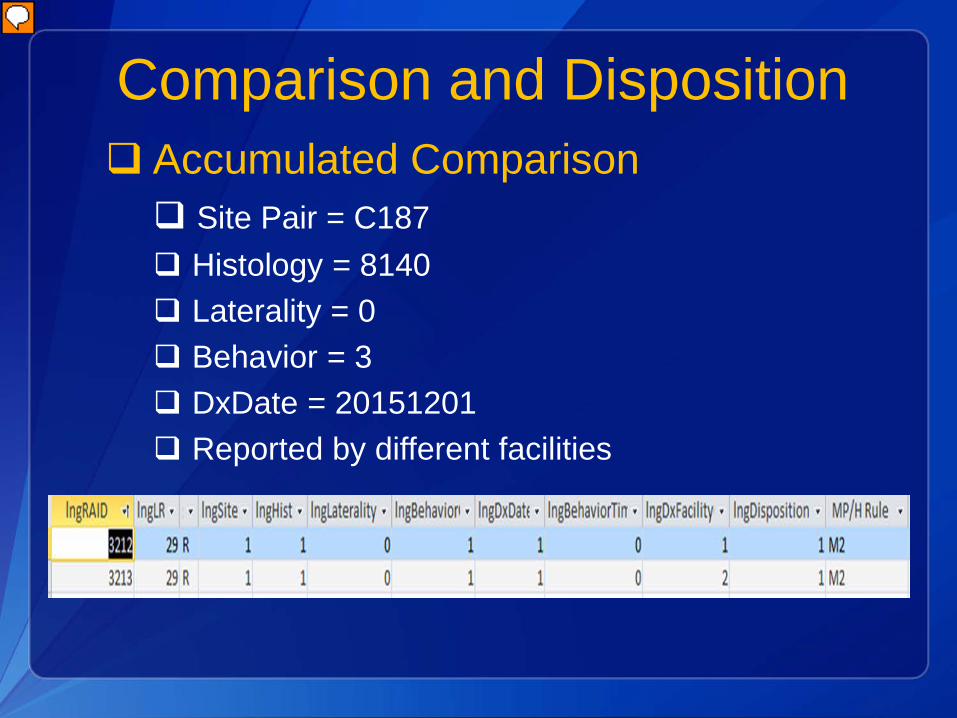
Comparison and Disposition Accumulated Comparison Site Pair = C187 Histology = 8140 Laterality = 0 Behavior = 3 DxDate = 20151201 Reported by different facilities
Presenter
Presentation Notes
Example of the accumulated values in the linkage rules table. For each defined rule set, there are multiple rows to account for all combinations of these data items. The Rule ID is 29 which we have defined as Colon. Based on this example, all of the values match except for facility. So, the second row displayed in this slide represents this combination and has Site, Histology, Behavior, DxDate as the same – remember code 1 equates to same; for Colon, laterality is irrelevant, and in this example, the tumor was reported by multiple facilities so the DxFacility column contains a 2 which equates to different. The overall Disposition code is a 1 which means this combination is considered the same tumor. We also reference the SEER MP/H rule in our table to further explain how the decision was determined for the accumulation of values.
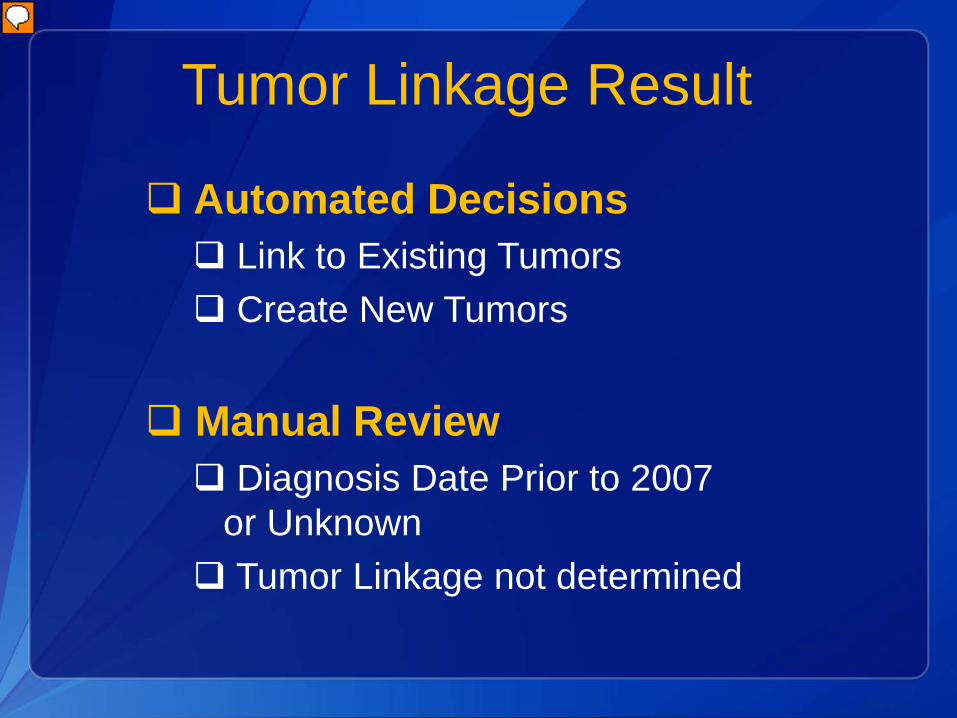
Tumor Linkage Result
Automated Decisions Link to Existing Tumors Create New Tumors
Manual Review Diagnosis Date Prior to 2007
or Unknown Tumor Linkage not determined
Presenter
Presentation Notes
If the comparison to any tumor results in a Pending disposition, or if the comparisons result in matches to more than one tumor, the IA is sent to Pending for further manual processing. If the comparisons result in a match to a single tumor, the IA is linked to that tumor and the work flow continues to the data item consolidation step. If no comparisons result in matches or pendings, the IA is processed as a new tumor for the patient. Automated tumor linkage is not attempted if the incoming abstract or database tumor has a diagnosis date prior to 2007 or unknown. This is due to the difference in SEER multiple primary rules required over time. One of the most significant impacts is within the urinary sites since the urinary sites considered to be the same primary changed with SEER MP/H effective 2007 compared to previous SEER MP/H rules.
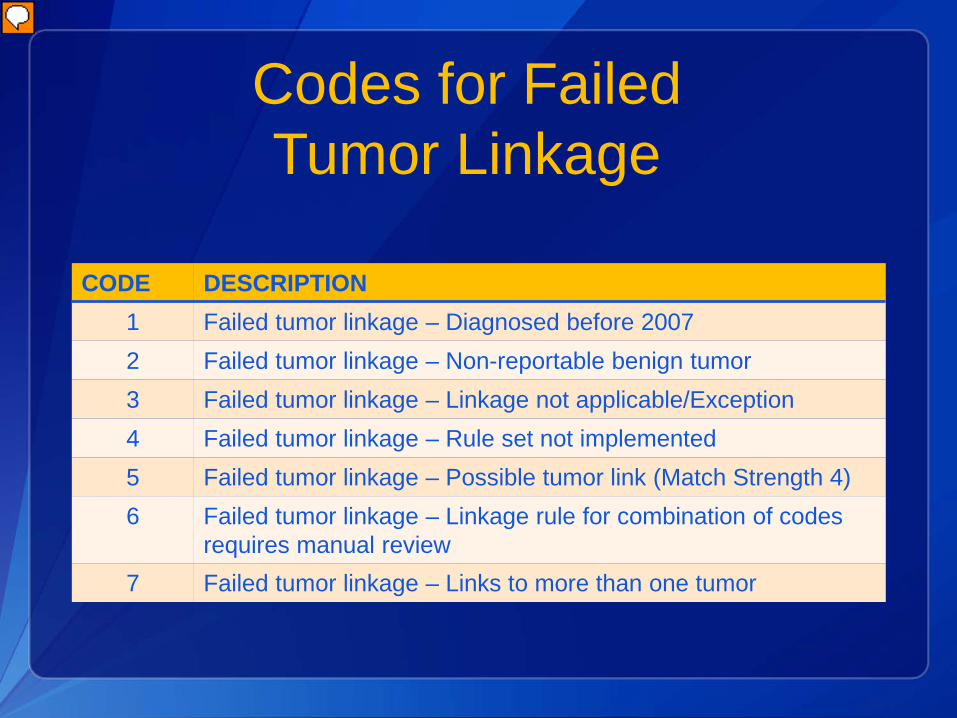
Codes for Failed Tumor Linkage
CODE DESCRIPTION1 Failed tumor linkage – Diagnosed before 20072 Failed tumor linkage – Non-reportable benign tumor3 Failed tumor linkage – Linkage not applicable/Exception4 Failed tumor linkage – Rule set not implemented5 Failed tumor linkage – Possible tumor link (Match Strength 4)6 Failed tumor linkage – Linkage rule for combination of codes
requires manual review7 Failed tumor linkage – Links to more than one tumor
Presenter
Presentation Notes
Assigned unique codes to define the reason for each failed tumor linkage
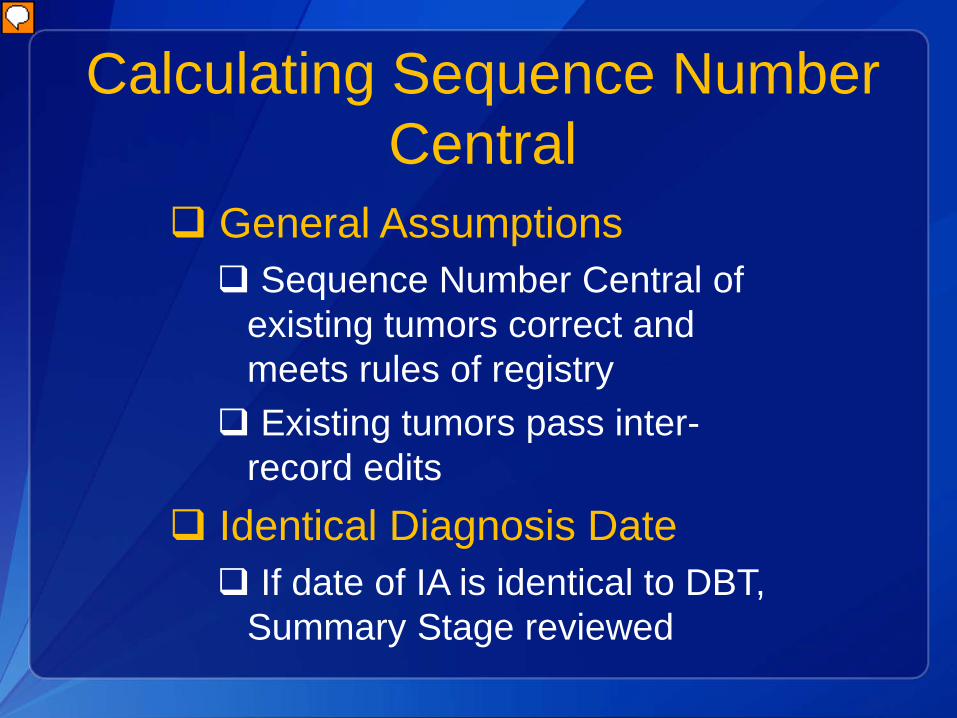
Calculating Sequence Number Central
General Assumptions Sequence Number Central of
existing tumors correct and meets rules of registry Existing tumors pass inter-
record edits Identical Diagnosis Date If date of IA is identical to DBT,
Summary Stage reviewed
Presenter
Presentation Notes
In order to add tumors to the database, specifications were needed to automate Sequence Number Central. We made some general assumptions
Calculating Sequence Number Central
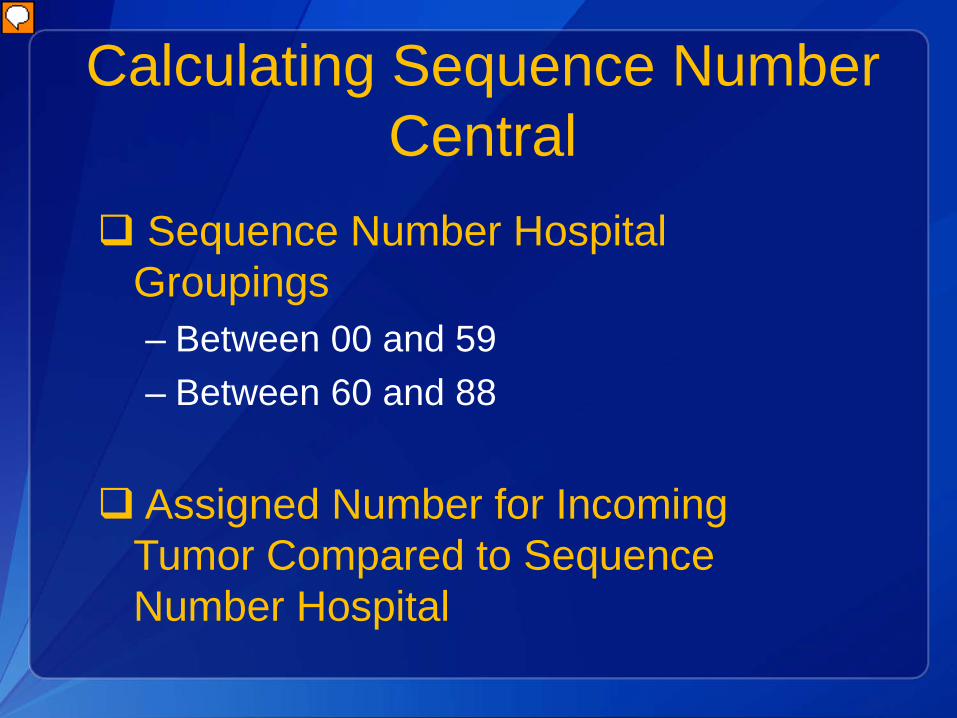
Sequence Number Hospital Groupings– Between 00 and 59– Between 60 and 88
Assigned Number for Incoming Tumor Compared to Sequence Number Hospital
Presenter
Presentation Notes
If the Sequence Number Hospital of the incoming abstract is between 00 and 59, then only tumors with Sequence Number Central between 00 and 59 are included in the sequencing. If the Sequence Number Hospital of the incoming abstract is between 60 and 88, then only tumors with Sequence Number Central between 60 and 88 are included in the sequencing. Before the assigned Sequence Number Central codes are written to the database, the assigned number for the incoming tumor is compared to the Sequence Number Hospital of the incoming tumor.
Calculating Sequence Number Central
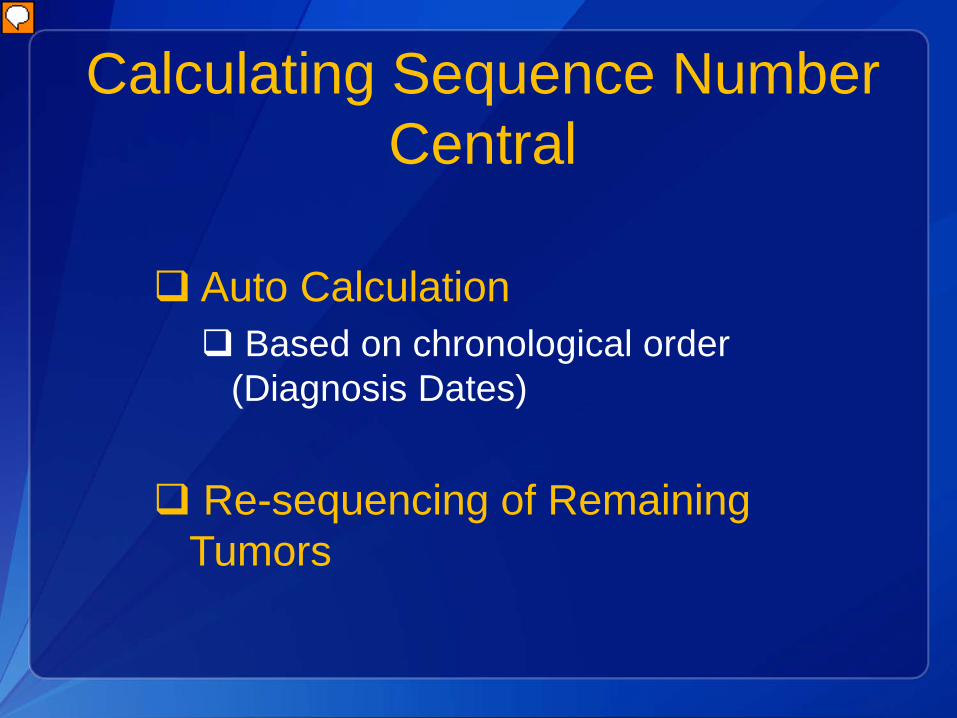
Auto Calculation Based on chronological order
(Diagnosis Dates)
Re-sequencing of Remaining Tumors
Presenter
Presentation Notes
If there is a match, all of the Sequence Number Central values for the patient's tumors will be re-sequenced and written to the database. If there is not a match, the incoming tumor will be left in pending for manual Sequence Number Central assignment and none of the existing tumors will be re-sequenced automatically.�
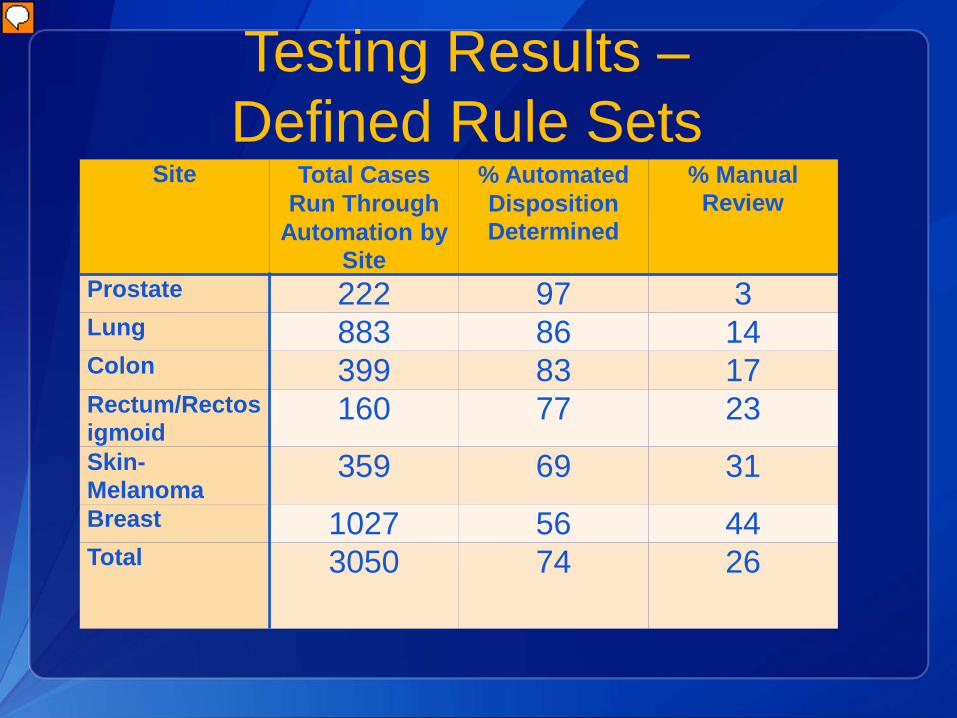
As you would expect, the site producing the highest automation result was Prostate – with 97% automation rate. There aren’t as many multiple primary rules and it is very simple. Breast is the site that still requires manual intervention for 44% of the sample. Multiple primary rules are more complex.
Transitioning to .NET
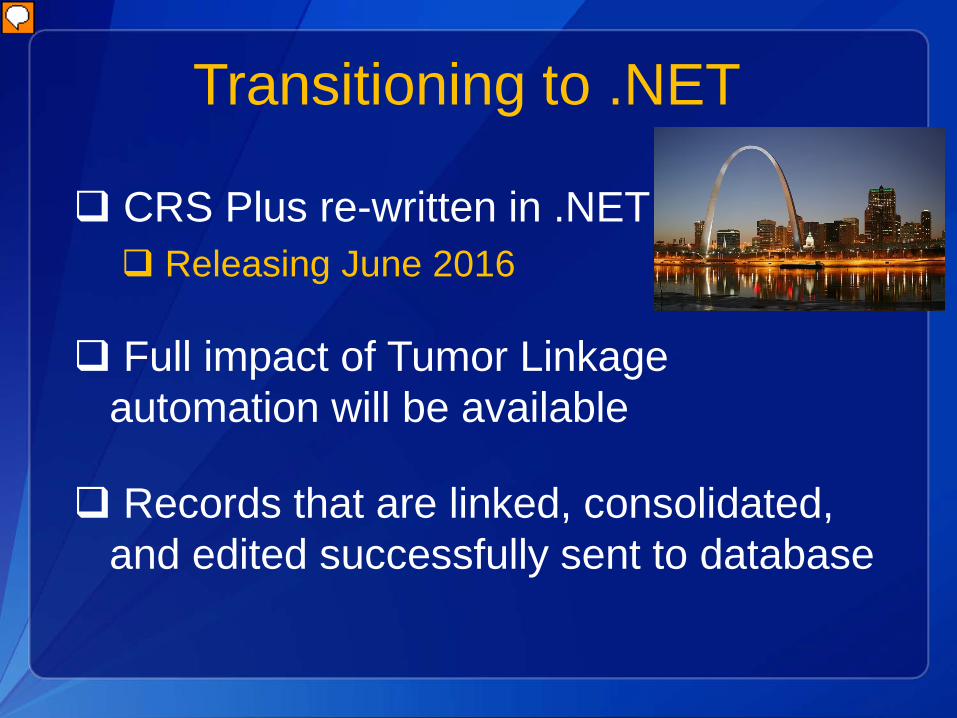
CRS Plus re-written in .NET Releasing June 2016
Full impact of Tumor Linkage automation will be available
Records that are linked, consolidated, and edited successfully sent to database
Presenter
Presentation Notes
Now that CRS Plus is completely re-written in .NET…
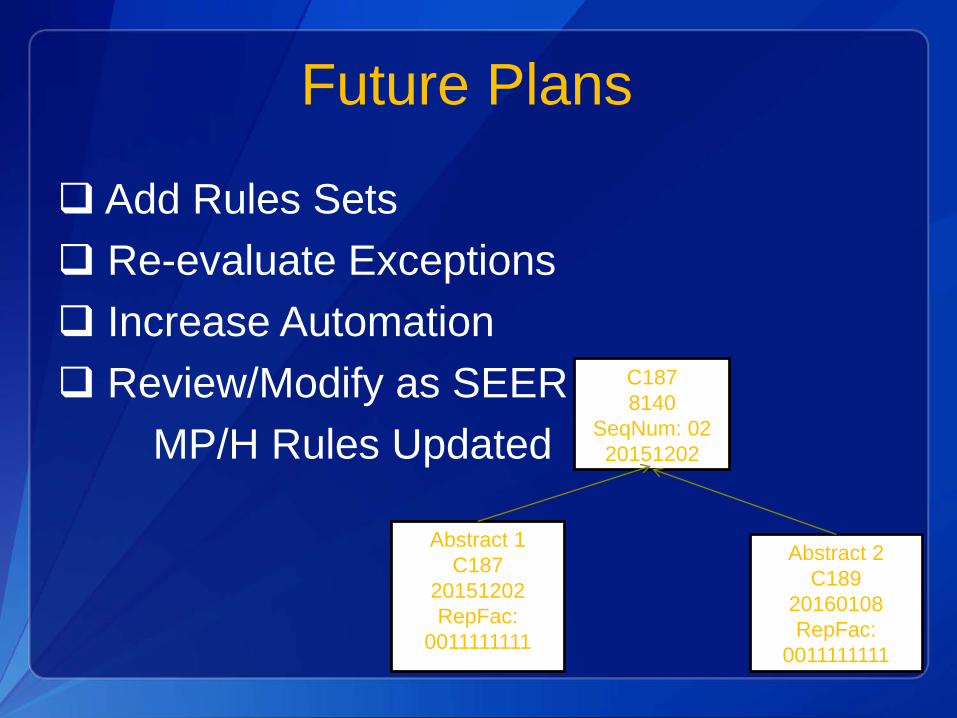
Future Plans
Add Rules Sets Re-evaluate Exceptions Increase Automation Review/Modify as SEER