Embed Size (px)
Citation preview

“How democracy and dictatorship affect economic growth: Evidence from James Monroe and the Quing Dynasty to George W. Bush and the Communist Party.”
Oslo seminar in positive political scienceBI, Oslo, 12/2 2009Carl Henrik Knutsen
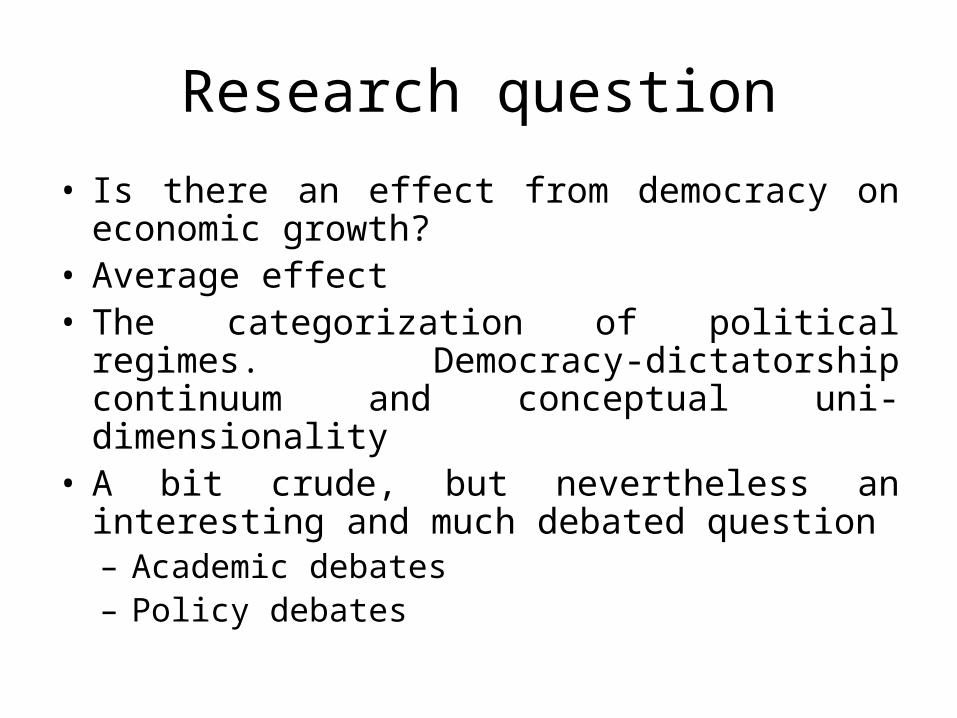
Research question
• Is there an effect from democracy on economic growth?
• Average effect• The categorization of political regimes. Democracy-
dictatorship continuum and conceptual uni-dimensionality
• A bit crude, but nevertheless an interesting and much debated question– Academic debates– Policy debates
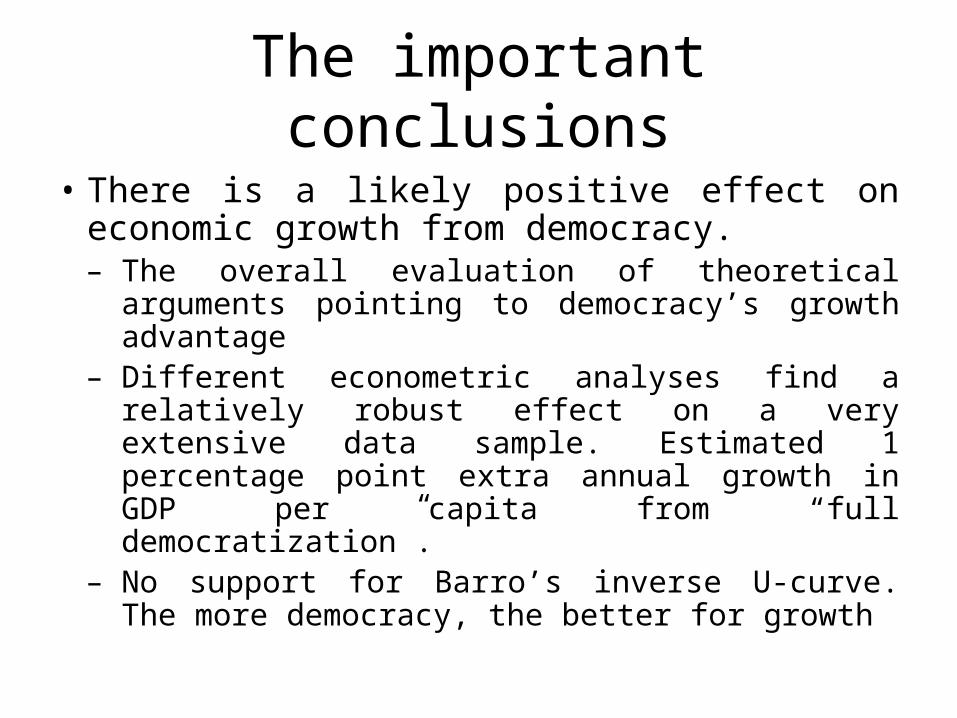
The important conclusions
• There is a likely positive effect on economic growth from democracy.– The overall evaluation of theoretical arguments
pointing to democracy’s growth advantage– Different econometric analyses find a relatively
robust effect on a very extensive data sample. Estimated 1 percentage point extra annual growth in GDP per capita from “full democratization”.
– No support for Barro’s inverse U-curve. The more democracy, the better for growth

Structure paper• Introduction with short review of answers/positions taken on the research
question• Theoretical arguments
– 4 Przeworski and Limongi arguments + 1 extra– Multiple mechanisms and no single, dominating coherent theoretical
framework– Scorecard
• Data• Empirical analysis,
– OLS with PCSE– FE and RE (answer to: what if unobserved country-specific effects?)– 2SLS (answer to: what if substantial endogeneity bias?)– Matching (non-linear effects)
• Short empirical section on Barro’s claim that semi-democracy is better for growth
• Conclusion
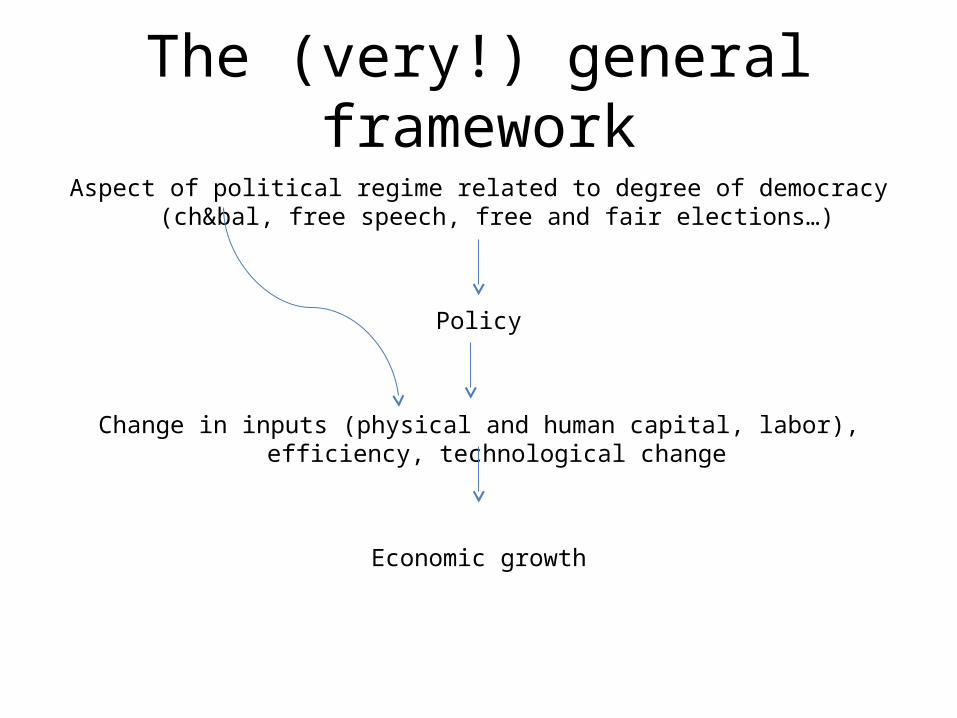
The (very!) general frameworkAspect of political regime related to degree of democracy (ch&bal, free speech, free
and fair elections…)
Policy
Change in inputs (physical and human capital, labor), efficiency, technological change
Economic growth

Summary theoretical scorecard
Argument Przeworski and Limongi's conclusions My conclusions
1) Democracy and property rights Either way For democracy
2) Democracy and investment Against democracy
Either way (for democracy when adding
human capital)
3) Dictatorship and insulation against
particularistic pressure Against democracy Against democracy, but with qualifications
4) Autonomous rulers are predatory For democracy For democracy
5) Democracy and technological change - For democracy
Data
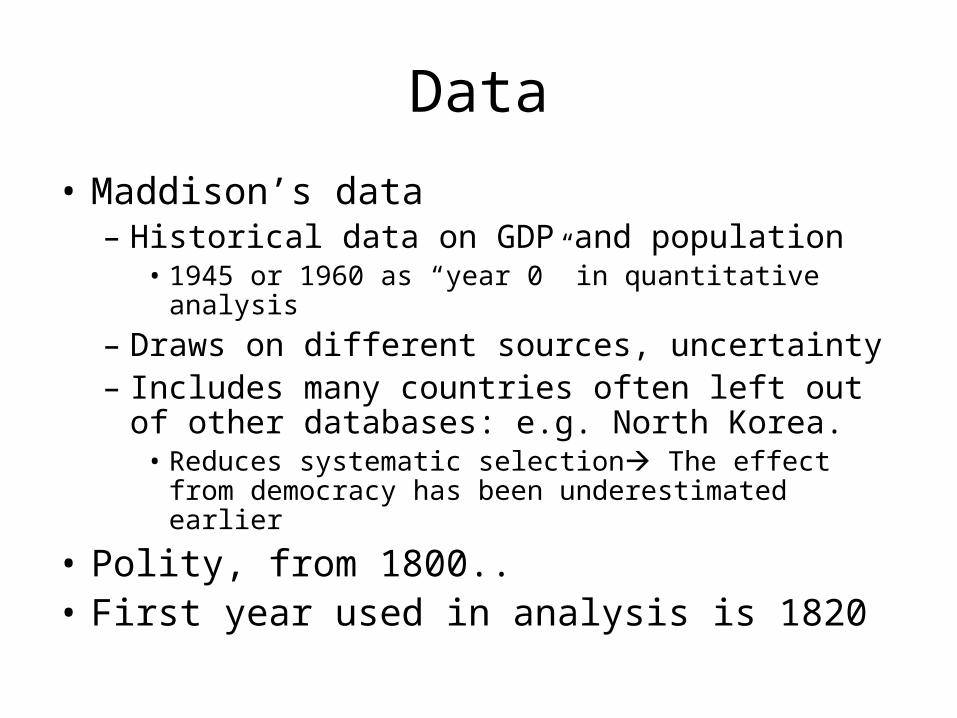
• Maddison’s data– Historical data on GDP and population
• 1945 or 1960 as “year 0” in quantitative analysis– Draws on different sources, uncertainty– Includes many countries often left out of other
databases: e.g. North Korea.• Reduces systematic selection The effect from democracy
has been underestimated earlier
• Polity, from 1800..• First year used in analysis is 1820
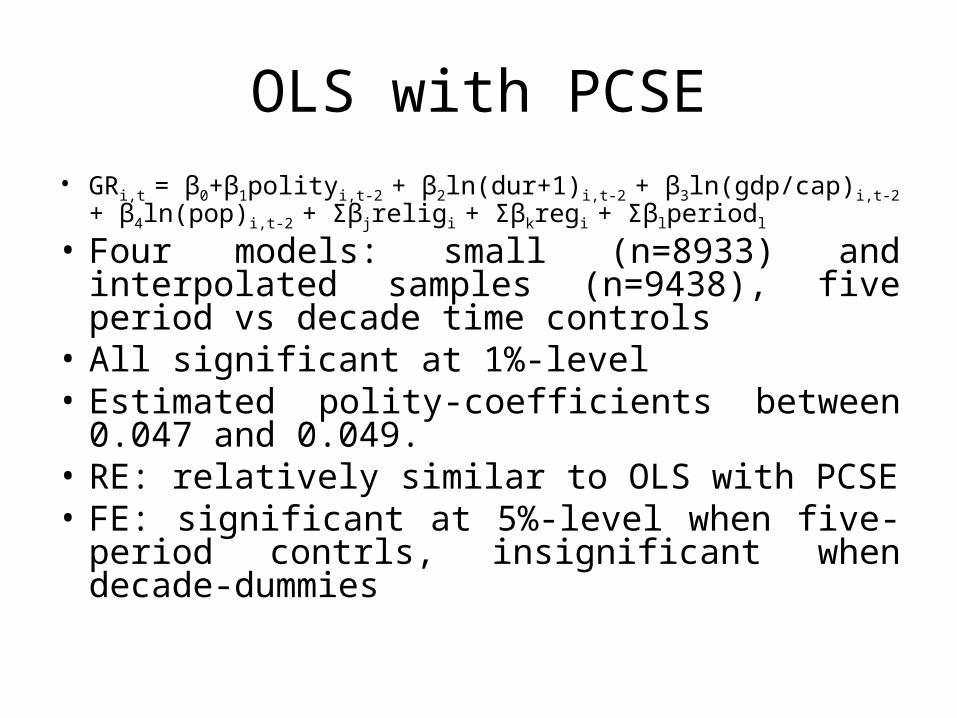
OLS with PCSE• GRi,t = β0+β1polityi,t-2 + β2ln(dur+1)i,t-2 + β3ln(gdp/cap)i,t-2 + β4ln(pop)i,t-2
+ Σβjreligi + Σβkregi + Σβlperiodl
• Four models: small (n=8933) and interpolated samples (n=9438), five period vs decade time controls
• All significant at 1%-level• Estimated polity-coefficients between 0.047 and
0.049.• RE: relatively similar to OLS with PCSE• FE: significant at 5%-level when five-period
contrls, insignificant when decade-dummies
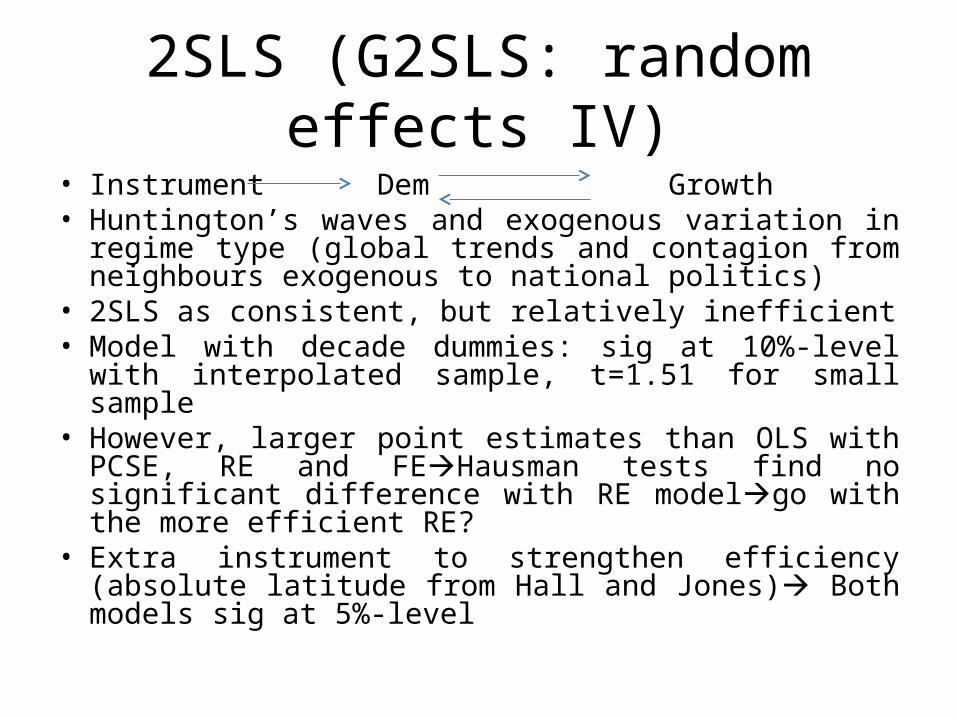
2SLS (G2SLS: random effects IV)• Instrument Dem Growth• Huntington’s waves and exogenous variation in regime type
(global trends and contagion from neighbours exogenous to national politics)
• 2SLS as consistent, but relatively inefficient• Model with decade dummies: sig at 10%-level with
interpolated sample, t=1.51 for small sample• However, larger point estimates than OLS with PCSE, RE
and FEHausman tests find no significant difference with RE modelgo with the more efficient RE?
• Extra instrument to strengthen efficiency (absolute latitude from Hall and Jones) Both models sig at 5%-level
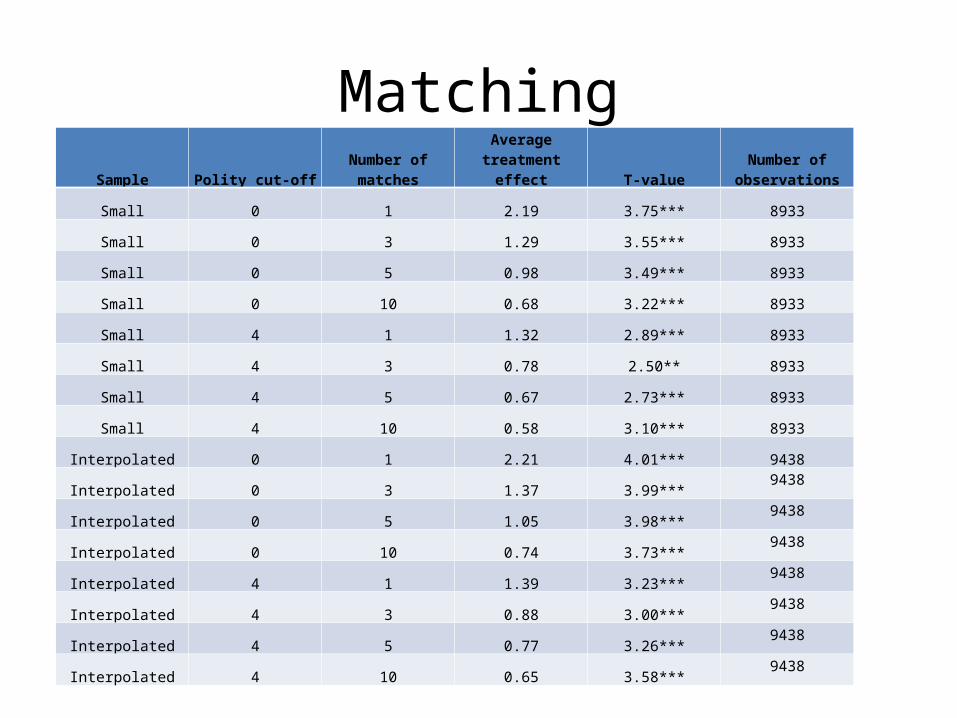
MatchingSample Polity cut-off Number of matches
Average treatment effect T-value
Number of observations
Small 0 1 2.19 3.75*** 8933
Small 0 3 1.29 3.55*** 8933
Small 0 5 0.98 3.49*** 8933
Small 0 10 0.68 3.22*** 8933
Small 4 1 1.32 2.89*** 8933
Small 4 3 0.78 2.50** 8933
Small 4 5 0.67 2.73*** 8933
Small 4 10 0.58 3.10*** 8933
Interpolated 0 1 2.21 4.01*** 9438
Interpolated 0 3 1.37 3.99***9438
Interpolated 0 5 1.05 3.98***9438
Interpolated 0 10 0.74 3.73***9438
Interpolated 4 1 1.39 3.23***9438
Interpolated 4 3 0.88 3.00***9438
Interpolated 4 5 0.77 3.26***9438
Interpolated 4 10 0.65 3.58***9438
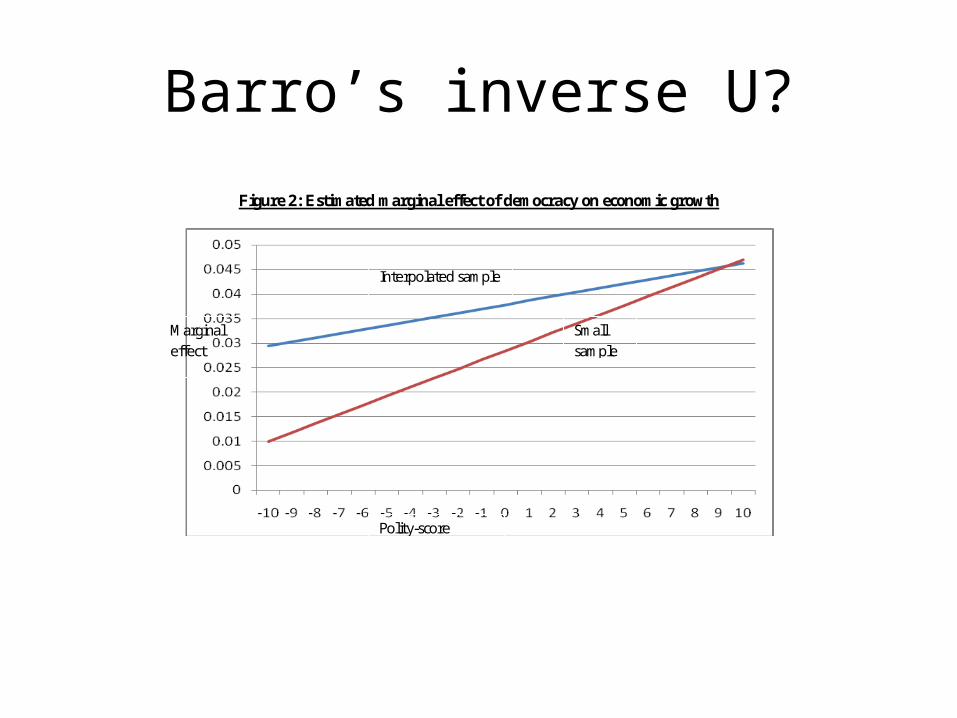
Barro’s inverse U?
Figure 2: Estimated marginal effect of democracy on economic growth
Small sample
Interpolated sample
Polity-score
Marginal effect
Conclusion
• Different methods, based on different assumptions, indicate a positive effect from democracy on growth when using the largest sample of data available.
• No democracy-growth trade-off, rather to the contrary.