Embed Size (px)
Citation preview
HSBC Vantage5 Index Guide
Table of contents
HSBC Vantage5 Index 1
In brief 2
HSBC Vantage5 performance 3
Comparative results 5
Key drivers 6
HSBC Vantage5 strategy 7
Strategic allocation 8
Achieving balance 9
Weight construction 10
Hypothetical historical volatility 11
More information 12
Risks relating to the index 13
Important information 15
HSBC Vantage5 Index
The HSBC Vantage5 Index is designed to balance a strategic
combination of US and Emerging Market Equities, Bonds, Real
Assets, an Inflation ETF, and Cash to deliver overall market growth
potential in a low volatility index. The Index aims to achieve stable
returns while guarding against a degree of losses during market
downturns.
1
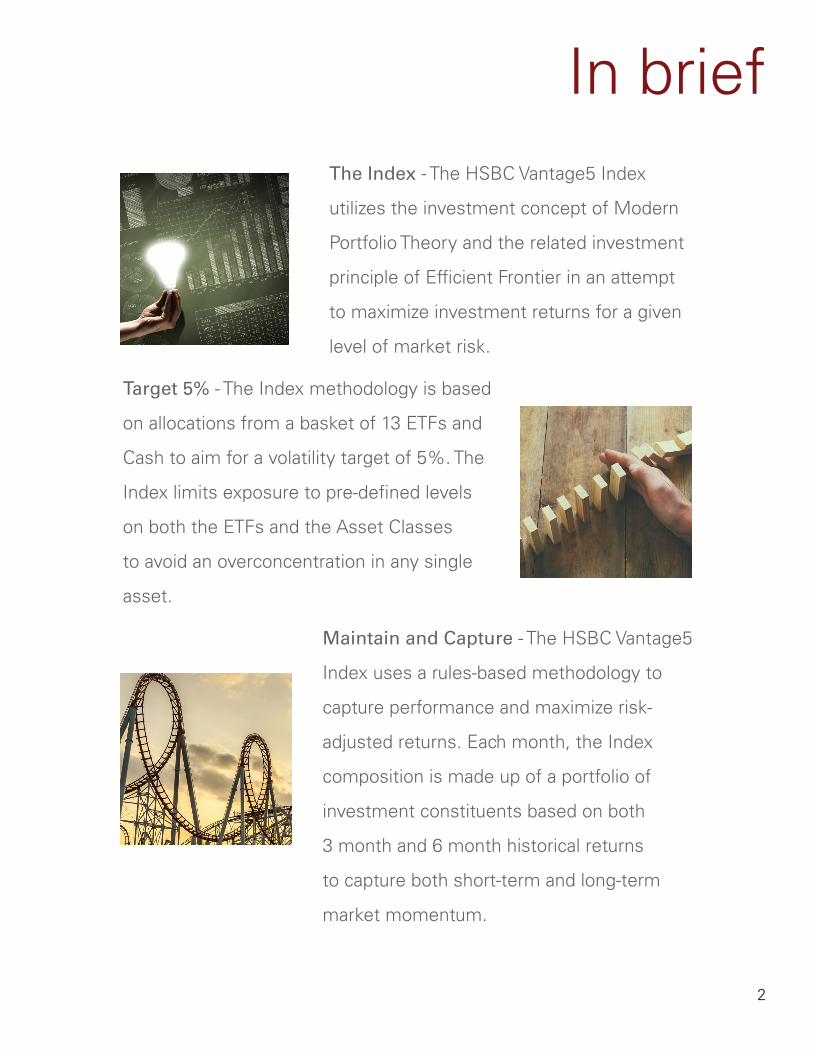
In briefThe Index - The HSBC Vantage5 Index
utilizes the investment concept of Modern
Portfolio Theory and the related investment
principle of Efficient Frontier in an attempt
to maximize investment returns for a given
level of market risk.
Maintain and Capture - The HSBC Vantage5
Index uses a rules-based methodology to
capture performance and maximize risk-
adjusted returns. Each month, the Index
composition is made up of a portfolio of
investment constituents based on both
3 month and 6 month historical returns
to capture both short-term and long-term
market momentum.
Target 5% - The Index methodology is based
on allocations from a basket of 13 ETFs and
Cash to aim for a volatility target of 5%. The
Index limits exposure to pre-defined levels
on both the ETFs and the Asset Classes
to avoid an overconcentration in any single
asset.
2
1
HSBCVantage5
Performance
3
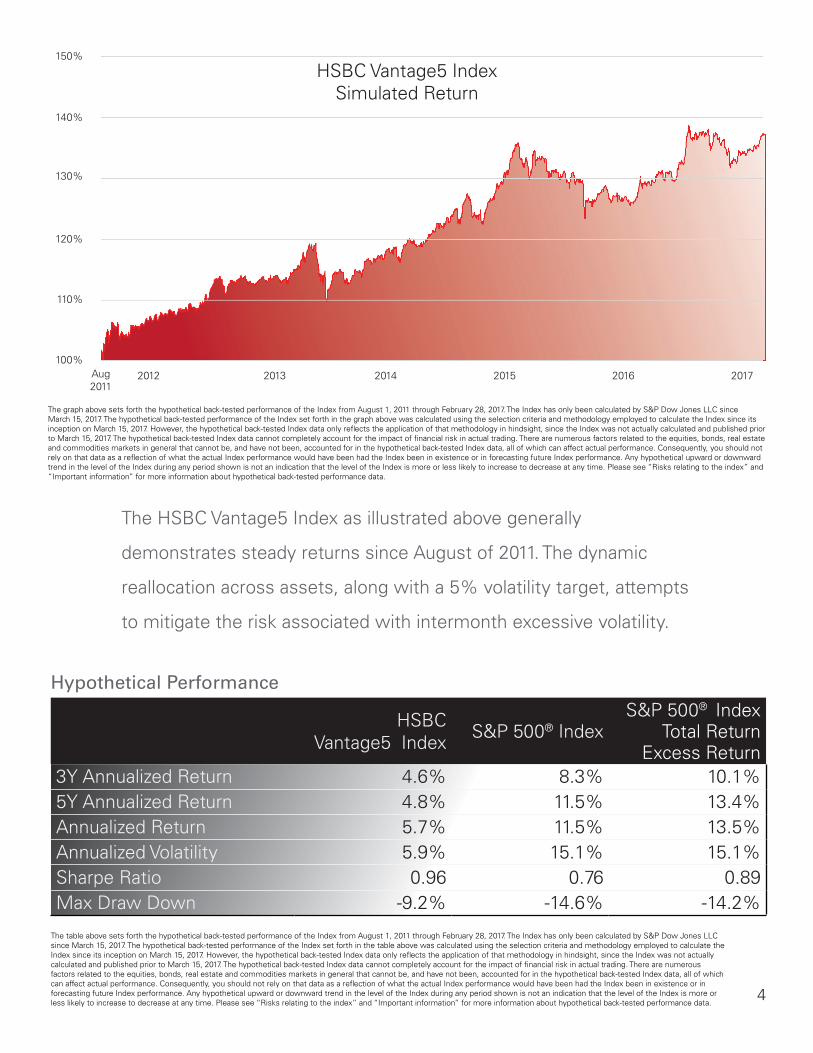
The HSBC Vantage5 Index as illustrated above generally
demonstrates steady returns since August of 2011. The dynamic
reallocation across assets, along with a 5% volatility target, attempts
to mitigate the risk associated with intermonth excessive volatility.
Hypothetical Performance
The table above sets forth the hypothetical back-tested performance of the Index from August 1, 2011 through February 28, 2017. The Index has only been calculated by S&P Dow Jones LLC since March 15, 2017. The hypothetical back-tested performance of the Index set forth in the table above was calculated using the selection criteria and methodology employed to calculate the Index since its inception on March 15, 2017. However, the hypothetical back-tested Index data only reflects the application of that methodology in hindsight, since the Index was not actually calculated and published prior to March 15, 2017. The hypothetical back-tested Index data cannot completely account for the impact of financial risk in actual trading. There are numerous factors related to the equities, bonds, real estate and commodities markets in general that cannot be, and have not been, accounted for in the hypothetical back-tested Index data, all of which can affect actual performance. Consequently, you should not rely on that data as a reflection of what the actual Index performance would have been had the Index been in existence or in forecasting future Index performance. Any hypothetical upward or downward trend in the level of the Index during any period shown is not an indication that the level of the Index is more or less likely to increase to decrease at any time. Please see “Risks relating to the index” and “Important information” for more information about hypothetical back-tested performance data.
4
HSBC Vantage5 IndexSimulated Return
100%
The graph above sets forth the hypothetical back-tested performance of the Index from August 1, 2011 through February 28, 2017. The Index has only been calculated by S&P Dow Jones LLC since March 15, 2017. The hypothetical back-tested performance of the Index set forth in the graph above was calculated using the selection criteria and methodology employed to calculate the Index since its inception on March 15, 2017. However, the hypothetical back-tested Index data only reflects the application of that methodology in hindsight, since the Index was not actually calculated and published prior to March 15, 2017. The hypothetical back-tested Index data cannot completely account for the impact of financial risk in actual trading. There are numerous factors related to the equities, bonds, real estate and commodities markets in general that cannot be, and have not been, accounted for in the hypothetical back-tested Index data, all of which can affect actual performance. Consequently, you should not rely on that data as a reflection of what the actual Index performance would have been had the Index been in existence or in forecasting future Index performance. Any hypothetical upward or downward trend in the level of the Index during any period shown is not an indication that the level of the Index is more or less likely to increase to decrease at any time. Please see “Risks relating to the index” and “Important information” for more information about hypothetical back-tested performance data.
Aug 2011
2012 2013 2014 2015
110%
120%
130%
140%
150%
2016
HSBC Vantage5 Index S&P 500® Index
S&P 500® Index Total Return
Excess Return3Y Annualized Return 4.6% 8.3% 10.1%5Y Annualized Return 4.8% 11.5% 13.4%Annualized Return 5.7% 11.5% 13.5%Annualized Volatility 5.9% 15.1% 15.1%Sharpe Ratio 0.96 0.76 0.89Max Draw Down -9.2% -14.6% -14.2%
2017
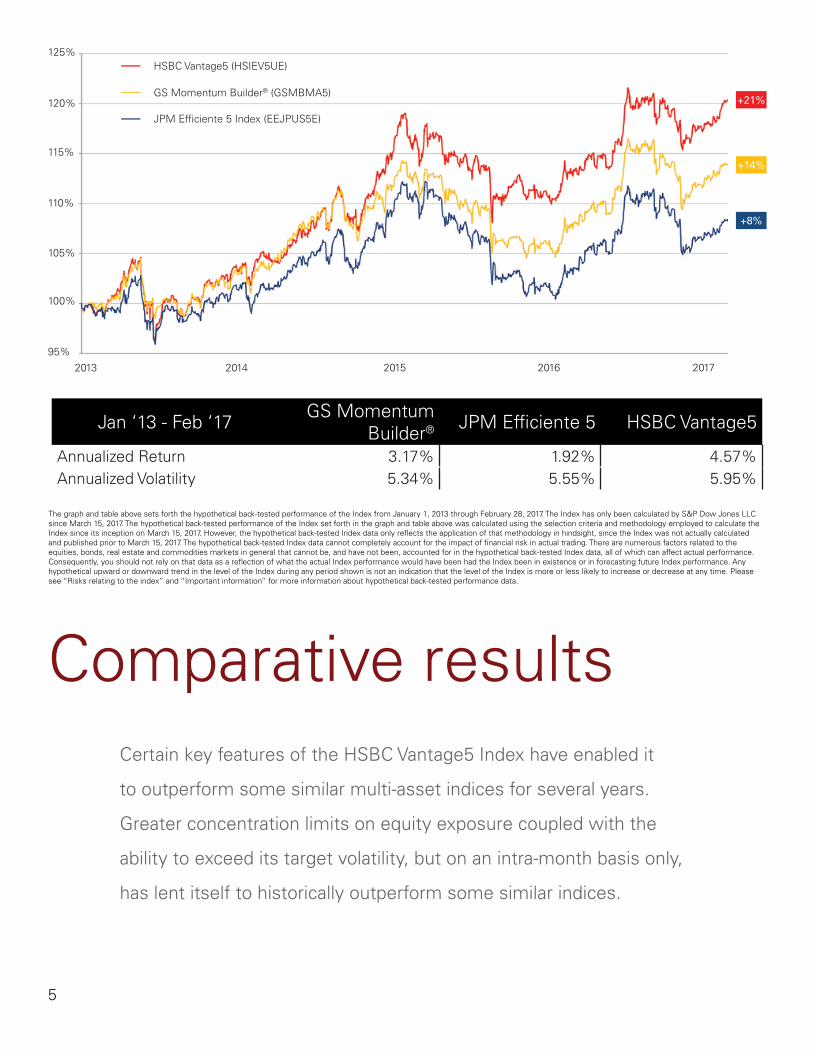
Certain key features of the HSBC Vantage5 Index have enabled it
to outperform some similar multi-asset indices for several years.
Greater concentration limits on equity exposure coupled with the
ability to exceed its target volatility, but on an intra-month basis only,
has lent itself to historically outperform some similar indices.
Comparative results
5
125%
120%
115%
110%
100%
105%
95%
2013 2015 2016
JPM Efficiente 5 Index (EEJPUS5E)
HSBC Vantage5 (HSIEV5UE)
GS Momentum Builder® (GSMBMA5)+21%
+14%
+8%
Jan ‘13 - Feb ‘17 GS Momentum Builder® JPM Efficiente 5 HSBC Vantage5
Annualized Return 3.17% 1.92% 4.57%Annualized Volatility 5.34% 5.55% 5.95%
20172014
The graph and table above sets forth the hypothetical back-tested performance of the Index from January 1, 2013 through February 28, 2017. The Index has only been calculated by S&P Dow Jones LLC since March 15, 2017. The hypothetical back-tested performance of the Index set forth in the graph and table above was calculated using the selection criteria and methodology employed to calculate the Index since its inception on March 15, 2017. However, the hypothetical back-tested Index data only reflects the application of that methodology in hindsight, since the Index was not actually calculated and published prior to March 15, 2017. The hypothetical back-tested Index data cannot completely account for the impact of financial risk in actual trading. There are numerous factors related to the equities, bonds, real estate and commodities markets in general that cannot be, and have not been, accounted for in the hypothetical back-tested Index data, all of which can affect actual performance. Consequently, you should not rely on that data as a reflection of what the actual Index performance would have been had the Index been in existence or in forecasting future Index performance. Any hypothetical upward or downward trend in the level of the Index during any period shown is not an indication that the level of the Index is more or less likely to increase or decrease at any time. Please see “Risks relating to the index” and “Important information” for more information about hypothetical back-tested performance data.
Key drivers
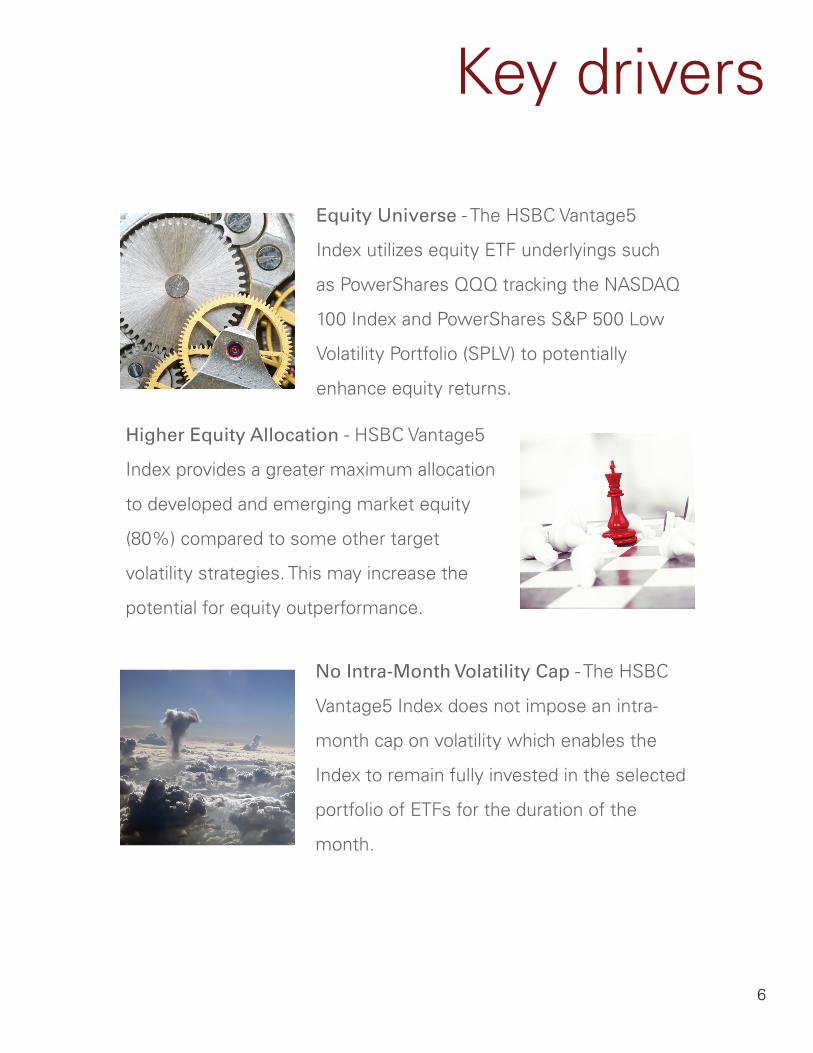
Equity Universe - The HSBC Vantage5
Index utilizes equity ETF underlyings such
as PowerShares QQQ tracking the NASDAQ
100 Index and PowerShares S&P 500 Low
Volatility Portfolio (SPLV) to potentially
enhance equity returns.
Higher Equity Allocation - HSBC Vantage5
Index provides a greater maximum allocation
to developed and emerging market equity
(80%) compared to some other target
volatility strategies. This may increase the
potential for equity outperformance.
No Intra-Month Volatility Cap - The HSBC
Vantage5 Index does not impose an intra-
month cap on volatility which enables the
Index to remain fully invested in the selected
portfolio of ETFs for the duration of the
month.
6

HSBCVantage5Index Strategy
7
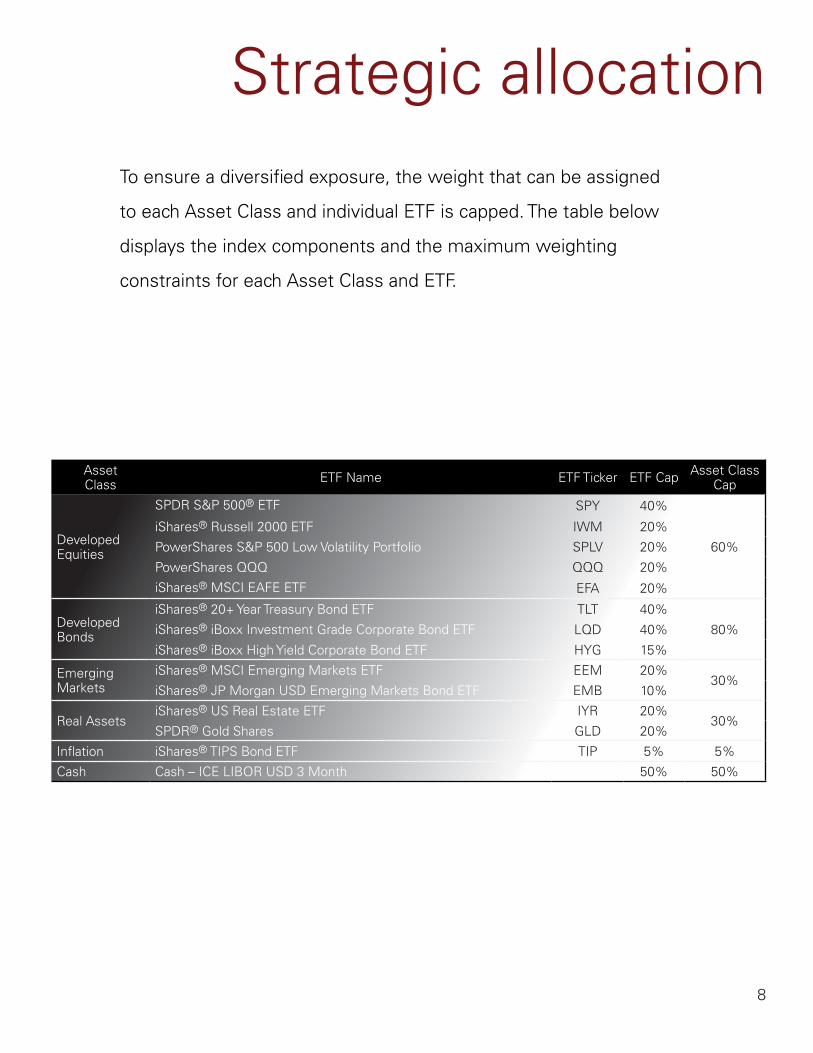
Strategic allocationTo ensure a diversified exposure, the weight that can be assigned
to each Asset Class and individual ETF is capped. The table below
displays the index components and the maximum weighting
constraints for each Asset Class and ETF.
8
AssetClass ETF Name ETF Ticker ETF Cap Asset Class
Cap
Developed Equities
SPDR S&P 500® ETF SPY 40%
60%
iShares® Russell 2000 ETF IWM 20%
PowerShares S&P 500 Low Volatility Portfolio SPLV 20%
PowerShares QQQ QQQ 20%
iShares® MSCI EAFE ETF EFA 20%
Developed Bonds
iShares® 20+ Year Treasury Bond ETF TLT 40%
80%iShares® iBoxx Investment Grade Corporate Bond ETF LQD 40%
iShares® iBoxx High Yield Corporate Bond ETF HYG 15%
Emerging Markets
iShares® MSCI Emerging Markets ETF EEM 20%30%
iShares® JP Morgan USD Emerging Markets Bond ETF EMB 10%
Real AssetsiShares® US Real Estate ETF IYR 20%
30%SPDR® Gold Shares GLD 20%
Inflation iShares® TIPS Bond ETF TIP 5% 5%
Cash Cash – ICE LIBOR USD 3 Month 50% 50%
Achievingbalance
Monthly reallocation of assets seeks to reduce downside risk while
allowing the HSBC Vantage5 Index to quickly adapt to events and
emerging trends.
The HSBC Vantage5 Index strategically allocates across multiple
asset classes. The index is capable of investing up to 50% of the
basket in Cash enabling greater stability in volatile markets.
9
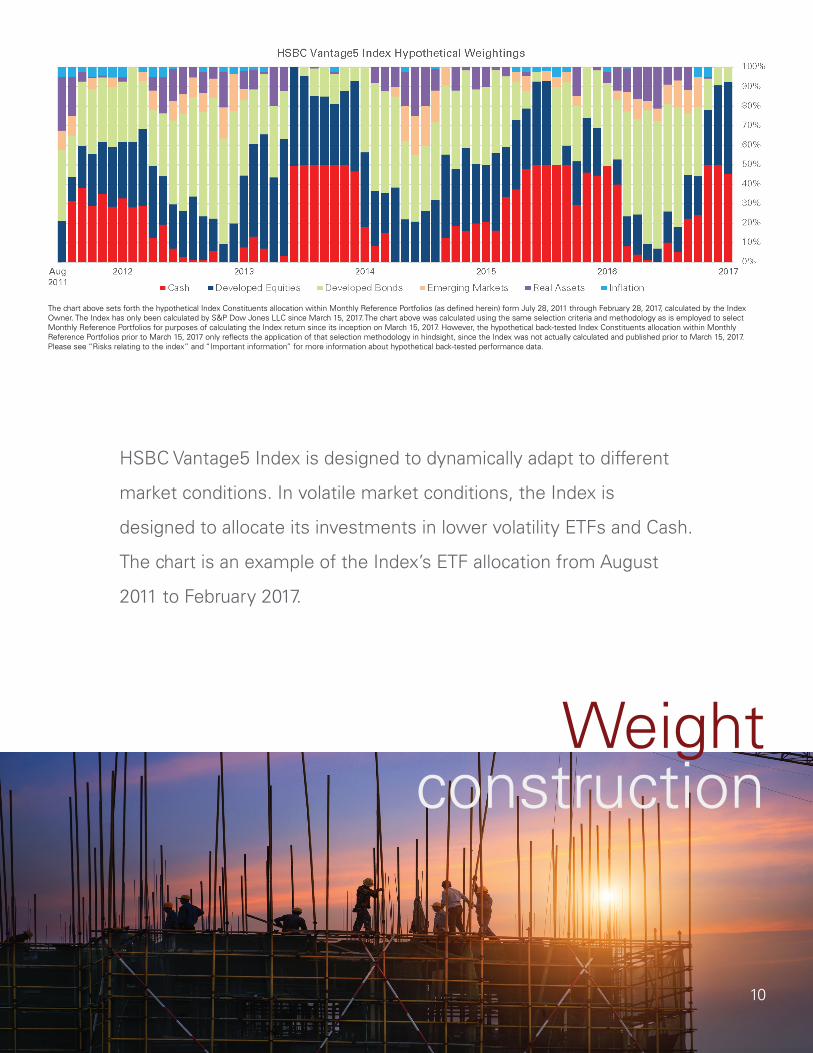
HSBC Vantage5 Index is designed to dynamically adapt to different
market conditions. In volatile market conditions, the Index is
designed to allocate its investments in lower volatility ETFs and Cash.
The chart is an example of the Index’s ETF allocation from August
2011 to February 2017.
Weight construction
10
The chart above sets forth the hypothetical Index Constituents allocation within Monthly Reference Portfolios (as defined herein) form July 28, 2011 through February 28, 2017, calculated by the Index Owner. The Index has only been calculated by S&P Dow Jones LLC since March 15, 2017. The chart above was calculated using the same selection criteria and methodology as is employed to select Monthly Reference Portfolios for purposes of calculating the Index return since its inception on March 15, 2017. However, the hypothetical back-tested Index Constituents allocation within Monthly Reference Portfolios prior to March 15, 2017 only reflects the application of that selection methodology in hindsight, since the Index was not actually calculated and published prior to March 15, 2017. Please see “Risks relating to the index” and “Important information” for more information about hypothetical back-tested performance data.
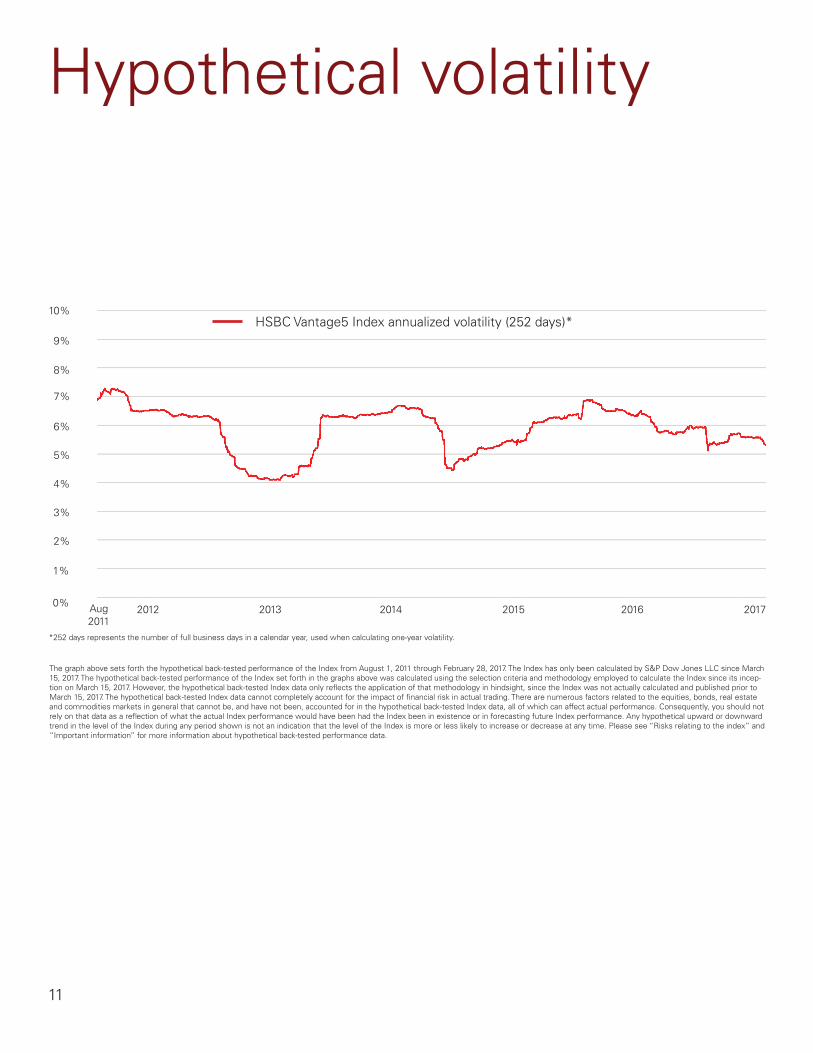
*252 days represents the number of full business days in a calendar year, used when calculating one-year volatility.
Aug 2011
2013 2015
7%
5%
4%
3%
2%
1%
11
Hypothetical volatility
The graph above sets forth the hypothetical back-tested performance of the Index from August 1, 2011 through February 28, 2017. The Index has only been calculated by S&P Dow Jones LLC since March 15, 2017. The hypothetical back-tested performance of the Index set forth in the graphs above was calculated using the selection criteria and methodology employed to calculate the Index since its incep-tion on March 15, 2017. However, the hypothetical back-tested Index data only reflects the application of that methodology in hindsight, since the Index was not actually calculated and published prior to March 15, 2017. The hypothetical back-tested Index data cannot completely account for the impact of financial risk in actual trading. There are numerous factors related to the equities, bonds, real estate and commodities markets in general that cannot be, and have not been, accounted for in the hypothetical back-tested Index data, all of which can affect actual performance. Consequently, you should not rely on that data as a reflection of what the actual Index performance would have been had the Index been in existence or in forecasting future Index performance. Any hypothetical upward or downward trend in the level of the Index during any period shown is not an indication that the level of the Index is more or less likely to increase or decrease at any time. Please see “Risks relating to the index” and “Important information” for more information about hypothetical back-tested performance data.
9%
10%
2012 2014 2016
HSBC Vantage5 Index annualized volatility (252 days)*
8%
6%
0%2017

For more information on the HSBC Vantage5 Index:
Go to: vantage5.hsbcnet.com
Call: 1-212-525-8010
Email: [email protected]
More information
12
13
Risks relating to the indexS&P, the Index Calculation Agent, may adjust the Index in a way that affects its level, and S&P has no obligation to consider your interests.
The Index is calculated by the S&P Dow Jones Indices LLC (the “Index Calculation Agent”). The Index Calculation Agent is responsible for calculating and maintaining the Index and developing the guidelines and policies governing its composition and calculation. It is entitled to exercise discretion in relation to the Index, including but not limited to the calculation of the level of the Index in the event of an Index Market Disruption Event . Although S&P, acting as the Index Calculation Agent, will make all determinations and take all action in relation to the Index acting in good faith, it should be noted that the policies and judgments for which S&P is responsible could have an impact, positive or negative, on the level of the Index. S&P may also amend the rules governing the Index in certain circumstances.
Judgments, policies and determinations concerning the Index are made by S&P, as the Index Administrator. Furthermore, the inclusion of the ETFs in the Index is not an investment recommendation by S&P of the ETFs, or any of the securities, commodities or futures contracts underlying the ETFs.
The Index comprises notional assets.
The exposures to the ETF constituents and any cash investment are purely notional and will exist solely in the records maintained by or on behalf of the Index Calculation Agent. There is no actual portfolio of assets to which any person is entitled or in which any person has any ownership interest. Consequently, you will not have any claim against any of the underlying assets that comprise the Index.
The Index may not be successful, and may not outperform any alternative strategy that might be employed in respect of the ETFs or achieve its target volatility.
The Index follows a notional rules-based proprietary strategy that operates on the basis of pre-determined rules. No assurance can be given that the investment strategy on which the Index is based will be successful or that the Index will outperform any alternative strategy that might be employed in respect of the ETFs. Furthermore, no assurance can be given that the Index will achieve its target maximum volatility of 5%. The actual realized volatility of the Index may be greater or less than 5%.
The Index has a very limited operating history and may perform in unanticipated ways.
The Index was established on March 15, 2017 and therefore has little to no operating history. Hypothetical back-tested performance data prior to the launch of the Index provided in this document refers to simulated performance data created by applying the Index’s calculation methodology to historical prices of the ETFs that comprise the Index. Such simulated performance data has been produced by the retroactive application of a back-tested methodology, and may give more preference towards ETFs or indices that have performed well in the past. The hypothetical back-tested performance of the Index prior to March 15, 2017 cannot fully reflect the actual results that would have occurred had the Index actually been calculated during that period, and should not be relied upon as an indication of the Index’s future performance.
The Index is subject to market risks.
The performance of the Index is dependent on the performance of the thirteen ETFs, as constructed in the available Monthly Reference Portfolio, over a change in ICE LIBOR USD 3 Month minus 0.85% fees, subtracted daily. As a result, any increase in the level of the Index may be offset by increases in ICE LIBOR USD 3 Month. The ETFs composing the Index may be replaced by a substitute ETF in certain extraordinary events.
Following the occurrence of certain Extraordinary Fund Events with respect to an ETF as described in the Index Methodology, under “Index Components” the affected ETF may be replaced by a substitute ETF. The changing of an ETF may affect the performance of the Index, as the replacement ETF may perform significantly better or worse than the affected ETF.
The Index may perform poorly during periods characterized by short-term volatility.
The Index’s strategy is based on momentum investing. Momentum investing strategies are effective at identifying the current market direction in trending markets. However, in non-trending, sideways markets, momentum investment strategies are subject to “whipsaws.” A whipsaw occurs when the market reverses and does the opposite of what is indicated by the trend indicator, resulting in a trading loss during the particular period. Consequently, the Index may perform poorly in non-trending, “choppy” markets characterized by short-term volatility.
Please review carefully these risk factors, and any risk factors in an offering document for any security or financial instrument referencing the Index, before making any investment.
Risks relating to the index
An investment linked to the Index carries the risks associated with the Index’s momentum investment strategy.
The Index is constructed using what is generally known as a momentum investment strategy. Momentum investing generally seeks to capitalize on positive trends in the price of assets. As such, the weights of the ETFs in the Index are based on the performance of the ETFs from the immediately preceding 3-month period and 6-month period. However, there is no guarantee that trends existing in the preceding periods will continue in the future. A momentum strategy is different from a strategy that seeks long-term exposure to a portfolio consisting of constant components with fixed weights. The Index may fail to realize gains that could occur as a result of holding assets that have experienced price declines, but after which experience a sudden price spike. As a result, if market conditions do not represent a continuation of prior observed trends, the level of the Index, which is rebalanced based on prior trends, may decline. Additionally, even when the closing prices or levels of the ETFs are trending downwards, the Index will continue to be composed of the thirteen ETFs. Due to the “long-only” construction of the Index, the weight of each ETF will not fall below zero in respect of each Monthly Rebalancing Date (as defined in the Index Methodology, under “Vantage5 Index Strategy”) even if the relevant ETF displayed a negative performance over the relevant six month period. No assurance can be given that the investment strategy used to construct the Index will outperform any alternative index that might be constructed from the ETFs.
The Index may be partially uninvested.
The strategy tracks the excess return of a notional dynamic basket of ETFs and cash over a change in the ICE LIBOR USD 3 Month interest rate. The weight of a Cash Investment (if any) for a Monthly Reference Portfolio at any given time represents the portion of the Monthly Reference Portfolio that is uninvested in the applicable ETF basket at that time. As such, any allocation to a Cash Investment within the Index, which also accrues at the ICE LIBOR USD 3 Month interest rate, will not affect the level of the Index. The Index will reflect no return for any uninvested portion (i.e., any portion represented by a Cash Investment). Accordingly, to the extent that the Index is allocated to the Cash Investment, it may not reflect the full increase of any relevant ETF component. Under certain circumstances, the Index may be 100% allocated to the Cash Investment.
Correlation of performances among the ETFs may reduce the performance of the Index.
Performances of the ETFs may become highly correlated from time to time including, but not limited to, a period in which there is a substantial decline in a particular sector or asset type represented by the ETFs and which has a higher weighting in the Index relative to any of the other sectors or asset types, as determined by the Index’s strategy. High correlation during periods of negative returns among ETFs representing any one sector or asset type and which ETFs have a substantial percentage weighting in the Index could have an adverse effect on the index.
Changes in the value of the ETFs may offset each other.
Because the Index is linked to the performance of the ETFs, which collectively represent a diverse range of asset classes and geographic regions, price movements between the ETFs representing different asset classes or geographic regions may not correlate with each other. At a time when the value of an ETF representing a particular asset class or geographic region increases, the value of other ETFs representing a different asset class or geographic region may not increase as much or may decline. Therefore, in calculating the level of the Index, increases in the value of some of the ETFs may be moderated, or more than offset, by lesser increases or declines in the level of other ETFs. Declines in the value of ETFs that have a higher percentage weighting in the Index at any time will result in a greater loss in the level of the Index.
The level of the Index will include the deduction of a change in the ICE LIBOR USD 3 Month interest rate and a fee.
One way in which the Index may differ from a typical index is that its level will include a deduction from the performance of the applicable Monthly Reference Portfolio of both a change in the ICE LIBOR USD 3 Month interest rate and a fee of 0.85% per annum. This fee will be deducted daily. As a result of the deduction of this fee, the level of the Index will trail the value of a hypothetical identically constituted synthetic portfolio from which no such fee is deducted. For example, assuming the ICE LIBOR USD 3 Month interest rate is 0.20% per year, for the Index level to increase by 1% per year, the Monthly Reference Portfolios will have to increase by approximately 2.05% per year.
14
The information contained in this document is for discussion purposes only. Any information relating to performance contained in these materials is illustrative and no assurance is given that any indicative returns, performance or results, whether historical or hypothetical, will be achieved. These terms are subject to change, and HSBC undertakes no duty to update this information. This document shall be amended, superseded and replaced in its entirety by a subsequent term sheet, disclosure supplement and/or private placement memorandum, and the documents referred to therein. In the event any inconsistency between the information presented herein and any such term sheet, disclosure supplement and/or private placement memorandum, such term sheet, disclosure supplement and/or private placement memorandum shall govern.
Investing in CDs linked to the HSBC Vantage5 Index (the “Index”) is not equivalent to a direct investment in the Index or any exchange-traded fund or index that forms a part of the Index. Investments in CDs linked to the Index require investors to assess several characteristics and risk factors that may not be present in other types of transactions. In reaching a determination as to the appropriateness of any proposed transaction, clients should undertake a thorough independent review of the legal, regulatory, credit, tax, accounting and economic consequences of such transaction in relation to their particular circumstances. This strategy guide contains market data from various sources other than us and our affiliates, and, accordingly, we make no representation or warranty as to the market data’s accuracy or completeness. All information is subject to change without notice. We or our affiliated companies may make a market or deal as principal in the CDs mentioned in this document or in options, futures or other derivatives based thereon.
HSBC has filed a registration statement (including a prospectus and prospectus supplement) with the Securities and Exchange Commission for any offering to which this free writing prospectus may relate. Before you invest, you should read the prospectus and prospectus supplement in that registration statement and other documents HSBC has filed with the SEC for more complete information about HSBC and any related offering. You may get these documents for free by visiting EDGAR on the SEC’s web site at www.sec.gov. Alternatively, HSBC Securities (USA) Inc. or any dealer participating in the related offering will arrange to send you the prospectus and prospectus supplement if you request them by calling toll-free 1-866-811-8049.
Use of Simulated ReturnsAny historical performance information included in this website represents only hypothetical historical results. You should note that the index constituents have not traded together in the manner shown in the composite hypothetical historical results included in this website. No representation is being made that the indices will achieve a performance record similar to that shown. In fact, there may often be sharp differences between hypothetical historical performance and actual performance.
Back-testing and other statistical analysis material provided to you in connection with the explanations of the potential returns associated with an investment in the Index use simulated analysis and hypothetical assumptions in order to illustrate the manner in which the Index may have performed in periods prior to the actual existence of the Index.
The hypothetical historical levels have inherent limitations. Alternative modelling techniques or assumptions may produce different hypothetical historical information that might prove to be more appropriate and that might differ significantly from the hypothetical historical information set forth [above].
The results obtained from “back-testing” information should not be considered indicative of actual results that might be obtained from an investment or participation in a financial instrument or transaction referencing the Index. You should not place undue reliance on the “back-testing” information, which is provided for illustrative purposes only. HSBC provides no assurance or guarantee that the Index will operate or would have operated in the past in a manner consistent with the results presented in these materials.
Hypothetical back-tested results are neither an indicator nor a guarantee of future returns. Actual results will vary, perhaps materially, from the analysis implied in the hypothetical historical information. You should review and consider the hypothetical historical information only with the full Index methodology.
HSBC Vantage5 Index (the “Index”) is the exclusive property of HSBC Bank plc and its affiliates, which has contracted with S&P Opco, LLC (a subsidiary of S&P Dow Jones Indices LLC) to administer, maintain and calculate the Index. The Index is not endorsed by S&P or its affiliates or its third party licensors, including Standard & Poor’s Financial Services LLC and Dow Jones Trademark Holdings LLC (collectively “S&P Dow Jones Indices”). “Calculated by S&P Custom Indices” and its related stylized mark(s) are service marks of S&P Dow Jones Indices and have been licensed for use by HSBC Bank plc and its affiliates. S&P® is a registered trademark of Standard & Poor’s Financial Services LLC and Dow Jones® is a registered trademark of Dow Jones Trademark Holdings LLC. S&P Dow Jones Indices shall have no liability for any errors or omissions in calculating the Index.15
Important information
S&P Dow Jones Indices does not make any representation or warranty, express or implied, to any member of the public regarding the advisability of the ability of the Index to track ETF performance. S&P Dow Jones Indices’ only relationship to HSBC Bank plc with respect to the Index is the licensing of certain trademarks, service marks and trade names of S&P Dow Jones Indices and for the provision of administration, calculation and maintenance services related to the Index. S&P Dow Jones Indices LLC is not an investment advisor. Inclusion of a security within the Index is not a recommendation of S&P Dow Jones Indices to buy, sell, or hold such security nor is it investment advice.
S&P DOW JONES INDICES DOES NOT GUARANTEE THE ADEQUACY, ACCURACY, TIMELINESS OR COMPLETENESS OF THE INDEX OR ANY DATA RELATED THERETO OR ANY COMMUNICATION WITH RESPECT THERETO, INCLUDING BUT NOT LIMITED TO, ORAL OR WRITTEN COMMUNICATIONS (INCLUDING ELECTRONIC COMMUNICATIONS) WITH RESPECT THERETO. S&P DOW JONES INDICES SHALL NOT BE SUBJECT TO ANY DAMAGES OR LIABILITY FOR ANY ERRORS, OMISSIONS OR DELAYS THEREIN. S&P DOW JONES INDICES MAKES NO EXPRESS OR IMPLIED WARRANTIES, AND EXPRESSLY DISCLAIMS ALL WARRANTIES OF MERCHANTABILITY OR FITNESS FOR A PARTICULAR PURPOSE OR USE OR AS TO RESULTS TO BE OBTAINED BY HSBC BANK PLC OR ANY OTHER PERSON OR ENTITY FROM THE USE OF THE INDEX OR WITH RESPECT TO ITS TRADEMARKS, THE INDEX OR ANY DATA INCLUDED THEREIN. WITHOUT LIMITING ANY OF THE FOREGOING, IN NO EVENT WHATSOEVER SHALL S&P DOW JONES INDICES BE LIABLE FOR ANY INDIRECT, SPECIAL, INCIDENTAL, PUNITIVE OR CONSEQUENTIAL DAMAGES, INCLUDING BUT NOT LIMITED TO, LOSS OF PROFITS, TRADING LOSSES, LOST TIME OR GOODWILL, EVEN IF THEY HAVE BEEN ADVISED OF THE POSSIBILITY OF SUCH DAMAGES, WHETHER IN CONTRACT, TORT, STRICT LIABILITY OR OTHERWISE.
The Index is proprietary to HSBC Bank plc. No use or publication may be made of the Index, or any of its provisions or values, without the prior written consent of HSBC Bank plc. Neither HSBC Bank plc nor its duly appointed successor, acting as index owner (the “Index Owner”), nor S&P Dow Jones Indices or its duly appointed successor, acting as index administrator (“Index Administrator”) and index calculation agent (“Index Calculation Agent”), are obliged to enter into or promote transactions or investments that are linked to the Index.
The Index Owner, the Index Administrator and the Index Calculation Agent do not assume any obligation or duty to any party and under no circumstances does the Index Owner, the Index Administrator or the Index Calculation Agent assume any relationship of agency or trust or of a fiduciary nature for or with any party. Any calculations or determinations in respect of the Index or any part thereof shall, unless otherwise specified, be made by the Index Calculation Agent, acting in good faith and in a commercially reasonable manner and shall (save in the case of manifest error) be final, conclusive and binding. The term “manifest error” as used herein shall mean an error that is plain and obvious and can be identified from the results of the calculation or determination itself without recourse to any underlying data.
The Index Owner makes no express or implied representations or warranties as to (a) the advisability of purchasing or assuming any risk in connection with any transaction or investment linked to the Index, (b) the levels at which the Index stands at any particular time on any particular date, (c) the results to be obtained by any party from the use of the Index or any data included in it for the purposes of issuing any financial instruments or carrying out any financial transaction linked to the Index or (d) any other matter. Calculations may be based on information obtained from various publicly available sources. The Index Administrator and the Index Calculation Agent have relied on these sources and have not independently verified the information extracted from these sources and accept no responsibility or liability in respect thereof.
Without prejudice to the foregoing, in no event shall the Index Owner, the Index Administrator nor the Index Calculation Agent, have any liability for any indirect, special, punitive or consequential damages (provided that any such damage is not reasonably foreseeable) even if notified of the possibility of such damages.
Important information
16

This brochure is intended to provide a general overview of HSBC Vantage5 Index and does not provide the terms of any specific issuance of structured investments. Prior to any decision to invest in a specific structured investment, investors should carefully review the disclosure documents for such issuance which contains a detailed explanation of the terms of the issuance as well as the risks, tax treatment and other relevant information.
HSBC Bank USA N.A. and HSBC USA Inc., are members of the HSBC Group. Any member of the HSBC Group may from time to time underwrite, make a market or otherwise buy and sell, as principal, structured investments, or together with their directors, officers and employers may have either long or short positions in the structured investments, or stocks, commodities or currencies to which the structured investments are linked, or may perform or seek to perform investment banking services for those linked assets mentioned herein.
HSBC operates in various jurisdictions through its affiliates, including, but not limited to, HSBC Securities (USA) Inc., member of NYSE, FINRA and SIPC.
© 2017 HSBC USA Inc. All rights reserved.
ISSUER FREE WRITING PROSPECTUSFiled Pursuant to Rule 433
Registration Statement No. 333-202524March 31, 2017