Embed Size (px)
Citation preview
2014-15 School Accountability Report Card for Hubert H. Bancroft Elementary School Page 1 of 12
Hubert H. Bancroft Elementary School
2929 Belmar Street • Sacramento, CA 95826 • 916.382.5940 • Grades K-6 Diana Curtaz, Principal
2014-15 School Accountability Report Card
Published During the 2015-16 School Year
Sacramento City Unified School District
5735 47th Avenue Sacramento, CA 95824
(916) 643-7400 www.scusd.edu
District Governing Board
Darrell Woo, President, Area 6
Christina Pritchett, 1st VP, Area 3
Jay Hansen, 2nd VP, Area 1
Ellen Cochrane, Area 2
Gustavo Arroyo, Area 4
Diana Rodriguez, Area 5
Jessie Ryan, Area 7
District Administration
José L. Banda, Superintendent Superintendent
José L. Banda Superintendent
Lisa Allen Interim Deputy Sup.
----
----
School Description Nestled in the quiet neighborhood of the College Greens and Glenbrook areas of Sacramento, Bancroft Elementary School offers classes for early kindergarten (pre-K) and kindergarten through sixth grade students. We have a large, beautiful campus with flower gardens, park areas with picnic tables, over 80 trees, and three large playground structures. Bancroft's academic program is strong. Our staff is working towards full implementation of the Common Core Standards for the English Language Arts and Math curriculums. Social studies and science are not only included in the daily lessons, but serve as a foundation for hands-on activities that add excitement and fun to the learning process (such as the annual Pioneer Day in 4th grade and other field trips and assemblies). The arts also play a major role in our overall school environment, including a well-stocked art closet to support visual art activities, a piano music lab, the annual talent show, and lesson plans that teach children about the classics. Beyond the basics, we offer opportunities for children to develop lifelong skills through a variety of additional activities and programs. This includes a full physical education program, resource and special education classes, and an exemplary library. All classrooms have computers for student use, in addition to our technology classroom with 33 computer stations.. We also have four mobile computer labs for use in the classrooms. The City of Sacramento provides their “4th R” before and after-school childcare program on our campus, in addition to the after-school START education and enrichment program. The Bancroft campus is often bustling with late afternoon activities such as volleyball, soccer, baseball, scouts, and other youth clubs and sports. We have an outstanding and dedicated staff that believes all children can and will learn if they are given the tools and environment to do so. We strive to provide our students with the knowledge, life-skills, confidence, respect and environment that will lead to their success. In addition to academic achievement, we stress the development of self-esteem, personal and social responsibility, and respect for individual uniqueness. The Bancroft community takes an active part in the success of the school. Parents and family members annually put in several thousand hours of volunteer service! In addition to assisting staff, volunteers develop and coordinate many extra-curricular activities and special programs. Parent involvement is a major component in the success and desirability of our school.
2014-15 School Accountability Report Card for Hubert H. Bancroft Elementary School Page 2 of 12
About the SARC By February 1 of each year, every school in California is required by state law to publish a School Accountability Report Card (SARC). The SARC contains information about the condition and performance of each California public school. Under the Local Control Funding Formula (LCFF) all local educational agencies (LEAs) are required to prepare a Local Control Accountability Plan (LCAP), which describes how they intend to meet annual school-specific goals for all pupils, with specific activities to address state and local priorities. Additionally, data reported in an LCAP is to be consistent with data reported in the SARC. • For more information about SARC requirements, see the California
Department of Education (CDE) SARC Web page at http://www.cde.ca.gov/ta/ac/sa/.
• For more information about the LCFF or LCAP, see the CDE LCFF Web page at http://www.cde.ca.gov/fg/aa/lc/.
• For additional information about the school, parents/guardians and community members should contact the school at 916.382.5940 or the district office.
2014-15 Student Enrollment by Grade Level
Grade Level Number of Students
Kindergarten 82
Grade 1 63
Grade 2 70
Grade 3 64
Grade 4 99
Grade 5 68
Grade 6 82
Total Enrollment 528
2014-15 Student Enrollment by Group
Group Percent of Total Enrollment
Black or African American 9.5
American Indian or Alaska Native 0.9
Asian 4.2
Filipino 1.5
Hispanic or Latino 29.2
Native Hawaiian or Pacific Islander 1.5
White 44.5
Two or More Races 8.7
Socioeconomically Disadvantaged 51.9
English Learners 8.7
Students with Disabilities 16.7
Foster Youth 0.6
A. Conditions of Learning State Priority: Basic The SARC provides the following information relevant to the Basic State Priority (Priority 1): • Degree to which teachers are appropriately assigned and fully
credentialed in the subject area and for the pupils they are teaching; • Pupils have access to standards-aligned instructional materials; and • School facilities are maintained in good repair.
Teacher Credentials
Hubert H. Bancroft Elementary School 13-14 14-15 15-16
With Full Credential 19 19 25
Without Full Credential 0 0 0
Teaching Outside Subject Area of Competence 0 0 0
Sacramento City Unified School District 13-14 14-15 15-16
With Full Credential ♦ ♦ 1826
Without Full Credential ♦ ♦ 26
Teaching Outside Subject Area of Competence ♦ ♦ 0
Teacher Misassignments and Vacant Teacher Positions at this School
Hubert H. Bancroft Elementary School
13-14 14-15 15-16
Teachers of English Learners 0 0 0
Total Teacher Misassignments 0 0 0
Vacant Teacher Positions 0 0 0
* “Misassignments” refers to the number of positions filled by teachers who lack legal authorization to teach that grade level, subject area, student group, etc. Total Teacher Misassignments includes the number of Misassignments of Teachers of English Learners.
Core Academic Classes Taught by Highly Qualified Teachers
2014-15 Percent of Classes In Core Academic Subjects Core Academic Classes Taught by Highly Qualified Teachers
Location of Classes Taught by Highly
Qualified Teachers Not Taught by Highly
Qualified Teachers
This School 100.0 0.0
Districtwide
All Schools 96.0 4.1
High-Poverty Schools 95.7 4.3
Low-Poverty Schools 100.0 0.0
* High-poverty schools are defined as those schools with student eligibility of approximately 40 percent or more in the free and reduced price meals program. Low-poverty schools are those with student eligibility of approximately 39 percent or less in the free and reduced price meals program.
2014-15 School Accountability Report Card for Hubert H. Bancroft Elementary School Page 3 of 12
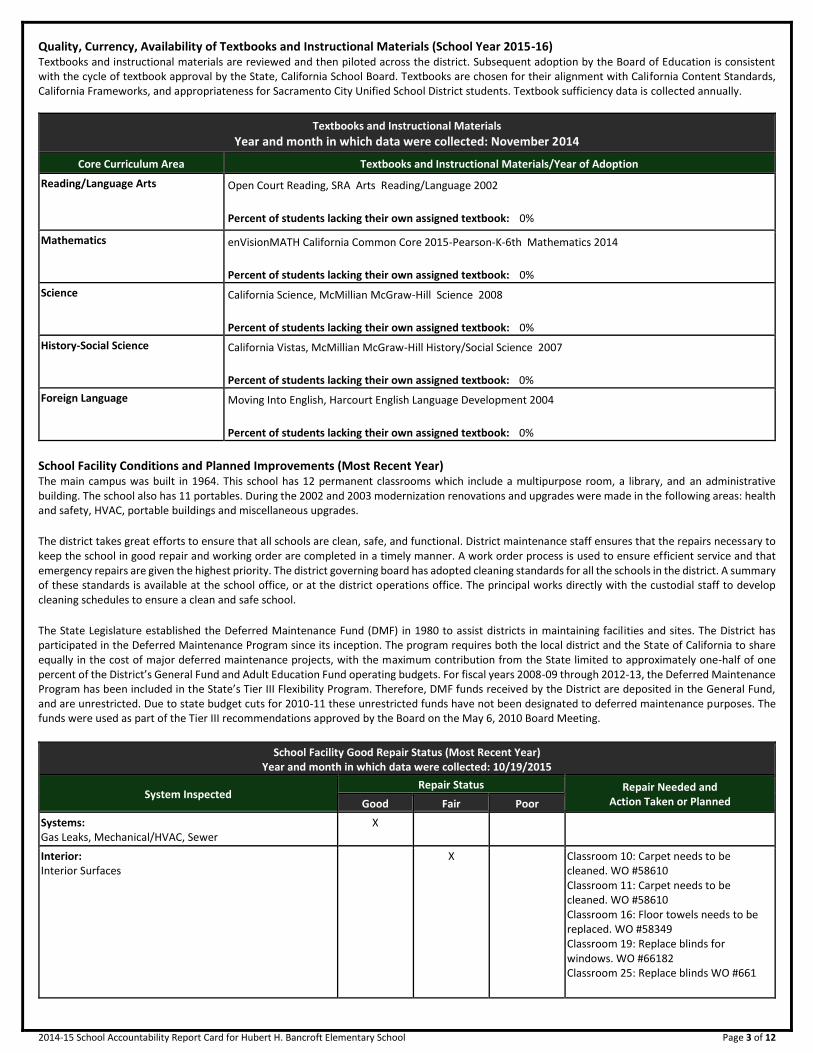
Quality, Currency, Availability of Textbooks and Instructional Materials (School Year 2015-16) Textbooks and instructional materials are reviewed and then piloted across the district. Subsequent adoption by the Board of Education is consistent with the cycle of textbook approval by the State, California School Board. Textbooks are chosen for their alignment with California Content Standards, California Frameworks, and appropriateness for Sacramento City Unified School District students. Textbook sufficiency data is collected annually.
Textbooks and Instructional Materials
Year and month in which data were collected: November 2014
Core Curriculum Area Textbooks and Instructional Materials/Year of Adoption
Reading/Language Arts Open Court Reading, SRA Arts Reading/Language 2002
Percent of students lacking their own assigned textbook: 0%
Mathematics enVisionMATH California Common Core 2015-Pearson-K-6th Mathematics 2014
Percent of students lacking their own assigned textbook: 0%
Science California Science, McMillian McGraw-Hill Science 2008
Percent of students lacking their own assigned textbook: 0%
History-Social Science California Vistas, McMillian McGraw-Hill History/Social Science 2007
Percent of students lacking their own assigned textbook: 0%
Foreign Language Moving Into English, Harcourt English Language Development 2004
Percent of students lacking their own assigned textbook: 0%
School Facility Conditions and Planned Improvements (Most Recent Year) The main campus was built in 1964. This school has 12 permanent classrooms which include a multipurpose room, a library, and an administrative building. The school also has 11 portables. During the 2002 and 2003 modernization renovations and upgrades were made in the following areas: health and safety, HVAC, portable buildings and miscellaneous upgrades. The district takes great efforts to ensure that all schools are clean, safe, and functional. District maintenance staff ensures that the repairs necessary to keep the school in good repair and working order are completed in a timely manner. A work order process is used to ensure efficient service and that emergency repairs are given the highest priority. The district governing board has adopted cleaning standards for all the schools in the district. A summary of these standards is available at the school office, or at the district operations office. The principal works directly with the custodial staff to develop cleaning schedules to ensure a clean and safe school. The State Legislature established the Deferred Maintenance Fund (DMF) in 1980 to assist districts in maintaining facilities and sites. The District has participated in the Deferred Maintenance Program since its inception. The program requires both the local district and the State of California to share equally in the cost of major deferred maintenance projects, with the maximum contribution from the State limited to approximately one-half of one percent of the District’s General Fund and Adult Education Fund operating budgets. For fiscal years 2008-09 through 2012-13, the Deferred Maintenance Program has been included in the State’s Tier III Flexibility Program. Therefore, DMF funds received by the District are deposited in the General Fund, and are unrestricted. Due to state budget cuts for 2010-11 these unrestricted funds have not been designated to deferred maintenance purposes. The funds were used as part of the Tier III recommendations approved by the Board on the May 6, 2010 Board Meeting.
School Facility Good Repair Status (Most Recent Year) Year and month in which data were collected: 10/19/2015
System Inspected Repair Status Repair Needed and
Action Taken or Planned Good Fair Poor
Systems: Gas Leaks, Mechanical/HVAC, Sewer
X
Interior: Interior Surfaces
X Classroom 10: Carpet needs to be cleaned. WO #58610 Classroom 11: Carpet needs to be cleaned. WO #58610 Classroom 16: Floor towels needs to be replaced. WO #58349 Classroom 19: Replace blinds for windows. WO #66182 Classroom 25: Replace blinds WO #661
2014-15 School Accountability Report Card for Hubert H. Bancroft Elementary School Page 4 of 12
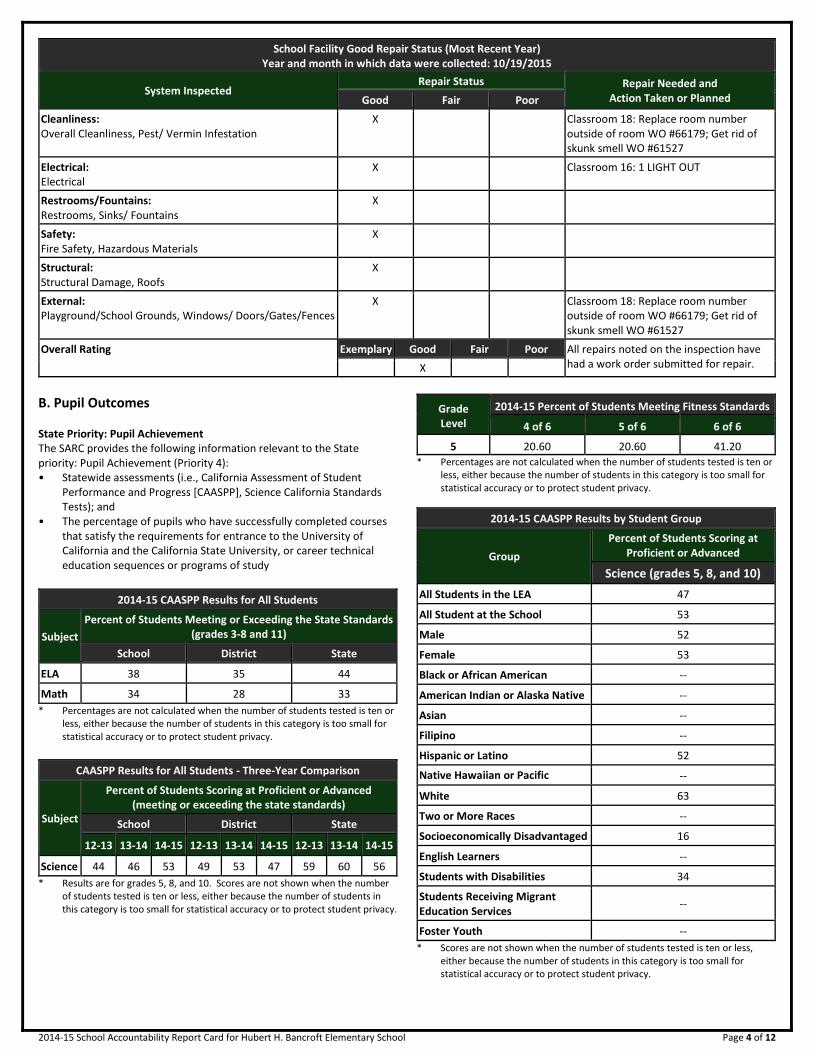
School Facility Good Repair Status (Most Recent Year) Year and month in which data were collected: 10/19/2015
System Inspected Repair Status Repair Needed and
Action Taken or Planned Good Fair Poor
Cleanliness: Overall Cleanliness, Pest/ Vermin Infestation
X Classroom 18: Replace room number outside of room WO #66179; Get rid of skunk smell WO #61527
Electrical: Electrical
X Classroom 16: 1 LIGHT OUT
Restrooms/Fountains: Restrooms, Sinks/ Fountains
X
Safety: Fire Safety, Hazardous Materials
X
Structural: Structural Damage, Roofs
X
External: Playground/School Grounds, Windows/ Doors/Gates/Fences
X Classroom 18: Replace room number outside of room WO #66179; Get rid of skunk smell WO #61527
Overall Rating Exemplary Good Fair Poor All repairs noted on the inspection have had a work order submitted for repair. ---------- X
B. Pupil Outcomes
State Priority: Pupil Achievement The SARC provides the following information relevant to the State priority: Pupil Achievement (Priority 4): • Statewide assessments (i.e., California Assessment of Student
Performance and Progress [CAASPP], Science California Standards Tests); and
• The percentage of pupils who have successfully completed courses that satisfy the requirements for entrance to the University of California and the California State University, or career technical education sequences or programs of study
2014-15 CAASPP Results for All Students
Subject
Percent of Students Meeting or Exceeding the State Standards (grades 3-8 and 11)
School District State
ELA 38 35 44
Math 34 28 33
* Percentages are not calculated when the number of students tested is ten or less, either because the number of students in this category is too small for statistical accuracy or to protect student privacy.
CAASPP Results for All Students - Three-Year Comparison
Subject
Percent of Students Scoring at Proficient or Advanced (meeting or exceeding the state standards)
School District State
12-13 13-14 14-15 12-13 13-14 14-15 12-13 13-14 14-15
Science 44 46 53 49 53 47 59 60 56
* Results are for grades 5, 8, and 10. Scores are not shown when the number of students tested is ten or less, either because the number of students in this category is too small for statistical accuracy or to protect student privacy.
Grade Level
2014-15 Percent of Students Meeting Fitness Standards
4 of 6 5 of 6 6 of 6
---5--- 20.60 20.60 41.20
* Percentages are not calculated when the number of students tested is ten or less, either because the number of students in this category is too small for statistical accuracy or to protect student privacy.
2014-15 CAASPP Results by Student Group
Group
Percent of Students Scoring at Proficient or Advanced
Science (grades 5, 8, and 10)
All Students in the LEA 47
All Student at the School 53
Male 52
Female 53
Black or African American --
American Indian or Alaska Native --
Asian --
Filipino --
Hispanic or Latino 52
Native Hawaiian or Pacific Islander
--
White 63
Two or More Races --
Socioeconomically Disadvantaged 16
English Learners --
Students with Disabilities 34
Students Receiving Migrant Education Services
--
Foster Youth --
* Scores are not shown when the number of students tested is ten or less, either because the number of students in this category is too small for statistical accuracy or to protect student privacy.
2014-15 School Accountability Report Card for Hubert H. Bancroft Elementary School Page 5 of 12
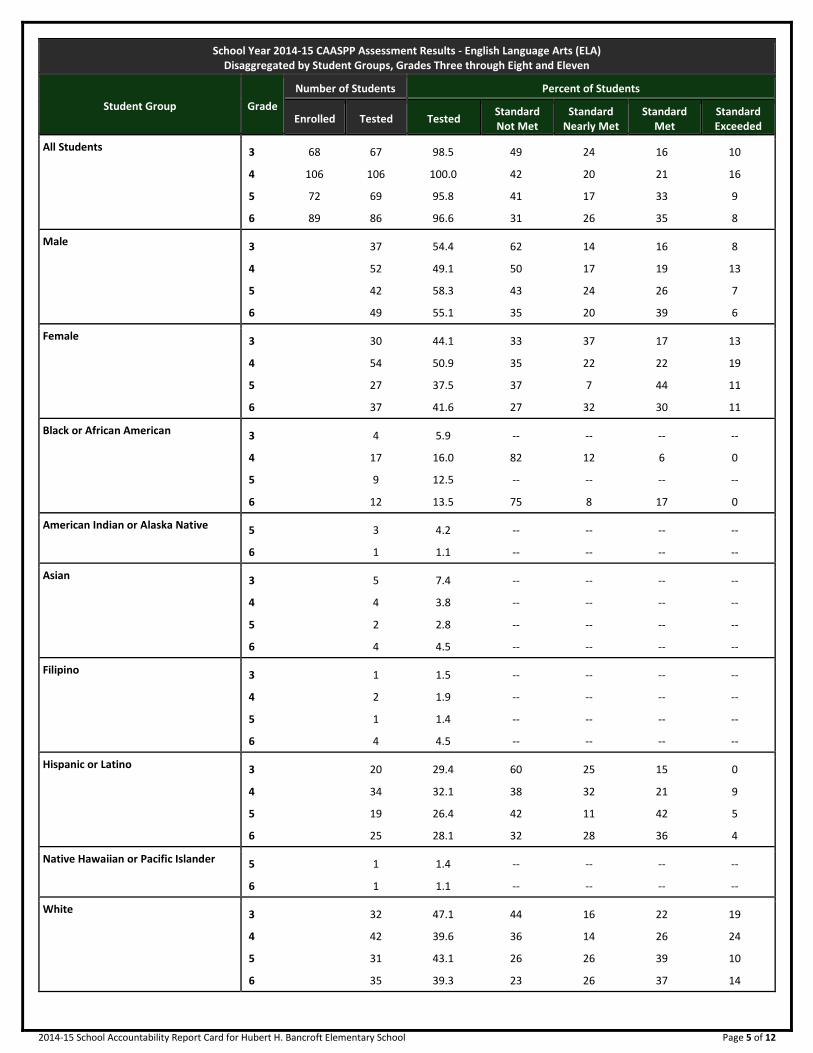
School Year 2014-15 CAASPP Assessment Results - English Language Arts (ELA) Disaggregated by Student Groups, Grades Three through Eight and Eleven
Student Group Grade
Number of Students Percent of Students
Enrolled Tested Tested Standard Not Met
Standard Nearly Met
Standard Met
Standard Exceeded
All Students 3 68 67 98.5 49 24 16 10
4 106 106 100.0 42 20 21 16
5 72 69 95.8 41 17 33 9
6 89 86 96.6 31 26 35 8
Male 3 37 54.4 62 14 16 8
4 52 49.1 50 17 19 13
5 42 58.3 43 24 26 7
6 49 55.1 35 20 39 6
Female 3 30 44.1 33 37 17 13
4 54 50.9 35 22 22 19
5 27 37.5 37 7 44 11
6 37 41.6 27 32 30 11
Black or African American 3 4 5.9 -- -- -- --
4 17 16.0 82 12 6 0
5 9 12.5 -- -- -- --
6 12 13.5 75 8 17 0
American Indian or Alaska Native 5 3 4.2 -- -- -- --
6 1 1.1 -- -- -- --
Asian 3 5 7.4 -- -- -- --
4 4 3.8 -- -- -- --
5 2 2.8 -- -- -- --
6 4 4.5 -- -- -- --
Filipino 3 1 1.5 -- -- -- --
4 2 1.9 -- -- -- --
5 1 1.4 -- -- -- --
6 4 4.5 -- -- -- --
Hispanic or Latino 3 20 29.4 60 25 15 0
4 34 32.1 38 32 21 9
5 19 26.4 42 11 42 5
6 25 28.1 32 28 36 4
Native Hawaiian or Pacific Islander 5 1 1.4 -- -- -- --
6 1 1.1 -- -- -- --
White 3 32 47.1 44 16 22 19
4 42 39.6 36 14 26 24
5 31 43.1 26 26 39 10
6 35 39.3 23 26 37 14
2014-15 School Accountability Report Card for Hubert H. Bancroft Elementary School Page 6 of 12
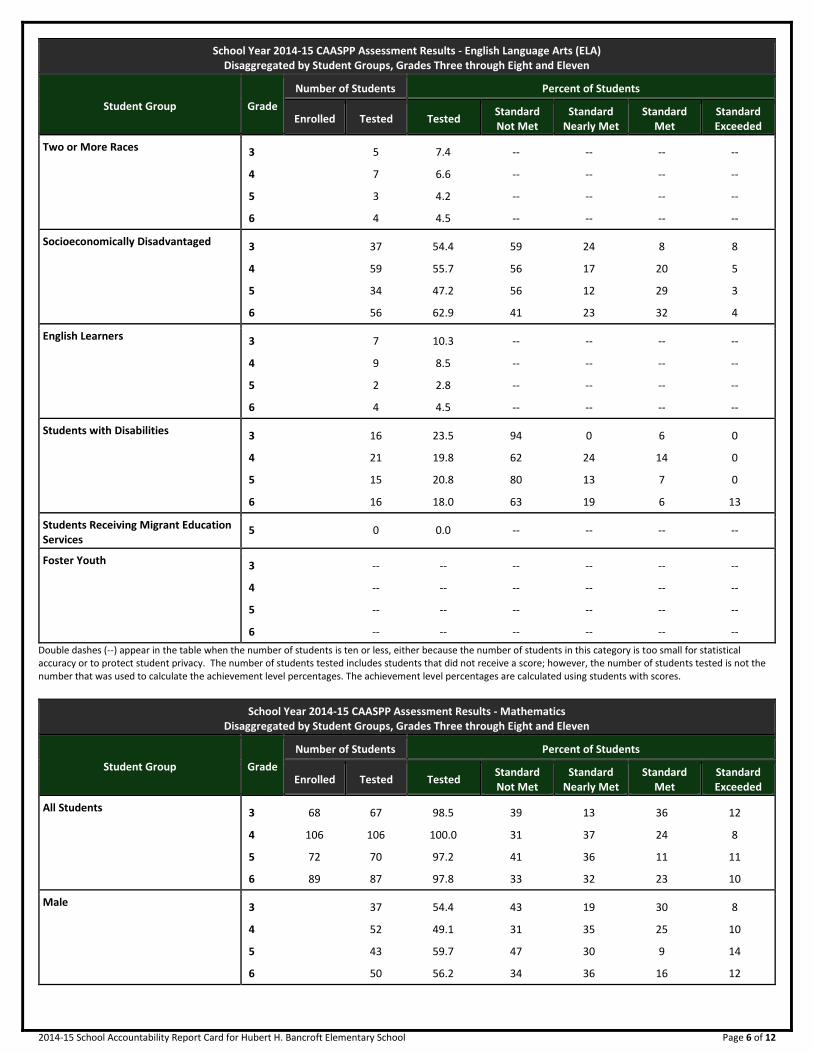
School Year 2014-15 CAASPP Assessment Results - English Language Arts (ELA) Disaggregated by Student Groups, Grades Three through Eight and Eleven
Student Group Grade
Number of Students Percent of Students
Enrolled Tested Tested Standard Not Met
Standard Nearly Met
Standard Met
Standard Exceeded
Two or More Races 3 5 7.4 -- -- -- --
4 7 6.6 -- -- -- --
5 3 4.2 -- -- -- --
6 4 4.5 -- -- -- --
Socioeconomically Disadvantaged 3 37 54.4 59 24 8 8
4 59 55.7 56 17 20 5
5 34 47.2 56 12 29 3
6 56 62.9 41 23 32 4
English Learners 3 7 10.3 -- -- -- --
4 9 8.5 -- -- -- --
5 2 2.8 -- -- -- --
6 4 4.5 -- -- -- --
Students with Disabilities 3 16 23.5 94 0 6 0
4 21 19.8 62 24 14 0
5 15 20.8 80 13 7 0
6 16 18.0 63 19 6 13
Students Receiving Migrant Education Services
5 0 0.0 -- -- -- --
Foster Youth 3 -- -- -- -- -- --
4 -- -- -- -- -- --
5 -- -- -- -- -- --
6 -- -- -- -- -- --
Double dashes (--) appear in the table when the number of students is ten or less, either because the number of students in this category is too small for statistical accuracy or to protect student privacy. The number of students tested includes students that did not receive a score; however, the number of students tested is not the number that was used to calculate the achievement level percentages. The achievement level percentages are calculated using students with scores.
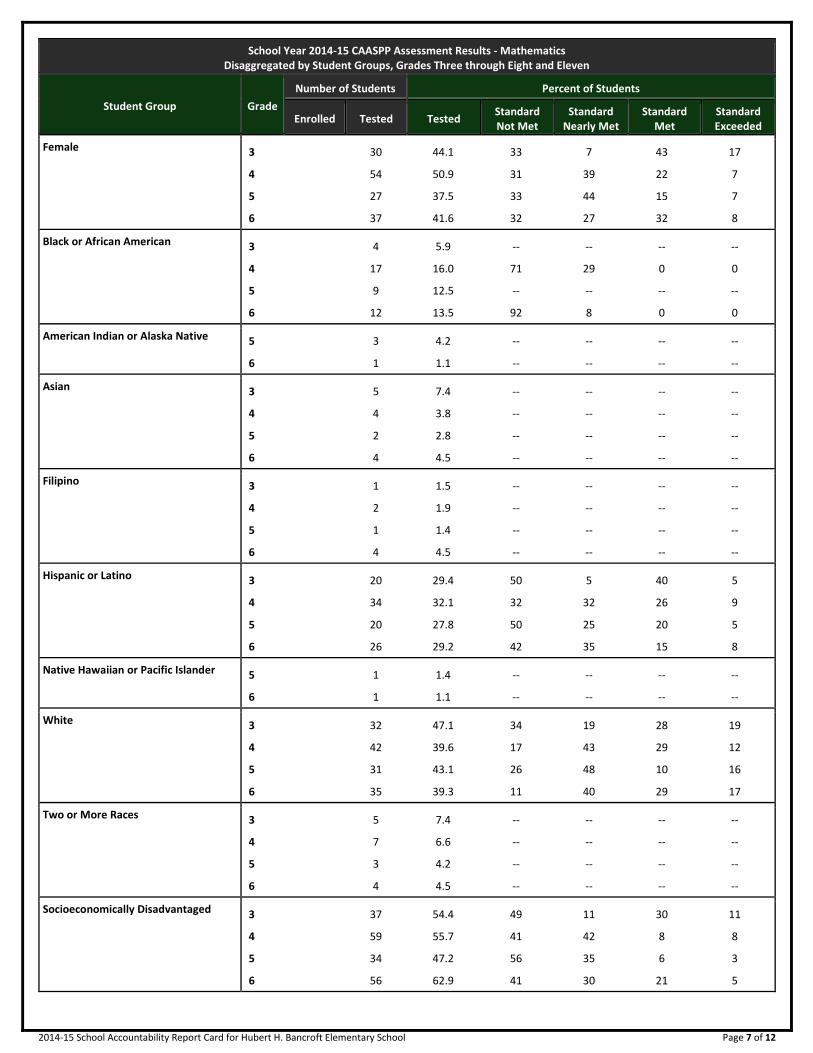
School Year 2014-15 CAASPP Assessment Results - Mathematics Disaggregated by Student Groups, Grades Three through Eight and Eleven
Student Group Grade
Number of Students Percent of Students
Enrolled Tested Tested Standard Not Met
Standard Nearly Met
Standard Met
Standard Exceeded
All Students 3 68 67 98.5 39 13 36 12
4 106 106 100.0 31 37 24 8
5 72 70 97.2 41 36 11 11
6 89 87 97.8 33 32 23 10
Male 3 37 54.4 43 19 30 8
4 52 49.1 31 35 25 10
5 43 59.7 47 30 9 14
6 50 56.2 34 36 16 12
2014-15 School Accountability Report Card for Hubert H. Bancroft Elementary School Page 7 of 12
School Year 2014-15 CAASPP Assessment Results - Mathematics Disaggregated by Student Groups, Grades Three through Eight and Eleven
Student Group Grade
Number of Students Percent of Students
Enrolled Tested Tested Standard Not Met
Standard Nearly Met
Standard Met
Standard Exceeded
Female 3 30 44.1 33 7 43 17
4 54 50.9 31 39 22 7
5 27 37.5 33 44 15 7
6 37 41.6 32 27 32 8
Black or African American 3 4 5.9 -- -- -- --
4 17 16.0 71 29 0 0
5 9 12.5 -- -- -- --
6 12 13.5 92 8 0 0
American Indian or Alaska Native 5 3 4.2 -- -- -- --
6 1 1.1 -- -- -- --
Asian 3 5 7.4 -- -- -- --
4 4 3.8 -- -- -- --
5 2 2.8 -- -- -- --
6 4 4.5 -- -- -- --
Filipino 3 1 1.5 -- -- -- --
4 2 1.9 -- -- -- --
5 1 1.4 -- -- -- --
6 4 4.5 -- -- -- --
Hispanic or Latino 3 20 29.4 50 5 40 5
4 34 32.1 32 32 26 9
5 20 27.8 50 25 20 5
6 26 29.2 42 35 15 8
Native Hawaiian or Pacific Islander 5 1 1.4 -- -- -- --
6 1 1.1 -- -- -- --
White 3 32 47.1 34 19 28 19
4 42 39.6 17 43 29 12
5 31 43.1 26 48 10 16
6 35 39.3 11 40 29 17
Two or More Races 3 5 7.4 -- -- -- --
4 7 6.6 -- -- -- --
5 3 4.2 -- -- -- --
6 4 4.5 -- -- -- --
Socioeconomically Disadvantaged 3 37 54.4 49 11 30 11
4 59 55.7 41 42 8 8
5 34 47.2 56 35 6 3
6 56 62.9 41 30 21 5
2014-15 School Accountability Report Card for Hubert H. Bancroft Elementary School Page 8 of 12
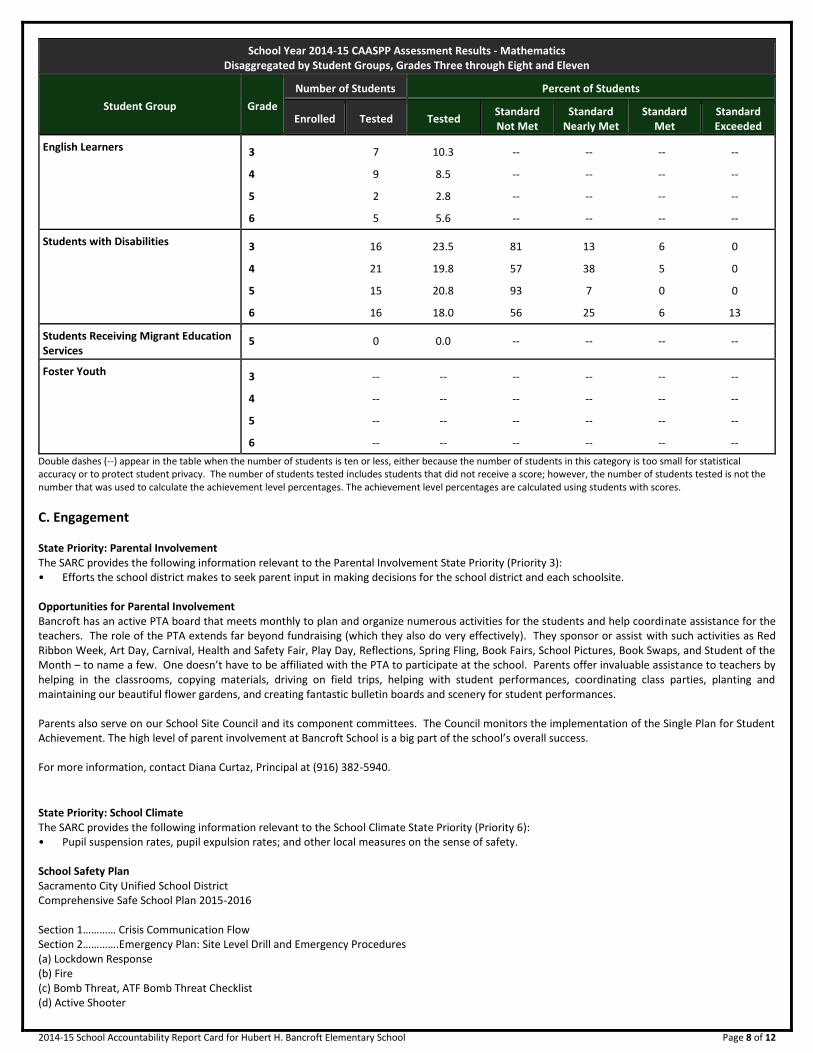
School Year 2014-15 CAASPP Assessment Results - Mathematics Disaggregated by Student Groups, Grades Three through Eight and Eleven
Student Group Grade
Number of Students Percent of Students
Enrolled Tested Tested Standard Not Met
Standard Nearly Met
Standard Met
Standard Exceeded
English Learners 3 7 10.3 -- -- -- --
4 9 8.5 -- -- -- --
5 2 2.8 -- -- -- --
6 5 5.6 -- -- -- --
Students with Disabilities 3 16 23.5 81 13 6 0
4 21 19.8 57 38 5 0
5 15 20.8 93 7 0 0
6 16 18.0 56 25 6 13
Students Receiving Migrant Education Services
5 0 0.0 -- -- -- --
Foster Youth 3 -- -- -- -- -- --
4 -- -- -- -- -- --
5 -- -- -- -- -- --
6 -- -- -- -- -- --
Double dashes (--) appear in the table when the number of students is ten or less, either because the number of students in this category is too small for statistical accuracy or to protect student privacy. The number of students tested includes students that did not receive a score; however, the number of students tested is not the number that was used to calculate the achievement level percentages. The achievement level percentages are calculated using students with scores.
C. Engagement
State Priority: Parental Involvement The SARC provides the following information relevant to the Parental Involvement State Priority (Priority 3): • Efforts the school district makes to seek parent input in making decisions for the school district and each schoolsite. Opportunities for Parental Involvement Bancroft has an active PTA board that meets monthly to plan and organize numerous activities for the students and help coordinate assistance for the teachers. The role of the PTA extends far beyond fundraising (which they also do very effectively). They sponsor or assist with such activities as Red Ribbon Week, Art Day, Carnival, Health and Safety Fair, Play Day, Reflections, Spring Fling, Book Fairs, School Pictures, Book Swaps, and Student of the Month – to name a few. One doesn’t have to be affiliated with the PTA to participate at the school. Parents offer invaluable assistance to teachers by helping in the classrooms, copying materials, driving on field trips, helping with student performances, coordinating class parties, planting and maintaining our beautiful flower gardens, and creating fantastic bulletin boards and scenery for student performances. Parents also serve on our School Site Council and its component committees. The Council monitors the implementation of the Single Plan for Student Achievement. The high level of parent involvement at Bancroft School is a big part of the school’s overall success. For more information, contact Diana Curtaz, Principal at (916) 382-5940.
State Priority: School Climate The SARC provides the following information relevant to the School Climate State Priority (Priority 6): • Pupil suspension rates, pupil expulsion rates; and other local measures on the sense of safety. School Safety Plan Sacramento City Unified School District Comprehensive Safe School Plan 2015-2016 Section 1………… Crisis Communication Flow Section 2………….Emergency Plan: Site Level Drill and Emergency Procedures (a) Lockdown Response (b) Fire (c) Bomb Threat, ATF Bomb Threat Checklist (d) Active Shooter
2014-15 School Accountability Report Card for Hubert H. Bancroft Elementary School Page 9 of 12
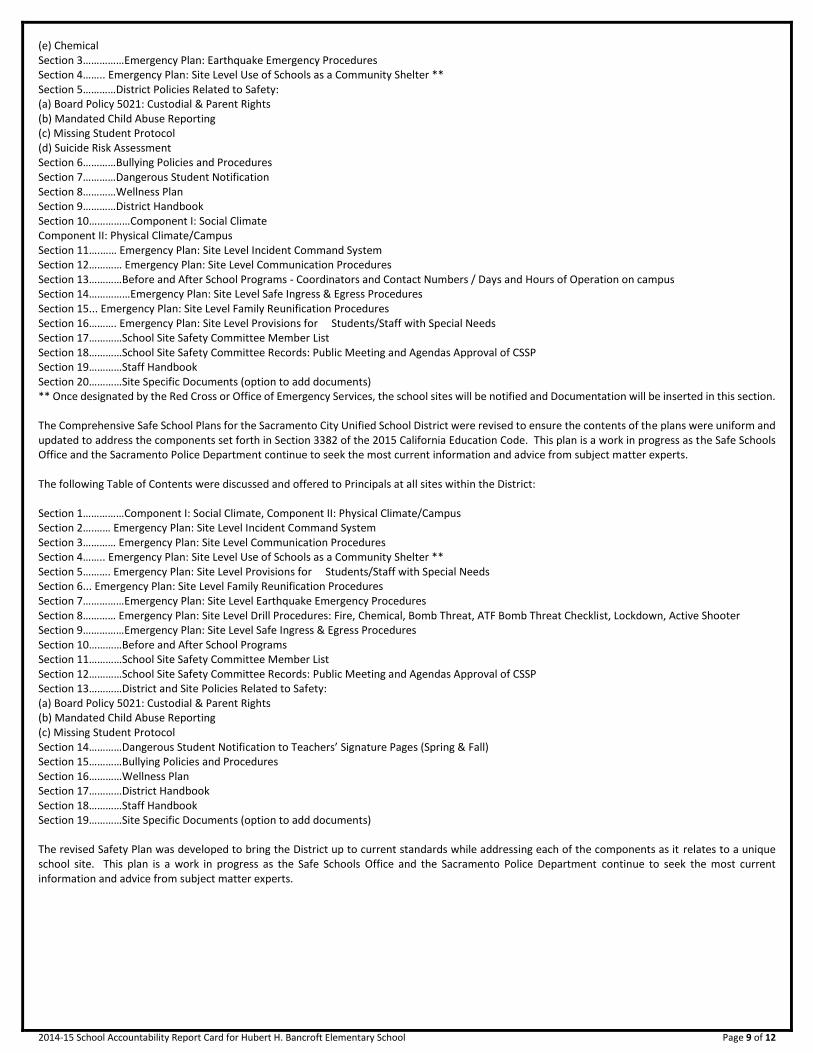
(e) Chemical Section 3……………Emergency Plan: Earthquake Emergency Procedures Section 4…….. Emergency Plan: Site Level Use of Schools as a Community Shelter ** Section 5…………District Policies Related to Safety: (a) Board Policy 5021: Custodial & Parent Rights (b) Mandated Child Abuse Reporting (c) Missing Student Protocol (d) Suicide Risk Assessment Section 6…………Bullying Policies and Procedures Section 7…………Dangerous Student Notification Section 8…………Wellness Plan Section 9…………District Handbook Section 10……………Component I: Social Climate Component II: Physical Climate/Campus Section 11….…… Emergency Plan: Site Level Incident Command System Section 12………… Emergency Plan: Site Level Communication Procedures Section 13…………Before and After School Programs - Coordinators and Contact Numbers / Days and Hours of Operation on campus Section 14……………Emergency Plan: Site Level Safe Ingress & Egress Procedures Section 15... Emergency Plan: Site Level Family Reunification Procedures Section 16………. Emergency Plan: Site Level Provisions for Students/Staff with Special Needs Section 17…………School Site Safety Committee Member List Section 18…………School Site Safety Committee Records: Public Meeting and Agendas Approval of CSSP Section 19…………Staff Handbook Section 20…………Site Specific Documents (option to add documents) ** Once designated by the Red Cross or Office of Emergency Services, the school sites will be notified and Documentation will be inserted in this section. The Comprehensive Safe School Plans for the Sacramento City Unified School District were revised to ensure the contents of the plans were uniform and updated to address the components set forth in Section 3382 of the 2015 California Education Code. This plan is a work in progress as the Safe Schools Office and the Sacramento Police Department continue to seek the most current information and advice from subject matter experts. The following Table of Contents were discussed and offered to Principals at all sites within the District: Section 1……………Component I: Social Climate, Component II: Physical Climate/Campus Section 2….…… Emergency Plan: Site Level Incident Command System Section 3………… Emergency Plan: Site Level Communication Procedures Section 4…….. Emergency Plan: Site Level Use of Schools as a Community Shelter ** Section 5………. Emergency Plan: Site Level Provisions for Students/Staff with Special Needs Section 6... Emergency Plan: Site Level Family Reunification Procedures Section 7……………Emergency Plan: Site Level Earthquake Emergency Procedures Section 8………… Emergency Plan: Site Level Drill Procedures: Fire, Chemical, Bomb Threat, ATF Bomb Threat Checklist, Lockdown, Active Shooter Section 9……………Emergency Plan: Site Level Safe Ingress & Egress Procedures Section 10…………Before and After School Programs Section 11…………School Site Safety Committee Member List Section 12…………School Site Safety Committee Records: Public Meeting and Agendas Approval of CSSP Section 13…………District and Site Policies Related to Safety: (a) Board Policy 5021: Custodial & Parent Rights (b) Mandated Child Abuse Reporting (c) Missing Student Protocol Section 14…………Dangerous Student Notification to Teachers’ Signature Pages (Spring & Fall) Section 15…………Bullying Policies and Procedures Section 16…………Wellness Plan Section 17…………District Handbook Section 18…………Staff Handbook Section 19…………Site Specific Documents (option to add documents) The revised Safety Plan was developed to bring the District up to current standards while addressing each of the components as it relates to a unique school site. This plan is a work in progress as the Safe Schools Office and the Sacramento Police Department continue to seek the most current information and advice from subject matter experts.
2014-15 School Accountability Report Card for Hubert H. Bancroft Elementary School Page 10 of 12
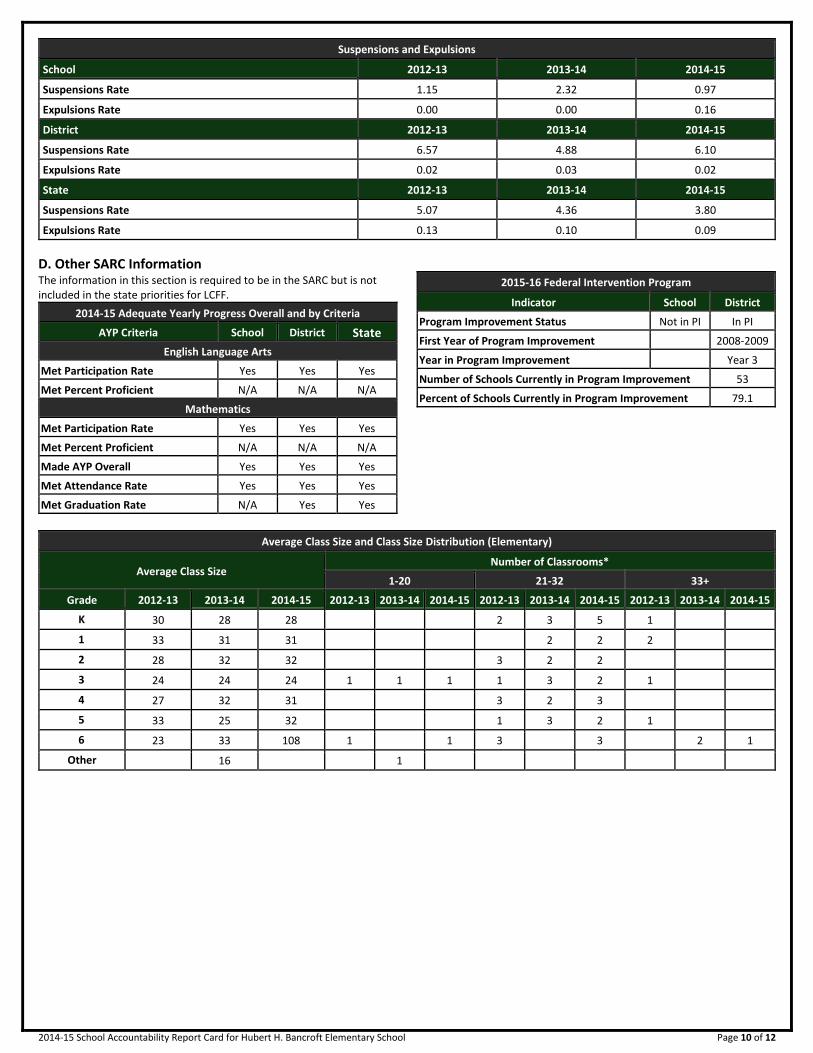
Suspensions and Expulsions
School 2012-13 2013-14 2014-15
Suspensions Rate 1.15 2.32 0.97
Expulsions Rate 0.00 0.00 0.16
District 2012-13 2013-14 2014-15
Suspensions Rate 6.57 4.88 6.10
Expulsions Rate 0.02 0.03 0.02
State 2012-13 2013-14 2014-15
Suspensions Rate 5.07 4.36 3.80
Expulsions Rate 0.13 0.10 0.09
D. Other SARC Information
The information in this section is required to be in the SARC but is not included in the state priorities for LCFF.
2014-15 Adequate Yearly Progress Overall and by Criteria
AYP Criteria School District State
English Language Arts
Met Participation Rate Yes Yes Yes
Met Percent Proficient N/A N/A N/A
Mathematics
Met Participation Rate Yes Yes Yes
Met Percent Proficient N/A N/A N/A
Made AYP Overall Yes Yes Yes
Met Attendance Rate Yes Yes Yes
Met Graduation Rate N/A Yes Yes
2015-16 Federal Intervention Program
Indicator School District
Program Improvement Status Not in PI In PI
First Year of Program Improvement 2008-2009
Year in Program Improvement Year 3
Number of Schools Currently in Program Improvement 53
Percent of Schools Currently in Program Improvement 79.1
Average Class Size and Class Size Distribution (Elementary)
Average Class Size Number of Classrooms*
1-20 21-32 33+
Grade 2012-13 2013-14 2014-15 2012-13 2013-14 2014-15 2012-13 2013-14 2014-15 2012-13 2013-14 2014-15
K
30 28 28 2 3 5 1
1
33 31 31 2 2 2
2
28 32 32 3 2 2
3
24 24 24 1 1 1 1 3 2 1
4
27 32 31 3 2 3
5
33 25 32 1 3 2 1
6
23 33 108 1 1 3 3 2 1
Other
16 1
2014-15 School Accountability Report Card for Hubert H. Bancroft Elementary School Page 11 of 12
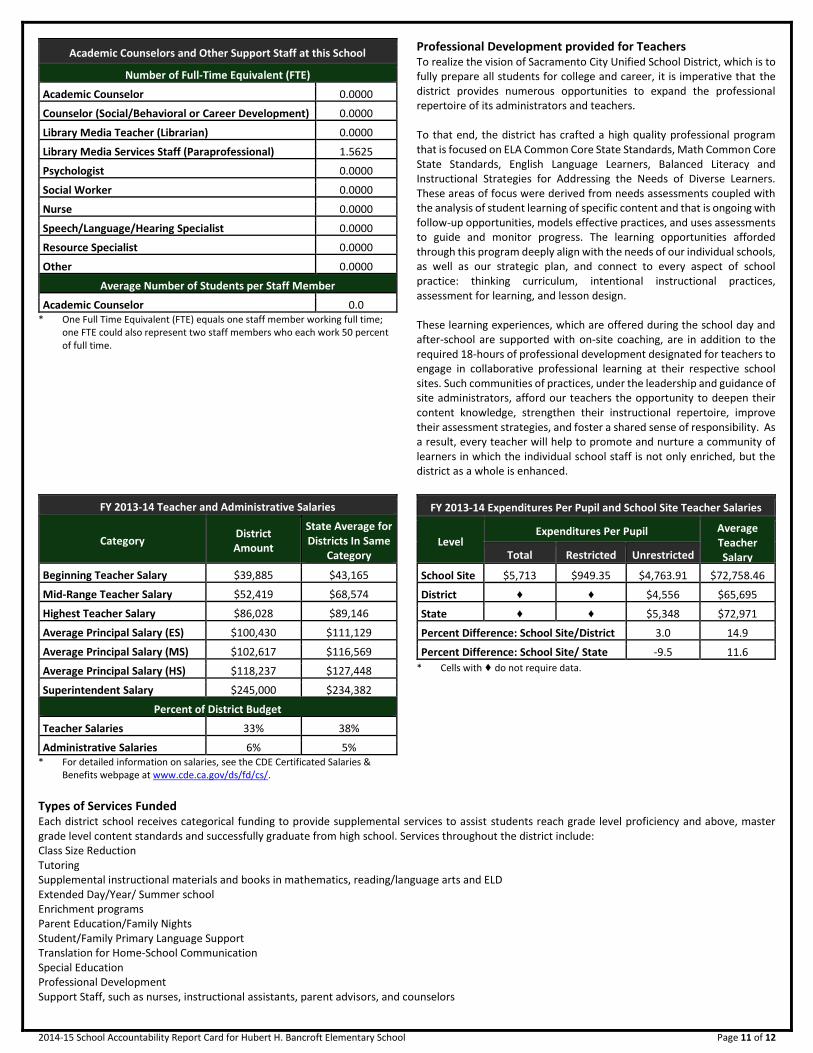
Academic Counselors and Other Support Staff at this School
Number of Full-Time Equivalent (FTE)
Academic Counselor------- 0.0000
Counselor (Social/Behavioral or Career Development) 0.0000
Library Media Teacher (Librarian) 0.0000
Library Media Services Staff (Paraprofessional) 1.5625
Psychologist------- 0.0000
Social Worker------- 0.0000
Nurse------- 0.0000
Speech/Language/Hearing Specialist 0.0000
Resource Specialist------- 0.0000
Other------- 0.0000
Average Number of Students per Staff Member
Academic Counselor------- 0.0 * One Full Time Equivalent (FTE) equals one staff member working full time;
one FTE could also represent two staff members who each work 50 percent of full time.
Professional Development provided for Teachers To realize the vision of Sacramento City Unified School District, which is to fully prepare all students for college and career, it is imperative that the district provides numerous opportunities to expand the professional repertoire of its administrators and teachers. To that end, the district has crafted a high quality professional program that is focused on ELA Common Core State Standards, Math Common Core State Standards, English Language Learners, Balanced Literacy and Instructional Strategies for Addressing the Needs of Diverse Learners. These areas of focus were derived from needs assessments coupled with the analysis of student learning of specific content and that is ongoing with follow-up opportunities, models effective practices, and uses assessments to guide and monitor progress. The learning opportunities afforded through this program deeply align with the needs of our individual schools, as well as our strategic plan, and connect to every aspect of school practice: thinking curriculum, intentional instructional practices, assessment for learning, and lesson design. These learning experiences, which are offered during the school day and after-school are supported with on-site coaching, are in addition to the required 18-hours of professional development designated for teachers to engage in collaborative professional learning at their respective school sites. Such communities of practices, under the leadership and guidance of site administrators, afford our teachers the opportunity to deepen their content knowledge, strengthen their instructional repertoire, improve their assessment strategies, and foster a shared sense of responsibility. As a result, every teacher will help to promote and nurture a community of learners in which the individual school staff is not only enriched, but the district as a whole is enhanced.
FY 2013-14 Teacher and Administrative Salaries
Category District Amount
State Average for Districts In Same
Category
Beginning Teacher Salary $39,885 $43,165
Mid-Range Teacher Salary $52,419 $68,574
Highest Teacher Salary $86,028 $89,146
Average Principal Salary (ES) $100,430 $111,129
Average Principal Salary (MS) $102,617 $116,569
Average Principal Salary (HS) $118,237 $127,448
Superintendent Salary $245,000 $234,382
Percent of District Budget
Teacher Salaries 33% 38%
Administrative Salaries 6% 5% * For detailed information on salaries, see the CDE Certificated Salaries &
Benefits webpage at www.cde.ca.gov/ds/fd/cs/.
FY 2013-14 Expenditures Per Pupil and School Site Teacher Salaries
Level Expenditures Per Pupil Average
Teacher Salary Total Restricted Unrestricted
School Site-------
$5,713 $949.35 $4,763.91 $72,758.46
District-------
♦ ♦ $4,556 $65,695
State------- ♦ ♦ $5,348 $72,971
Percent Difference: School Site/District 3.0 14.9
Percent Difference: School Site/ State -9.5 11.6
* Cells with ♦ do not require data.
Types of Services Funded
Each district school receives categorical funding to provide supplemental services to assist students reach grade level proficiency and above, master grade level content standards and successfully graduate from high school. Services throughout the district include: Class Size Reduction Tutoring Supplemental instructional materials and books in mathematics, reading/language arts and ELD Extended Day/Year/ Summer school Enrichment programs Parent Education/Family Nights Student/Family Primary Language Support Translation for Home-School Communication Special Education Professional Development Support Staff, such as nurses, instructional assistants, parent advisors, and counselors
2014-15 School Accountability Report Card for Hubert H. Bancroft Elementary School Page 12 of 12
Supplemental Education Services School Choice Please check with your child’s principal to receive information regarding the services that are specific to your child’s school.
DataQuest DataQuest is an online data tool located on the CDE DataQuest Web page at http://dq.cde.ca.gov/dataquest/ that contains additional information about this school and comparisons of the school to the district, the county, and the state. Specifically, DataQuest is a dynamic system that provides reports for accountability (e.g., test data, enrollment, high school graduates, dropouts, course enrollments, staffing, and data regarding English learners.
Internet Access Internet access is available at public libraries and other locations that are publicly accessible (e.g., the California State Library). Access to the Internet at libraries and public locations is generally provided on a first-come, first-served basis. Other use restrictions may include the hours of operation, the length of time that a workstation may be used (depending on availability), the types of software programs available on a workstation, and the ability to print documents.
![Curriculum Map - scusd-mathscusd-math.wikispaces.com/file/view/Grade 1 CM... · Web viewSCUSD Curriculum MapGrade [Enter Grade] Mathematics. SCUSD Curriculum Map-Lasted Updated](https://img.pdfslide.net/doc/110x75/5a725c0f7f8b9a98538d7ceb/curriculum-map-scusd-mathscusd-mathwikispacescomfileviewgrade-1-cmdoc.jpg)