Embed Size (px)
Citation preview
J Intell Inf SystDOI 10.1007/s10844-013-0266-3
Human perspective to anomaly detectionfor cybersecurity
Song Chen · Vandana P. Janeja
Received: 4 February 2013 / Revised: 27 June 2013 / Accepted: 8 July 2013© Springer Science+Business Media New York 2013
Abstract Traditionally signature-based network Intrusion Detection Systems (IDS)rely on inputs from domain experts and can only identify the attacks if they occur asindividual event. IDS generate large number of alerts and it becomes very difficult forhuman users to go through each message. Previous researches have proposed analyt-ics based approaches to analyze IDS alert patterns based on anomaly detection mod-els, multi-steps models or probabilistic approaches. However, due to the complexitiesof network intrusions, it is impossible to develop all possible attack patterns or toavoid false positives. With the advance in technologies and popularity of networksin our daily life, it is becoming more and more difficult to detect network intrusions.However, no matter how rapid the technologies change, the human behaviors behindthe cyber attacks stay relatively constant. This provides us an opportunity to developan improved system to detect the unusual cyber attacks. In this paper, we developedfour network intrusion models based on consideration of human factors. We thentested these models on ITOC Cyber Defense Competition (CDX) 2009 data. Our re-sults are encouraging. These Models are not only able to recognize most network at-tacks identified by SNORT log alerts, they are also able to distinguish the non-attacknetwork traffic that was potentially missed by SNORT as indicated by ground truthvalidation of the data.
Keywords Cybersecurity · Human factors · Data mining · Pattern discovery
S. Chen · V. P. Janeja (B)University of Maryland, Baltimore County, MD, USAe-mail: [email protected]
S. Chene-mail: [email protected]
J Intell Inf Syst
1 Introduction
Any type of a computer network attack has common underpinnings of how it iscarried out, this has not changed from physical security breaches to computer securitybreaches. the question we want to address in this paper is—Can this knowledge beleveraged to identify behavioral models of anomalies where we can see patterns ofmisuse? This requires shifting gears to view cybersecurity as a people problem ratherthan a hardened defense problem.
With the explosion of computer networks in the past decade, technologies haveevolved such that networks are now connected to every corner of ordinary peo-ple’s life. As computing systems become ubiquitous and interconnected, they areincreasingly subject to attacks, misuse and abuse. With the advance of the computertechnologies, another type of social problem appears, Network Intrusions. In today’sinternet, there is increasing availability of tools and tricks that could be used forattacking and intruding proprietary networks. The network intrusions are moreprevalent and are increasingly becoming more important making it a really sensitivetopic at every level from government to local business and to personal lives. Effectivetools and detection methods are in great demand to protect networks and computers.Many network Intrusion Detection Systems (IDS) have been developed and avail-able to use (Rehman 2003). In general, there are two types of IDS, misuse detectionsystem and anomaly detection system (Ning et al. 2004). Most commercial systemsadapt misuse strategies which, detect the known types of intrusions. These also arecalled signature based intrusions.
SNORT (Roesch and Green 2003) is one such well known signature-based detec-tion system and has been widely used. It is a free and open source network intrusionprevention system (NIPS) and network intrusion detection system (NIDS) createdby Martin Roesch in 1998 (Snort 2013). SNORT’s open source network-basedintrusion detection system (NIDS) has the ability to perform real-time traffic analysisand packet logging on Internet Protocol (IP) networks. It has an extensive rulesdatabase that can be used to protect a network system. SNORT has several detectionmodes. The Intrusion detection mode can generate a detection log, which gives thealert information based on its rules database (Roesch and Green 2003). In this paper,we will analyze the SNORT alert information with attack detection models to detectthe attacks and hence predict the new attacks or find the vulnerabilities in networks.
Our motivation for this work is derived from the need for anomaly detection basedmodels which can identify unusual and unknown attacks. Traditionally, signature-based or rule-based IDS relies on the experts to develop the rules and code intothe system. Many intrusion detection systems have been proposed and implementedsince the first work by Denning (1987). These systems can be generally grouped intotwo categories: misuse or signature-based detection and anomaly-based detection. Insignature-based detection, signature patterns of known attacks are stored and usedto detect attacks having similar signatures. The main disadvantage is that it cannotdetect novel attacks with unknown signatures.
Anomaly detection consists of analyzing historic data and detecting anomalies thatdeviate from normal conditions. The advantage is that it can detect the unknownattacks. The disadvantage is that there is a potential of false alarms due to unpre-dictable behavior of network users. There are many anomaly detection systems usingdata mining techniques. But these skills are hardly keeping up with the ever changing
J Intell Inf Syst
technologies and new types of attacks. However, if we consider the human factors inanomaly detection, it provides an opportunity for us to improve the existing modelsand yield better results.
Traditional intrusion detection systems focus on low-level attacks, and raise alertsindependently. With the large amount of alerts each day. This requires a tremendousamount of work from human users making it almost impossible to research each alertmessage.
Researchers are turning their focus on analyzing the alert logs with data miningtechniques and social network algorithms (Anwar et al. 2011; Cuppens and Miège2002; Denning 1987; Kim and Hong 2011; Liu et al. 2008; Ning et al. 2004; Youssefand Emam 2011). In these papers, the authors have proposed different intrusiondetection systems and discover the underlying patterns that could not be visible byonly observing the system messages.
In this paper, we will build four models with consideration of human factors andtest them on SNORT log data. We will analyze SNORT alert message and matchthem to the built-in models in attempts to discover the unseen patterns. SNORTis one of the most popular IDS system in the world. According to the websitewww.snort.org, more than 400,000 registered users worldwide are using SNORT toprotect their systems. SNORT is the de facto industry standard and has a rich and ma-ture system technology. In previous research, SNORT log data was not used to testvarious anomaly detection models. It will be a good start for us to analyze SNORTlogs to demonstrate the effectiveness of this approach. There are some existing soft-ware tools to analyze SNORT log information (Orebaugh et al. 2005), however, theseexisting tools are only visualization tools and do not incorporate any data miningalgorithms.
Potentially with analyzing the IDS alert messages, we can discover the attackbehaviors and relationships so that we can potentially identify system vulnerabilities.These uncovered patterns can also be used to develop new system rules and beapplied in the signature database.
In the rest of this paper, we will discuss relevant work in this area in Section 3, thechallenges while we prepare this analysis in Section 2, the detailed description themodels and human factors in Section 4, the implementation results in Section 5 andlastly we will discuss our conclusions and future work in Section 6.
2 Challenges and contributions
One key challenge in using IDS alerts is to understand its configuration and the in-formation contained in the alert log it generates. For instance, Miles (2001) discussesthe meaning of the variables in a SNORT alert. In some cases IDS user manualsmay not have extensive log variable information or may be scattered across differentchapters of the manual. As a test bed we clarify the structure of SNORT alerts and itsstructure. SNORT provides a very comprehensive user manual, but it is not easy tofind all the log variable information and these are scattered across different chaptersthe manual.
Another key challenge to address is parsing the log data into the usable format.SNORT generates the alert log data in text format and is not user friendly to analyzeas a database. To parse such text alerts, the first step is to read the text data into
J Intell Inf Syst
a database. This task is challenging in several aspects. First, the text data is semi-structured. The data elements or the alert structure is not the same for each of thealerts. Thus, we have to extract all of the missing variables and accommodate themfor other records when we import the full data into a database. Second, each alert ordata record is not in one line but is separated into multiple lines. Thus, we discoverthe patterns in order to read all the elements of the same record into one data record.Third, the data variable names are included as part of records and the names fromdifferent alerts could be the same. Thus, we have to recognize them and transposethe variable names into the header information instead of the data lines. Fourth, thedata size is large. thus we use database techniques to process them. For this project,we have developed an automatic program to import SNORT log data and it could bereused in other projects.
In this paper, we analyze the SNORT log data and provide four models to detectnetwork attacks. These models consider human factors while initiating the networkattacks. Our results shows high accuracy rate while we apply these models to ITOCCDX 2009 data (Sangster et al. 2009).
We also parse the log data into different segments and plot them as time seriesdata. This results in a temporal network analysis. Although this is not a newtechnique, it is novel in applying this technique in the log analysis.
3 Related work
By detecting the single attacks, IDS usually generates huge number of low levelalerts. The human analysts usually can not discover the relationships betweenpotentially unrelated individual alerts. Many researchers have been trying to developmethods to research the alert log collectively. Several relevant approaches have beenproposed since the first work by Denning (1987). Denning proposed a model basedon the hypothesis that security violations can be detected by monitoring a system’saudit records for abnormal patterns of system usage. The model includes profilesfor representing the behavior of subjects with respect to objects in terms of metricsand statistical models. It also proposes rules for acquiring knowledge about thisbehavior from audit records and for detecting anomalous behavior. The key pointof Denning’s model is that it is a rule based pattern matching system.
In 2004, Ning et al. proposed techniques and tools to analyze the IDS alerts (Ninget al. 2004). They propose a correlated method by introducing a concept calledprerequisites and consequences of attacks. Several Interactive Analysis Utilities areused to analyze the alert data, including aggregation/disaggregation, focused analysis,clustering analysis, frequency analysis, link analysis, and association analysis. InCuppens and Miège (2002), Cuppens et al. used a method to correlate alerts if theprerequisites of some later alerts are satisfied by the consequences of some earlieralerts. In Nguyen et al. (2010), an attack detection algorithm based on the decisioncost minimization strategy was introduced.
Moreover, Liu et. al. proposed a method to correlate multiple-step attacks andbuilt scenarios in order to recognize attack patterns (Liu et al. 2008). It uses aweighted cost in the attack path to match back to the attack models previously built.
J Intell Inf Syst
Cheung et al. (2003) introduced a Correlated Attack Modeling Language (CAML)and used a modular approach, where a module represents an inference step andmodules can be linked together to detect multi-step scenarios.
These approaches were instrumental in developing models and algorithms toanalyze alert information either from a multi-step approach or from a probabilisticapproach (Valdes and Skinner 2001). The goal again is to recognize the attackpatterns and predict them before the attack happens.
However, in the previous research, human factors were not taken into con-sideration, or at least were not discussed specifically. In this paper, we proposefour intrusion detection models based on common intruder behaviors. We test ourhypothesis on SNORT Alert information.
4 Behavioral models of anomaly detection
We aim to explore the use of a data oriented approach to understanding how anattack is carried out or what is the behavioral aspect of an attack.
If we are an attacker, what would we do when we initiate a cyber attack? Whenwe ask ourselves this question, it is easier for us to understand the actions the realattacker will perform in various attacks. In cyber attacks, an intruder will first choosea target and then initiate attacks. Before the attack succeeds or fails, an attacker willhave to try multiple times and, will continue trying different methods until they aresuccessful or eventually give up. This is the nature of the cyber attacks and almostuniversal in all attacks. This assumption excludes the attacks by insiders where theyknow the system well and do not need to scan the system and try multiple methodsof unauthorized access.
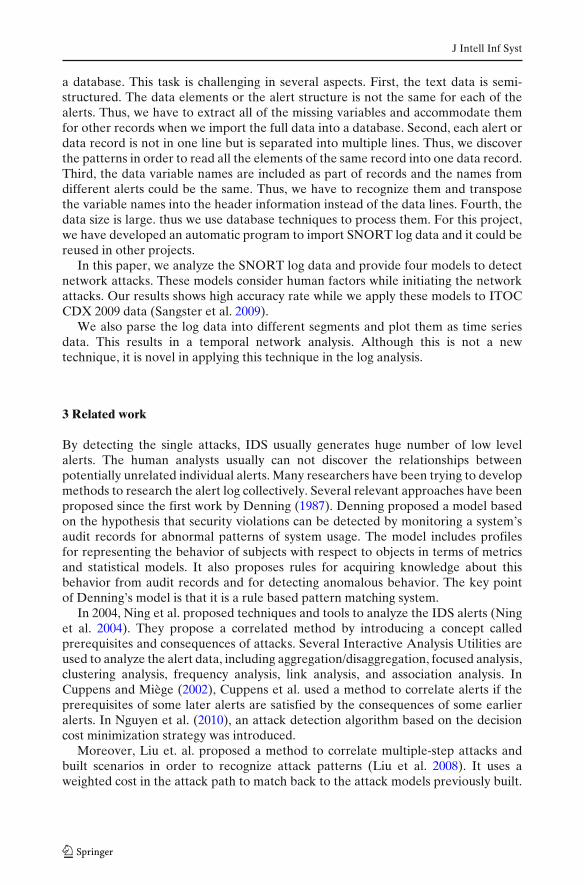
Another behavioral factor in cyber attack is that the attackers will target relativelyfew targets at each time, and most times, they only attack one target at a time. Thisprovides a clue to us that when the attack happens, usually it will focus on one targetin a short period of time. The attackers assumed to be human, will usually not spenda prolonged time on one target. After they have tried extensively to gain accessthrough one target in a short period of time, they will switch targets. These behavioralfactors provide hints in developing behavioral models of anomalies. The intruderswill essentially leave a trace of activities in the IDS logs. In our approach we will uti-lize IDS logs (for example SNORT alert log) to generate behavioral models of anom-alies. SNORT has its rules database and creates an independent alert message foreach network instance. As shown in Fig. 1, the SNORT log may differ according tothe initial configurations. But there are some basic structures providing the networkinformation. For security and privacy reasons, all IP addresses have been hidden inall following figures.
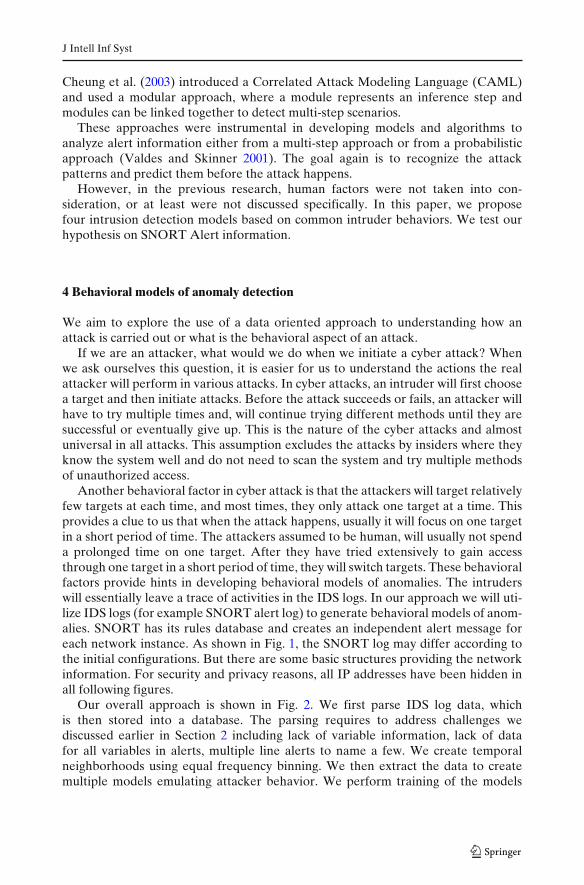
Our overall approach is shown in Fig. 2. We first parse IDS log data, whichis then stored into a database. The parsing requires to address challenges wediscussed earlier in Section 2 including lack of variable information, lack of datafor all variables in alerts, multiple line alerts to name a few. We create temporalneighborhoods using equal frequency binning. We then extract the data to createmultiple models emulating attacker behavior. We perform training of the models
J Intell Inf Syst
Fig. 1 SNORT log data structure
through a training algorithm. Finally we test our models based on SNORT prioritiesand ground truth evaluation of the data based on the training exercise description.
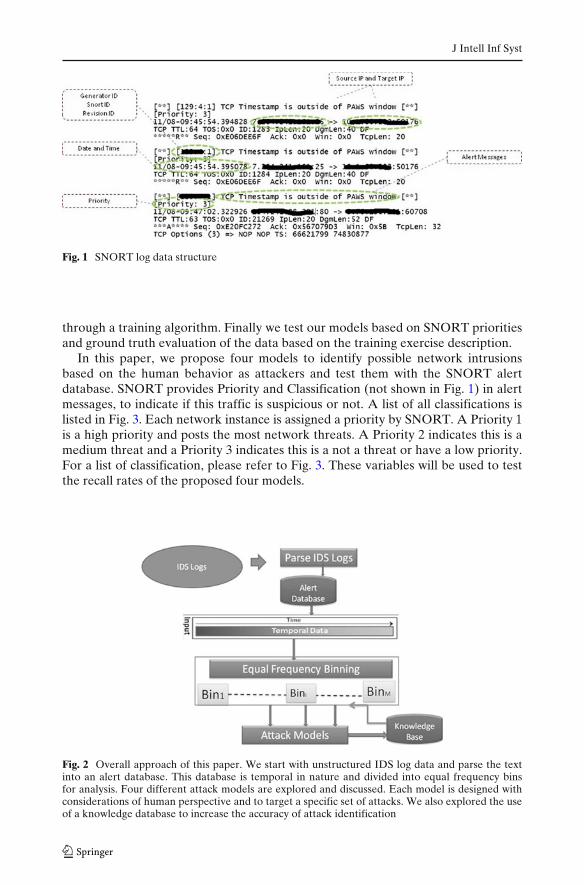
In this paper, we propose four models to identify possible network intrusionsbased on the human behavior as attackers and test them with the SNORT alertdatabase. SNORT provides Priority and Classification (not shown in Fig. 1) in alertmessages, to indicate if this traffic is suspicious or not. A list of all classifications islisted in Fig. 3. Each network instance is assigned a priority by SNORT. A Priority 1is a high priority and posts the most network threats. A Priority 2 indicates this is amedium threat and a Priority 3 indicates this is a not a threat or have a low priority.For a list of classification, please refer to Fig. 3. These variables will be used to testthe recall rates of the proposed four models.
Fig. 2 Overall approach of this paper. We start with unstructured IDS log data and parse the textinto an alert database. This database is temporal in nature and divided into equal frequency binsfor analysis. Four different attack models are explored and discussed. Each model is designed withconsiderations of human perspective and to target a specific set of attacks. We also explored the useof a knowledge database to increase the accuracy of attack identification
J Intell Inf Syst
Fig. 3 SNORT log alert classification: This table shows different labels assigned by SNORT IDSsystem and how they are classified into different priority levels according to their severity. Theseclassifications will be used to benchmark the performance of our four intrusion detection models indetecting attacks in the CDX dataset
Let us consider all the visitors N of a network, for each visitor of the network, V ∈N, a Source IP address, IP_Source and a Target IP Address, IP_Target, are displayedin the IDS logs. The alert information tells us what the actions from the source IPaddresses are. The IDS logs do not always categorize the attacks as such since theyobserve it in isolation. We propose to consider the alerts in combination as theymay be potentially related. In order to identify the collective behavior of attackers,it is not enough to only review the individual alert messages. We will also need toconsider the human behavior behind the attacks to find the hidden patterns behindthe attacks. This research is attempting to identify four user patterns and build them
J Intell Inf Syst
into four models which we will examine with ITOC CDX data (Sangster et al. 2009;Fanelli 2010).
4.1 Model 1 definition
When a cyber attack happens, the attacker usually will not be successful the f irst time.The attacker will attempt dif ferent methods in order to gain access to the target
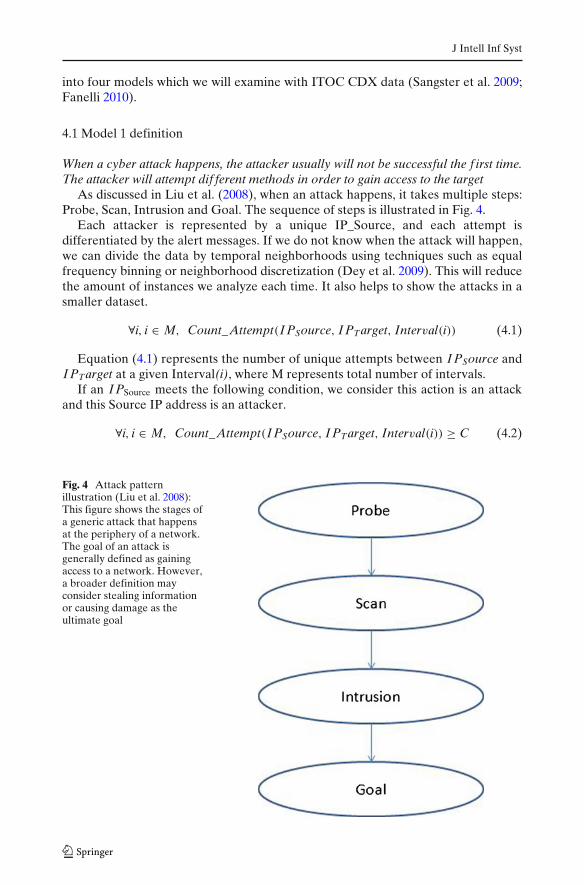
As discussed in Liu et al. (2008), when an attack happens, it takes multiple steps:Probe, Scan, Intrusion and Goal. The sequence of steps is illustrated in Fig. 4.
Each attacker is represented by a unique IP_Source, and each attempt isdifferentiated by the alert messages. If we do not know when the attack will happen,we can divide the data by temporal neighborhoods using techniques such as equalfrequency binning or neighborhood discretization (Dey et al. 2009). This will reducethe amount of instances we analyze each time. It also helps to show the attacks in asmaller dataset.
∀i, i ∈ M, Count_Attempt(I PSource, I PTarget, Interval(i)) (4.1)
Equation (4.1) represents the number of unique attempts between I PSource andI PTarget at a given Interval(i), where M represents total number of intervals.
If an I PSource meets the following condition, we consider this action is an attackand this Source IP address is an attacker.
∀i, i ∈ M, Count_Attempt(I PSource, I PTarget, Interval(i)) ≥ C (4.2)
Fig. 4 Attack patternillustration (Liu et al. 2008):This figure shows the stages ofa generic attack that happensat the periphery of a network.The goal of an attack isgenerally defined as gainingaccess to a network. However,a broader definition mayconsider stealing informationor causing damage as theultimate goal
J Intell Inf Syst
In (4.2), C represents an empirical criteria to differentiate attacks and non-attacks.This is based on the context of any given network. If we are considering a commercialnetwork, C will be larger than when we are considering a private network. In ourexperiments, we took C as three times of the average attempts of regular users.
If an I PSource is identified as an attacker’s IP address, its activities before or afterthe actions will be considered as part of the attack because its other incidences arelikely to be in the probe or scanning stage, as represented in Fig. 4, and in preparationfor the following attacks.
In this Model 1, it is designed to detect the short term attacks and the attacks thathappen at the peripheral of the network. Other attacks, for example the well knownStuxnet worm, which is embedded directly into the network or can easily get aroundthe network safeguards, will not be discovered by this model because there are noscanning or probe stage.
In order to detect the insider or expert attacks when there are no scanning orprobing stage, the sensors of the network need to be placed inside the networkto collect information that is designed to discover such attacks. For these attacks,we consider they have been successful in passing through the first stage of gettingnecessary access. In this paper, we explored the narrower definition of attacks onthe gaining access stage. We didn’t focus on the damaging stage when the successfulattackers try to either steal the information or to dysfunction the network.
There are another type of attacks that happen very slowly and keep exploringthe network vulnerabilities persistently and gradually. We will discuss it our Model4 later.
4.2 Model 2 definition
When an attack happens, the target address usually is unique or relatively a few. Theattackers will target the unique targets persistently until success or failure. If a target IDaddress is accessed by much higher number of unique IP address than usual within ashort period of time, this target IP address is being attacked.
∀i, i ∈ M, Count_Source_I P(I PTarget, Interval(i)) (4.3)
Equation (4.3), represents the number of unique I PSource accessing the targetI PTarget at a given interval(i). M represents number of intervals in this bin.
If any given I PTarget meets the following condition, it is considered being attacked.
∀i, i ∈ M, Count_Source_I P(I PTarget, Interval(i)) ≥ C (4.4)
In (4.4), C represents empirical criteria to differentiate attacks and non-attacks. Inour experiments, we again used a heuristic based on three times of average SourceIP and Target IP ratio. M represents number of intervals in this bin.
This Model 2 is designed to detect the coordinated attacks when the attackersutilize a corpus of “zombie” computers to access a network in a short time. Theattackers may also use botnets or other software tools to perform diverse actionsrather than single actions. Those attacks could be easily identified by our Model 1,which is designed to detect the diverse actions from a relatively few I PSource.
Figure 6 shows diverse actions from one single attacker and how they are capturedor identified by Model 1 and displayed in different colors by sources of identification.However, if the attackers are not targeting at a few targets but rather a large amount
J Intell Inf Syst
of targets at one time, both Model 1 and 2 will not work. From human perspective,however, this type of actions is also very unlikely.
4.3 Model 3 definition
One of the most common attack methods are the massive attempts in a short time inorder to obtain the password information. Hence, if a I PTarget is experiencing muchhigher than normal traf f ic from a single or a few I PSources, this I PTarget is under attack.
Total_Traf f ic(I P1, I P2, Interval(i)) (4.5)
Equation (4.5), represents the total traffic between two IP address at a giveninterval(i). If any given I PTarget meets the following condition, it is considered beingattacked.
Total_Traf f ic(I PSource, I PTarget, Interval(i)
)
U_Source_I P(i) + U_Target_I P(i)≥ C (4.6)
In (4.6), C represents empirical criteria to differentiate attacks and non-attacks.In general, we will need to conduct experimental assessment in order to determinethe C value. We will use the CDX 2009 date to experiment this model and assess itseffectiveness and soundness.
One type of attacks that could be identified by Model 3 is guessing password.But there are many other attacks that show this same or similar network trafficpatterns that could be unveiled by Model 3. This is a pattern of network traffic thatis usually being observed by the network administers. But without comparing its pasttraffic information, it is hard to determine weather they are attacks or not. Also, onethreshold needs to be obtained from history data. There are other types of networkintrusions that will start with a high volume of traffics, such as scanning for vulner-abilities, testing of network structures etc. These actions usually are the preambleof more sophisticated actions and could serve as alerts for future actions from suchsuspicious IPs.
4.4 Model 4 definition
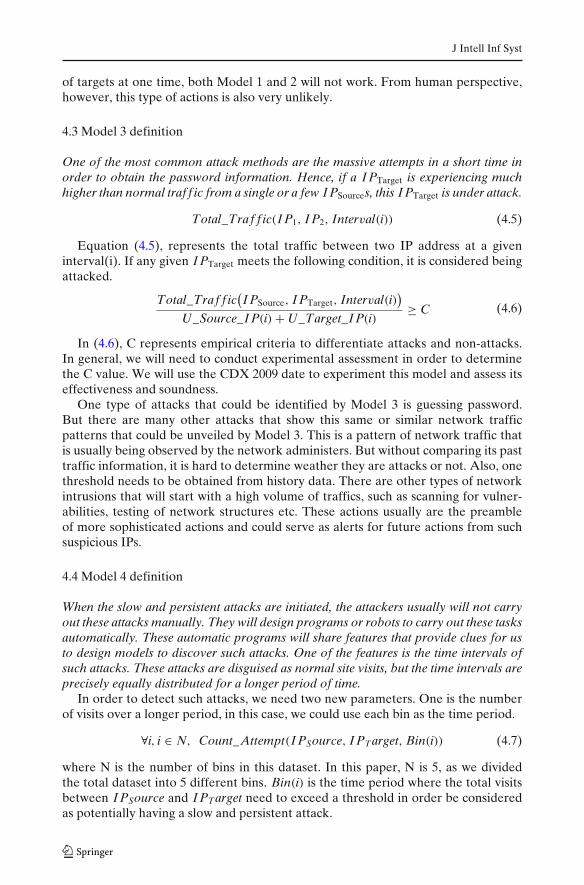
When the slow and persistent attacks are initiated, the attackers usually will not carryout these attacks manually. They will design programs or robots to carry out these tasksautomatically. These automatic programs will share features that provide clues for usto design models to discover such attacks. One of the features is the time intervals ofsuch attacks. These attacks are disguised as normal site visits, but the time intervals areprecisely equally distributed for a longer period of time.
In order to detect such attacks, we need two new parameters. One is the numberof visits over a longer period, in this case, we could use each bin as the time period.
∀i, i ∈ N, Count_Attempt(I PSource, I PTarget, Bin(i)) (4.7)
where N is the number of bins in this dataset. In this paper, N is 5, as we dividedthe total dataset into 5 different bins. Bin(i) is the time period where the total visitsbetween I PSource and I PTarget need to exceed a threshold in order be consideredas potentially having a slow and persistent attack.

J Intell Inf Syst
If the number of visits (4.7) Between I PSource and I PTarget exceeds a threshold,we also need to examine the second parameter, the standard deviation of the timeintervals between visits of a pair of IPs, which is defined as:
∀i, i ∈ N, Std_Interval(I PSource, I PTarget, Bin(i)) (4.8)
Where N is the number of bins in this dataset. If the standard deviation (4.8)is smaller than the second threshold, we will consider this is a potential slow andpersistent attack.
The two thresholds for (4.7) and (4.8) need to be set so that we can get a numberof meaningful outliers for this type of attack. If they are too low, we will get toomany suspected attacks. If they are too high, no such attacks will be identified.We expect that the values from (4.7) will be dramatically different for normal visitsand slow attacks and thus easy to be distinguished if any attacks exist. Such attacksneed special treatment as there are many variables to evaluate as we have discussedelsewhere (Namayanja and Janeja 2013).
4.5 Recall indicator
To better understand the effectiveness of our method, we examine the Recallindicator to measure attack detection models.
RRecall(i, j) = DMarked(i, j)DAll( j)
, ∀i∈D, j∈M (4.9)
In the above (4.9), M is total number of Bins and D is total number of models,where
RRecall(i,j) is the completeness measure for Model_i with Bin_j.DMarked(i,j) is the number of instances that are marked as attacks for Model_i with
Bin_j.DAll(j) is the number of instances that would be marked as attacks for Bin_j.
4.6 Training knowledge base
In order to improve the accuracy of these models, we also try to incorporate a trainingmechanism and construct a knowledge base from the models.
K(i, j) =i∑
1
j∑
1
Attacker(i, j), ∀i∈D, j∈M (4.10)
Where Attacker(i,j) is the attacker marked by Model_i with Bin_j. The knowledgedatabase will consist of the attackers by the time we run our models for each bin. Mis total number of Bins and D is total number of models.The basic idea is that wewould like to accumulate all the attackers in the past and compare the current resultswith this historical database to test the reappearance of attackers.
If we used the new model (Model_k ) with the accumulated knowledge base, therecall of the new model is as follows:
Rk(k, j) = DMarked(k, j)DAll( j)
, ∀i∈D, j∈M (4.11)

J Intell Inf Syst
where Modeli,k uses the knowledge base of∑k
j=1 K(i, j), k ∈ M. Equation (4.11)gives the recall rate of a model using the knowledge base accumulated throughprevious experiences.
We test our proposed models on datasets generated through training exercise(Sangster et al. 2009) to test the accuracy of our approach.
5 Experimental results
We next discuss the datasets, results, training algorithms and some ground truthvalidation of our results.
5.1 Dataset
In this section, we report the experiments we performed to verify our models. Thedata we used is from ITOC CDX (Cyber Defense Competition) 2009 (Sangster et al.2009). This dataset was generated between November 08, 2009 through November12, 2009 during a Cyber Defense Competition (Fanelli 2010; Dodge Jr and Wilson2003). This competition comprises of three teams. The red team is the attacker andthe blue team is the defender. Another white team is the traffic generator in orderto simulate the normal network traffic data. As this is a temporal dataset, we dividedthe dataset into 5 periods or bins and tested our four models separately. Each binconsists of one day traffic data from this competition. We will also test the trainingalgorithm and see if it actually increases the accuracy of the results.
Because of the nature of the model designs, we include a training algorithm forModel 1 and Model 3 to accumulate the attackers in a knowledge base. Model 2does not identify true attacker IP addresses, instead, it identifies an attack pattern.Although Model 4 is able to identify the attackers, our dataset only simulated thefast and short term attacks, we didn’t yield any meaningful results. We only employa training algorithm for Model 1 and 3 and also discuss the results in this section.
5.2 Results
Model 1 to 3 are designed to identify the fast and short term attacks. Model 4 isdesigned to identify the slow and persistent attacks. In the CDX dataset, only thefast and short term attacks were simulated. There are some “attackers” identified byModel 4 as slow attacks, but they are actually the background traffic data (as shownin Fig. 9) and should be screened out. As a result, we now only discuss the resultsfrom Model 1 to 3.
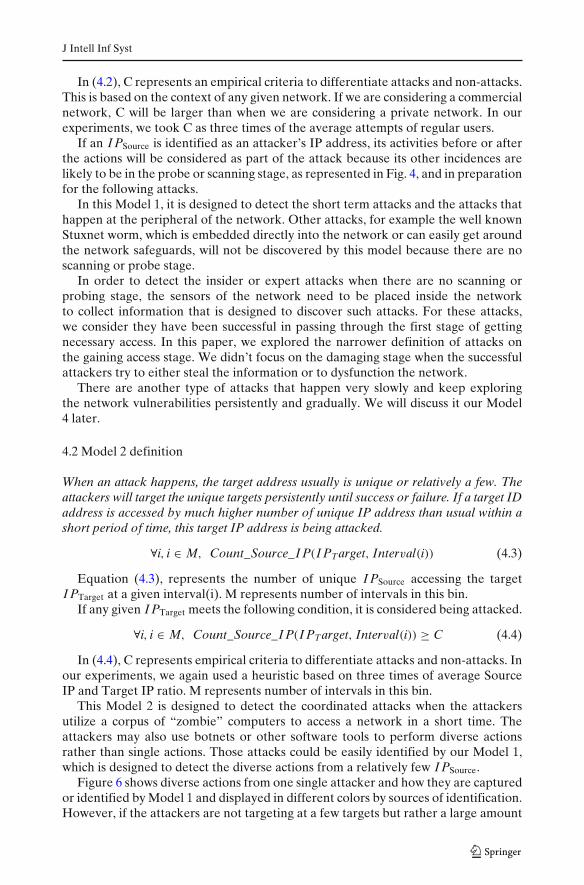
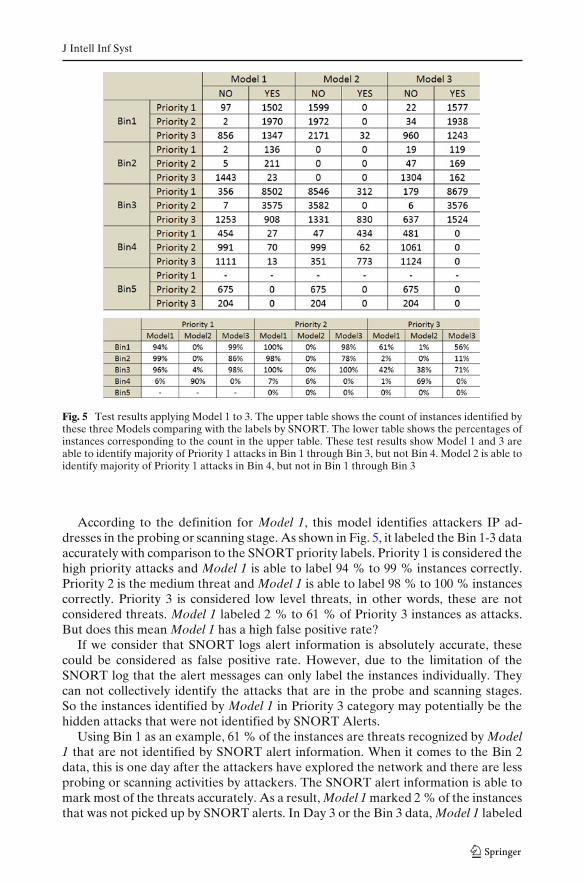
Figure 5 shows the test results matrix of the Models with Bins. The upper tableshows the count of instances identified by Model 1 to 3, comparing with the labelsby SNORT. The lower table shows the percentages of instances corresponding to thecount figures in the upper table. These test results show Model 1 and 3 are able toidentify majority of Priority 1 attacks in Bin 1 through Bin 3, but not Bin 4. Model2 is able to identify majority of Priority 1 attacks in Bin 4, but not in Bin 1 throughBin 3. Bin 5 is a quiet episode when not many attacks happen and only consist ofregular background traffics.
J Intell Inf Syst
Fig. 5 Test results applying Model 1 to 3. The upper table shows the count of instances identified bythese three Models comparing with the labels by SNORT. The lower table shows the percentages ofinstances corresponding to the count in the upper table. These test results show Model 1 and 3 areable to identify majority of Priority 1 attacks in Bin 1 through Bin 3, but not Bin 4. Model 2 is able toidentify majority of Priority 1 attacks in Bin 4, but not in Bin 1 through Bin 3
According to the definition for Model 1, this model identifies attackers IP ad-dresses in the probing or scanning stage. As shown in Fig. 5, it labeled the Bin 1-3 dataaccurately with comparison to the SNORT priority labels. Priority 1 is considered thehigh priority attacks and Model 1 is able to label 94 % to 99 % instances correctly.Priority 2 is the medium threat and Model 1 is able to label 98 % to 100 % instancescorrectly. Priority 3 is considered low level threats, in other words, these are notconsidered threats. Model 1 labeled 2 % to 61 % of Priority 3 instances as attacks.But does this mean Model 1 has a high false positive rate?
If we consider that SNORT logs alert information is absolutely accurate, thesecould be considered as false positive rate. However, due to the limitation of theSNORT log that the alert messages can only label the instances individually. Theycan not collectively identify the attacks that are in the probe and scanning stages.So the instances identified by Model 1 in Priority 3 category may potentially be thehidden attacks that were not identified by SNORT Alerts.
Using Bin 1 as an example, 61 % of the instances are threats recognized by Model1 that are not identified by SNORT alert information. When it comes to the Bin 2data, this is one day after the attackers have explored the network and there are lessprobing or scanning activities by attackers. The SNORT alert information is able tomark most of the threats accurately. As a result, Model 1 marked 2 % of the instancesthat was not picked up by SNORT alerts. In Day 3 or the Bin 3 data, Model 1 labeled
J Intell Inf Syst
42 % of the instances not identified by SNORT alerts, this indicates there are somemore new attacks being initiated by attackers.
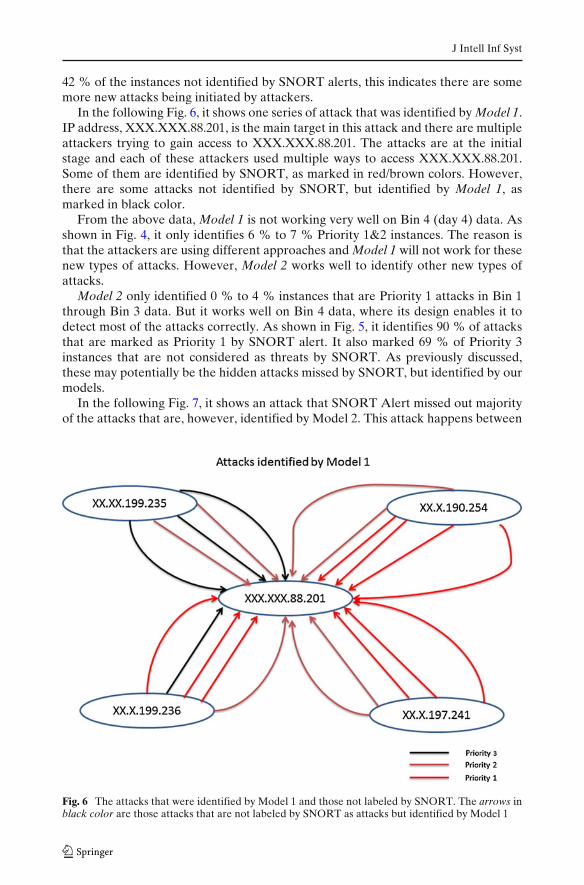
In the following Fig. 6, it shows one series of attack that was identified by Model 1.IP address, XXX.XXX.88.201, is the main target in this attack and there are multipleattackers trying to gain access to XXX.XXX.88.201. The attacks are at the initialstage and each of these attackers used multiple ways to access XXX.XXX.88.201.Some of them are identified by SNORT, as marked in red/brown colors. However,there are some attacks not identified by SNORT, but identified by Model 1, asmarked in black color.
From the above data, Model 1 is not working very well on Bin 4 (day 4) data. Asshown in Fig. 4, it only identifies 6 % to 7 % Priority 1&2 instances. The reason isthat the attackers are using different approaches and Model 1 will not work for thesenew types of attacks. However, Model 2 works well to identify other new types ofattacks.
Model 2 only identified 0 % to 4 % instances that are Priority 1 attacks in Bin 1through Bin 3 data. But it works well on Bin 4 data, where its design enables it todetect most of the attacks correctly. As shown in Fig. 5, it identifies 90 % of attacksthat are marked as Priority 1 by SNORT alert. It also marked 69 % of Priority 3instances that are not considered as threats by SNORT. As previously discussed,these may potentially be the hidden attacks missed by SNORT, but identified by ourmodels.
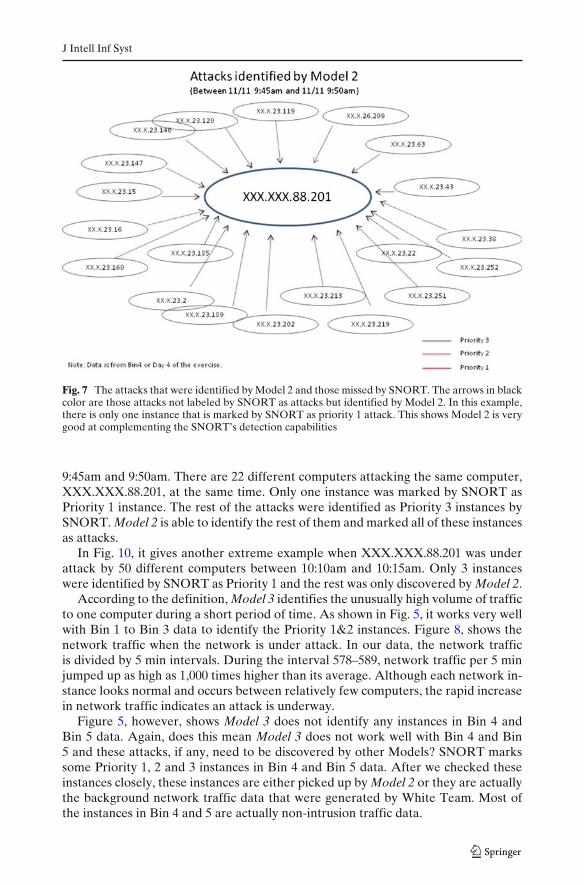
In the following Fig. 7, it shows an attack that SNORT Alert missed out majorityof the attacks that are, however, identified by Model 2. This attack happens between
Fig. 6 The attacks that were identified by Model 1 and those not labeled by SNORT. The arrows inblack color are those attacks that are not labeled by SNORT as attacks but identified by Model 1
J Intell Inf Syst
Fig. 7 The attacks that were identified by Model 2 and those missed by SNORT. The arrows in blackcolor are those attacks not labeled by SNORT as attacks but identified by Model 2. In this example,there is only one instance that is marked by SNORT as priority 1 attack. This shows Model 2 is verygood at complementing the SNORT’s detection capabilities
9:45am and 9:50am. There are 22 different computers attacking the same computer,XXX.XXX.88.201, at the same time. Only one instance was marked by SNORT asPriority 1 instance. The rest of the attacks were identified as Priority 3 instances bySNORT. Model 2 is able to identify the rest of them and marked all of these instancesas attacks.
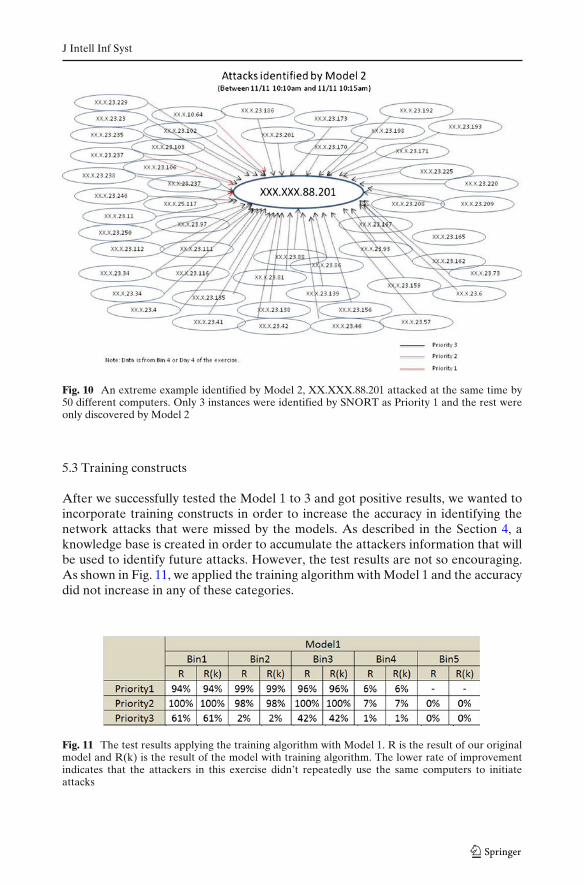
In Fig. 10, it gives another extreme example when XXX.XXX.88.201 was underattack by 50 different computers between 10:10am and 10:15am. Only 3 instanceswere identified by SNORT as Priority 1 and the rest was only discovered by Model 2.
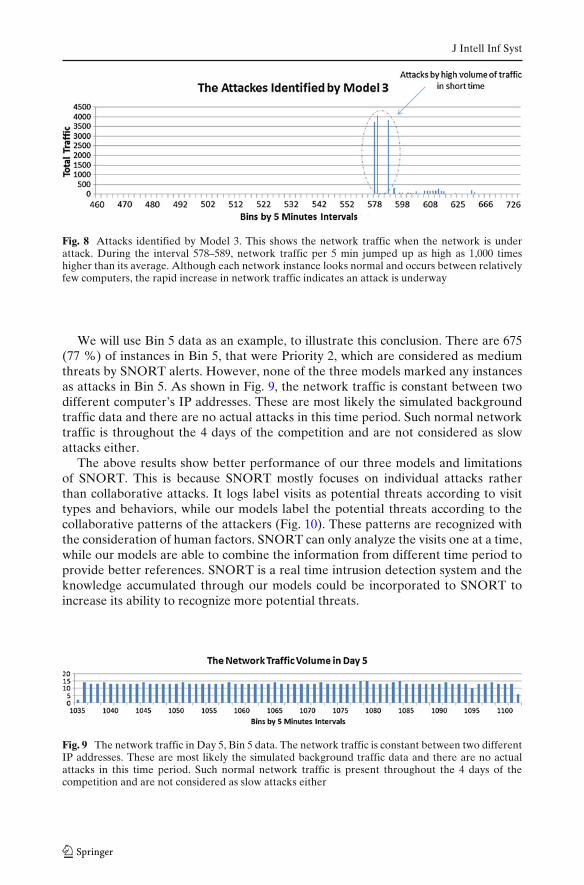
According to the definition, Model 3 identifies the unusually high volume of trafficto one computer during a short period of time. As shown in Fig. 5, it works very wellwith Bin 1 to Bin 3 data to identify the Priority 1&2 instances. Figure 8, shows thenetwork traffic when the network is under attack. In our data, the network trafficis divided by 5 min intervals. During the interval 578–589, network traffic per 5 minjumped up as high as 1,000 times higher than its average. Although each network in-stance looks normal and occurs between relatively few computers, the rapid increasein network traffic indicates an attack is underway.
Figure 5, however, shows Model 3 does not identify any instances in Bin 4 andBin 5 data. Again, does this mean Model 3 does not work well with Bin 4 and Bin5 and these attacks, if any, need to be discovered by other Models? SNORT markssome Priority 1, 2 and 3 instances in Bin 4 and Bin 5 data. After we checked theseinstances closely, these instances are either picked up by Model 2 or they are actuallythe background network traffic data that were generated by White Team. Most ofthe instances in Bin 4 and 5 are actually non-intrusion traffic data.
J Intell Inf Syst
Fig. 8 Attacks identified by Model 3. This shows the network traffic when the network is underattack. During the interval 578–589, network traffic per 5 min jumped up as high as 1,000 timeshigher than its average. Although each network instance looks normal and occurs between relativelyfew computers, the rapid increase in network traffic indicates an attack is underway
We will use Bin 5 data as an example, to illustrate this conclusion. There are 675(77 %) of instances in Bin 5, that were Priority 2, which are considered as mediumthreats by SNORT alerts. However, none of the three models marked any instancesas attacks in Bin 5. As shown in Fig. 9, the network traffic is constant between twodifferent computer’s IP addresses. These are most likely the simulated backgroundtraffic data and there are no actual attacks in this time period. Such normal networktraffic is throughout the 4 days of the competition and are not considered as slowattacks either.
The above results show better performance of our three models and limitationsof SNORT. This is because SNORT mostly focuses on individual attacks ratherthan collaborative attacks. It logs label visits as potential threats according to visittypes and behaviors, while our models label the potential threats according to thecollaborative patterns of the attackers (Fig. 10). These patterns are recognized withthe consideration of human factors. SNORT can only analyze the visits one at a time,while our models are able to combine the information from different time period toprovide better references. SNORT is a real time intrusion detection system and theknowledge accumulated through our models could be incorporated to SNORT toincrease its ability to recognize more potential threats.
Fig. 9 The network traffic in Day 5, Bin 5 data. The network traffic is constant between two differentIP addresses. These are most likely the simulated background traffic data and there are no actualattacks in this time period. Such normal network traffic is present throughout the 4 days of thecompetition and are not considered as slow attacks either
J Intell Inf Syst
Fig. 10 An extreme example identified by Model 2, XX.XXX.88.201 attacked at the same time by50 different computers. Only 3 instances were identified by SNORT as Priority 1 and the rest wereonly discovered by Model 2
5.3 Training constructs
After we successfully tested the Model 1 to 3 and got positive results, we wanted toincorporate training constructs in order to increase the accuracy in identifying thenetwork attacks that were missed by the models. As described in the Section 4, aknowledge base is created in order to accumulate the attackers information that willbe used to identify future attacks. However, the test results are not so encouraging.As shown in Fig. 11, we applied the training algorithm with Model 1 and the accuracydid not increase in any of these categories.
Fig. 11 The test results applying the training algorithm with Model 1. R is the result of our originalmodel and R(k) is the result of the model with training algorithm. The lower rate of improvementindicates that the attackers in this exercise didn’t repeatedly use the same computers to initiateattacks

J Intell Inf Syst
We believe that this does not mean the training algorithm does not work. The neg-ative results are due to the fact that the attackers only attack the network for a limitedtime period or they did not use the same computer to initiate the attacks throughoutthe competition. The attacker IP address did not show up in later parts of this exer-cise. This shows one of the shortcomings of our models and potentially most of othermodels which is, that we recognize these same attackers only by IP addresses. Thisreflects the complexities in the real network attacks and the difficulty in identifyingthe attacks or intrusions.
5.4 Comparison with other models
In Denning’s article (Denning 1987), several models were proposed and discussed.Denning’s models mainly concern with the short term attacks and we can make com-parisons with our Model 1 to 3. Our models are similar but further extend the ideasof Denning’s models. Our models considered what the abnormal behaviors are withrespect to the attacker behaviors. Denning proposed five different statistical models.
1. The Operational Model is based on assumptions and decides the abnormalitiesby experience.
2. The Mean and Standard Deviation Model decides abnormalities by assumingmean and standard deviation from previous time periods.
3. The Multivariate Model is based on more than one variable. In order to achievebest result, we will need to choose the variables that are most meaningful.
4. The Markov Model requires a transition matrix of a list of distinct type ofevents and estimate probabilities of each event at certain time intervals. The lowprobable event is considered abnormal.
5. Similar to the Markov Process Model, Time Series Model also considers theprobabilities of events at each time interval and discover the low probabilityevents as abnormalities.
We did a few tests to compare the results of our models to the Operational Modeland the Mean and Standard Deviation Model. Although Denning’s OperationalModel and Mean and Standard Deviation Model require to set up certain thresholds,we have tested the models with the best thresholds that could both increase theidentification rates and decrease the possible “false positives”.
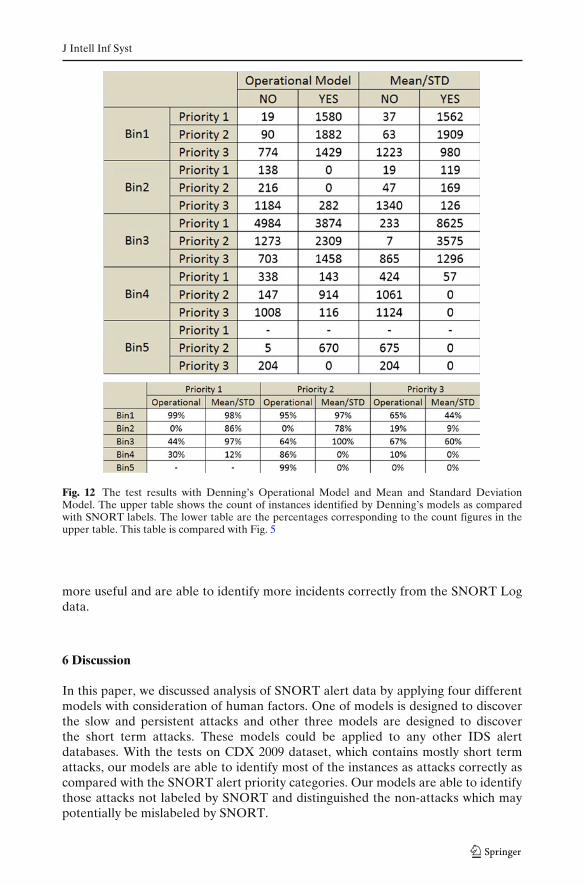
From the results in Fig. 12, the Operational Model is able to identify majority ofPriority 1 alerts in Bin 1, but not able to identify most of the incidents in Bin 2, 3 and4. The Operational Model identifies a higher rate of Priority 3 incidences, which mayindicate either false positives or potential cyber attacks not identified by SNORT.The Mean and Standard Deviation Model is best for Bin 1, 2 and 3, but not for Bin 4.These further demonstrate that any model will only be applicable for certain type ofanomalies, but may not be suitable for detecting others.
Compared to our Model 1, Model 2 and Model 3, Denning’s two models identifiedon average lower percentages of Priority 1 and 2 incidents in the SNORT log data andidentified higher percentages of Priority 3 incidents. Each model has its uniquenessand sensitiveness in identifying certain types of intrusions, but may not be for others.Overall, our models considered not only the means and standard deviations, but alsosome possible attacker behaviors in the intrusion activities, which makes our model
J Intell Inf Syst
Fig. 12 The test results with Denning’s Operational Model and Mean and Standard DeviationModel. The upper table shows the count of instances identified by Denning’s models as comparedwith SNORT labels. The lower table are the percentages corresponding to the count figures in theupper table. This table is compared with Fig. 5
more useful and are able to identify more incidents correctly from the SNORT Logdata.
6 Discussion
In this paper, we discussed analysis of SNORT alert data by applying four differentmodels with consideration of human factors. One of models is designed to discoverthe slow and persistent attacks and other three models are designed to discoverthe short term attacks. These models could be applied to any other IDS alertdatabases. With the tests on CDX 2009 dataset, which contains mostly short termattacks, our models are able to identify most of the instances as attacks correctly ascompared with the SNORT alert priority categories. Our models are able to identifythose attacks not labeled by SNORT and distinguished the non-attacks which maypotentially be mislabeled by SNORT.
J Intell Inf Syst
We also compared Model 1 to 3 with Denning’s two models in identifying thepotential intrusions. The results show our three models are able to identify moreincidents correctly in most of our data. In these comparisons, we are aware that eachmodel has its own advantages in identifying some network anomalies, but may notbe for others.
The advantages of our model are that we considered some user behaviors ratherthan only the statistics. This makes our models able to more accurately identify theintrusions. The SNORT data is a labeled log dataset. In the future we would liketo also test our models on datasets with domain experts labels to test for accuracyparticularly for priority 3 instances.
Some disadvantages of our model also need to be discussed here. These modelsare built upon a few observations on the attacker behaviors from our point ofview. We could not consider all of the human factors in the attacks and the humanbehaviors may change over time too. Our Model 1 to 3 are successful with the attacksin CDX dataset, but may not be successful with other types of attacks.
We didn’t discuss the test results from Model 4 because of the nature of thisCDX dataset which doesn’t contain any meaningful behaviors from the slow andpersistent attacks. This model needs to be further tested with real data. Model 4takes into account the human behaviors of slow and persistent attacks, we are fullyconfident that this model will work well to detect slow attacks and such attacks willshow themselves clearly under this model.
In CDX dataset, only the fast and short term attacks were simulated throughoutthis competition. For the slow and persistent attacks, we introduced a Model 4 toaddress them but didn’t yield meaningful results in this research due to the limitationof this dataset, but we will research and test this model in later research with differentdatasets and also explore other possible models with considerations of humanperspective. For more sophisticated attacks, such as expert attacks or insider attacks,more network sensors and models need to be employed in order to discover suchcovert actions.
In order to detect attacks more accurately and to build a robust detection system,we will need to employ studies from different areas, including new technologies, datamining skills, attacker psychologies and the normal user behaviors etc. It is neverenough to only use one method to fit to all situations. The intrusions patterns arecomplex in nature and human behaviors are unpredictable, but we will strive todiscover the attacks with relatively less time and lower costs.
References
Anwar, F., Anwar, Z., et al. (2011). Digital forensics for eucalyptus. In Frontiers of InformationTechnology (FIT), 2011 (pp. 110–116). IEEE.
Cheung, S., Lindqvist, U., Fong, M.W. (2003). Modeling multistep cyber attacks for scenario recog-nition. In DARPA information survivability conference and exposition, 2003. Proceedings (vol. 1,pp. 284–292). IEEE.
Cuppens, F., & Miège, A. (2002). Alert correlation in a cooperative intrusion detection framework.In 2002 IEEE symposium on security and privacy, 2002. Proceedings (pp. 202–215). IEEE.
Denning, D.E. (1987). An intrusion-detection model. IEEE Transactions on Software Engineering,SE-13(2), 222–232.
Dey, S., Janeja, V.P., Gangopadhyay, A. (2009). Temporal neighborhood discovery through unequaldepth binning. In IEEE International Conference on Data Mining (ICDM’09).
J Intell Inf Syst
Dodge Jr, R.C., & Wilson, T. (2003). Network traffic analysis from the cyber defense exercise. InIEEE international conference on systems, man and cybernetics, 2003 (vol. 5, pp. 4317–4321).IEEE.
Fanelli, R. (2010). The value of competition. SC Magazine.Kim, S.J., & Hong, S. (2011). Study on the development of early warning model for cyber attack.
In 2011 International Conference on Information Science and Applications (ICISA) (pp. 1–8).IEEE.
Liu, Z., Wang, C., Chen, S. (2008). Correlating multi-step attack and constructing attack scenariosbased on attack pattern modeling. In International conference on information security and assur-ance, 2008. ISA 2008 (pp. 214–219). IEEE.
Miles, W. (2001). Hack proofing sun solaris 8—protect your solaris network from attack (1st ed.,pp. 83–85, 257). New York: Syngress.
Namayanja, J.M., & Janeja, V.P. (2013). Discovery of persistent threat structures through temporaland geo-spatial characterization in evolving networks. In IEEE Intelligence and Security Infor-matics (ISI).
Nguyen, H.D., Gutta, S., Cheng, Q. (2010). An active distributed approach for cyber attack detec-tion. In 2010 conference record of the forty fourth asilomar conference on signals, systems andcomputers (ASILOMAR) (pp. 1540–1544). IEEE.
Ning, P., Cui, Y., Reeves, D.S., Xu, D. (2004). Techniques and tools for analyzing intrusion alerts.ACM Transactions on Information and System Security (TISSEC), 7(2), 274–318.
Orebaugh, A.D., Biles, S., Babbin, J. (2005). Snort cookbook. O’Reilly Media, Inc.Rehman, R.U. (2003). Intrusion detection systems with Snort: Advanced IDS techniques using Snort,
Apache, MySQL, PHP, and ACID. Prentice Hall PTR.Roesch, M., & Green, C. (2003). Snort users manual 2.9.3. (pp. 1–2, 179–180).Sangster, B., O’Connor, T.J., Cook, T., Fanelli, R., Dean, E., Adams, W.J., Morrell, C., Conti, G.
(2009). Toward instrumenting network warfare competitions to generate labeled datasets. InProceedings of the 2nd conference on cyber security experimentation and test (pp. 9–9). USENIXAssociation.
Snort (software) (2013). Wikipedia.com ID: 551979534.Valdes, A., & Skinner, K. (2001). Probabilistic alert correlation. In Recent advances in intrusion
detection (pp. 54–68). Springer.Youssef, A., & Emam, A. (2011). Network intrusion detection using data mining and network
behaviour analysis. International Journal of Computer Science & Information Technology, 3.6,87–98.