Embed Size (px)
Citation preview
eResearch Corporation www.eresearch.ca Page 1
HUMBLE STUDENT OF THE MARKETS
eResearch Corporation is pleased to provide an article by Cam Hui, CFA for his
Blog, Humble Student of the Markets. In this article, the Author looks at the market call of a noted “expert” and takes issue
with the second part of a two-part recommendation on the U.S. Healthcare ETF XLV. The article is reproduced below, or you can go directly to this specific Blog at this link: An example of why traders need to think for themselves
You can also visit the Home Page of the Blog at the link below: http://humblestudentofthemarkets.blogspot.ca/
HUMBLE S TUDENT OF TH E MARKETS W E L C O M E T O M Y B L O G , H U M B L E S T U D E N T O F T H E M A R K E T S . T H E S E A R E M Y
M U S I N G S A B O U T T H E M A R K E T S ( M O S T L Y E Q U I T I E S ) , H E D G E F U N D S , A N D I N V E S T M E N T S I N G E N E R A L .
�
Cam Hui, CFA
Thursday, August 20, 2015
Correction, or Market Bottom?
It is a sign of the low volatility 2015 environment that when the SPX falls by 4.5% on a peak-to-trough basis, there is a sense of panic in the air. With the SPX at 2035.73, traders have to decide whether this is the start of a major correction or a short-term capitulation bottom in stock prices. The Bear Case With the market down about 2% today (Thursday), the bear case is easy to make.
eResearch Corporation www.eresearch.ca Page 2
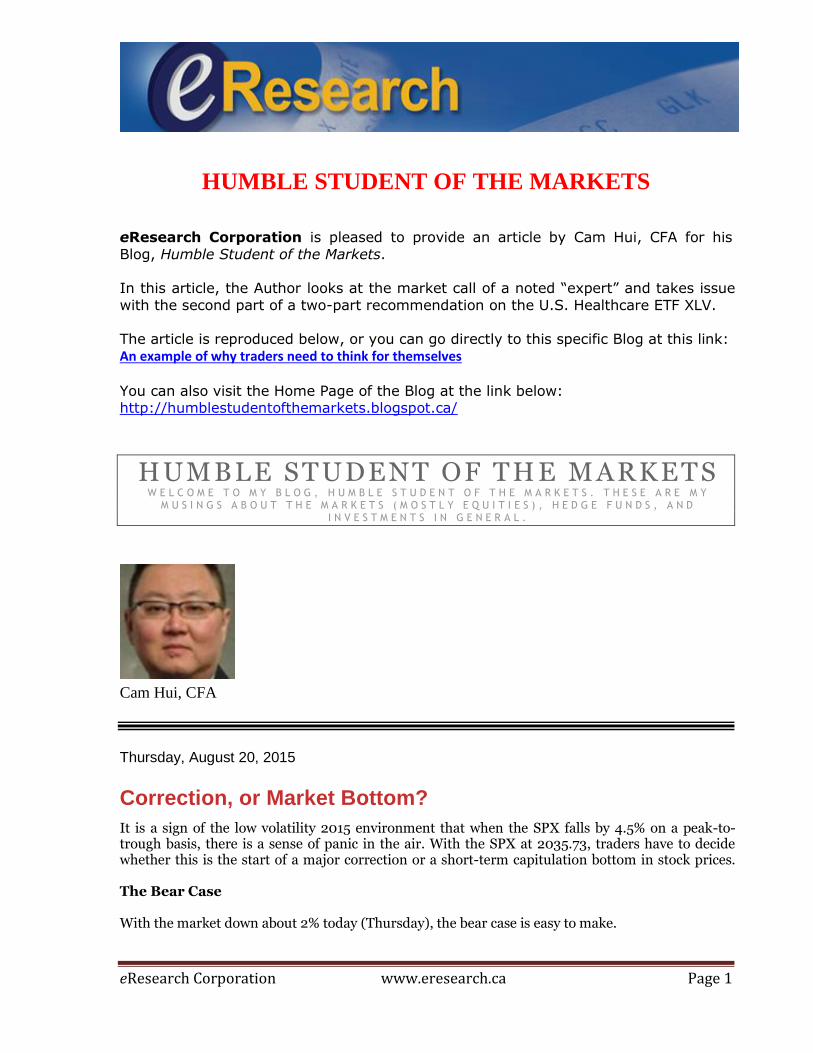
China seems to be unraveling again (see my previous post Is China getting hit with THE BIG ONE?). Not only is the Shanghai Composite testing its 200-day moving average (dma), the stock indices of major Chinese Asian trading partners are all trending downwards, which indicate economic weakness.
Uncertainty over Greece is surfacing again, as PM Alexis Tsipras has resigned and elections are being called.
eResearch Corporation www.eresearch.ca Page 3
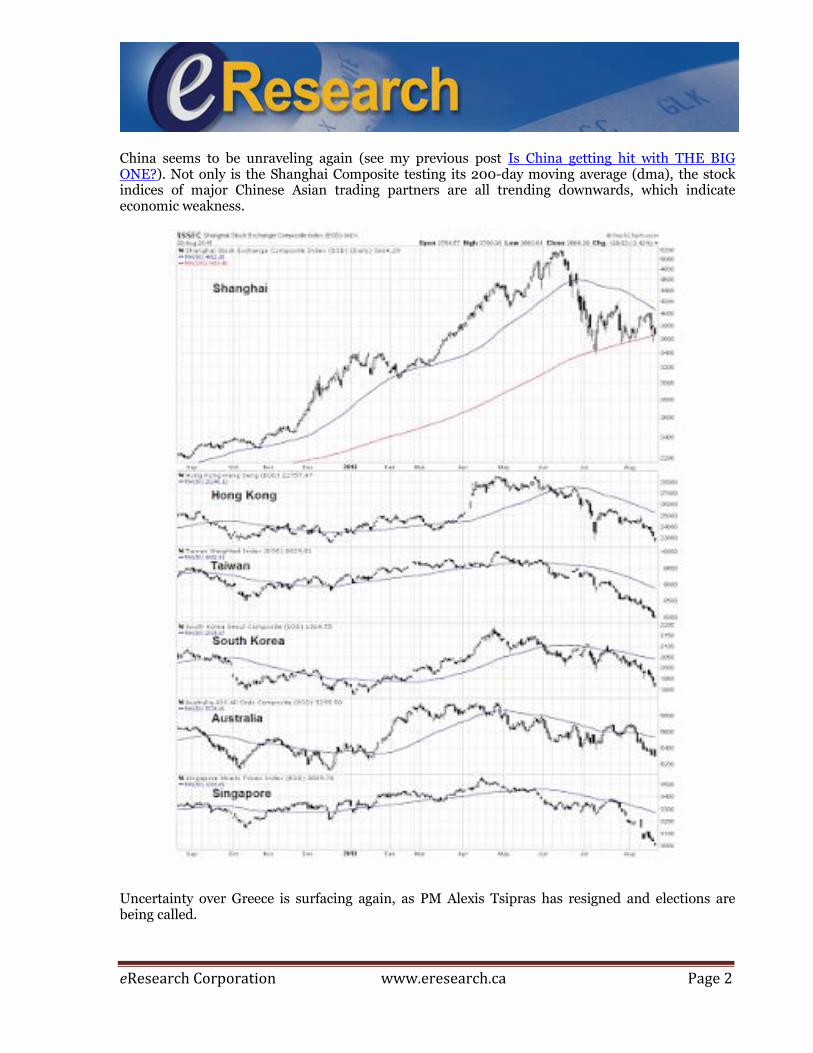
Junk bonds are performing badly, which reflects deterioration in credit market risk appetite.
The technical conditions of the stock market are awful. I have written much about how market breadth has been deteriorating and price momentum flagging (see Bullish and bearish over different time frames). Indeed, a number of key technical "lines in the sand" have been breached. Mark Hulbert highlighted the fact that the Dow Theory has just flashed a sell signal. The chart below shows that the SPX fell below its 200 dma and violated a key support level at 2040.
eResearch Corporation www.eresearch.ca Page 4
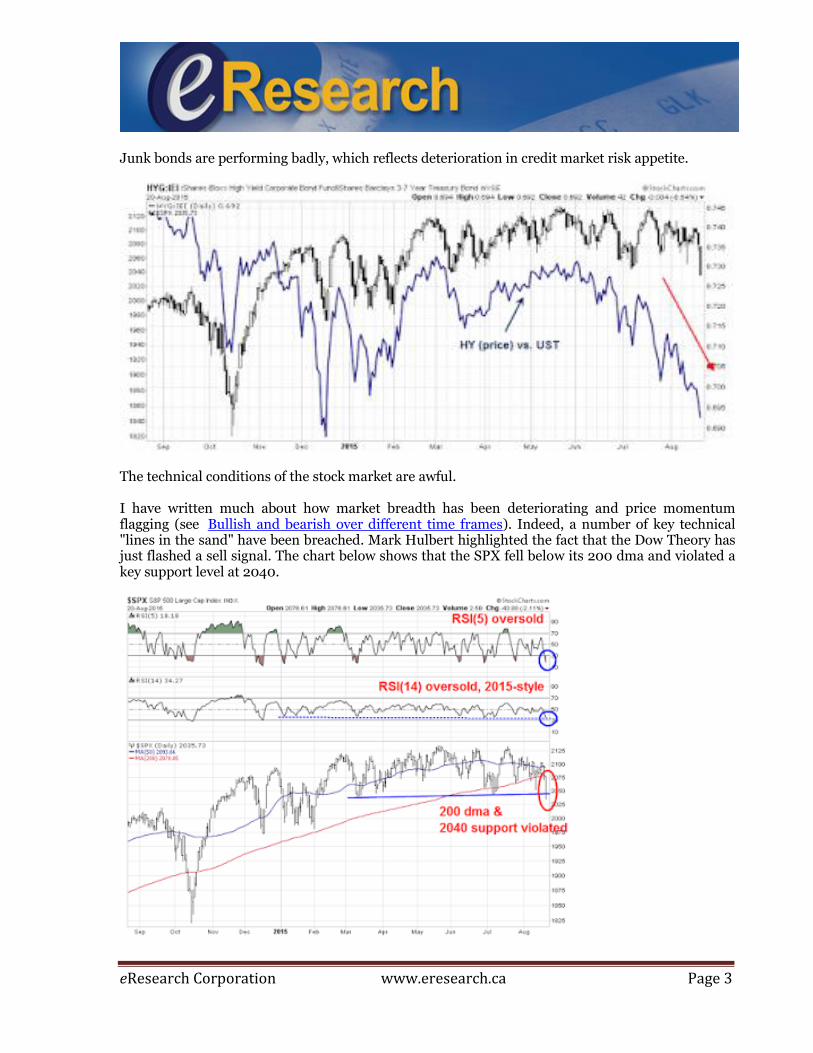
To be sure, the above chart also shows that both the RSI(5) and RSI(14) momentum indicators are in oversold territory. However, oversold markets can get even more oversold. It comes to the same question of whether the bears have seized control of the tape. An Oversold Market In addition, to the RSI indicators shown in the chart above, numerous breadth indicators from IndexIndicators IndexIndicators are flashing oversold readings (where the BLACK dots indicate my own estimates). This chart of SPX stocks above their 10 dma, which is a short-term indicator with a 1-3 day time horizon, are at levels where the market has bounced before in 2015.
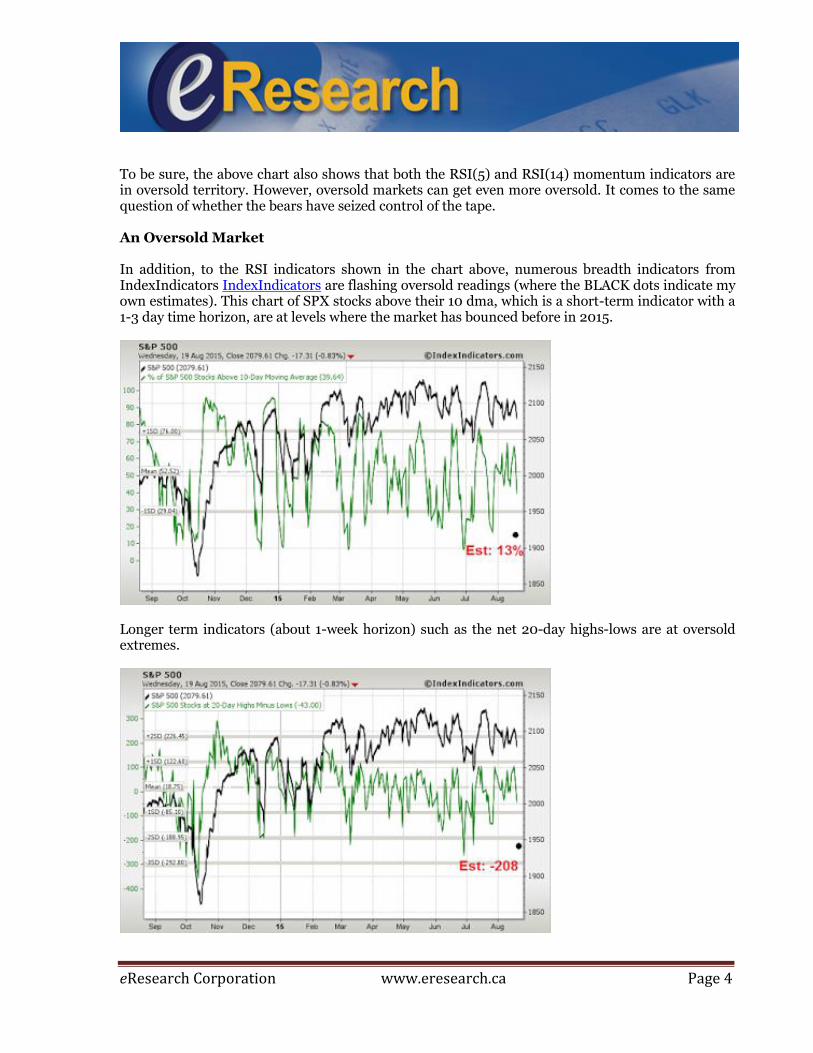
Longer term indicators (about 1-week horizon) such as the net 20-day highs-lows are at oversold extremes.
eResearch Corporation www.eresearch.ca Page 5
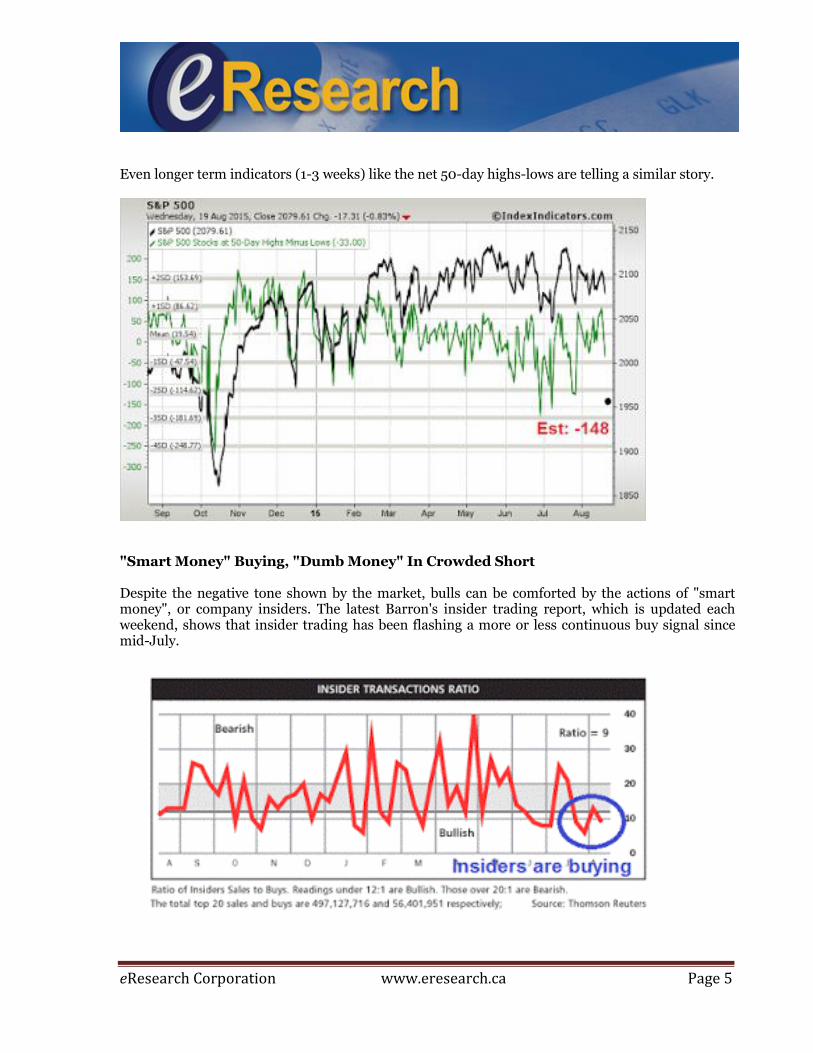
Even longer term indicators (1-3 weeks) like the net 50-day highs-lows are telling a similar story.
"Smart Money" Buying, "Dumb Money" In Crowded Short Despite the negative tone shown by the market, bulls can be comforted by the actions of "smart money", or company insiders. The latest Barron's insider trading report, which is updated each weekend, shows that insider trading has been flashing a more or less continuous buy signal since mid-July.
eResearch Corporation www.eresearch.ca Page 6
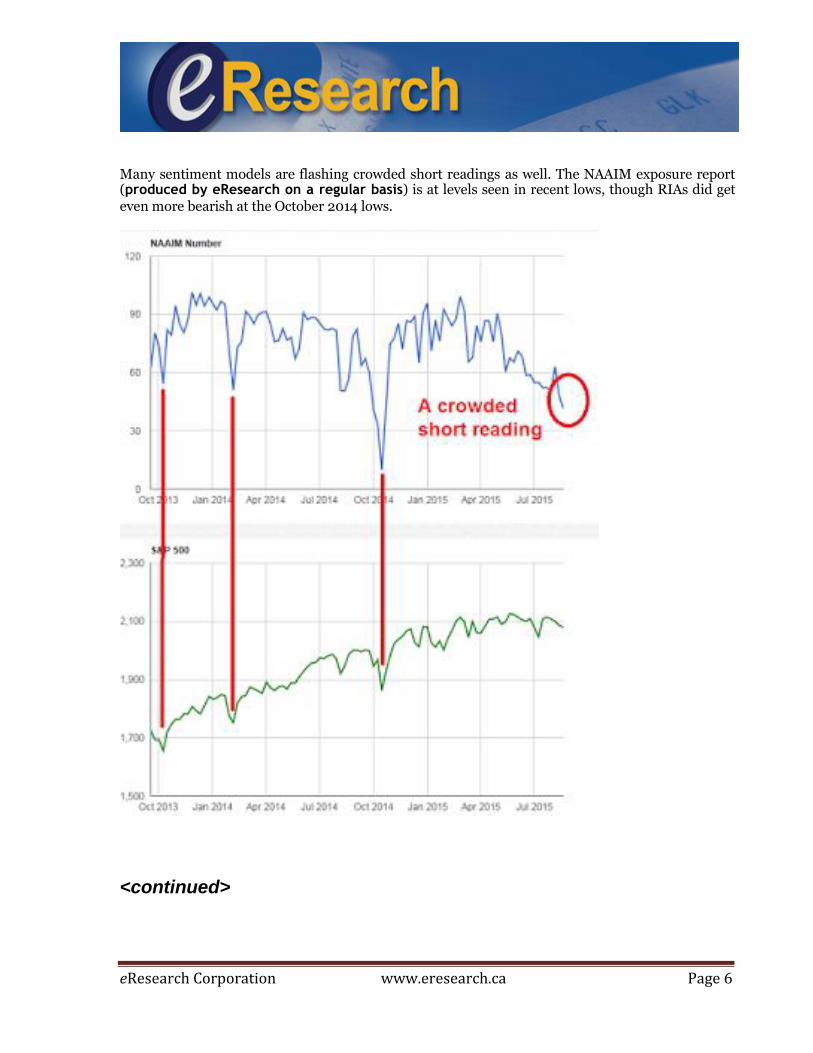
Many sentiment models are flashing crowded short readings as well. The NAAIM exposure report (produced by eResearch on a regular basis) is at levels seen in recent lows, though RIAs did get even more bearish at the October 2014 lows.
<continued>
eResearch Corporation www.eresearch.ca Page 7
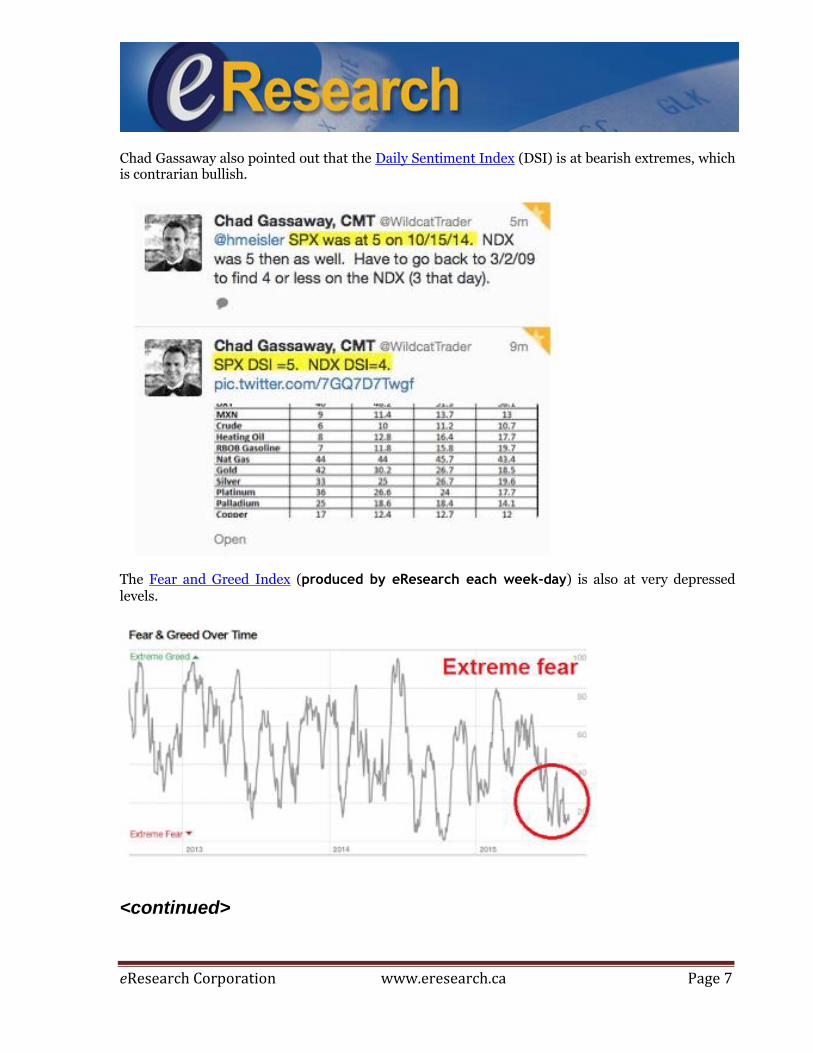
Chad Gassaway also pointed out that the Daily Sentiment Index (DSI) is at bearish extremes, which is contrarian bullish.
The Fear and Greed Index (produced by eResearch each week-day) is also at very depressed levels.
<continued>
eResearch Corporation www.eresearch.ca Page 8
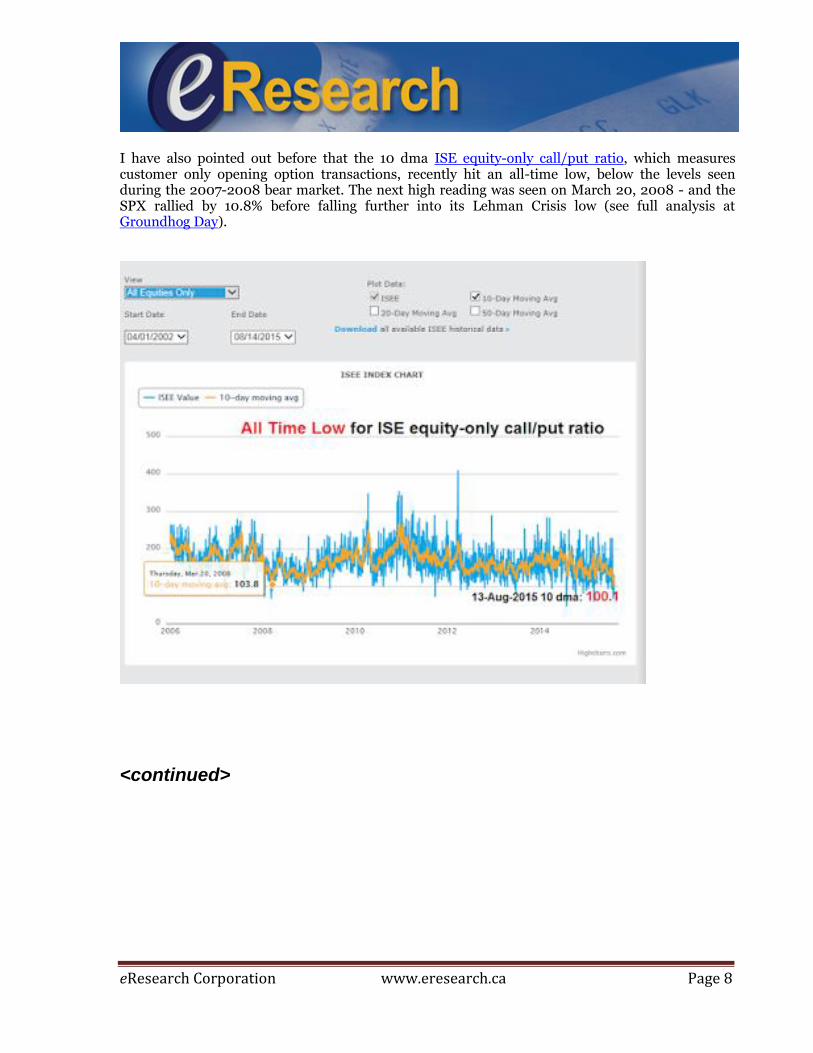
I have also pointed out before that the 10 dma ISE equity-only call/put ratio, which measures customer only opening option transactions, recently hit an all-time low, below the levels seen during the 2007-2008 bear market. The next high reading was seen on March 20, 2008 - and the SPX rallied by 10.8% before falling further into its Lehman Crisis low (see full analysis at Groundhog Day).
<continued>
eResearch Corporation www.eresearch.ca Page 9
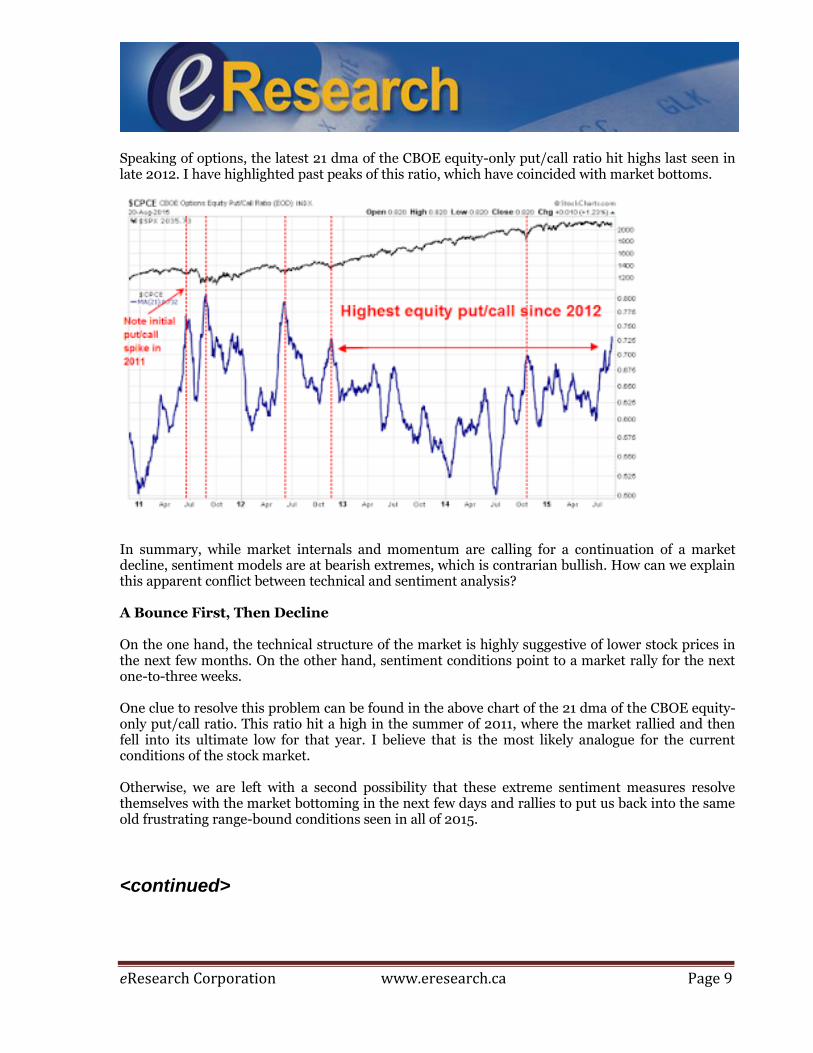
Speaking of options, the latest 21 dma of the CBOE equity-only put/call ratio hit highs last seen in late 2012. I have highlighted past peaks of this ratio, which have coincided with market bottoms.
In summary, while market internals and momentum are calling for a continuation of a market decline, sentiment models are at bearish extremes, which is contrarian bullish. How can we explain this apparent conflict between technical and sentiment analysis? A Bounce First, Then Decline On the one hand, the technical structure of the market is highly suggestive of lower stock prices in the next few months. On the other hand, sentiment conditions point to a market rally for the next one-to-three weeks. One clue to resolve this problem can be found in the above chart of the 21 dma of the CBOE equity-only put/call ratio. This ratio hit a high in the summer of 2011, where the market rallied and then fell into its ultimate low for that year. I believe that is the most likely analogue for the current conditions of the stock market. Otherwise, we are left with a second possibility that these extreme sentiment measures resolve themselves with the market bottoming in the next few days and rallies to put us back into the same old frustrating range-bound conditions seen in all of 2015.
<continued>
eResearch Corporation www.eresearch.ca Page 10
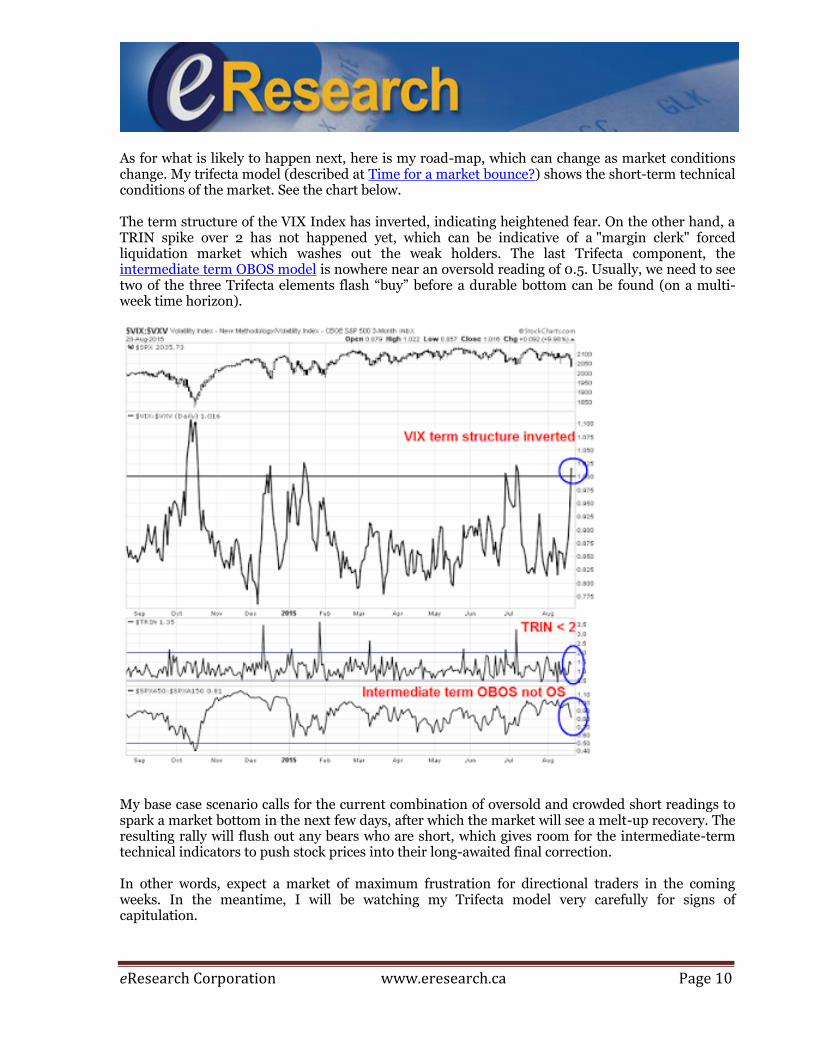
As for what is likely to happen next, here is my road-map, which can change as market conditions change. My trifecta model (described at Time for a market bounce?) shows the short-term technical conditions of the market. See the chart below. The term structure of the VIX Index has inverted, indicating heightened fear. On the other hand, a TRIN spike over 2 has not happened yet, which can be indicative of a "margin clerk" forced liquidation market which washes out the weak holders. The last Trifecta component, the intermediate term OBOS model is nowhere near an oversold reading of 0.5. Usually, we need to see two of the three Trifecta elements flash “buy” before a durable bottom can be found (on a multi-week time horizon).
My base case scenario calls for the current combination of oversold and crowded short readings to spark a market bottom in the next few days, after which the market will see a melt-up recovery. The resulting rally will flush out any bears who are short, which gives room for the intermediate-term technical indicators to push stock prices into their long-awaited final correction. In other words, expect a market of maximum frustration for directional traders in the coming weeks. In the meantime, I will be watching my Trifecta model very carefully for signs of capitulation.