Embed Size (px)
Citation preview

Huntington Hills School
Provincial Achievement Test Results for Spring 08
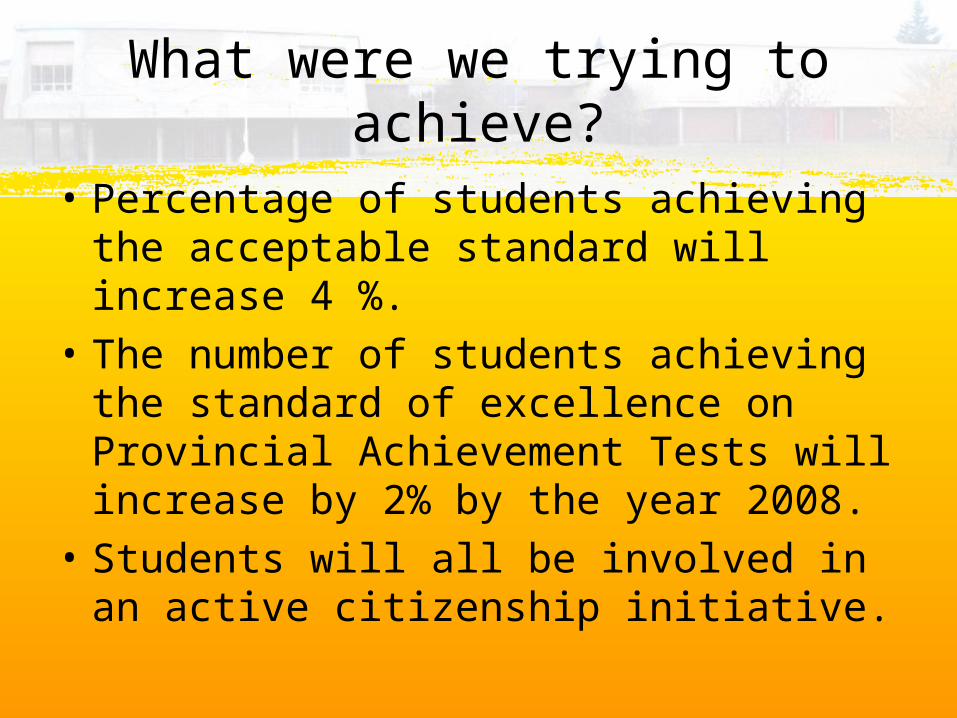
What were we trying to achieve?
• Percentage of students achieving the acceptable standard will increase 4 %.
• The number of students achieving the standard of excellence on Provincial Achievement Tests will increase by 2% by the year 2008.
• Students will all be involved in an active citizenship initiative.
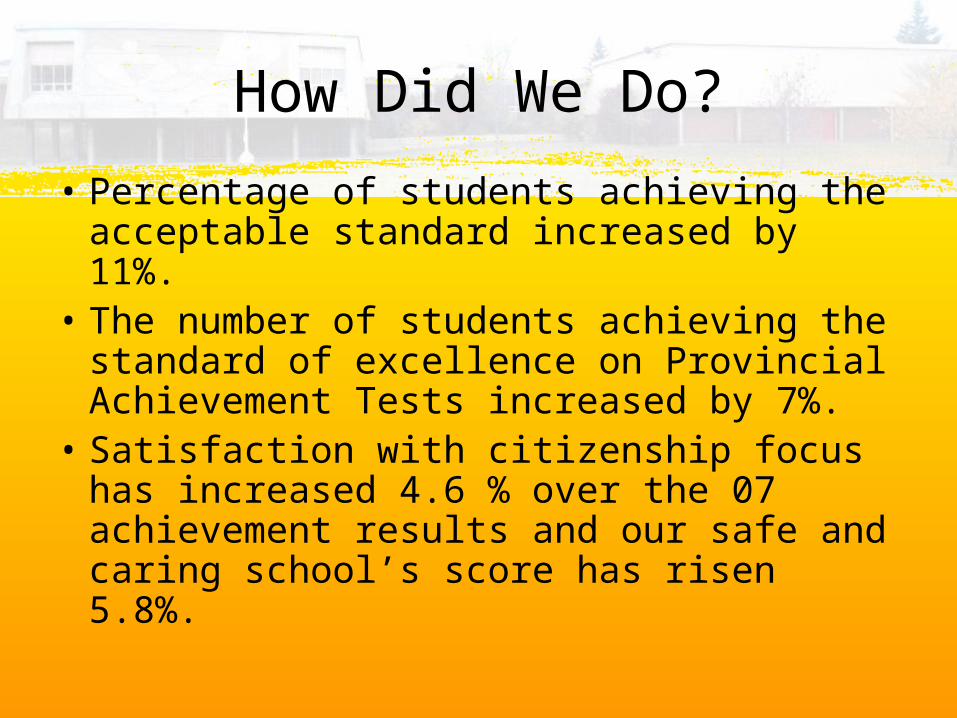
How Did We Do?
• Percentage of students achieving the acceptable standard increased by 11%.
• The number of students achieving the standard of excellence on Provincial Achievement Tests increased by 7%.
• Satisfaction with citizenship focus has increased 4.6 % over the 07 achievement results and our safe and caring school’s score has risen 5.8%.
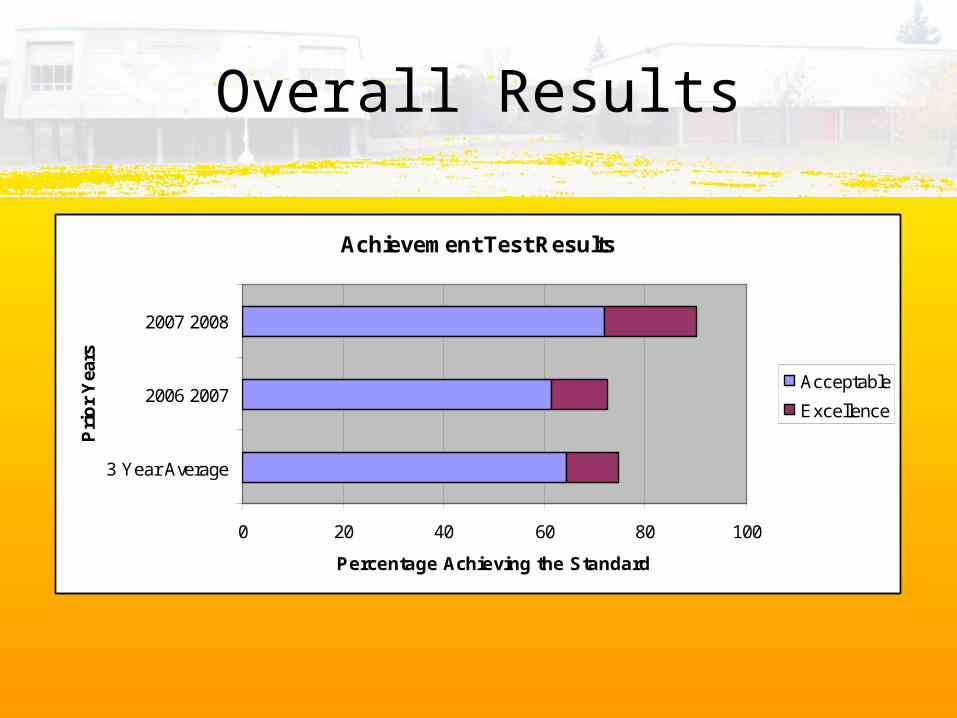
Overall Results
Achievement Test Results
0 20 40 60 80 100
3 Year Average
2006 2007
2007 2008
Pri
or
Yea
rs
Percentage Achieving the Standard
Acceptable
Excellence
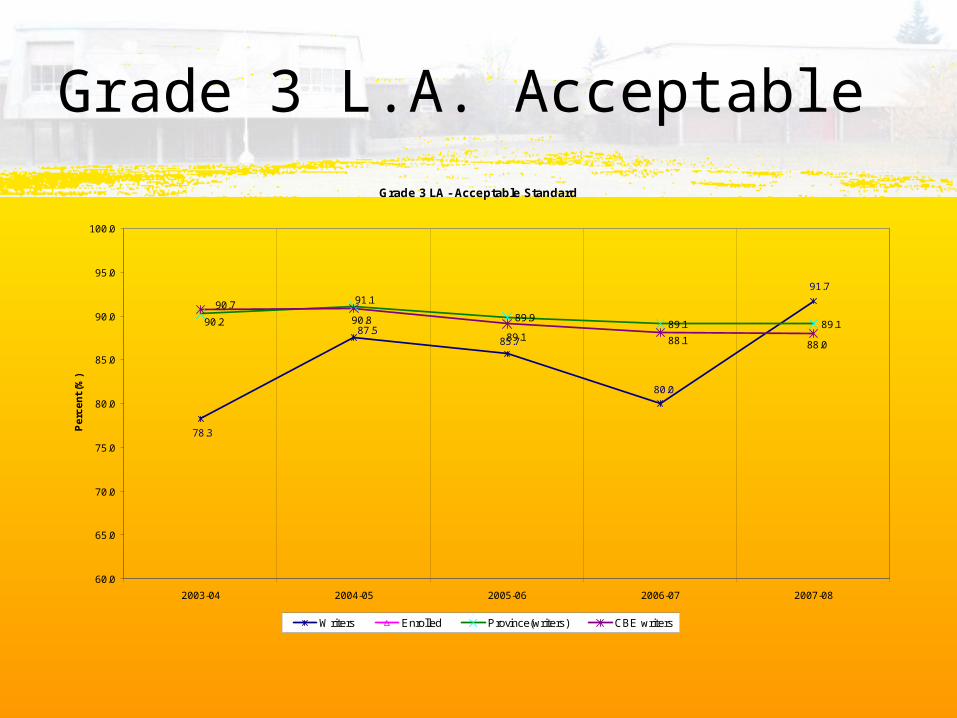
Grade 3 L.A. Acceptable
Grade 3 LA - Acceptable Standard
89.989.1 89.1
91.7
80.0
85.7
78.3
87.590.2
91.190.7
90.8
89.188.088.1
60.0
65.0
70.0
75.0
80.0
85.0
90.0
95.0
100.0
2003-04 2004-05 2005-06 2006-07 2007-08
Pe
rce
nt
(%)
Writers Enrolled Province(writers) CBE writers
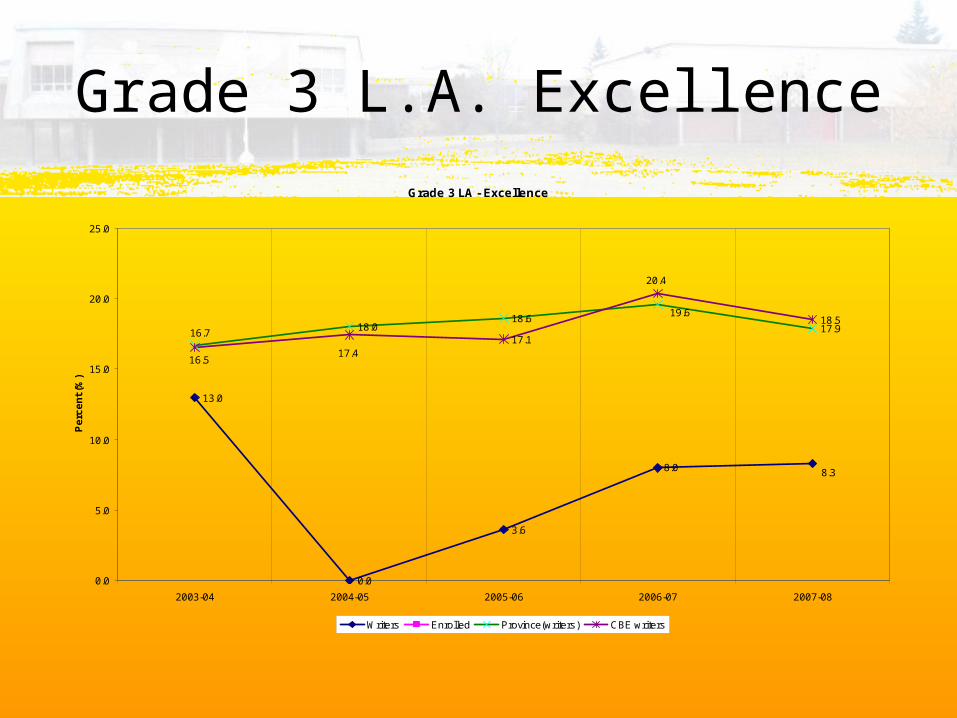
Grade 3 L.A. Excellence
Grade 3 LA - Excellence
13.0
0.0
3.6
18.018.6
17.917.1
18.5
8.0 8.3
19.6
16.7
20.4
16.517.4
0.0
5.0
10.0
15.0
20.0
25.0
2003-04 2004-05 2005-06 2006-07 2007-08
Pe
rce
nt
(%)
Writers Enrolled Province(writers) CBE writers
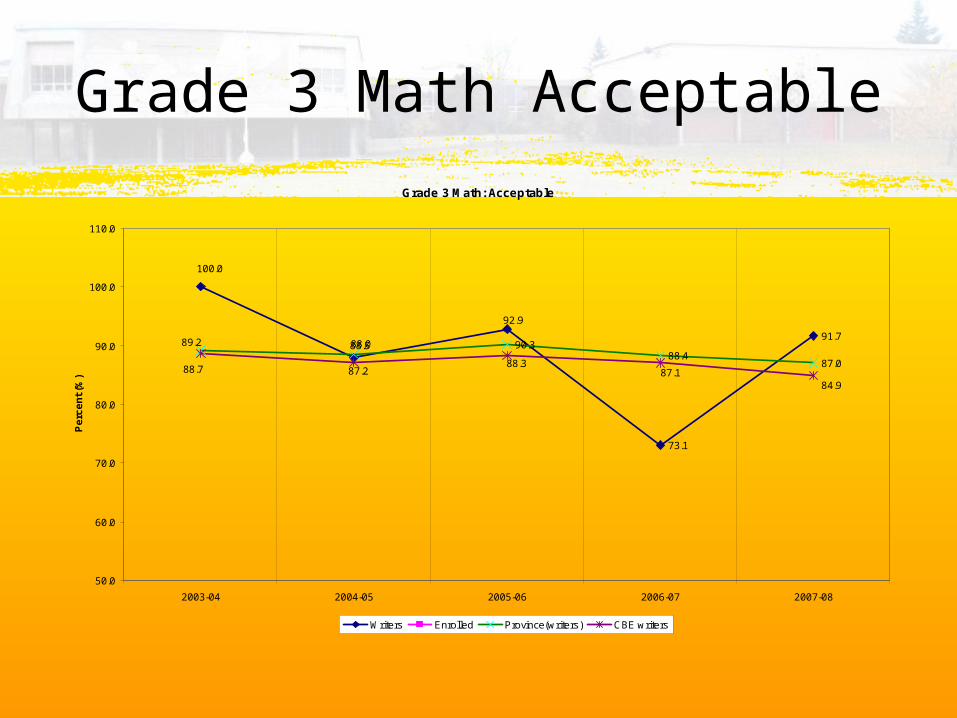
Grade 3 Math Acceptable
Grade 3 Math: Acceptable
73.1
91.790.3
88.487.0
92.9
100.0
88.089.2 88.5
88.7 87.288.3
87.184.9
50.0
60.0
70.0
80.0
90.0
100.0
110.0
2003-04 2004-05 2005-06 2006-07 2007-08
Pe
rce
nt
(%)
Writers Enrolled Province(writers) CBE writers
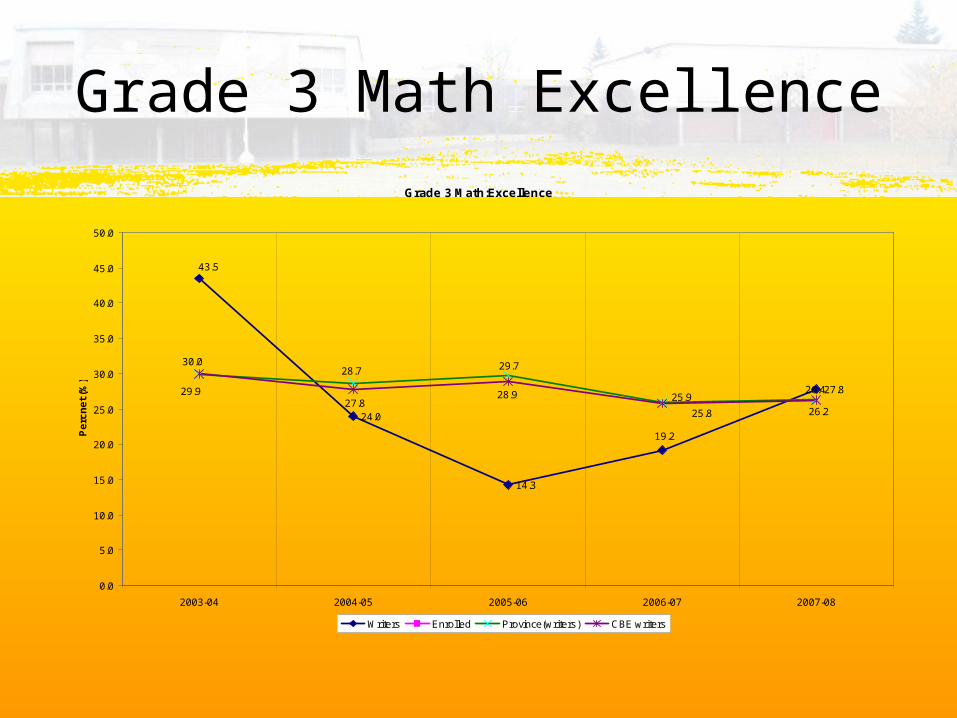
Grade 3 Math Excellence
Grade 3 Math:Excellence
24.0
14.3
27.8
19.2
43.5
26.425.9
29.728.7
29.9
26.225.8
28.927.8
30.0
0.0
5.0
10.0
15.0
20.0
25.0
30.0
35.0
40.0
45.0
50.0
2003-04 2004-05 2005-06 2006-07 2007-08
Pe
rcn
et
(%)
Writers Enrolled Province(writers) CBE writers
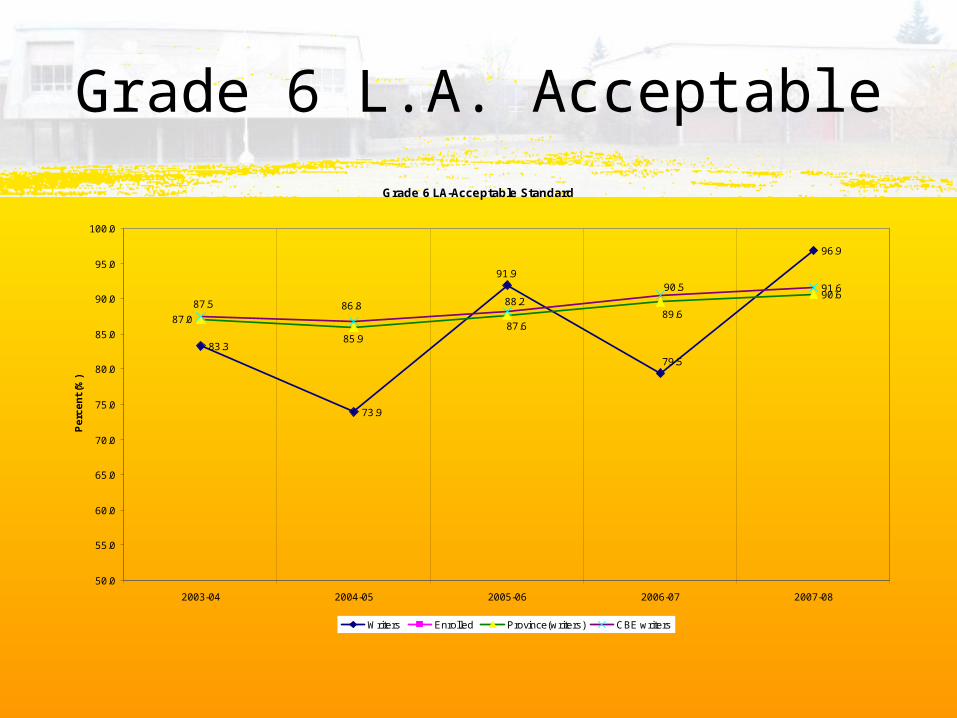
Grade 6 L.A. Acceptable
Grade 6 LA-Acceptable Standard
83.3
73.9
96.9
90.691.6
91.9
79.5
89.687.6
87.0
85.9
90.5
88.286.887.5
50.0
55.0
60.0
65.0
70.0
75.0
80.0
85.0
90.0
95.0
100.0
2003-04 2004-05 2005-06 2006-07 2007-08
Pe
rce
nt
(%)
Writers Enrolled Province(writers) CBE writers
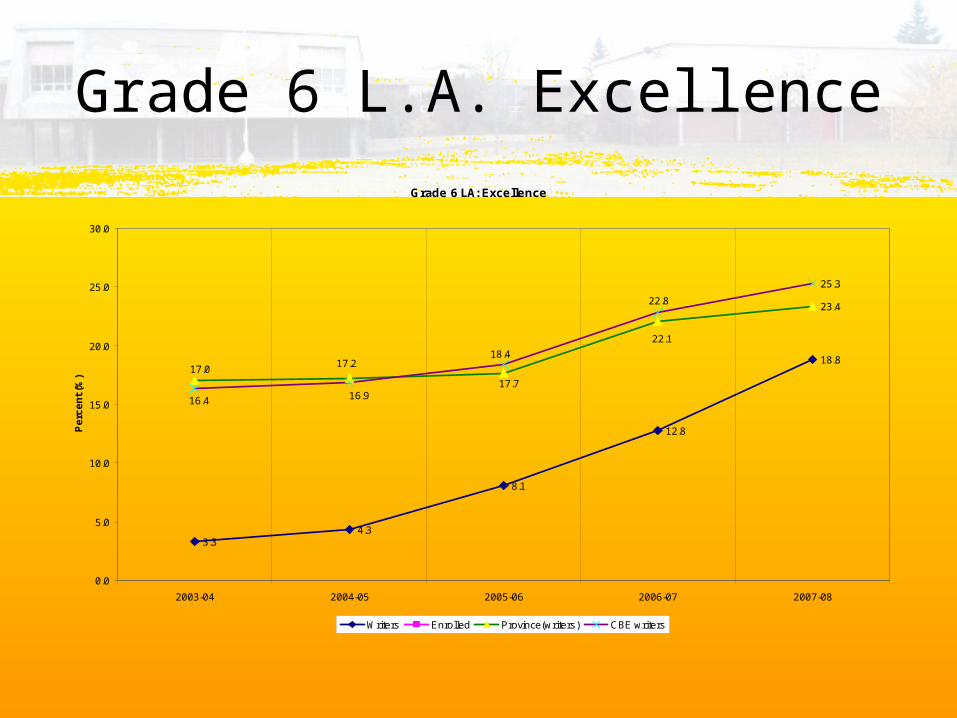
Grade 6 L.A. Excellence
Grade 6 LA: Excellence
3.34.3
8.1
12.8
18.8
23.4
25.3
17.017.2
17.7
22.1
16.4 16.9
18.4
22.8
0.0
5.0
10.0
15.0
20.0
25.0
30.0
2003-04 2004-05 2005-06 2006-07 2007-08
Pe
rce
nt
(%)
Writers Enrolled Province(writers) CBE writers
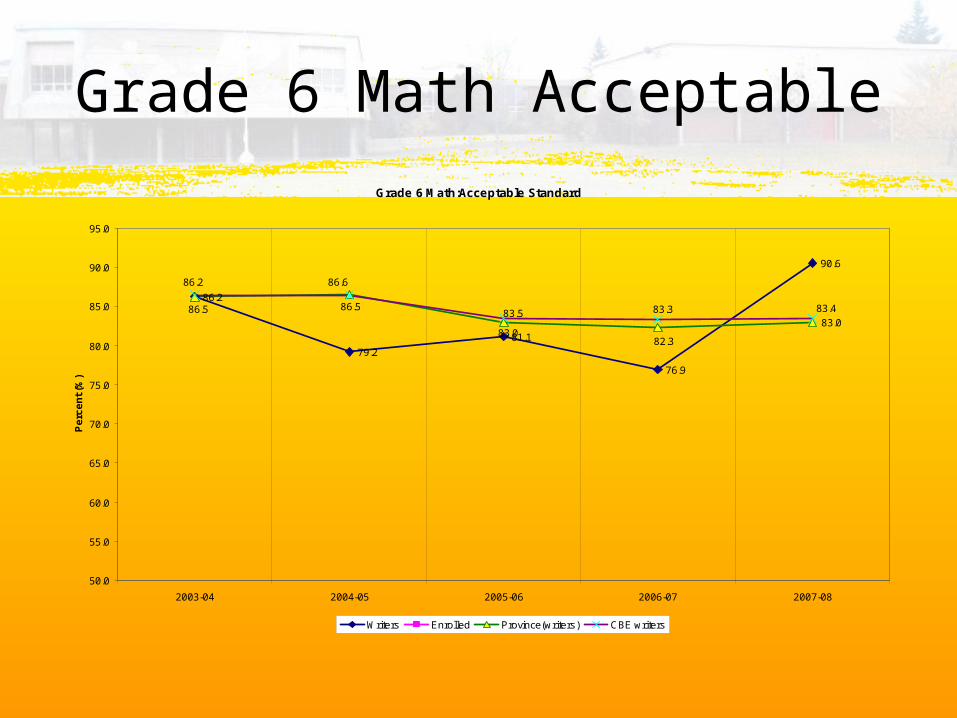
Grade 6 Math Acceptable
Grade 6 Math:Acceptable Standard
86.2
79.2
81.1
76.9
90.6
83.0
86.2 86.6
83.082.3
86.5 86.583.5 83.483.3
50.0
55.0
60.0
65.0
70.0
75.0
80.0
85.0
90.0
95.0
2003-04 2004-05 2005-06 2006-07 2007-08
Pe
rce
nt
(%)
Writers Enrolled Province(writers) CBE writers
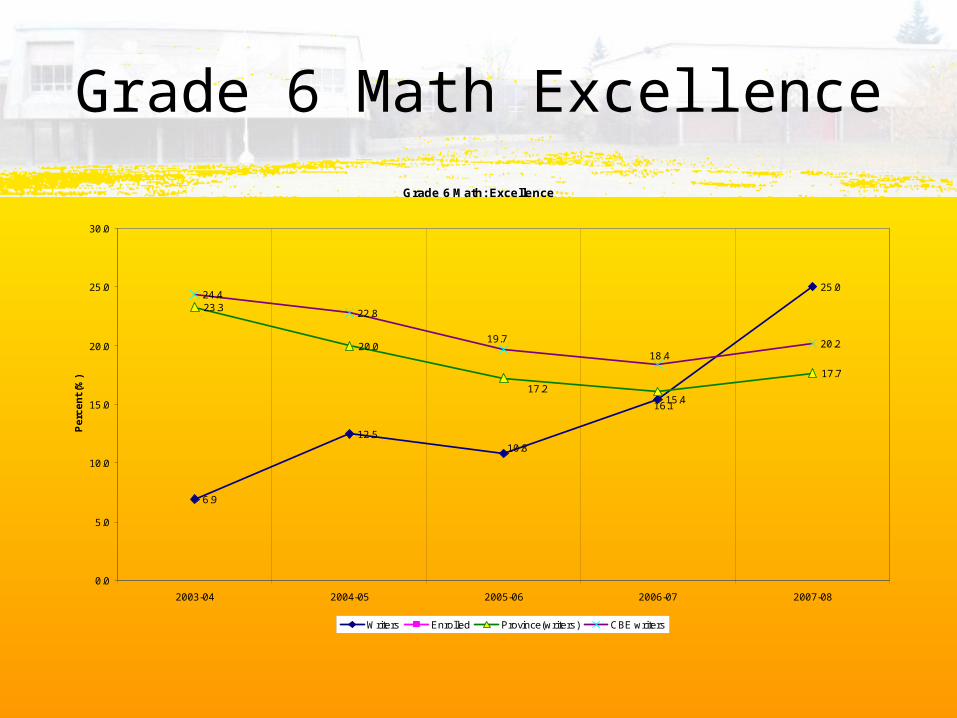
Grade 6 Math Excellence
Grade 6 Math: Excellence
6.9
12.5
15.4
25.0
23.3
20.0
17.7
24.4
22.8
20.2
10.8
17.2
16.1
19.7
18.4
0.0
5.0
10.0
15.0
20.0
25.0
30.0
2003-04 2004-05 2005-06 2006-07 2007-08
Pe
rce
nt
(%)
Writers Enrolled Province(writers) CBE writers
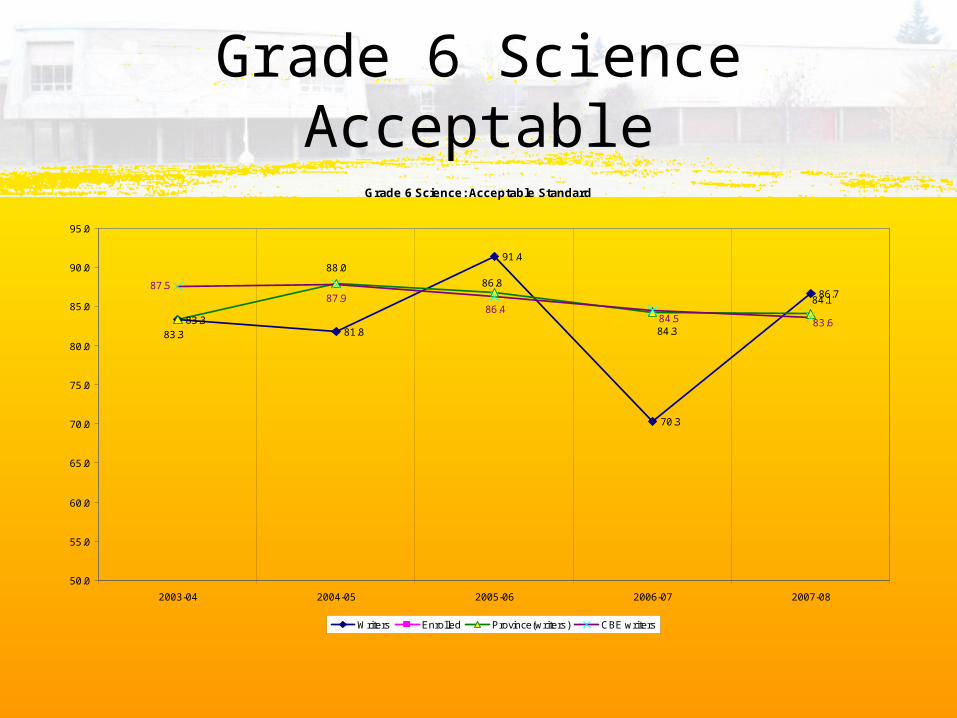
Grade 6 Science Acceptable
Grade 6 Science: Acceptable Standard
83.381.8
91.4
70.3
86.784.1
84.3
86.8
88.0
83.383.684.5
86.487.9
87.5
50.0
55.0
60.0
65.0
70.0
75.0
80.0
85.0
90.0
95.0
2003-04 2004-05 2005-06 2006-07 2007-08
Writers Enrolled Province(writers) CBE writers
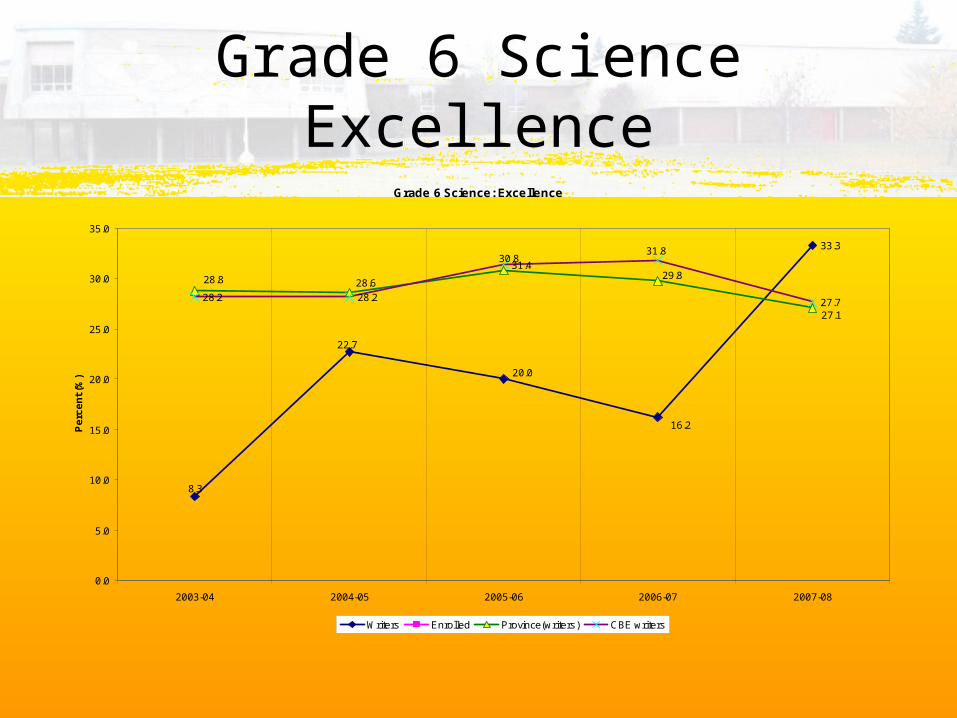
Grade 6 Science Excellence
Grade 6 Science: Excellence
33.3
28.2 28.2
31.4
27.7
20.0
22.7
8.3
16.2
28.8 28.6
30.8
29.8
27.1
31.8
0.0
5.0
10.0
15.0
20.0
25.0
30.0
35.0
2003-04 2004-05 2005-06 2006-07 2007-08
Pe
rce
nt
(%)
Writers Enrolled Province(writers) CBE writers
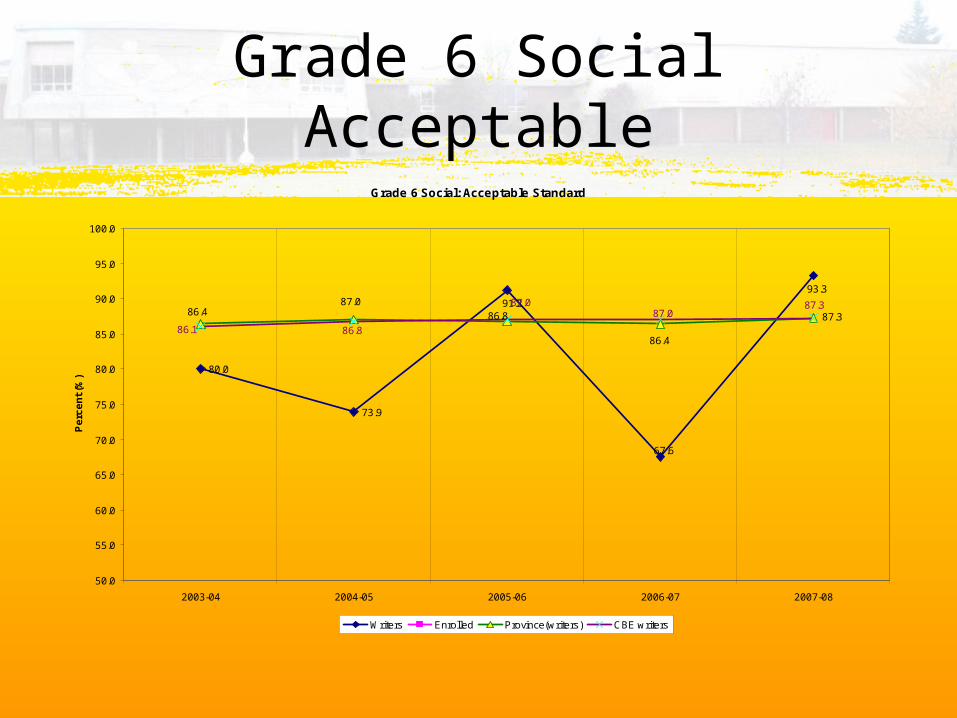
Grade 6 Social Acceptable
Grade 6 Social: Acceptable Standard
80.0
73.9
91.2
67.6
93.387.0
86.4 86.8 87.3
86.486.886.1
87.0 87.387.0
50.0
55.0
60.0
65.0
70.0
75.0
80.0
85.0
90.0
95.0
100.0
2003-04 2004-05 2005-06 2006-07 2007-08
Pe
rce
nt
(%)
Writers Enrolled Province(writers) CBE writers
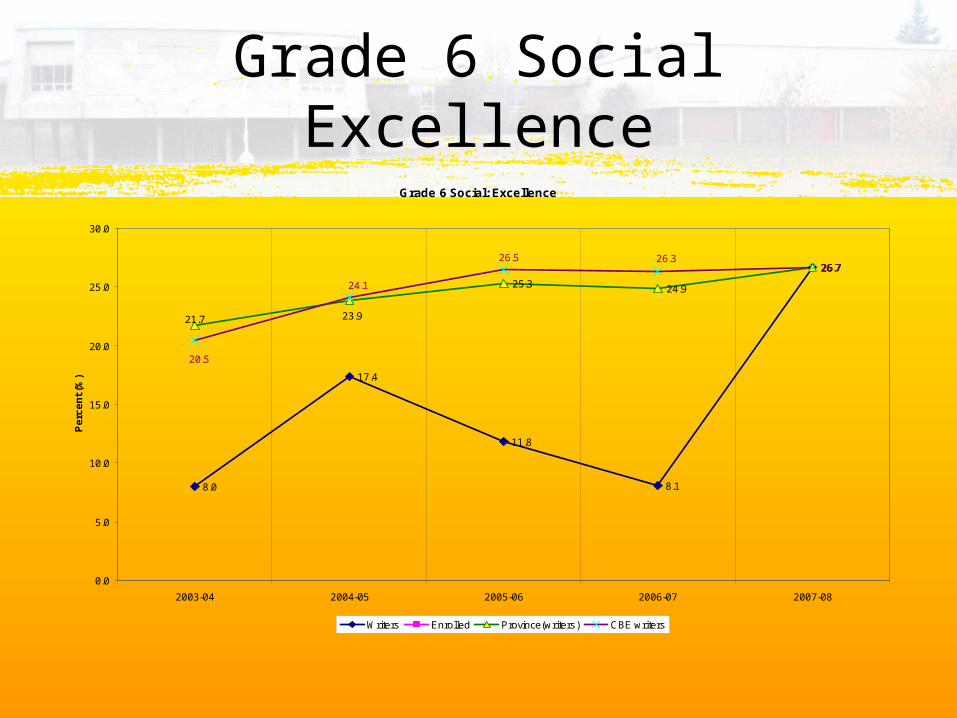
Grade 6 Social Excellence
Grade 6 Social: Excellence
8.0
17.4
11.8
8.1
26.7
25.3 24.9
26.726.7
21.7 23.9
20.5
24.1
26.5 26.3
0.0
5.0
10.0
15.0
20.0
25.0
30.0
2003-04 2004-05 2005-06 2006-07 2007-08
Pe
rce
nt
(%)
Writers Enrolled Province(writers) CBE writers
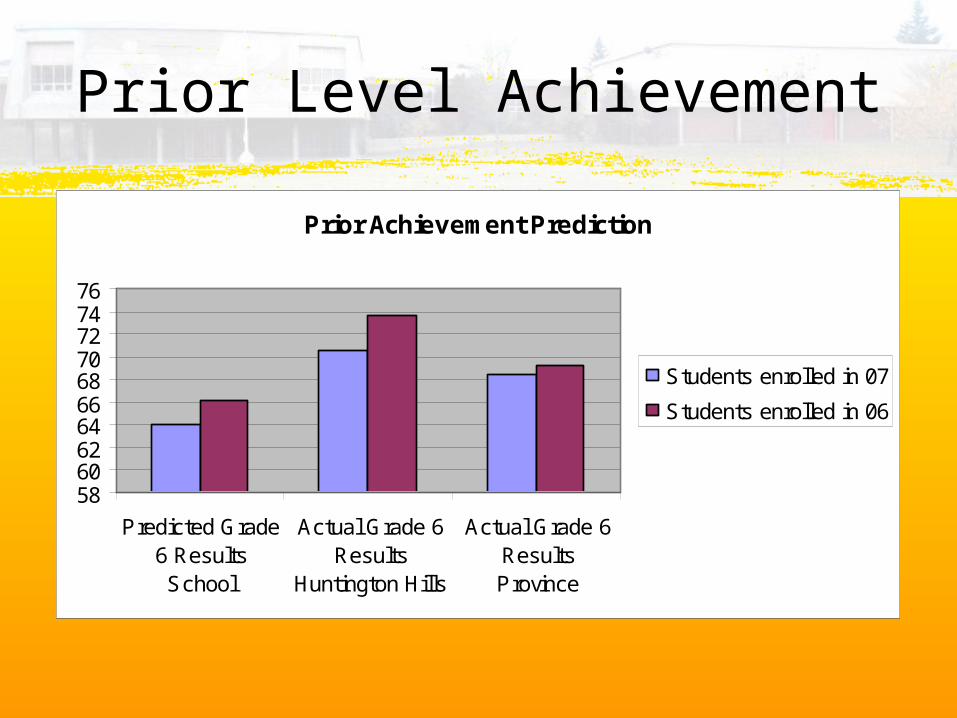
Prior Level Achievement
Prior Achievement Prediction
58606264666870727476
Predicted Grade6 ResultsSchool
Actual Grade 6Results
Huntington Hills
Actual Grade 6ResultsProvince
Students enrolled in 07
Students enrolled in 06
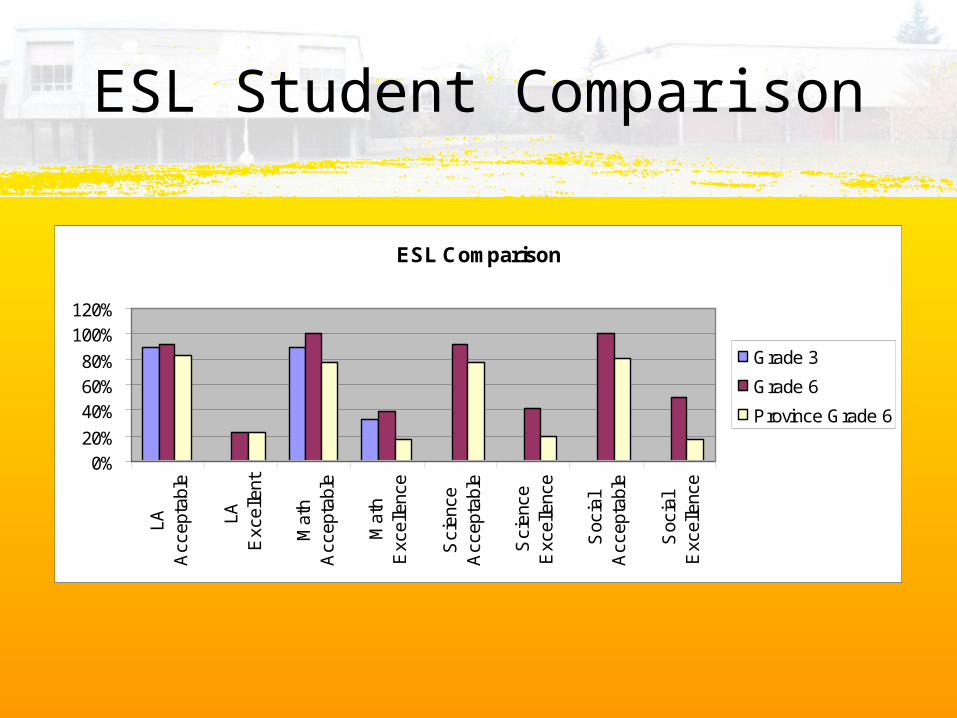
ESL Student Comparison
ESL Comparison
0%20%
40%60%80%
100%120%
LAA
ccep
tabl
e
LAE
xcel
lent
Mat
hA
ccep
tabl
e
Mat
hE
xcel
lenc
e
Sci
ence
Acc
epta
ble
Sci
ence
Exc
elle
nce
Soc
ial
Acc
epta
ble
Soc
ial
Exc
elle
nce
Grade 3
Grade 6
Province Grade 6
Goals for 08 09 Academic Year
• Decrease of 1% in the number of students earning ones or twos on the "communicates understanding/information" on the electronic report card between the November and June reporting period.
• By 2009/10, we will be sustaining achievement rate trends that show a narrowing gap between our results and the province.
• Decrease of 1% in the number of students receiving 2’s and 1’s in personal growth sections of their report card.

Steps to Reach Our Goals
• Resource Acquisition
• Culture of continuous improvement– Professional Learning Community– Early Dismissal times, PD Days
• Technology Integration
• Library upgrade
• Staffing
• Accessing system supports