Embed Size (px)
Citation preview

1
Hurricane Katrina, A Climatological Perspective October 2005, Updated January 2006
1. Introduction Hurricane Katrina appears to be the most costly natural disaster to strike the United States ever, and the deadliest since the Lake Okeechobee disaster (hurricane) of September, 1928. In addition, Katrina was one of the strongest storms to impact the coast of the United States during the last 100 years. At landfall, sustained winds were 127 mph (a strong Category 3 hurricane on the Saffir-Simpson scale—see Figure 2), and the minimum central pressure was the third lowest on record (920 mb). Katrina caused widespread, massive devastation along the central Gulf Coast states of the U.S. The flooding of New Orleans, LA following the passage of Katrina was catastrophic, resulting in the displacement of more than 250,000 people, a higher number than during the Dust Bowl years of the 1930’s. As of early December, the death toll exceeded 1300 and damage estimates were in excess of $100 billion. For information in addition to this climatological report, NOAA’s National Hurricane Center has a detailed report online: http://www.nhc.noaa.gov/2005atlan.shtml 2. Description and Impacts 2.1 Storm Chronology During August 25-31, 2005, Hurricane Katrina created a path of destruction across southern Florida, and caused devastation into parts of southeast Louisiana, Mississippi, and Alabama. The storm then tracked northward into Tennessee and Kentucky and points northeast from there, where heavy rainfall was the main impact of the storm. Katrina began as a tropical depression 175 miles southeast of Nassau on August 23 and strengthened into Tropical Storm Katrina the next day as it moved erratically through the central Bahamas. (See Figure 1 for the path of Katrina.) Katrina began strengthening rapidly and a hurricane watch was issued for southeast Florida at 1700 EDT followed by a hurricane warning by 2300 EDT. Katrina moved slowly westward and became a minimal Category 1 hurricane 15 miles east northeast of Fort Lauderdale at 1700 EDT on August 25. At 1830 EDT, the hurricane made landfall between Hallandale Beach and North Miami Beach with sustained winds estimated at 80 mph and gusts of above 90 mph. Though the storm moved southwest across the tip of the Florida peninsula during the night, Katrina's winds decreased only slightly and it quickly re-intensified shortly after moving over the warm waters of the Gulf. In addition to the gusty winds, heavy rains accompanied Katrina in her trek across Florida. Although the storm over Florida never had sustained winds higher than 80 mph, substantial damage and flooding occurred and fourteen people lost their lives. Katrina moved almost due westward after entering the Gulf of Mexico. A mid-level ridge centered over Texas weakened and moved westward allowing Katrina to gradually turn to the northwest and then north into the weakness in the ridging over the days that followed. Atmospheric and sea-surface conditions (an upper level anticyclone over the Gulf and warm sea
2
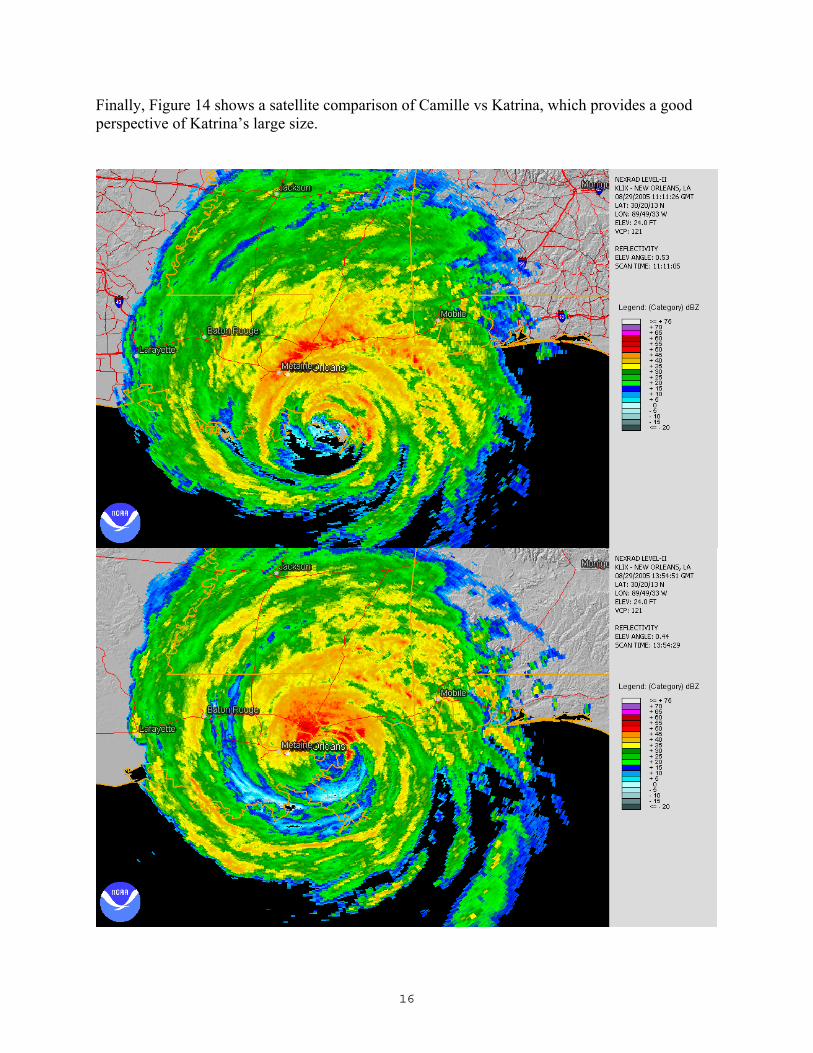
surface temperatures – see Figure 7) were conducive to the cyclone's rapid intensification, which led to Katrina attaining 'major hurricane' status on the afternoon of the 26th. Continuing to strengthen, a hurricane watch was issued by NOAA’s National Hurricane Center for parts of Louisiana at 10:00 CDT on August 27 and a hurricane warning was issued for the north central Gulf from Morgan City eastward to the Alabama / Florida border at 10 PM CDT. By 0700 CDT on Sunday, August 28, Hurricane Katrina reached Category 5 status with wind speeds of 160 mph and a pressure of 908 millibars. Three hours later, the maximum sustained wind speeds peaked near 175 mph and remained at that speed until the afternoon. At 1600 CDT, Katrina’s minimum central pressure dropped to 902 mb - the 4th lowest on record at that time for an Atlantic storm. (Note: Three week later, Hurricane Rita reached an intensity of 897 millibars on September 22 – the 3rd lowest on record for an Atlantic storm and knocked Katrina’s record to 5th lowest pressure.) By this time Katrina was at its peak strength with hurricane force winds extending outward up to 105 miles from the center and tropical storm force winds extending outward up to 230 miles. Sustained tropical storm force winds were already battering the southeast Louisiana coast. Though the storm was comparable to Camille's intensity, it was a significantly larger storm (see Figure 14). Ominously, the 4 PM CDT Bulletin from the National Hurricane Center warned of coastal storm surge flooding of 18 to 22 feet above normal tide levels … locally as high as 28 feet, and stated “Some levees in the Greater New Orleans Area could be overtopped.” Katrina advanced toward Louisiana during the night, and by 0400 CDT on Monday, August 29, the center was 90 miles south southeast of New Orleans. Though winds near the center had dropped to 150 mph, gusts to hurricane force were occurring along the coast. NOAA Buoy 42040 located about 50 miles east of the mouth of the Mississippi River reported wave heights of over 55 feet. At 0610 AM CDT, Katrina made landfall in Plaquemines Parish just south of Buras (between Grand Isle and the mouth of the Mississippi River) as a strong Category 3 storm, despite entrainment of dryer air and an opening of the eyewall to the south and southwest. Landfalling wind speeds were approximately 127 mph with a central pressure of 920 millibars – the 3rd lowest pressure on record for a landfalling storm in the U.S. Winds at this time were gusting to 96 mph at the Naval Air Station at Belle Chasse, LA and to 85 mph at New Orleans Lakefront. By 0800 CDT, Katrina was only 40 miles southeast of New Orleans with hurricane force winds extending outward up to 125 miles. In the dangerous right front quadrant of the storm, Pascagoula Mississippi Civil Defense reported a wind gust to 119 mph and Gulfport Emergency Operations Center reported sustained winds of 94 mph with a gust to 100 mph. New Orleans Lakefront reported sustained winds of 69 mph with gusts to 86 mph. A little earlier, Belle Chasse reported a gust to 105 mph. By 1000 CDT, the eye of Katrina was making its second northern Gulf coast landfall near the Louisiana – Mississippi border. The northern eyewall was still reported to be very intense by WSR-88D radar data and the intensity was estimated to be near 125 mph. Even an hour later and far from the center, Dauphin Island, AL reported sustained winds of 76 mph with a gust to 102 mph, Mobile reported a gust to 83 mph, and Pensacola, FL reported a gust of 69 mph.
3
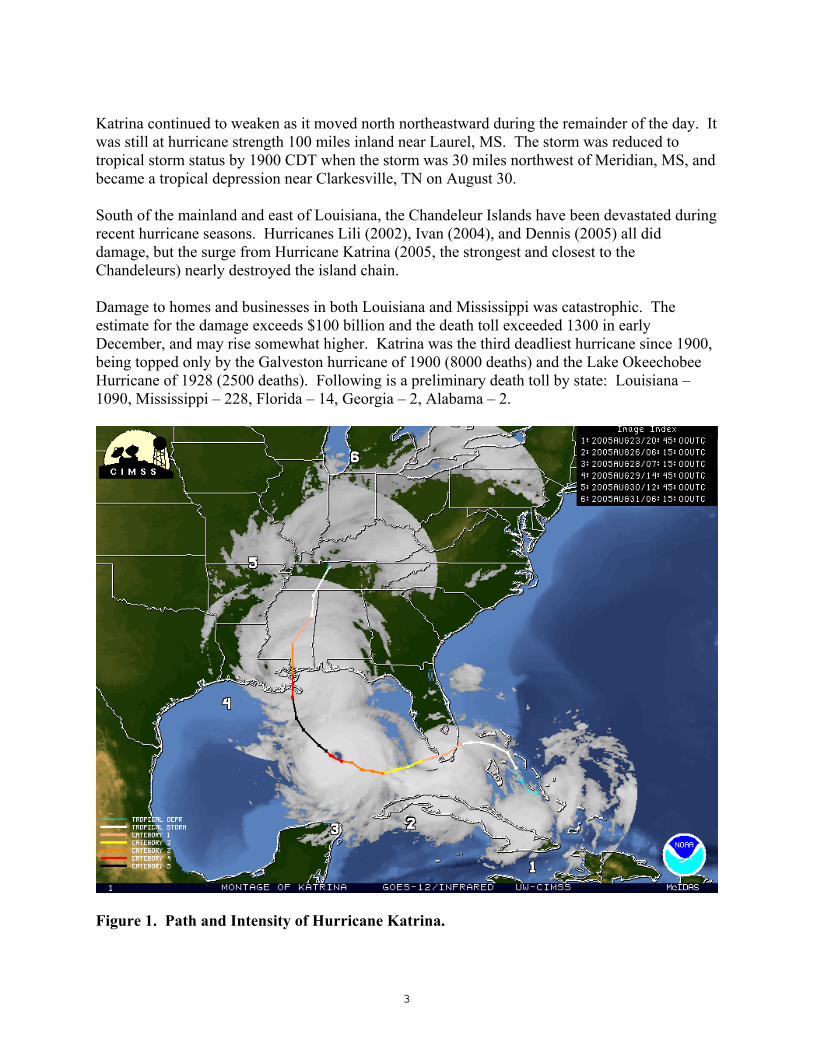
Katrina continued to weaken as it moved north northeastward during the remainder of the day. It was still at hurricane strength 100 miles inland near Laurel, MS. The storm was reduced to tropical storm status by 1900 CDT when the storm was 30 miles northwest of Meridian, MS, and became a tropical depression near Clarkesville, TN on August 30. South of the mainland and east of Louisiana, the Chandeleur Islands have been devastated during recent hurricane seasons. Hurricanes Lili (2002), Ivan (2004), and Dennis (2005) all did damage, but the surge from Hurricane Katrina (2005, the strongest and closest to the Chandeleurs) nearly destroyed the island chain. Damage to homes and businesses in both Louisiana and Mississippi was catastrophic. The estimate for the damage exceeds $100 billion and the death toll exceeded 1300 in early December, and may rise somewhat higher. Katrina was the third deadliest hurricane since 1900, being topped only by the Galveston hurricane of 1900 (8000 deaths) and the Lake Okeechobee Hurricane of 1928 (2500 deaths). Following is a preliminary death toll by state: Louisiana – 1090, Mississippi – 228, Florida – 14, Georgia – 2, Alabama – 2.
Figure 1. Path and Intensity of Hurricane Katrina.
4
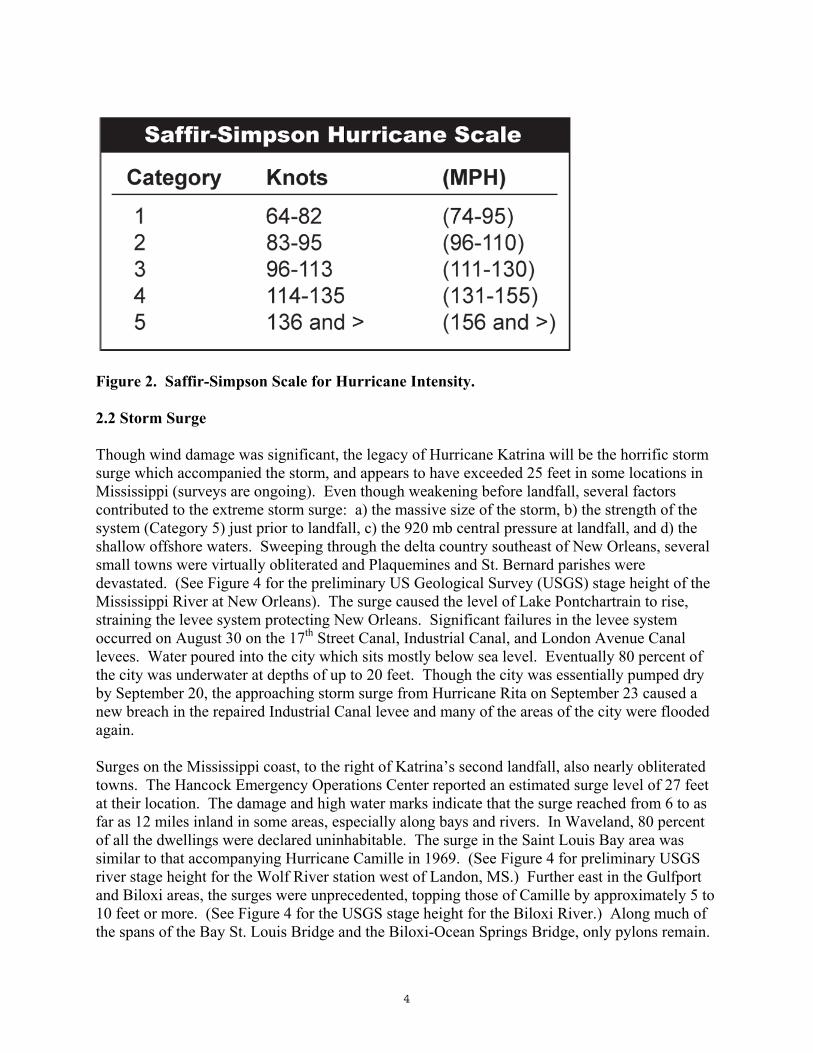
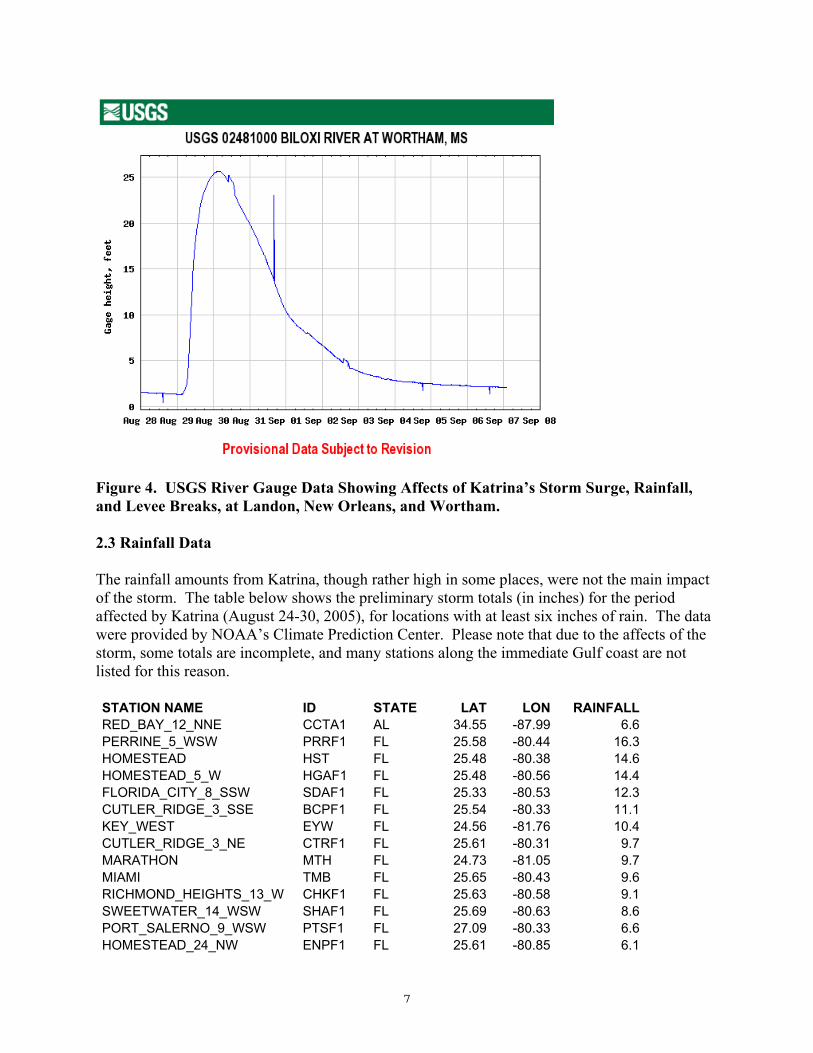
Figure 2. Saffir-Simpson Scale for Hurricane Intensity. 2.2 Storm Surge Though wind damage was significant, the legacy of Hurricane Katrina will be the horrific storm surge which accompanied the storm, and appears to have exceeded 25 feet in some locations in Mississippi (surveys are ongoing). Even though weakening before landfall, several factors contributed to the extreme storm surge: a) the massive size of the storm, b) the strength of the system (Category 5) just prior to landfall, c) the 920 mb central pressure at landfall, and d) the shallow offshore waters. Sweeping through the delta country southeast of New Orleans, several small towns were virtually obliterated and Plaquemines and St. Bernard parishes were devastated. (See Figure 4 for the preliminary US Geological Survey (USGS) stage height of the Mississippi River at New Orleans). The surge caused the level of Lake Pontchartrain to rise, straining the levee system protecting New Orleans. Significant failures in the levee system occurred on August 30 on the 17th Street Canal, Industrial Canal, and London Avenue Canal levees. Water poured into the city which sits mostly below sea level. Eventually 80 percent of the city was underwater at depths of up to 20 feet. Though the city was essentially pumped dry by September 20, the approaching storm surge from Hurricane Rita on September 23 caused a new breach in the repaired Industrial Canal levee and many of the areas of the city were flooded again. Surges on the Mississippi coast, to the right of Katrina’s second landfall, also nearly obliterated towns. The Hancock Emergency Operations Center reported an estimated surge level of 27 feet at their location. The damage and high water marks indicate that the surge reached from 6 to as far as 12 miles inland in some areas, especially along bays and rivers. In Waveland, 80 percent of all the dwellings were declared uninhabitable. The surge in the Saint Louis Bay area was similar to that accompanying Hurricane Camille in 1969. (See Figure 4 for preliminary USGS river stage height for the Wolf River station west of Landon, MS.) Further east in the Gulfport and Biloxi areas, the surges were unprecedented, topping those of Camille by approximately 5 to 10 feet or more. (See Figure 4 for the USGS stage height for the Biloxi River.) Along much of the spans of the Bay St. Louis Bridge and the Biloxi-Ocean Springs Bridge, only pylons remain.
5
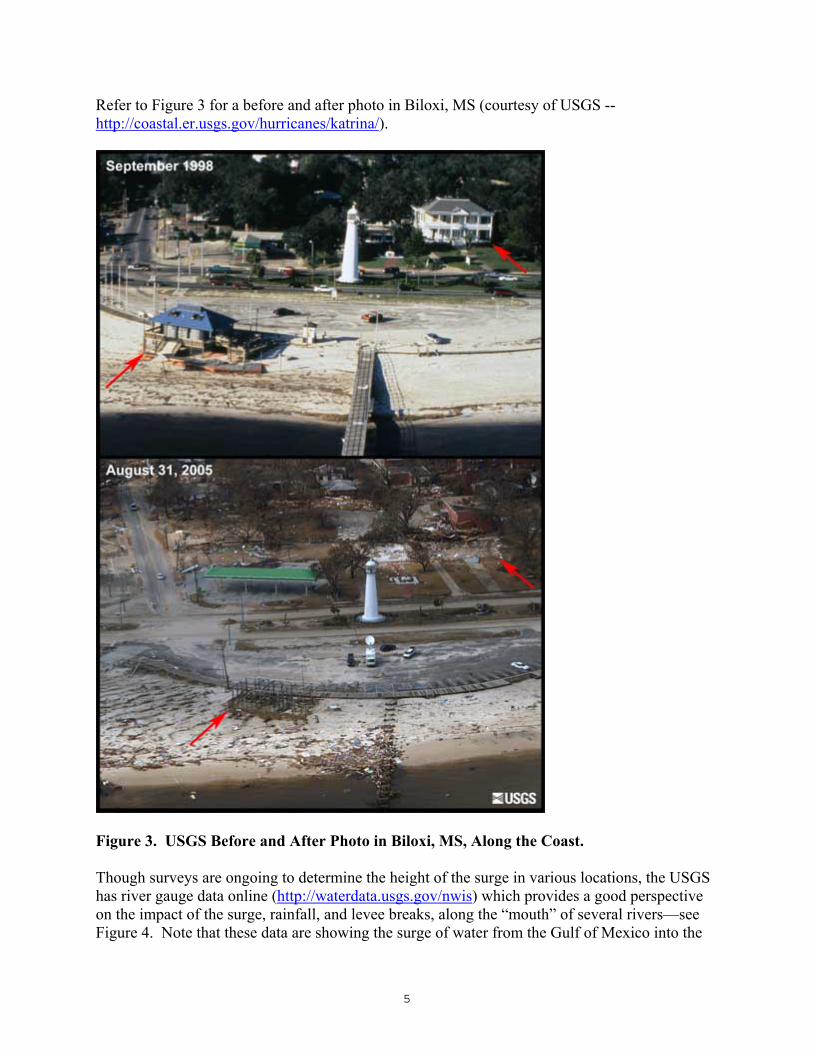
Refer to Figure 3 for a before and after photo in Biloxi, MS (courtesy of USGS -- http://coastal.er.usgs.gov/hurricanes/katrina/).
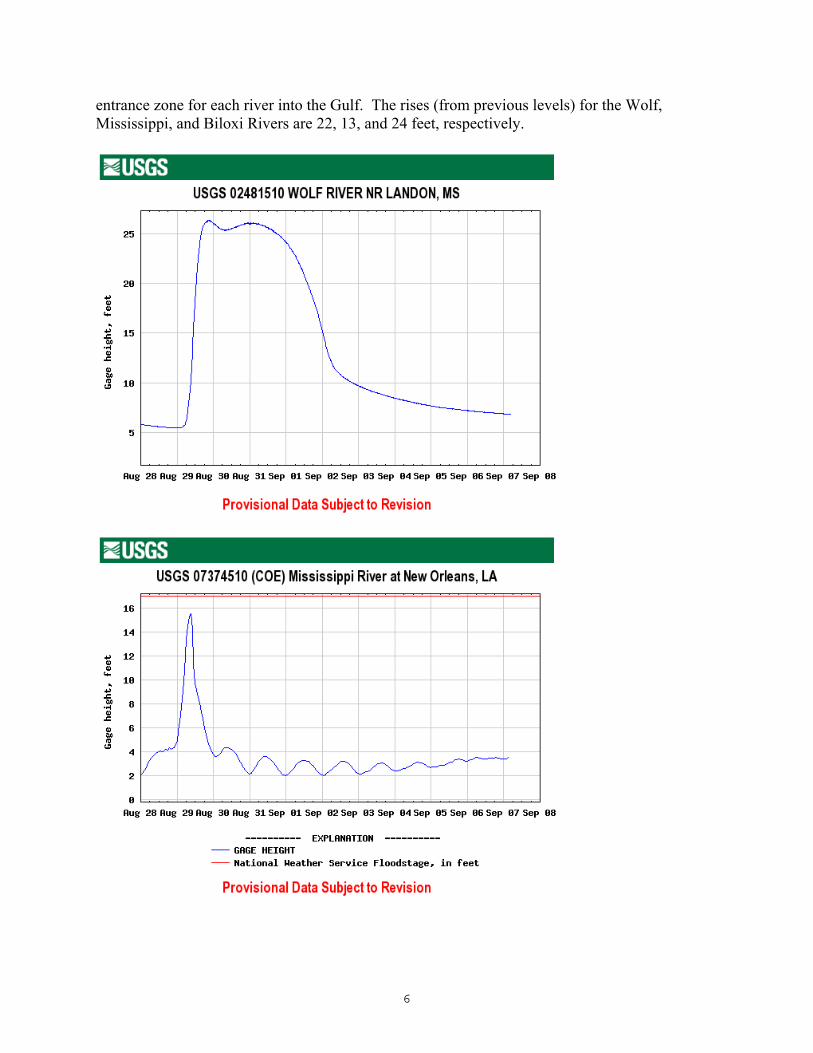
Figure 3. USGS Before and After Photo in Biloxi, MS, Along the Coast. Though surveys are ongoing to determine the height of the surge in various locations, the USGS has river gauge data online (http://waterdata.usgs.gov/nwis) which provides a good perspective on the impact of the surge, rainfall, and levee breaks, along the “mouth” of several rivers—see Figure 4. Note that these data are showing the surge of water from the Gulf of Mexico into the
6
entrance zone for each river into the Gulf. The rises (from previous levels) for the Wolf, Mississippi, and Biloxi Rivers are 22, 13, and 24 feet, respectively.
7
Figure 4. USGS River Gauge Data Showing Affects of Katrina’s Storm Surge, Rainfall, and Levee Breaks, at Landon, New Orleans, and Wortham. 2.3 Rainfall Data The rainfall amounts from Katrina, though rather high in some places, were not the main impact of the storm. The table below shows the preliminary storm totals (in inches) for the period affected by Katrina (August 24-30, 2005), for locations with at least six inches of rain. The data were provided by NOAA’s Climate Prediction Center. Please note that due to the affects of the storm, some totals are incomplete, and many stations along the immediate Gulf coast are not listed for this reason. STATION NAME ID STATE LAT LON RAINFALL RED_BAY_12_NNE CCTA1 AL 34.55 -87.99 6.6 PERRINE_5_WSW PRRF1 FL 25.58 -80.44 16.3 HOMESTEAD HST FL 25.48 -80.38 14.6 HOMESTEAD_5_W HGAF1 FL 25.48 -80.56 14.4 FLORIDA_CITY_8_SSW SDAF1 FL 25.33 -80.53 12.3 CUTLER_RIDGE_3_SSE BCPF1 FL 25.54 -80.33 11.1 KEY_WEST EYW FL 24.56 -81.76 10.4 CUTLER_RIDGE_3_NE CTRF1 FL 25.61 -80.31 9.7 MARATHON MTH FL 24.73 -81.05 9.7 MIAMI TMB FL 25.65 -80.43 9.6 RICHMOND_HEIGHTS_13_W CHKF1 FL 25.63 -80.58 9.1 SWEETWATER_14_WSW SHAF1 FL 25.69 -80.63 8.6 PORT_SALERNO_9_WSW PTSF1 FL 27.09 -80.33 6.6 HOMESTEAD_24_NW ENPF1 FL 25.61 -80.85 6.1
8
CUTLER_RIDGE_4_S BBBF1 FL 25.52 -80.35 6.0 MOUNT_VERNON MTVI3 IN 37.95 -87.88 7.6 POSEYVILLE POSI3 IN 38.17 -87.78 6.9 HOPKINSVILLE_4_SW HOPK2 KY 36.85 -87.55 11.9 COBB CBBK2 KY 36.98 -87.78 9.1 FINNEY BRRK2 KY 36.90 -86.13 8.7 ABERDEEN ABEK2 KY 37.23 -86.68 7.2 BARDSTOWN BTNK2 KY 37.80 -85.47 7.1 BOWLING_GREEN BWG KY 36.96 -86.42 7.1 DAM_49_UNION UNWK2 KY 37.80 -87.98 7.1 NOLIN NOLK2 KY 37.28 -86.25 7.0 BOSTON_6_SW BOSK2 KY 37.75 -85.75 6.5 PROVIDENCE PDNK2 KY 37.40 -87.77 6.5 BROOKSVILLE_2_SW PWVK2 KY 38.65 -84.10 6.1 BIG_BRANCH LA 30.55 -89.93 14.8 NEW_ORLEANS NORL1 LA 29.93 -90.14 13.6 LAPLACE_5_NE WSLL1 LA 30.10 -90.42 12.9 HAMMOND_5_E ROBL1 LA 30.51 -90.36 11.9 NATALBANY LA 30.55 -90.48 10.5 BUSH BSHL1 LA 30.63 -89.90 10.3 PEARL_RIVER PERL1 LA 30.39 -89.74 9.8 KENNER LA 30.13 -90.23 9.7 COVINGTON CVEL1 LA 30.48 -90.09 9.6 COVINGTON CUSL1 LA 30.49 -90.17 9.6 VENICE VNCL1 LA 29.28 -89.35 8.8 VENICE BVE LA 29.33 -89.42 8.8 SLIDELL_10_SSW LIBL1 LA 30.14 -89.86 7.4 NEW_ORLEANS MSY LA 29.99 -90.26 7.2 COVINGTON LA 30.48 -90.11 7.2 FRANKLINTON FRNL1 LA 30.84 -90.16 7.1 DULAC_5_E PCDL1 LA 29.39 -90.62 6.8 YCLOSKEY BLYL1 LA 29.84 -89.69 6.2 COVINGTON_7_NW CGSL1 LA 30.56 -90.15 6.0 NECAISE_1_N NNHM6 MS 30.62 -89.41 10.1 HANCOCK MS 30.39 -89.47 9.8 TROY_2_SE TROM6 MS 34.09 -88.86 8.6 SARAH_1_W SARM6 MS 34.58 -90.22 8.5 NOXAPATER_1_N NXPM6 MS 33.02 -89.05 8.3 COLUMBIA_6_WSW RMAM6 MS 31.21 -89.92 8.2 IUKA_5_S IKAM6 MS 34.73 -88.18 8.1 CAESAR_3_WSW CREM6 MS 30.57 -89.59 7.8 WIGGINS_6_E BLCM6 MS 30.85 -89.03 7.6 HOLCUT HCTM6 MS 34.73 -88.30 7.5 ACKERMAN_3_SE TNFM6 MS 33.28 -89.14 7.5 HATTIESBURG HBG MS 31.27 -89.25 7.3 KOSCIUSKO KOSM6 MS 33.05 -89.60 6.9 BROOKLYN_1_SW BKNM6 MS 31.05 -89.20 6.8 KOSCIUSKO_13_SE KSOM6 MS 32.98 -89.39 6.8 CONEHATTA MS 32.46 -89.27 6.8 PHILADELPHIA_5_N PLAM6 MS 32.84 -89.10 6.7
9
FOREST_7_N FSTM6 MS 32.31 -89.49 6.5 PHILADELPHIA_3_SSE RNEM6 MS 32.73 -89.10 6.5 YAZOO_CITY_5_NNE YAZM6 MS 32.90 -90.38 6.5 YAZOO_CITY MS 32.86 -90.41 6.5 BRUCE_2_W BRUM6 MS 34.00 -89.37 6.3 DENNIS_6_WSW DNNM6 MS 34.52 -88.32 6.2 WIGGINS_13_E WGAM6 MS 30.85 -88.91 6.2 ABERDEEN ABEM6 MS 33.83 -88.52 6.2 ARKABUTLA ARKM6 MS 34.76 -90.12 6.2 EDINBURG ENBM6 MS 32.80 -89.33 6.1 SANFORD OKCM6 MS 31.49 -89.43 6.1 LAUREL_17_SE LAUM6 MS 31.53 -88.89 6.0 THREE_RIVERS PCBM6 MS 30.58 -88.57 6.0 CORINTH CORM6 MS 34.92 -88.52 6.0 BLACK_MOUNTAIN_10_NNE MMTN7 NC 35.76 -82.27 7.6 NASHVILLE NSHO1 OH 40.61 -82.16 6.5 PHARISBURG PBGO1 OH 40.35 -83.30 6.2 NEWARK NWKO1 OH 40.05 -82.39 6.0 GEORGETOWN_2_NE BCAO1 OH 38.88 -83.89 6.0 MASTEN_1_S MASP1 PA 41.50 -76.82 6.0 OBION_2_SW OBNT1 TN 36.24 -89.22 7.3 FAIRVIEW FBNT1 TN 35.99 -87.12 6.9 WHITE_HOUSE_1_S WHST1 TN 36.45 -86.65 6.4 DYERSBURG_10_W MGLT1 TN 36.05 -89.56 6.4 BETHPAGE_1_S BETT1 TN 36.47 -86.32 6.3 SPRINGFIELD_3_SE SPRT1 TN 36.47 -86.83 6.3 COLLINWOOD CLLT1 TN 35.17 -87.75 6.2 BOGOTA BOGT1 TN 36.13 -89.43 6.1 ORLINDA ODAT1 TN 36.60 -86.70 6.0 WINFIELD WINW2 WV 38.53 -81.92 6.0
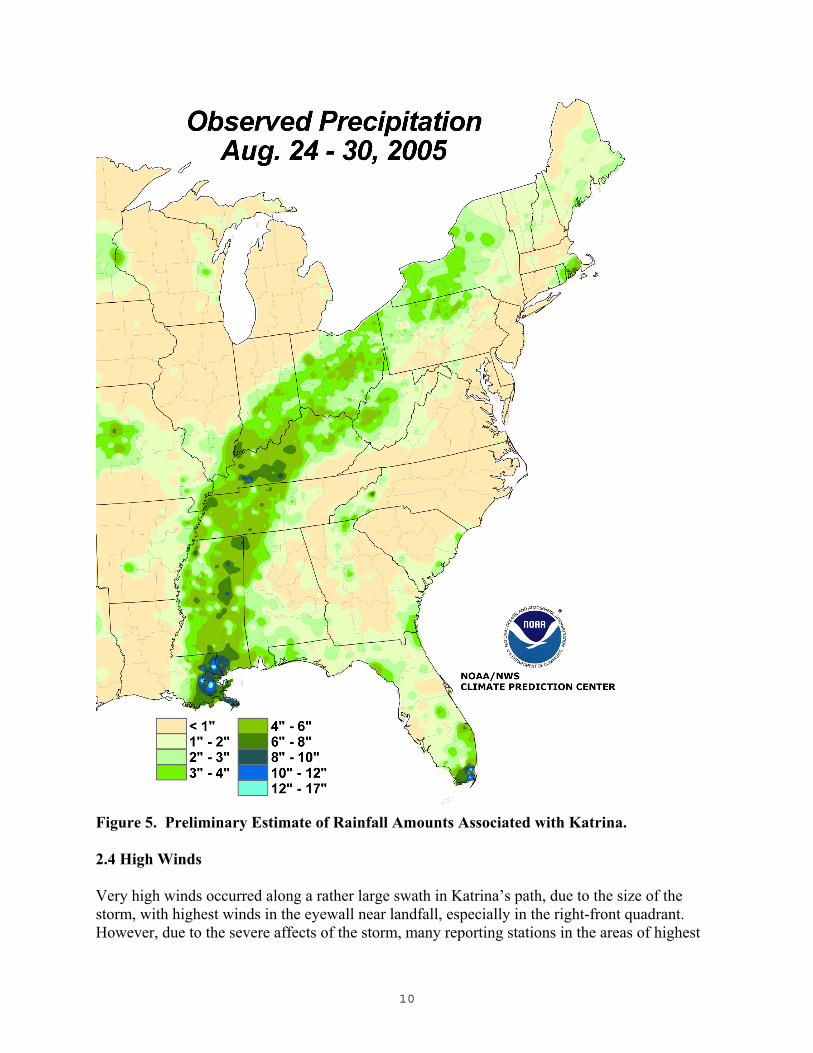
Figure 5 from NOAA’s Climate Prediction Center provides a general picture of the rainfall amounts. Heaviest rainfall occurred in southeast Louisiana, then across parts of Mississippi, western Tennessee, and western Kentucky.
10
Figure 5. Preliminary Estimate of Rainfall Amounts Associated with Katrina. 2.4 High Winds Very high winds occurred along a rather large swath in Katrina’s path, due to the size of the storm, with highest winds in the eyewall near landfall, especially in the right-front quadrant. However, due to the severe affects of the storm, many reporting stations in the areas of highest
11
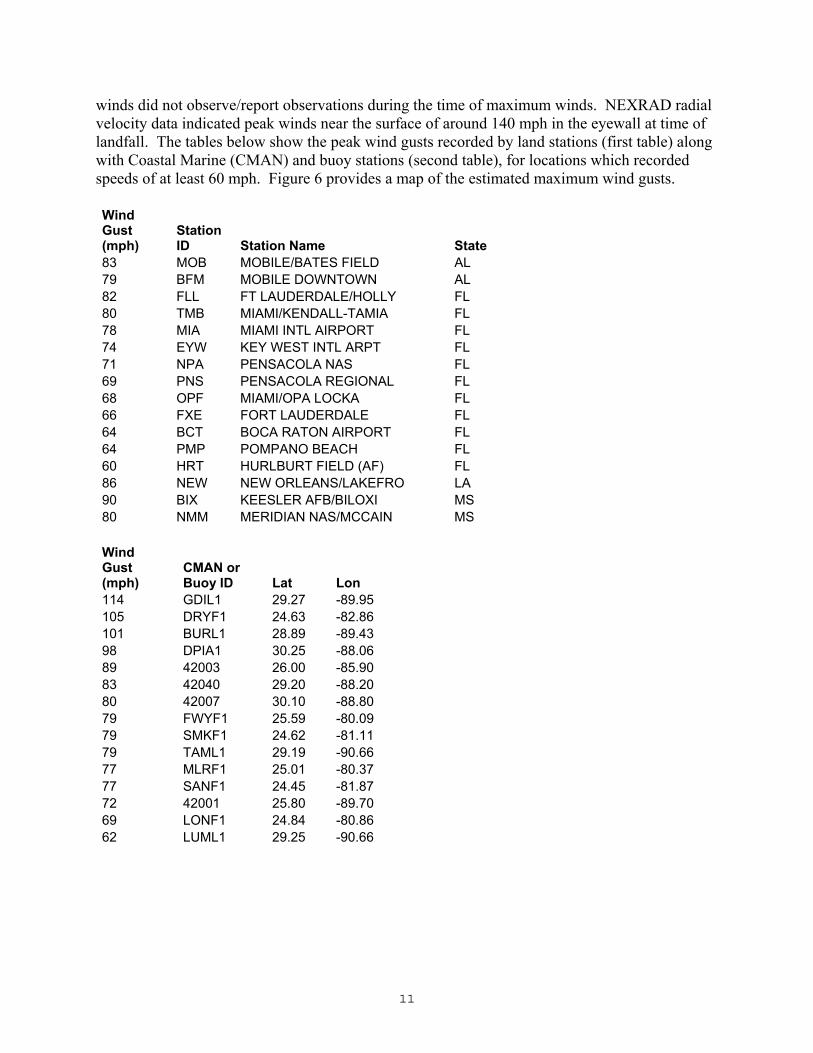
winds did not observe/report observations during the time of maximum winds. NEXRAD radial velocity data indicated peak winds near the surface of around 140 mph in the eyewall at time of landfall. The tables below show the peak wind gusts recorded by land stations (first table) along with Coastal Marine (CMAN) and buoy stations (second table), for locations which recorded speeds of at least 60 mph. Figure 6 provides a map of the estimated maximum wind gusts. Wind Gust (mph)
Station ID Station Name State
83 MOB MOBILE/BATES FIELD AL 79 BFM MOBILE DOWNTOWN AL 82 FLL FT LAUDERDALE/HOLLY FL 80 TMB MIAMI/KENDALL-TAMIA FL 78 MIA MIAMI INTL AIRPORT FL 74 EYW KEY WEST INTL ARPT FL 71 NPA PENSACOLA NAS FL 69 PNS PENSACOLA REGIONAL FL 68 OPF MIAMI/OPA LOCKA FL 66 FXE FORT LAUDERDALE FL 64 BCT BOCA RATON AIRPORT FL 64 PMP POMPANO BEACH FL 60 HRT HURLBURT FIELD (AF) FL 86 NEW NEW ORLEANS/LAKEFRO LA 90 BIX KEESLER AFB/BILOXI MS 80 NMM MERIDIAN NAS/MCCAIN MS
Wind Gust (mph)
CMAN or Buoy ID Lat Lon
114 GDIL1 29.27 -89.95 105 DRYF1 24.63 -82.86 101 BURL1 28.89 -89.43 98 DPIA1 30.25 -88.06 89 42003 26.00 -85.90 83 42040 29.20 -88.20 80 42007 30.10 -88.80 79 FWYF1 25.59 -80.09 79 SMKF1 24.62 -81.11 79 TAML1 29.19 -90.66 77 MLRF1 25.01 -80.37 77 SANF1 24.45 -81.87 72 42001 25.80 -89.70 69 LONF1 24.84 -80.86 62 LUML1 29.25 -90.66
12
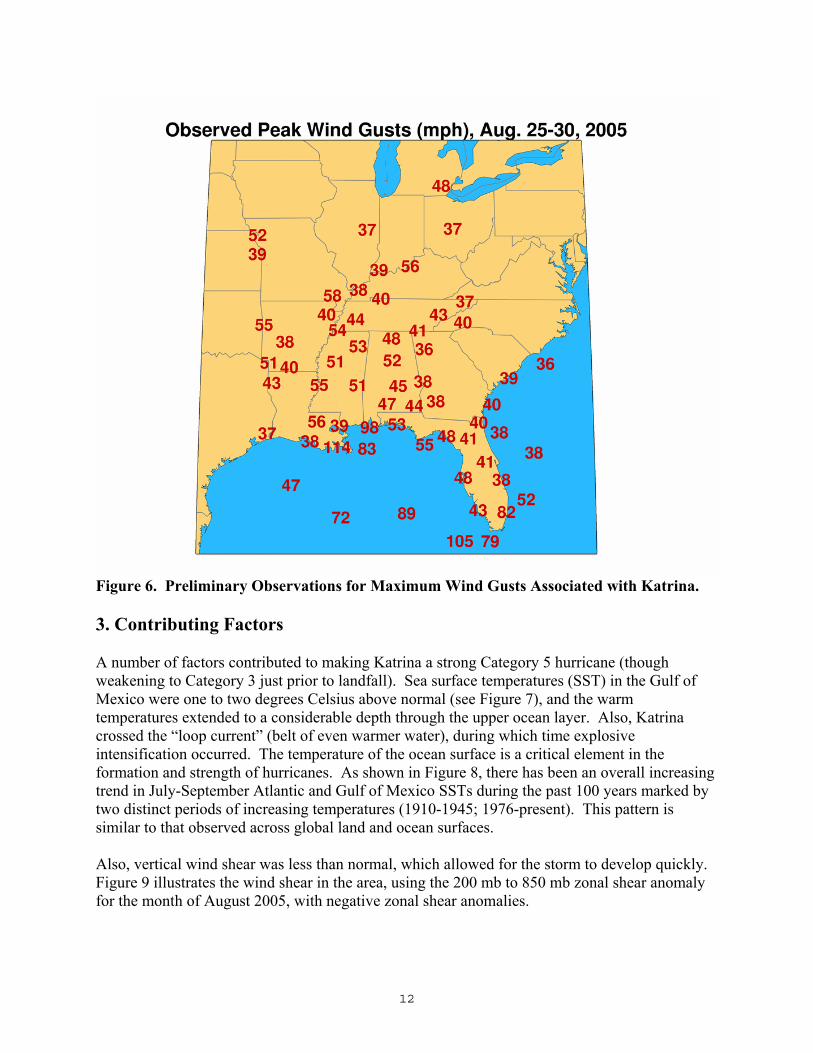
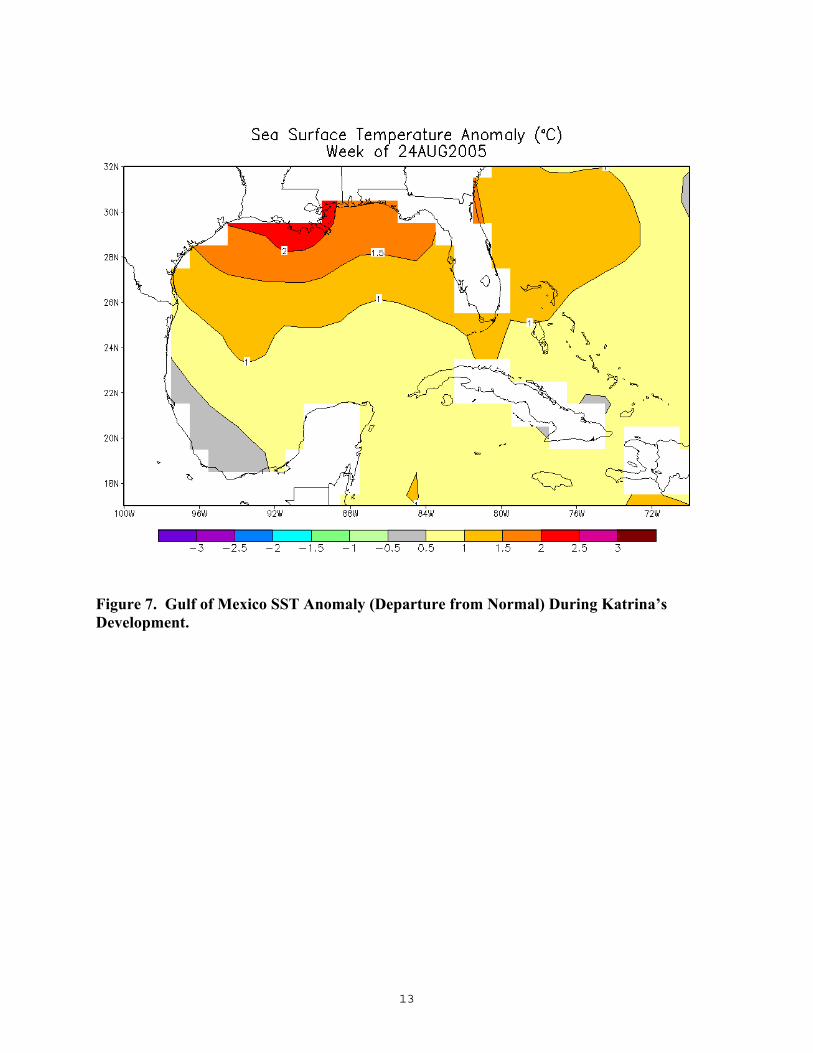
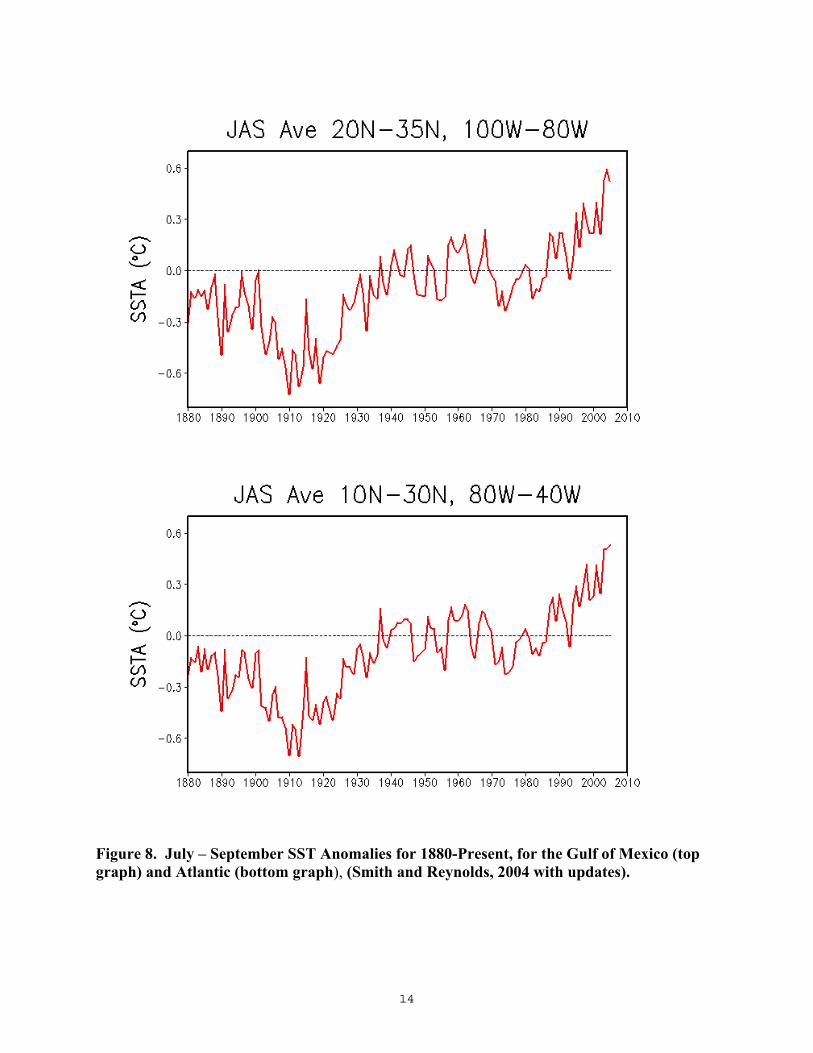
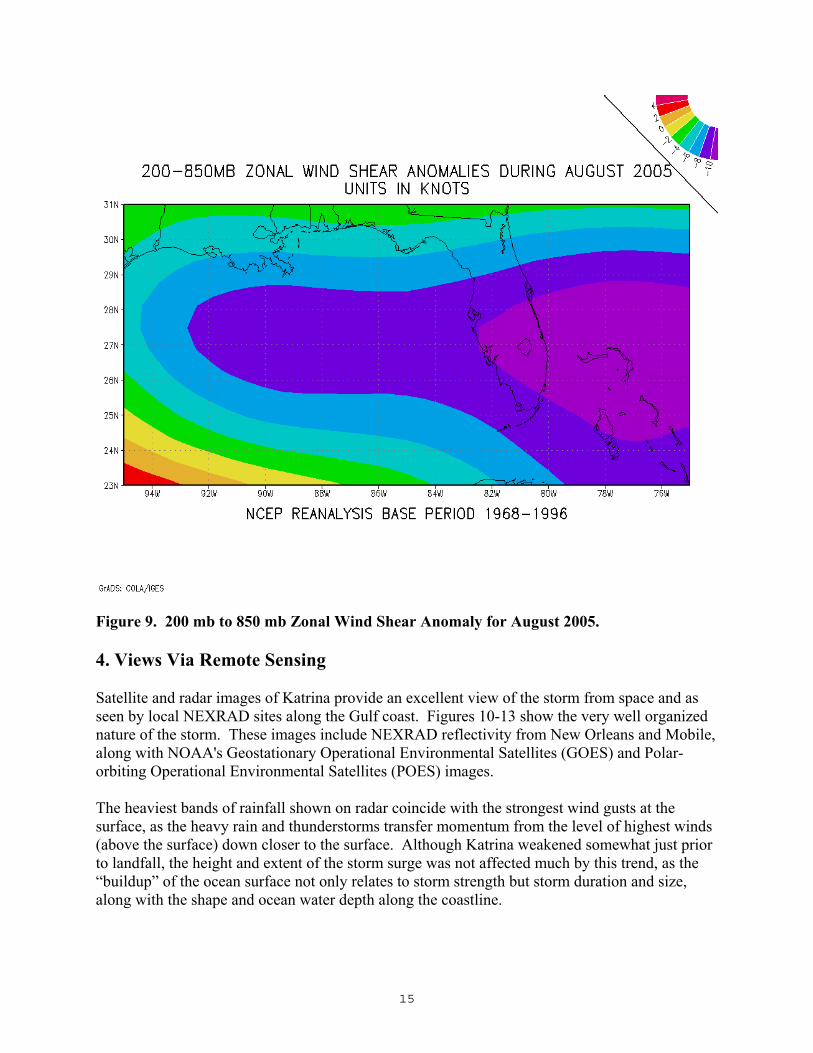
Figure 6. Preliminary Observations for Maximum Wind Gusts Associated with Katrina. 3. Contributing Factors A number of factors contributed to making Katrina a strong Category 5 hurricane (though weakening to Category 3 just prior to landfall). Sea surface temperatures (SST) in the Gulf of Mexico were one to two degrees Celsius above normal (see Figure 7), and the warm temperatures extended to a considerable depth through the upper ocean layer. Also, Katrina crossed the “loop current” (belt of even warmer water), during which time explosive intensification occurred. The temperature of the ocean surface is a critical element in the formation and strength of hurricanes. As shown in Figure 8, there has been an overall increasing trend in July-September Atlantic and Gulf of Mexico SSTs during the past 100 years marked by two distinct periods of increasing temperatures (1910-1945; 1976-present). This pattern is similar to that observed across global land and ocean surfaces. Also, vertical wind shear was less than normal, which allowed for the storm to develop quickly. Figure 9 illustrates the wind shear in the area, using the 200 mb to 850 mb zonal shear anomaly for the month of August 2005, with negative zonal shear anomalies.
13
Figure 7. Gulf of Mexico SST Anomaly (Departure from Normal) During Katrina’s Development.
14
Figure 8. July – September SST Anomalies for 1880-Present, for the Gulf of Mexico (top graph) and Atlantic (bottom graph), (Smith and Reynolds, 2004 with updates).
15
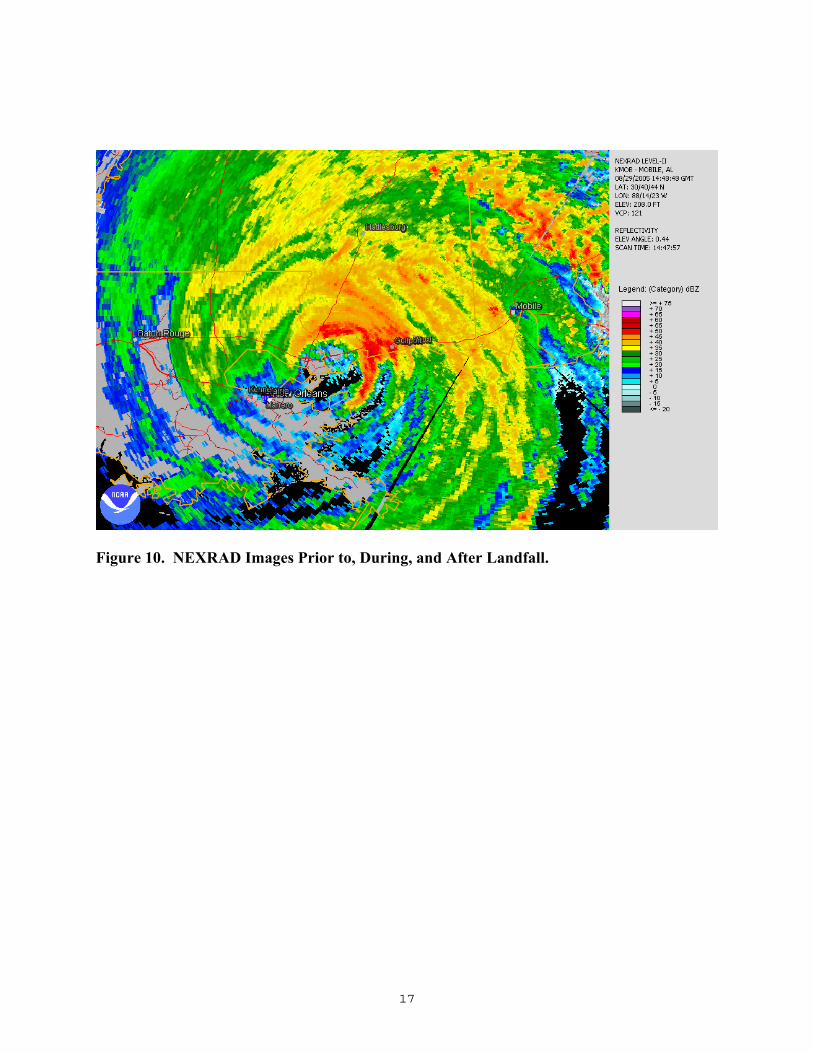
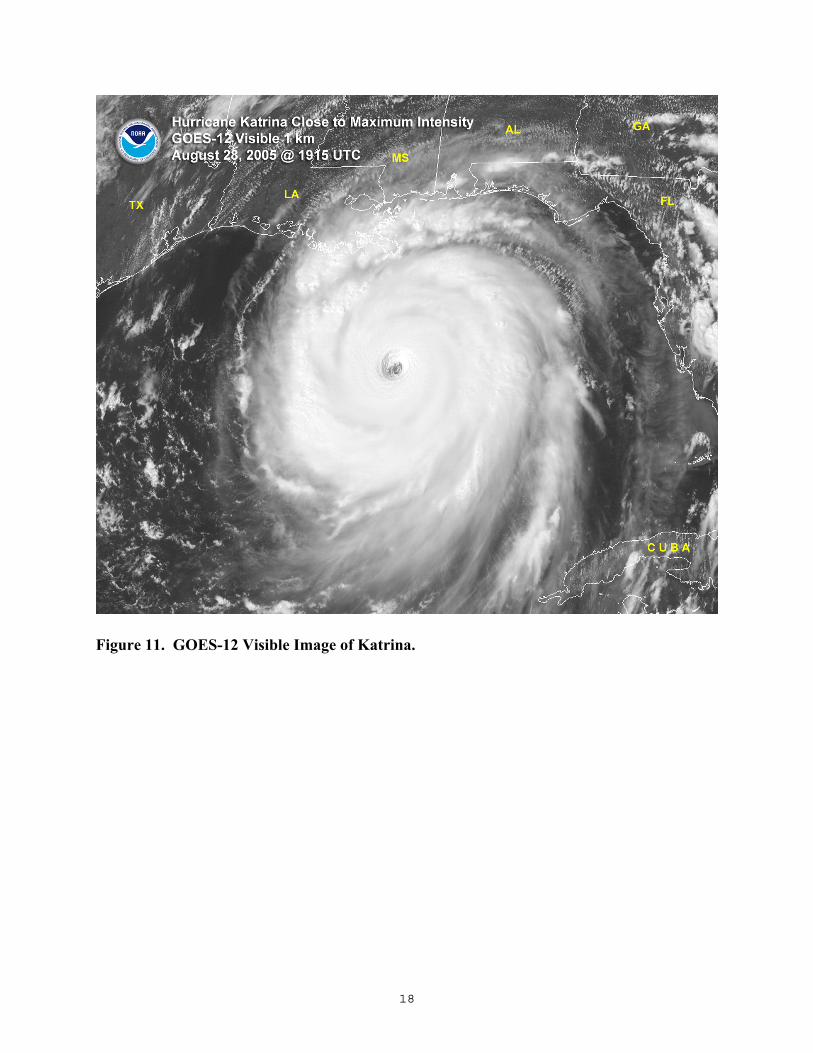
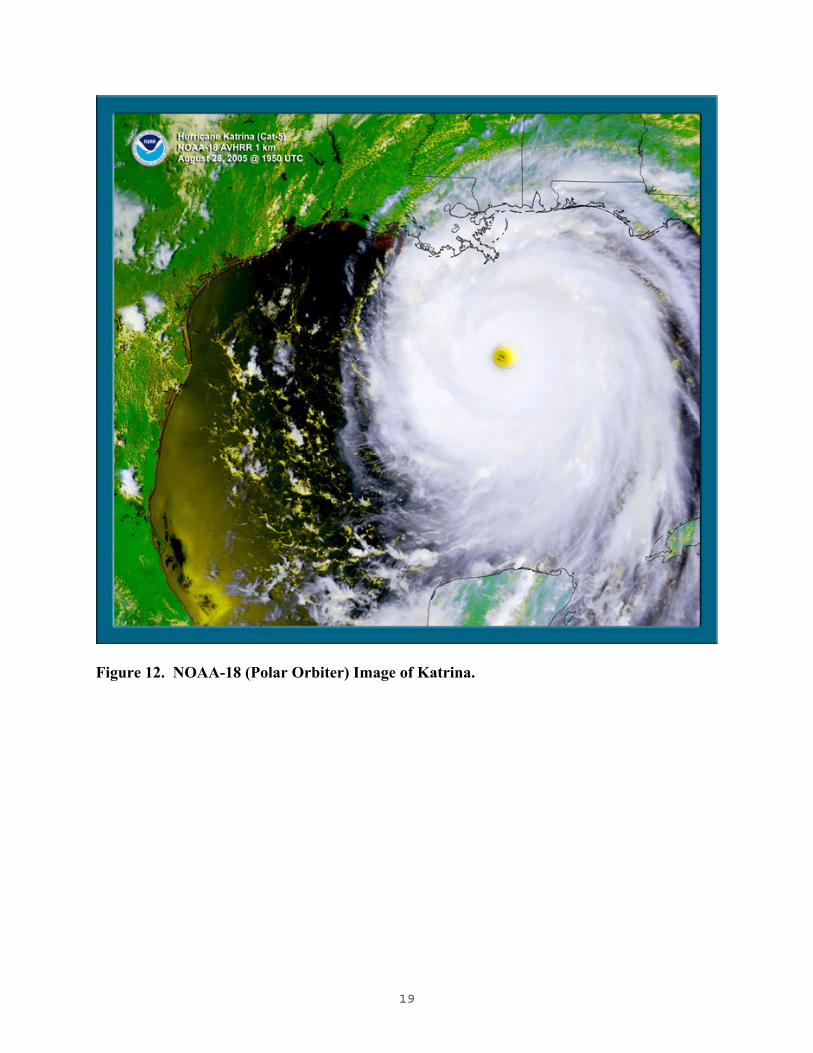
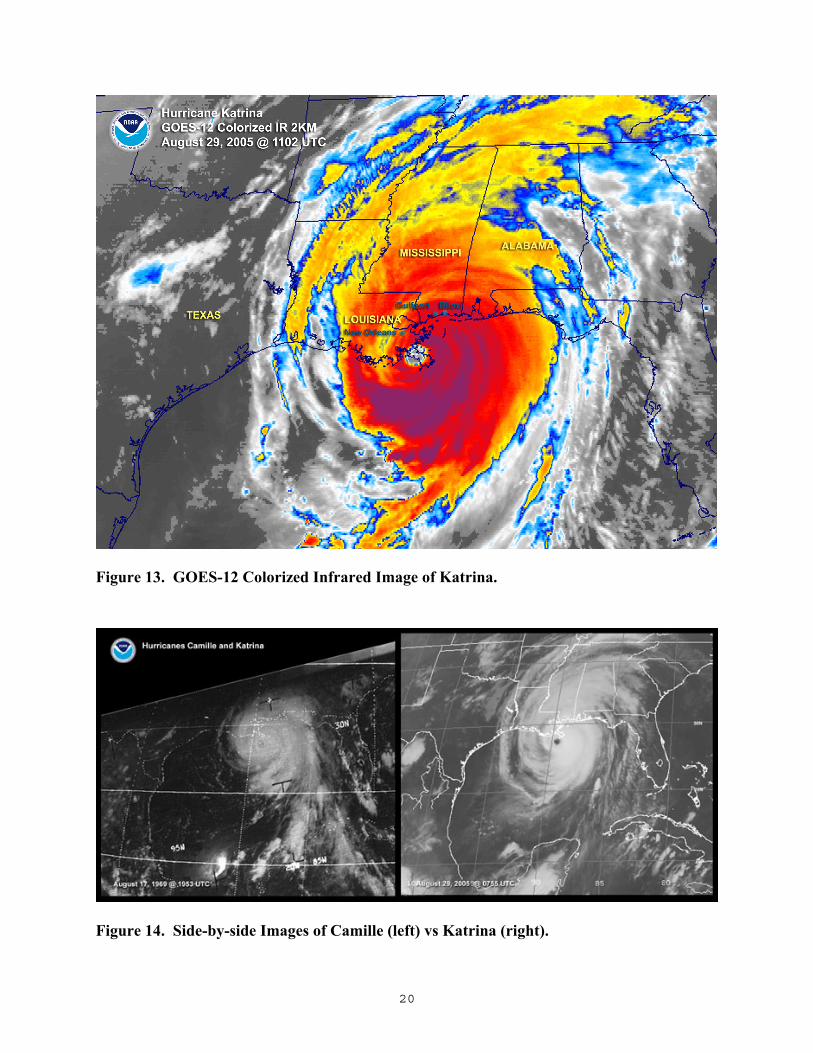
Figure 9. 200 mb to 850 mb Zonal Wind Shear Anomaly for August 2005. 4. Views Via Remote Sensing Satellite and radar images of Katrina provide an excellent view of the storm from space and as seen by local NEXRAD sites along the Gulf coast. Figures 10-13 show the very well organized nature of the storm. These images include NEXRAD reflectivity from New Orleans and Mobile, along with NOAA's Geostationary Operational Environmental Satellites (GOES) and Polar-orbiting Operational Environmental Satellites (POES) images. The heaviest bands of rainfall shown on radar coincide with the strongest wind gusts at the surface, as the heavy rain and thunderstorms transfer momentum from the level of highest winds (above the surface) down closer to the surface. Although Katrina weakened somewhat just prior to landfall, the height and extent of the storm surge was not affected much by this trend, as the “buildup” of the ocean surface not only relates to storm strength but storm duration and size, along with the shape and ocean water depth along the coastline.
16
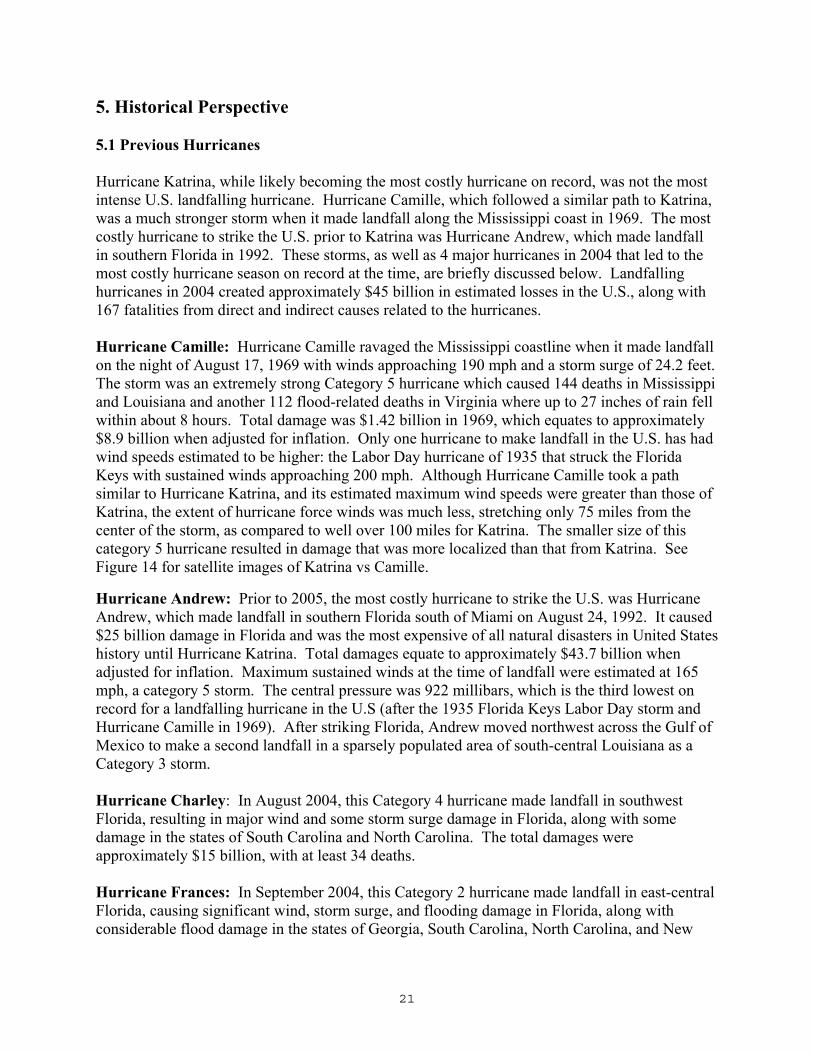
Finally, Figure 14 shows a satellite comparison of Camille vs Katrina, which provides a good perspective of Katrina’s large size.
17
Figure 10. NEXRAD Images Prior to, During, and After Landfall.
18
Figure 11. GOES-12 Visible Image of Katrina.
19
Figure 12. NOAA-18 (Polar Orbiter) Image of Katrina.
20
Figure 13. GOES-12 Colorized Infrared Image of Katrina.
Figure 14. Side-by-side Images of Camille (left) vs Katrina (right).
21
5. Historical Perspective 5.1 Previous Hurricanes Hurricane Katrina, while likely becoming the most costly hurricane on record, was not the most intense U.S. landfalling hurricane. Hurricane Camille, which followed a similar path to Katrina, was a much stronger storm when it made landfall along the Mississippi coast in 1969. The most costly hurricane to strike the U.S. prior to Katrina was Hurricane Andrew, which made landfall in southern Florida in 1992. These storms, as well as 4 major hurricanes in 2004 that led to the most costly hurricane season on record at the time, are briefly discussed below. Landfalling hurricanes in 2004 created approximately $45 billion in estimated losses in the U.S., along with 167 fatalities from direct and indirect causes related to the hurricanes. Hurricane Camille: Hurricane Camille ravaged the Mississippi coastline when it made landfall on the night of August 17, 1969 with winds approaching 190 mph and a storm surge of 24.2 feet. The storm was an extremely strong Category 5 hurricane which caused 144 deaths in Mississippi and Louisiana and another 112 flood-related deaths in Virginia where up to 27 inches of rain fell within about 8 hours. Total damage was $1.42 billion in 1969, which equates to approximately $8.9 billion when adjusted for inflation. Only one hurricane to make landfall in the U.S. has had wind speeds estimated to be higher: the Labor Day hurricane of 1935 that struck the Florida Keys with sustained winds approaching 200 mph. Although Hurricane Camille took a path similar to Hurricane Katrina, and its estimated maximum wind speeds were greater than those of Katrina, the extent of hurricane force winds was much less, stretching only 75 miles from the center of the storm, as compared to well over 100 miles for Katrina. The smaller size of this category 5 hurricane resulted in damage that was more localized than that from Katrina. See Figure 14 for satellite images of Katrina vs Camille. Hurricane Andrew: Prior to 2005, the most costly hurricane to strike the U.S. was Hurricane Andrew, which made landfall in southern Florida south of Miami on August 24, 1992. It caused $25 billion damage in Florida and was the most expensive of all natural disasters in United States history until Hurricane Katrina. Total damages equate to approximately $43.7 billion when adjusted for inflation. Maximum sustained winds at the time of landfall were estimated at 165 mph, a category 5 storm. The central pressure was 922 millibars, which is the third lowest on record for a landfalling hurricane in the U.S (after the 1935 Florida Keys Labor Day storm and Hurricane Camille in 1969). After striking Florida, Andrew moved northwest across the Gulf of Mexico to make a second landfall in a sparsely populated area of south-central Louisiana as a Category 3 storm. Hurricane Charley: In August 2004, this Category 4 hurricane made landfall in southwest Florida, resulting in major wind and some storm surge damage in Florida, along with some damage in the states of South Carolina and North Carolina. The total damages were approximately $15 billion, with at least 34 deaths. Hurricane Frances: In September 2004, this Category 2 hurricane made landfall in east-central Florida, causing significant wind, storm surge, and flooding damage in Florida, along with considerable flood damage in the states of Georgia, South Carolina, North Carolina, and New
22
York, due to 5 to 15-inch rains. The total damages were approximately $9 billion, with at least 48 deaths. Hurricane Ivan: In September 2004, this Category 3 hurricane made landfall on the Gulf coast of Alabama, with significant wind, storm surge, and flooding damage in coastal Alabama and the Florida panhandle, along with wind/flood damage in the states of Georgia, Mississippi, Louisiana, South Carolina, North Carolina, Virginia, West Virginia, Maryland, Tennessee, Kentucky, Ohio, Delaware, New Jersey, Pennsylvania, and New York. The estimated damages exceeded $14 billion, and there were at least 57 deaths. Hurricane Jeanne: In September 2004, this Category 3 hurricane made landfall in east-central Florida, causing considerable wind, storm surge, and flooding damage in Florida, with some flood damage also in the states of Georgia, South Carolina, North Carolina, Virginia, Maryland, Delaware, New Jersey, Pennsylvania, and New York, along with Puerto Rico. The estimated damages exceeded $6.9 billion, and there were at least 28 deaths. For additional information and statistics on historic storms, see: - National Hurricane Center – http://www.nhc.noaa.gov/pastall.shtml - National Climatic Data Center -- http://www.ncdc.noaa.gov/oa/reports/billionz.html - National Climatic Data Center -- http://www.ncdc.noaa.gov/oa/climate/severeweather/hurricanes.html 5.2 Hurricanes Along the Central Gulf Coast The central Gulf Coast has been impacted by a large number of topical cyclones over the years. From 1722-2005, 45 hurricanes made landfall between Houma, LA and Mobile, AL (see table below). Literature sites additional storms prior to the 20th Century but little information is available to confirm these events (Ludlum, 1963; Sullivan, 1986; and Roth, 1998). The area has also felt the affects of several more hurricanes and tropical storms that have passed or made landfall nearby.
Hurricanes that have made landfall between Houma, LA and Mobile, AL, 1722 to 2005
Date Category Hurricane Name September, 1722 September, 1740 (Mid-month) September, 1740 (A week later) Fall, 1746 August/September, 1772 October, 1778 August, 1779 August, 1780 August, 1794 August, 1812 July, 1819 September, 1821 August, 1831 August, 1848 August 19-30, 1852 Major Hurricane September 15-17, 1855 Major Hurricane
23
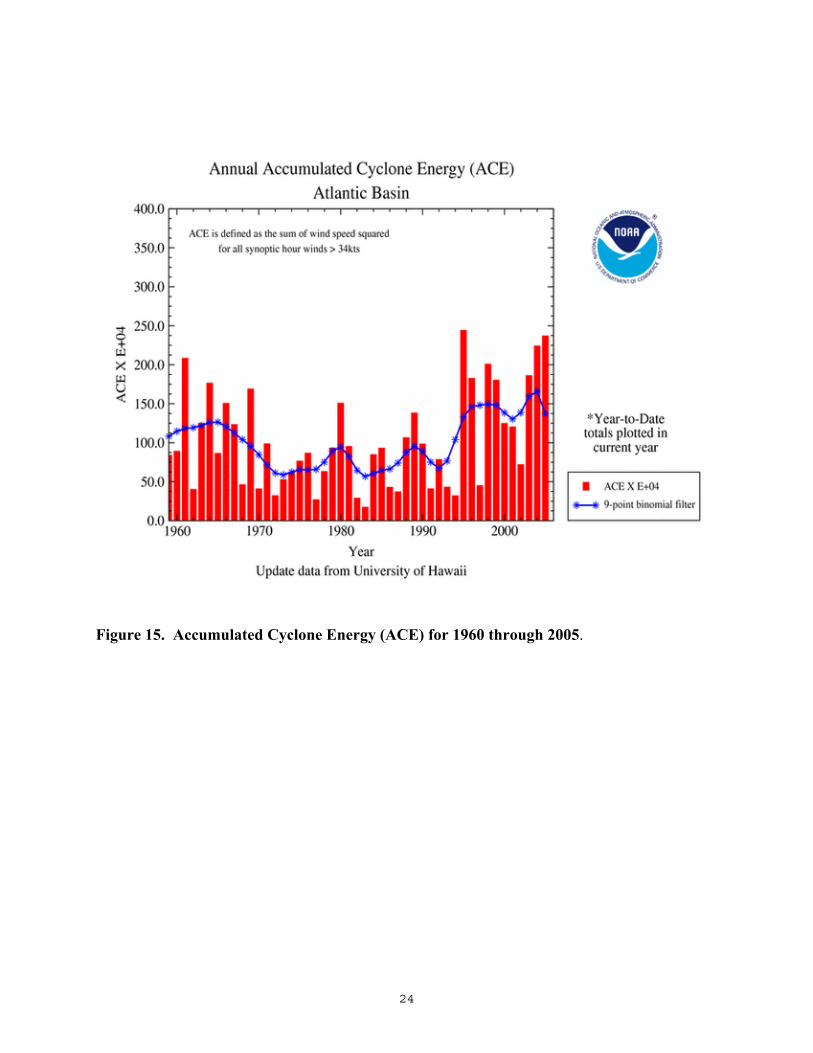
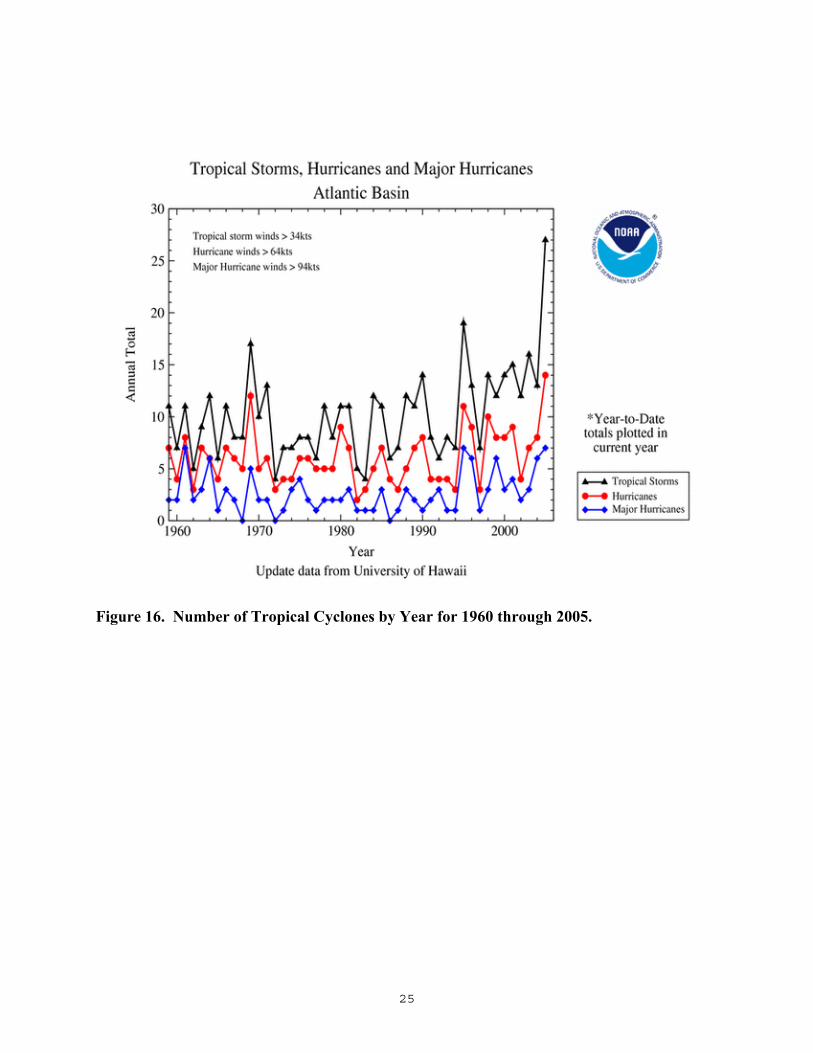
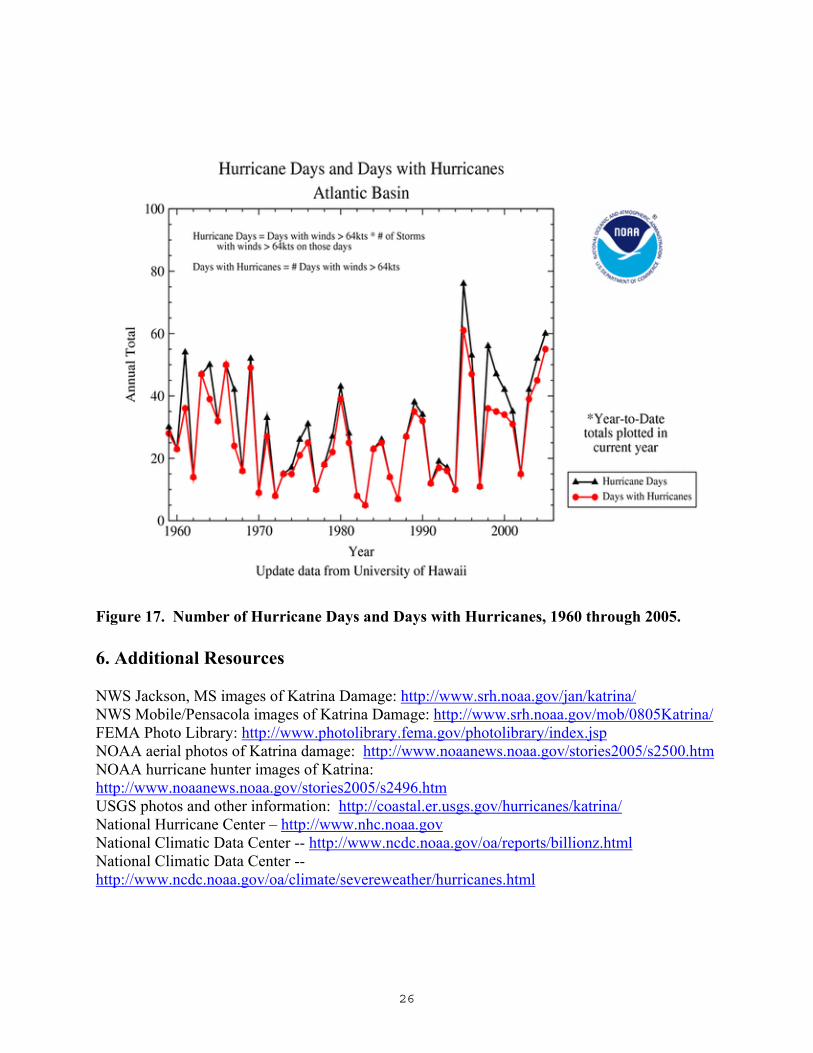
September 15-18, 1859 Hurricane August 8-16, 1860 Major Hurricane September 11-16, 1860 Hurricane October 2-9, 1867 Hurricane July 30, 1870 Hurricane September 14-21, 1877 Hurricane October 9-22, 1887 Hurricane September 11-26, 1889 Hurricane September 27 – October 5, 1893 Major Hurricane August 2-18, 1901 2 September 19-30, 1906 3 September 10-21, 1909 4 September 11-14, 1912 1 September 22 – October 1, 1915 4 June 29 – July 10, 1916 3 August 26 – September 3, 1932 1 September 4-21, 1947 3 September 1-6, 1948 1 August 20 – September 1, 1950 1 Baker September 21- 30, 1956 2 Flossy September 14-17, 1960 1 Ethel August 26 – September 12, 1965 3 Betsy August 14-22, 1969 5 Camille July 9-16, 1979 1 Bob August 29 – September 14, 1979 3 Frederic August 27 – September 4, 1985 3 Elena September 7-11, 1988 1 Florence July 16-26, 1997 1 Danny September 15 – October 1, 1998 1 Georges 5.3 Indices and Trends The Accumulated Cyclone Energy (ACE) index is one method to describe trends in tropical cyclone activity. This index uses a combination of the tropical cyclone’s duration in a particular ocean basin, along with the strength of each storm. Figure 15 shows the recent upward trend, which appears to be part of a long-term cycle in activity, with the 1950’s-1960’s also being an active period. Of course, during that time, there was much less commercial and residential development along our coastlines. Figures 16-17 show the number of tropical cyclones, number of hurricane-days, and number of days with hurricanes, from 1960 through 2005.
24
Figure 15. Accumulated Cyclone Energy (ACE) for 1960 through 2005.
25
Figure 16. Number of Tropical Cyclones by Year for 1960 through 2005.
26
Figure 17. Number of Hurricane Days and Days with Hurricanes, 1960 through 2005. 6. Additional Resources NWS Jackson, MS images of Katrina Damage: http://www.srh.noaa.gov/jan/katrina/ NWS Mobile/Pensacola images of Katrina Damage: http://www.srh.noaa.gov/mob/0805Katrina/ FEMA Photo Library: http://www.photolibrary.fema.gov/photolibrary/index.jsp NOAA aerial photos of Katrina damage: http://www.noaanews.noaa.gov/stories2005/s2500.htm NOAA hurricane hunter images of Katrina: http://www.noaanews.noaa.gov/stories2005/s2496.htm USGS photos and other information: http://coastal.er.usgs.gov/hurricanes/katrina/ National Hurricane Center – http://www.nhc.noaa.gov National Climatic Data Center -- http://www.ncdc.noaa.gov/oa/reports/billionz.html National Climatic Data Center -- http://www.ncdc.noaa.gov/oa/climate/severeweather/hurricanes.html
27
7. References Ludlum, D.M. 1963. Early American Hurricanes, 1492-1870. Amer. Met. Soc. Boston, MA. 198 p.p. NOAA, 1999. Tropical Cyclones of the North Atlantic Ocean, 1871-1998. Historical Climatology Series 6-2. National Climatic Data Center, Asheville, NC. 206 p.p. NOAA, 2005. Track Maps, 1851- 2004. Atlantic Oceanographic and Meteorological Laboratory Reanalysis Project. [http://www.aoml.noaa.gov/hrd/hurdat/Track-Maps.htm] NOAA, 2005. 1901-2003 United States Landfalling Hurricanes. National Climatic Data Center. [http://www.ncdc.noaa.gov/oa/climate/severeweather/hurricanes.html] Roth, D. 1998. Louisiana Hurricanes. NOAA National Weather Service, Lake Charles, LA. [http://www.srh.noaa.gov/lch/research/lahur.htm] Smith, T.M., and R.W. Reynolds, 2004: Improved extended reconstruction of SST (1854-1997). Journal of climate, 17 (12), 2466-2477. Sullivan, C.L. 1986. Hurricanes of the Mississippi Gulf Coast, 1717 to Present. Gulf Publishing Company – The Sun Herald. 139 p.p.