Embed Size (px)
Citation preview
© 2021 AO World All Rights Reserved
HY22 Interim Results
23 November 2021
This presentation contains oral and written statements that are, or may be, “forward-looking statements” with respect to certain of AO World plc’s (“AO”) plans and its current goals
and expectations relating to its future financial condition, performance and results. These forward-looking statements are usually identified by words such as “believe”, “estimates”,
“plans”, “projects”, “anticipates”, “goal”, “expects”, “intends”, “may”, “will”, or “should” or, in each case, their negative or other variations or comparable terminology. These forward-
looking statements include matters that are not historical facts and include statements regarding the Company’s intentions, beliefs or current expectations.
Any forward-looking statements in this presentation reflect the Company’s current expectations and projections about future events. By their nature, forward-looking statements
involve a number of risks, uncertainties and assumptions which may be beyond AO’s control and could cause actual results or events to differ materially from those expressed or
implied by the forward-looking statements. There are important factors that could cause AO’s actual financial condition, performance and results to differ materially from those
expressed or implied by the forward-looking statements, including, among other things: UK domestic and global political, social and economic and business conditions; our ability to
maintain our culture, expand into new European territories, grow our brand and attract new customers; the resilience of our IT systems; changes in regulations or compliance and
interruption to physical infrastructure. A further list and description of these risks, uncertainties and other factors, is set out in our Interim Results for the six months to 30 September
2021 and our Annual Report for the year ended 31 March 2021 both of which can be found at www.ao-world.com.
Forward-looking statements contained in this presentation regarding past trends or activities should not be taken as a representation that such trends or activities will continue in the
future. You should not place undue reliance on forward-looking statements, which speak only as of the date of this presentation. No representations or warranties are made as to the
accuracy of such statements, estimates or projections. AO expressly disclaims any undertaking or obligation to update the forward-looking statements made in this presentation or
any other forward-looking statements we may make except as required by law.
Please note that the Directors of the Company are, in making this presentation, not seeking to encourage shareholders to either buy or sell shares in the Company. Shareholders in
any doubt about what action to take are recommended to seek financial advice from an independent financial advisor authorised by the Financial Services and Markets Act 2000.
A copy of this presentation can be found on our corporate website at www.ao-world.com.
Forward-looking statements disclaimer
*Certain financial data have been rounded. As a result of this rounding, the total of data presented may vary slightly from the arithmetic totals of such data.

WelcomeJohn Roberts
Founder and Chief Executive Officer
Financial Performance
Mark HigginsChief Financial Officer
5
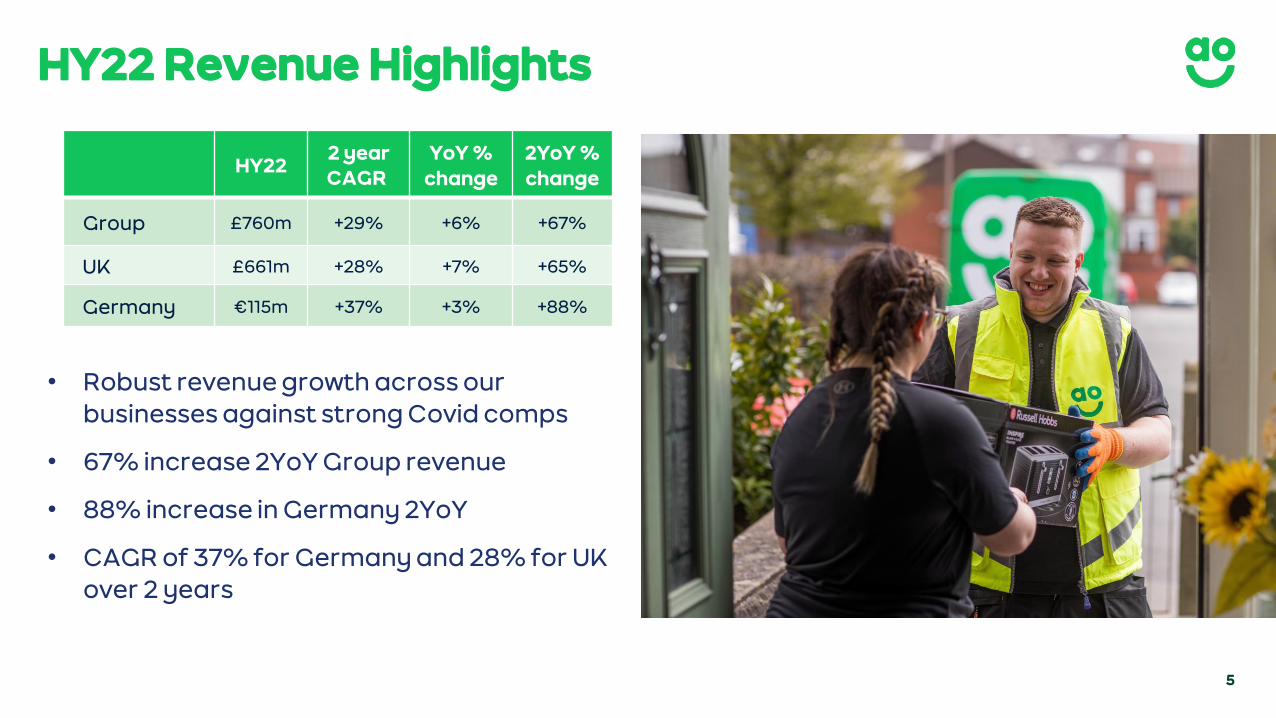
HY22 Revenue Highlights
HY222 year CAGR
YoY % change
2YoY % change
Group £760m +29% +6% +67%
UK £661m +28% +7% +65%
Germany €115m +37% +3% +88%
• Robust revenue growth across our businesses against strong Covid comps
• 67% increase 2YoY Group revenue
• 88% increase in Germany 2YoY
• CAGR of 37% for Germany and 28% for UK over 2 years
6
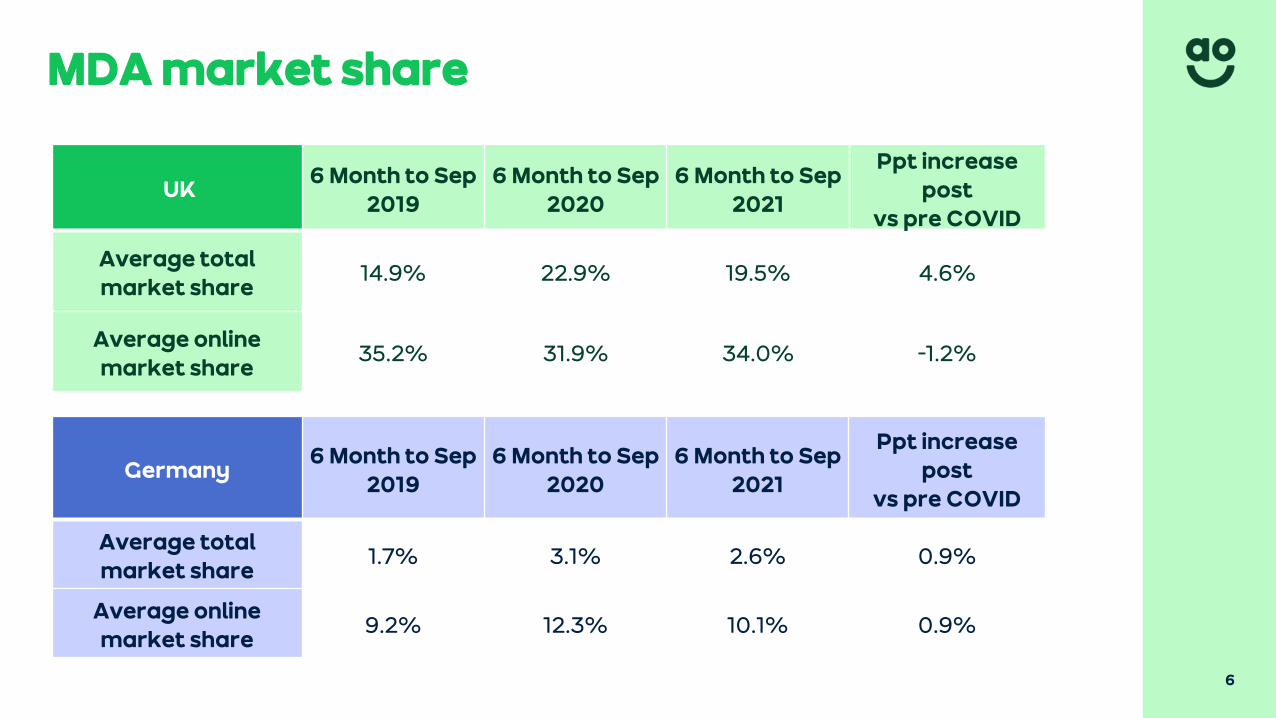
MDA market share
UK6 Month to Sep
20196 Month to Sep
20206 Month to Sep
2021
Ppt increase post
vs pre COVID
Average total market share
14.9% 22.9% 19.5% 4.6%
Average online market share
35.2% 31.9% 34.0% -1.2%
Germany6 Month to Sep
20196 Month to Sep
20206 Month to Sep
2021
Ppt increase post
vs pre COVID
Average total market share
1.7% 3.1% 2.6% 0.9%
Average online market share
9.2% 12.3% 10.1% 0.9%
7
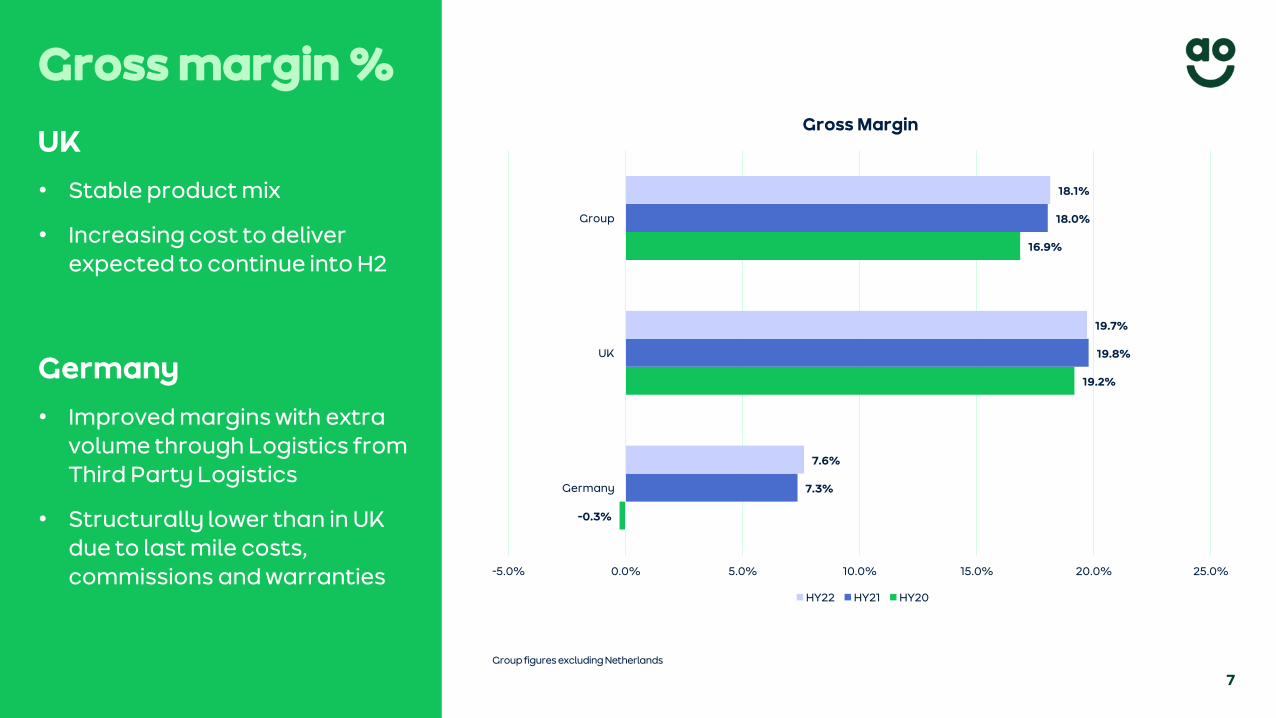
UK
• Stable product mix
• Increasing cost to deliver expected to continue into H2
Germany
• Improved margins with extra volume through Logistics from Third Party Logistics
• Structurally lower than in UK due to last mile costs, commissions and warranties
Gross margin %
-0.3%
19.2%
16.9%
7.3%
19.8%
18.0%
7.6%
19.7%
18.1%
-5.0% 0.0% 5.0% 10.0% 15.0% 20.0% 25.0%
Germany
UK
Group
Gross Margin
HY22 HY21 HY20
Group figures excluding Netherlands
8
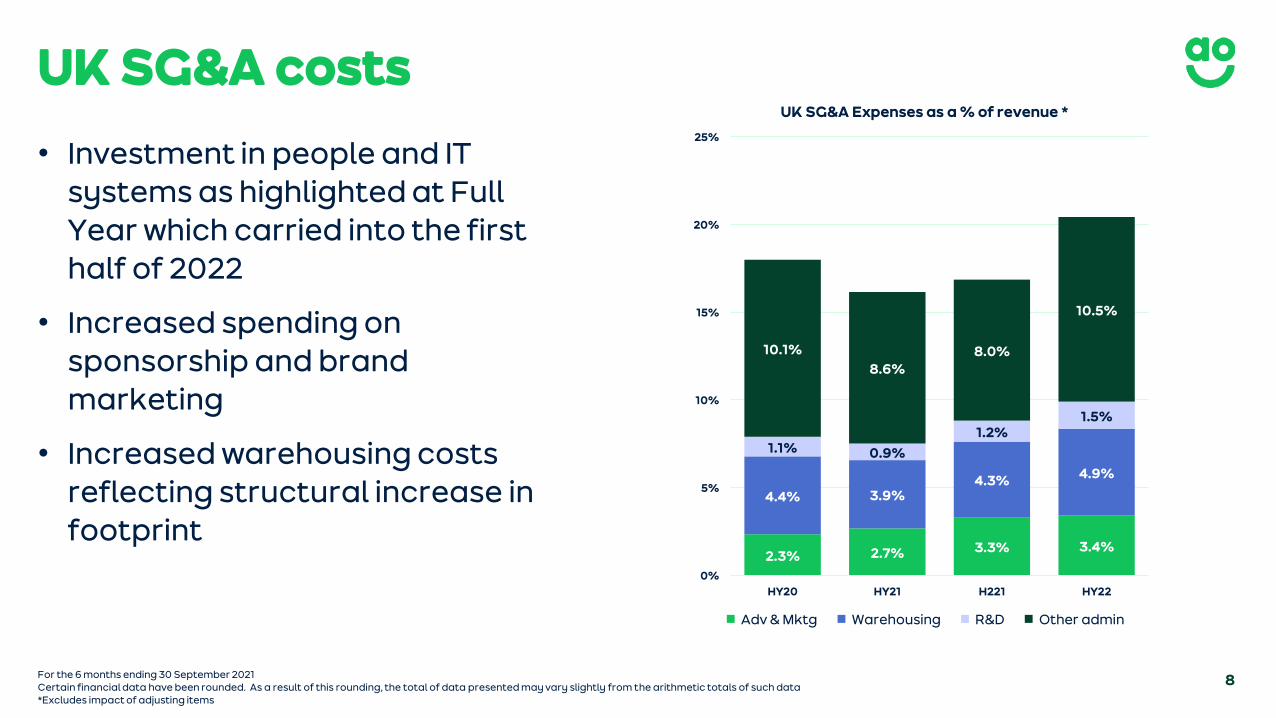
UK SG&A costs
• Investment in people and IT systems as highlighted at Full Year which carried into the first half of 2022
• Increased spending on sponsorship and brand marketing
• Increased warehousing costs reflecting structural increase in footprint
For the 6 months ending 30 September 2021Certain financial data have been rounded. As a result of this rounding, the total of data presented may vary slightly from the arithmetic totals of such data*Excludes impact of adjusting items
2.3% 2.7% 3.3% 3.4%
4.4% 3.9%4.3% 4.9%
1.1% 0.9%
1.2%1.5%
10.1%
8.6%8.0%
10.5%
0%
5%
10%
15%
20%
25%
HY20 HY21 H221 HY22
UK SG&A Expenses as a % of revenue *
Adv & Mktg Warehousing R&D Other admin
9
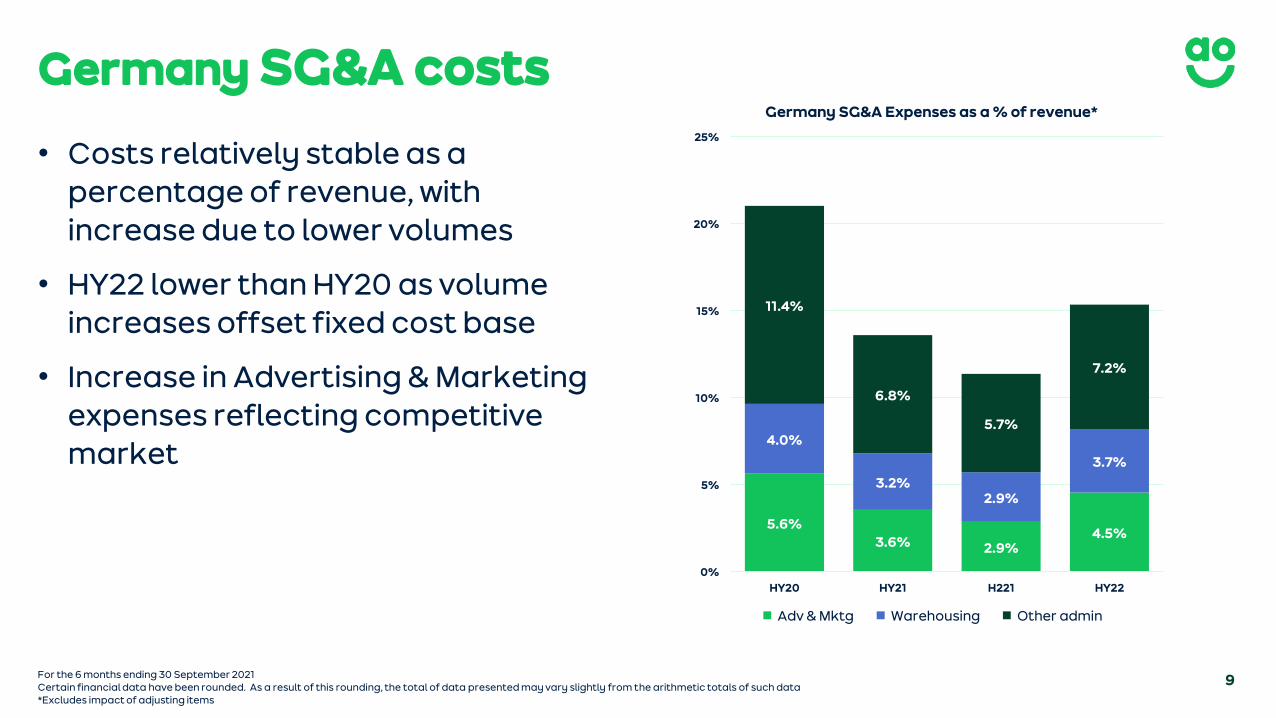
Germany SG&A costs
• Costs relatively stable as a percentage of revenue, with increase due to lower volumes
• HY22 lower than HY20 as volume increases offset fixed cost base
• Increase in Advertising & Marketing expenses reflecting competitive market
For the 6 months ending 30 September 2021Certain financial data have been rounded. As a result of this rounding, the total of data presented may vary slightly from the arithmetic totals of such data*Excludes impact of adjusting items
5.6%3.6% 2.9%
4.5%
4.0%
3.2%2.9%
3.7%
11.4%
6.8%
5.7%
7.2%
0%
5%
10%
15%
20%
25%
HY20 HY21 H221 HY22
Germany SG&A Expenses as a % of revenue*
Adv & Mktg Warehousing Other admin
10
For the 6 months ending 30 September 2021Certain financial data have been rounded. As a result of this rounding, the total of data presented may vary slightly from the arithmetic totals of such data* Excludes impact of adjusting items
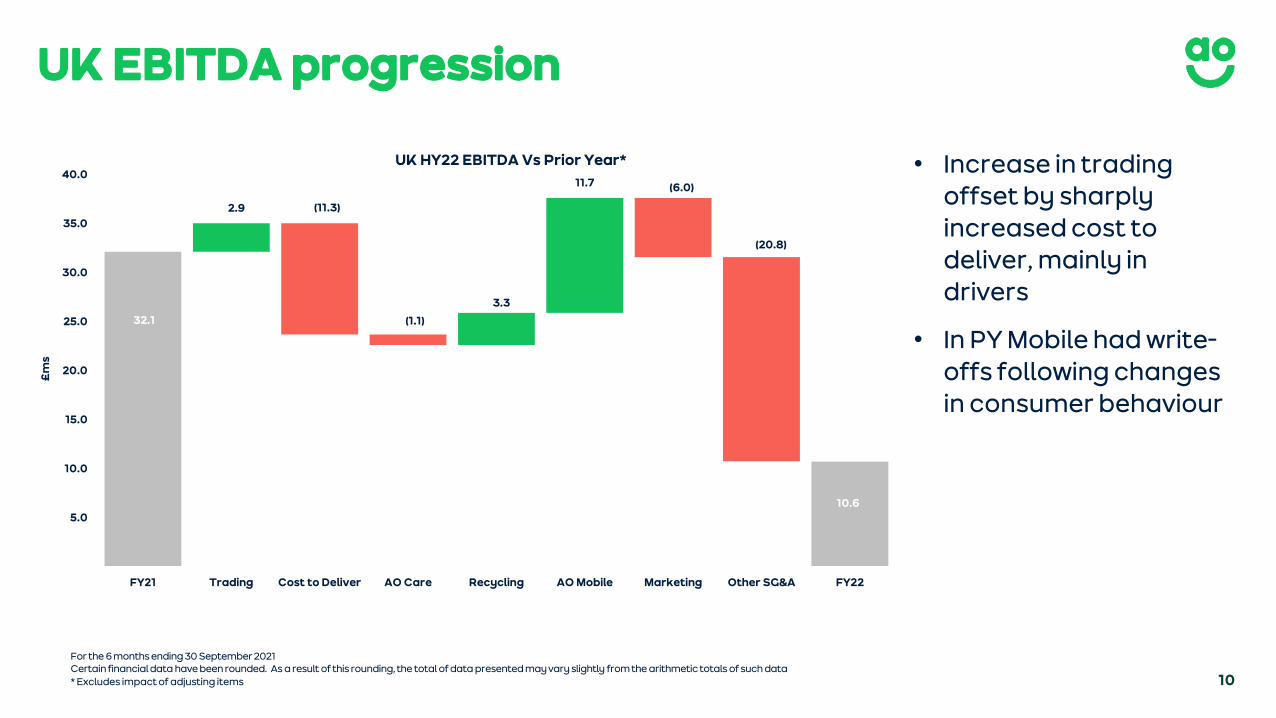
UK EBITDA progression
• Increase in trading offset by sharply increased cost to deliver, mainly in drivers
• In PY Mobile had write-offs following changes in consumer behaviour
32.1
10.6
2.9 (11.3)
(1.1)
3.3
11.7 (6.0)
(20.8)
5.0
10.0
15.0
20.0
25.0
30.0
35.0
40.0
FY21 Trading Cost to Deliver AO Care Recycling AO Mobile Marketing Other SG&A FY22
£m
s
UK HY22 EBITDA Vs Prior Year*
11*For the 6 months ending 30 September 2021Certain financial data have been rounded. As a result of this rounding, the total of data presented may vary slightly from the arithmetic totals of such data*Excludes impact of adjusting items
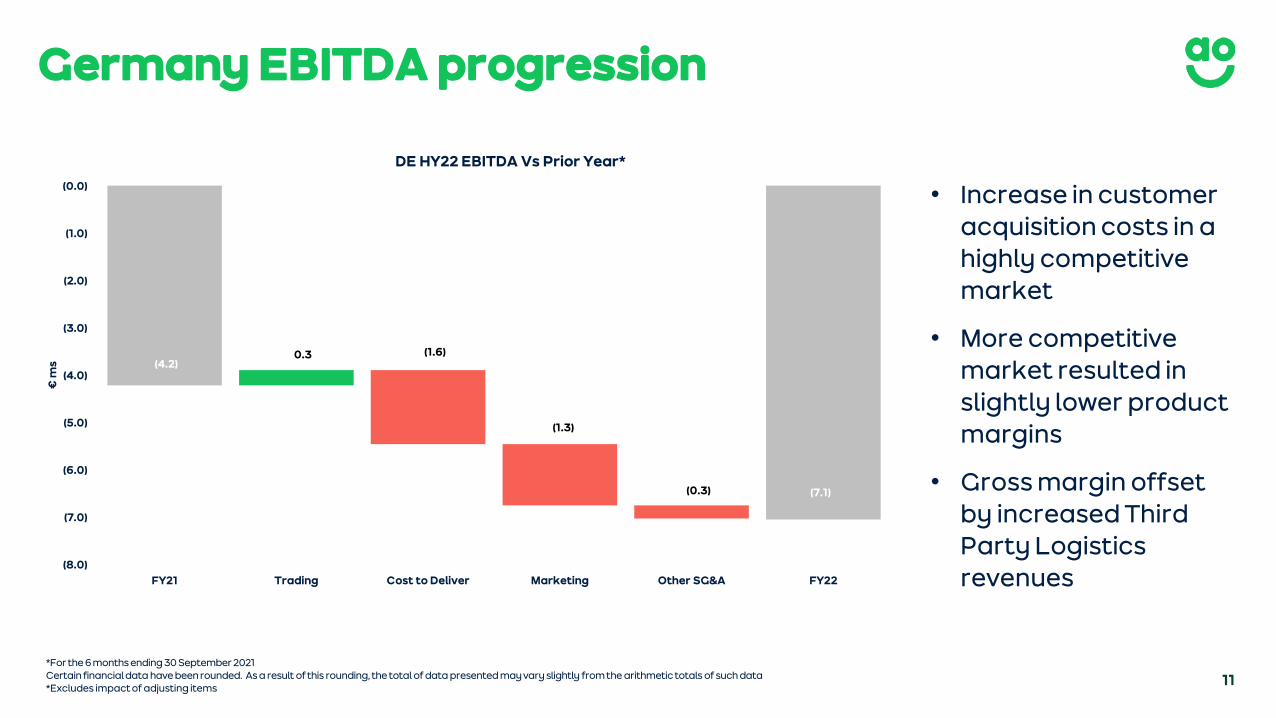
Germany EBITDA progression
• Increase in customer acquisition costs in a highly competitive market
• More competitive market resulted in slightly lower product margins
• Gross margin offset by increased Third Party Logistics revenues
(4.2)
(7.1)
0.3 (1.6)
(1.3)
(0.3)
(8.0)
(7.0)
(6.0)
(5.0)
(4.0)
(3.0)
(2.0)
(1.0)
(0.0)
FY21 Trading Cost to Deliver Marketing Other SG&A FY22
€ m
s
DE HY22 EBITDA Vs Prior Year*
12
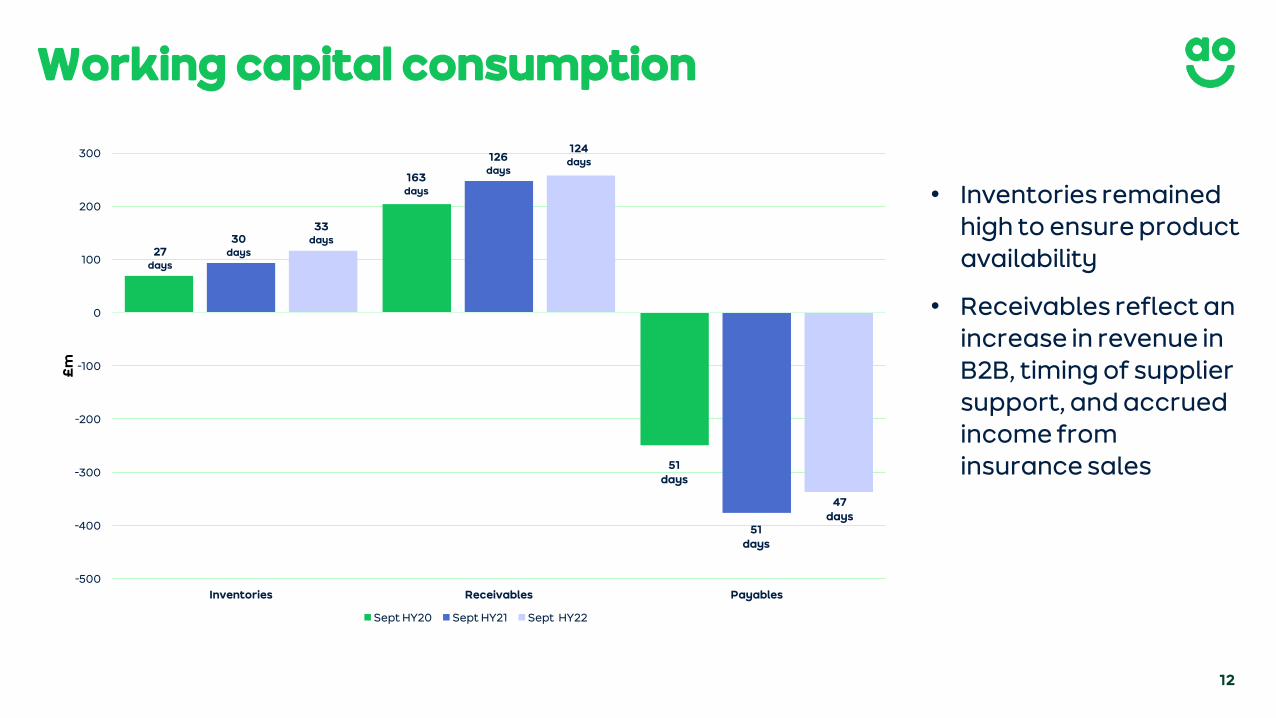
Working capital consumption
-500
-400
-300
-200
-100
0
100
200
300
Inventories Receivables Payables
£m
Sept HY20 Sept HY21 Sept HY22
27days
30days
33days
51 days
51 days
47 days
163days
126days
124 days
• Inventories remained high to ensure product availability
• Receivables reflect an increase in revenue in B2B, timing of supplier support, and accrued income from insurance sales
13
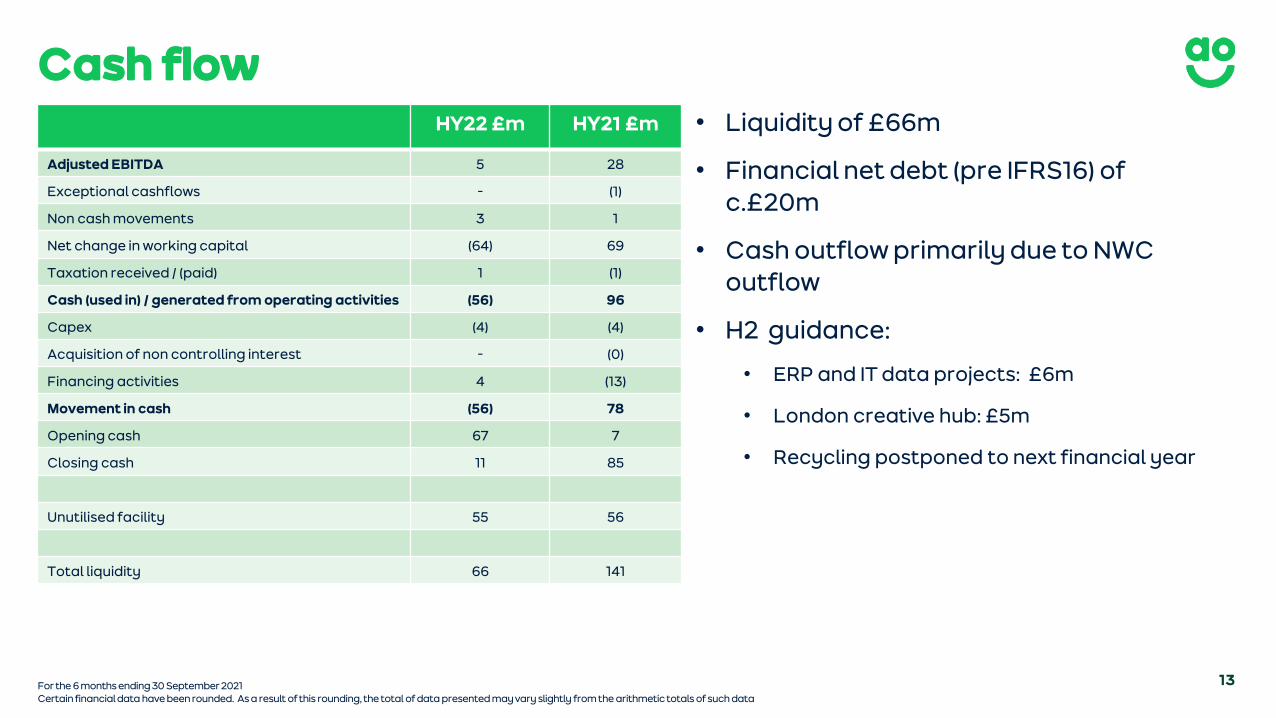
Cash flow• Liquidity of £66m
• Financial net debt (pre IFRS16) of c.£20m
• Cash outflow primarily due to NWC outflow
• H2 guidance:
• ERP and IT data projects: £6m
• London creative hub: £5m
• Recycling postponed to next financial year
For the 6 months ending 30 September 2021Certain financial data have been rounded. As a result of this rounding, the total of data presented may vary slightly from the arithmetic totals of such data
HY22 £m HY21 £m
Adjusted EBITDA 5 28
Exceptional cashflows - (1)
Non cash movements 3 1
Net change in working capital (64) 69
Taxation received / (paid) 1 (1)
Cash (used in) / generated from operating activities (56) 96
Capex (4) (4)
Acquisition of non controlling interest - (0)
Financing activities 4 (13)
Movement in cash (56) 78
Opening cash 67 7
Closing cash 11 85
Unutilised facility 55 56
Total liquidity 66 141
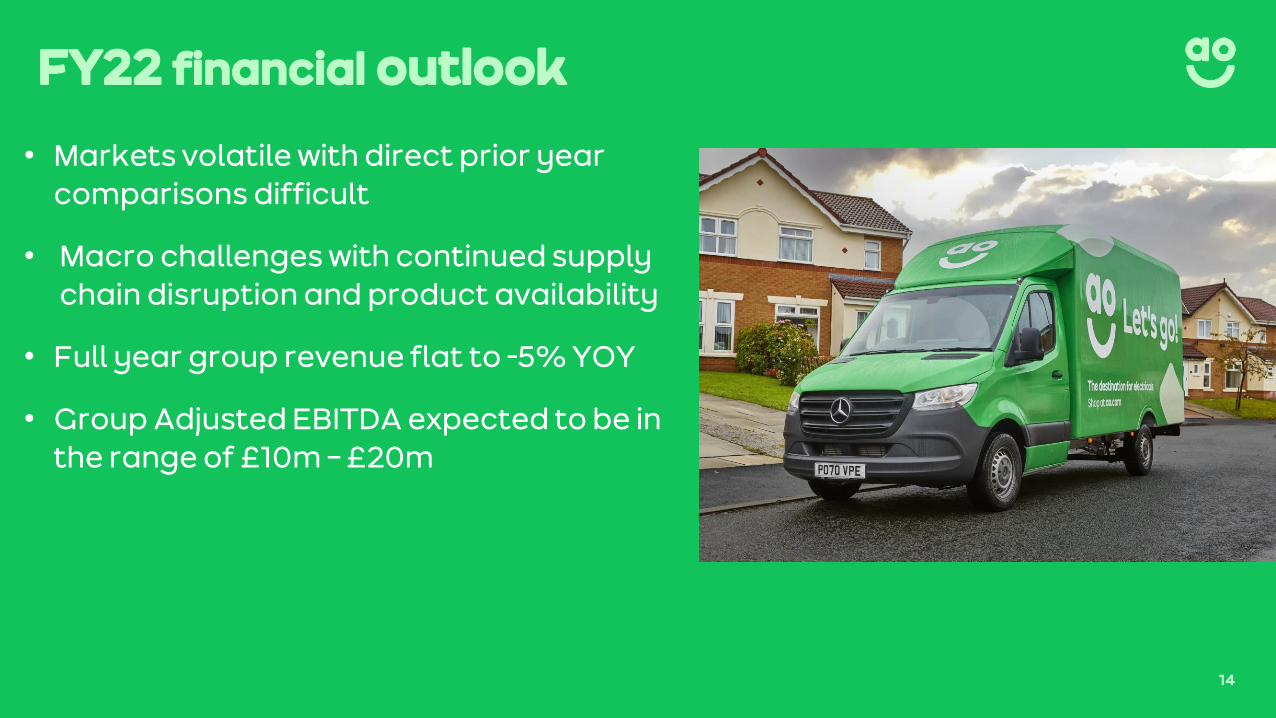
FY22 financial outlook
14
• Markets volatile with direct prior year comparisons difficult
• Macro challenges with continued supply chain disruption and product availability
• Full year group revenue flat to -5% YOY
• Group Adjusted EBITDA expected to be in the range of £10m – £20m
Strategic Progress
John RobertsFounder and Chief Executive
16
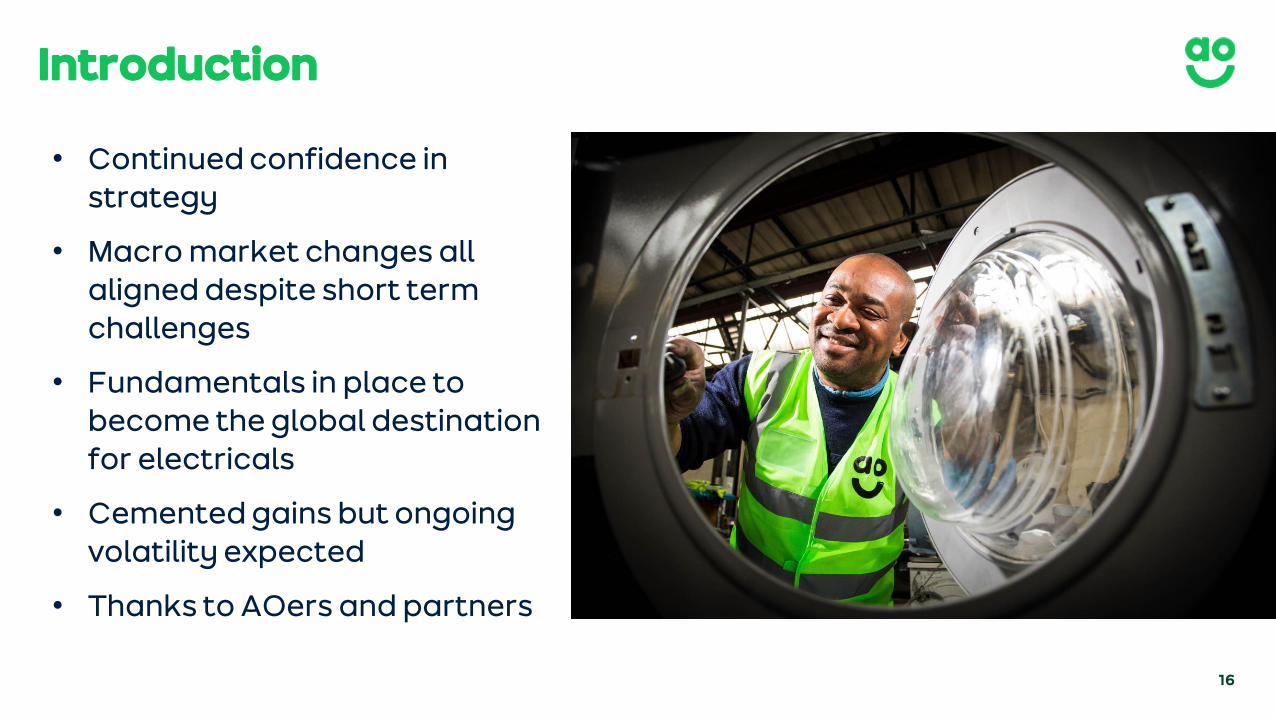
Introduction
• Continued confidence in strategy
• Macro market changes all aligned despite short term challenges
• Fundamentals in place to become the global destination for electricals
• Cemented gains but ongoing volatility expected
• Thanks to AOers and partners

17
Strategic plan
• A better way to buy electricals with huge TAM
• Long term structural shift in our market
• Goals of double-digit growth and international expansion
• Maintained world-class customer service
18
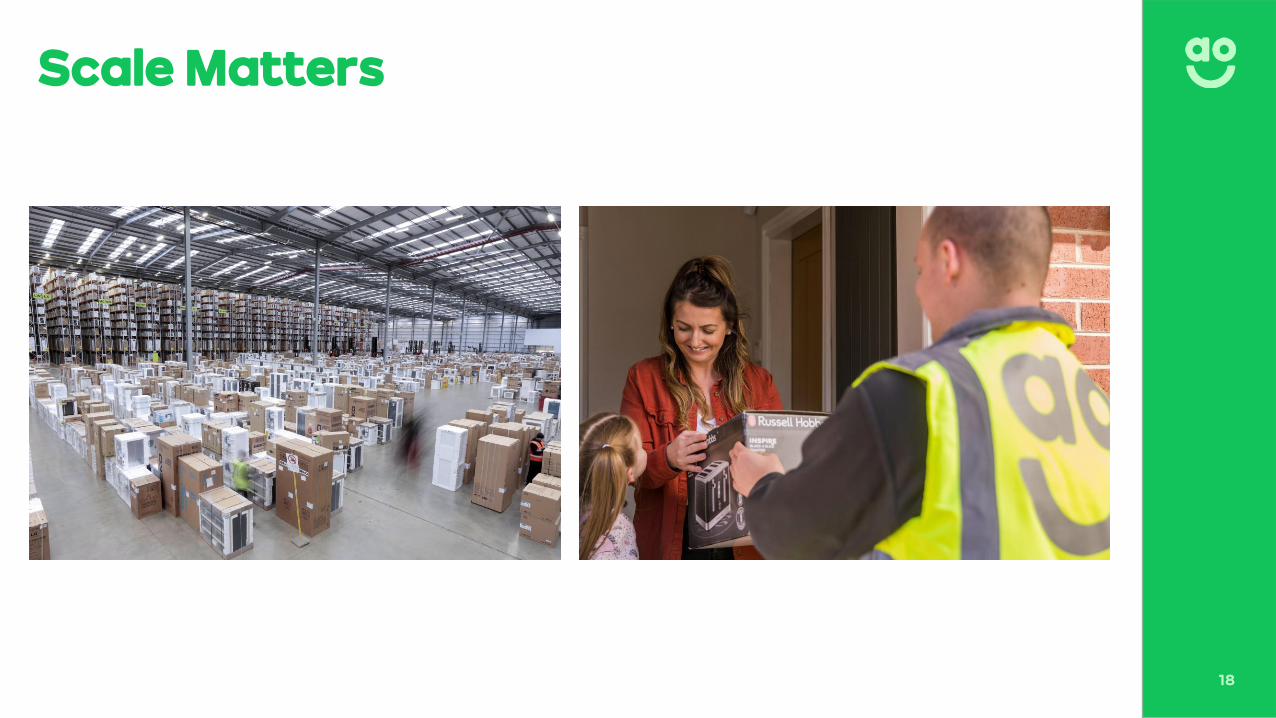
Scale Matters
19
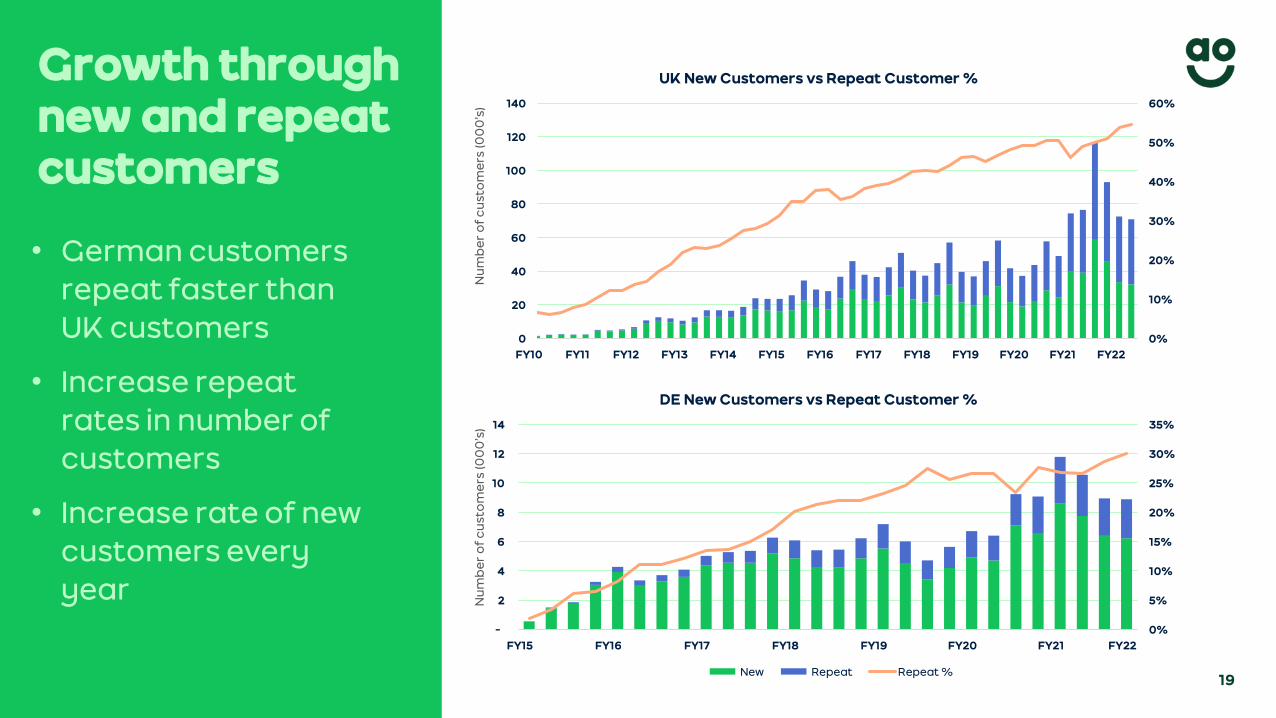
Growth through new and repeat customers
0%
10%
20%
30%
40%
50%
60%
0
20
40
60
80
100
120
140
FY10 Q1 FY11 Q1 FY12 Q1 FY13 Q1 FY14 Q1 FY15 Q1 FY16 Q1 FY17 Q1 FY18 Q1 FY19 Q1 FY20 Q1 FY21 Q1 FY22 Q1
Nu
mb
er
of
cu
sto
me
rs (0
00
’s)
UK New Customers vs Repeat Customer %
0%
5%
10%
15%
20%
25%
30%
35%
-
2
4
6
8
10
12
14
FY15 Q3 FY16 Q3 FY17 Q3 FY18 Q3 FY19 Q3 FY20 Q3 FY21 Q3
Nu
mb
er
of
cu
sto
me
rs (0
00
’s)
DE New Customers vs Repeat Customer %
New Repeat Repeat %
• German customers repeat faster than UK customers
• Increase repeat rates in number of customers
• Increase rate of new customers every year
FY22
20
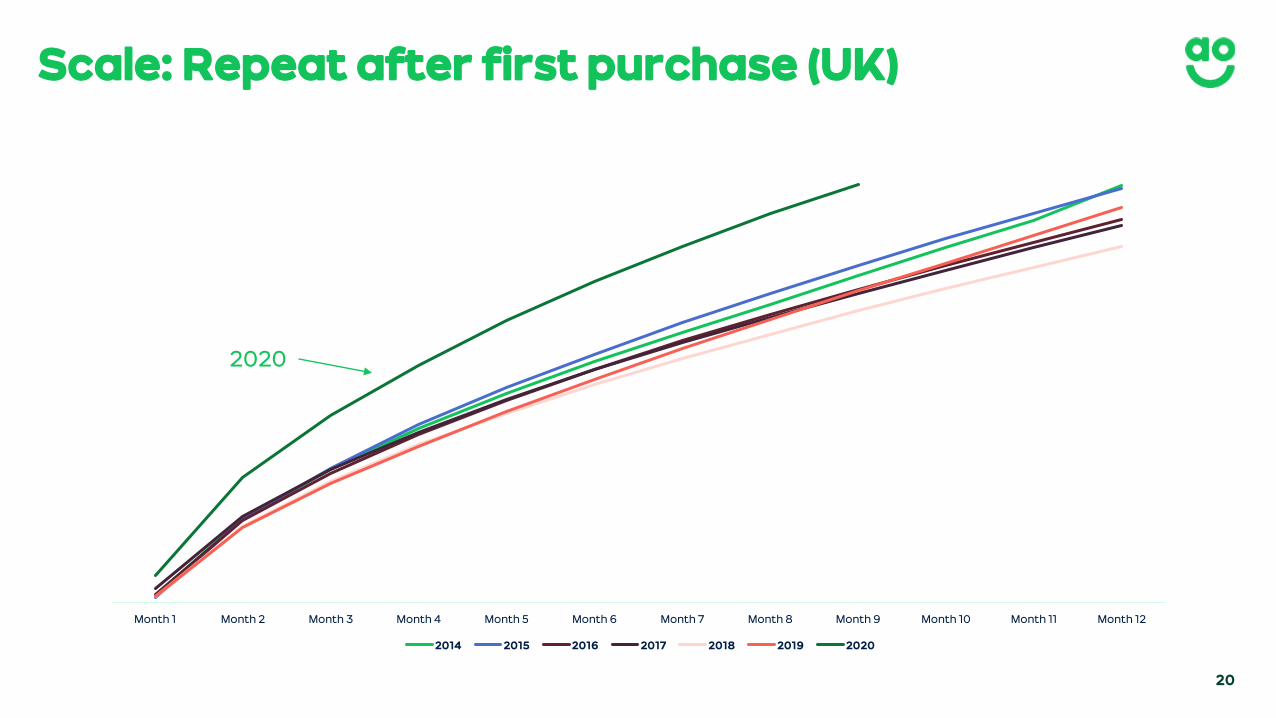
Scale: Repeat after first purchase (UK)
Month 1 Month 2 Month 3 Month 4 Month 5 Month 6 Month 7 Month 8 Month 9 Month 10 Month 11 Month 12
2014 2015 2016 2017 2018 2019 2020
2020
21
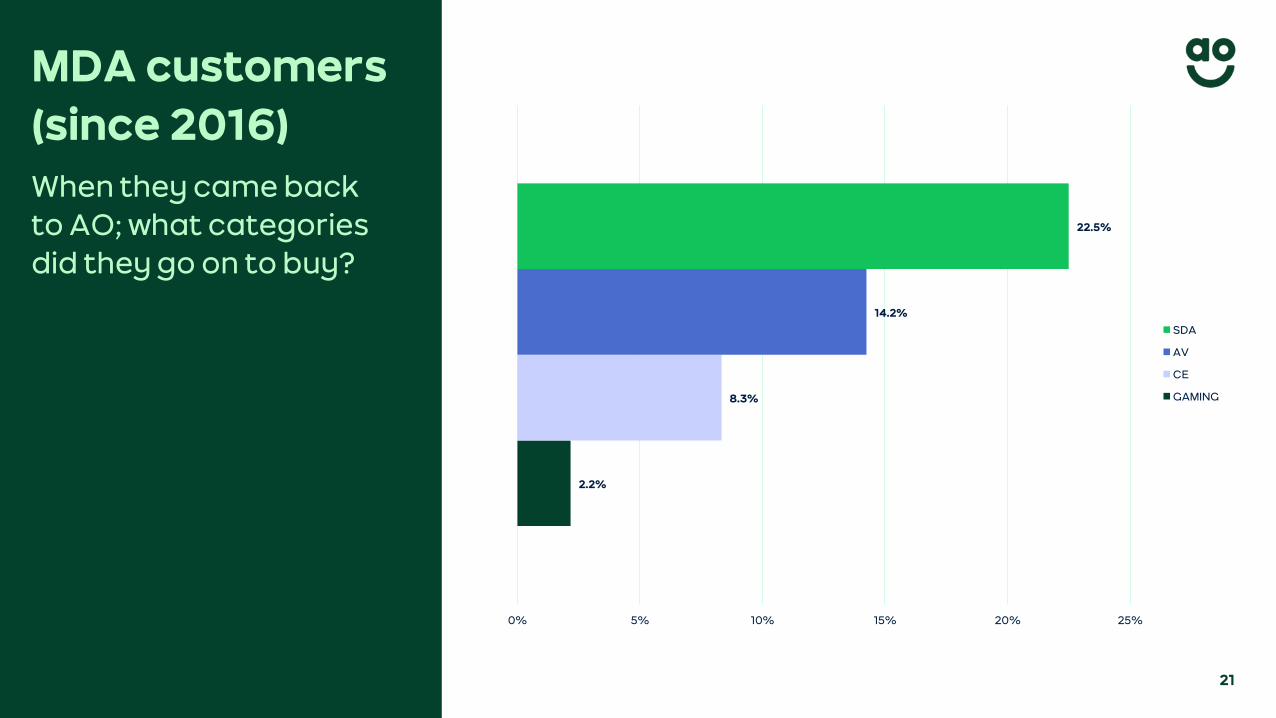
2.2%
8.3%
14.2%
22.5%
0% 5% 10% 15% 20% 25%
SDA
AV
CE
GAMING
MDA customers(since 2016)When they came back to AO; what categories did they go on to buy?
22
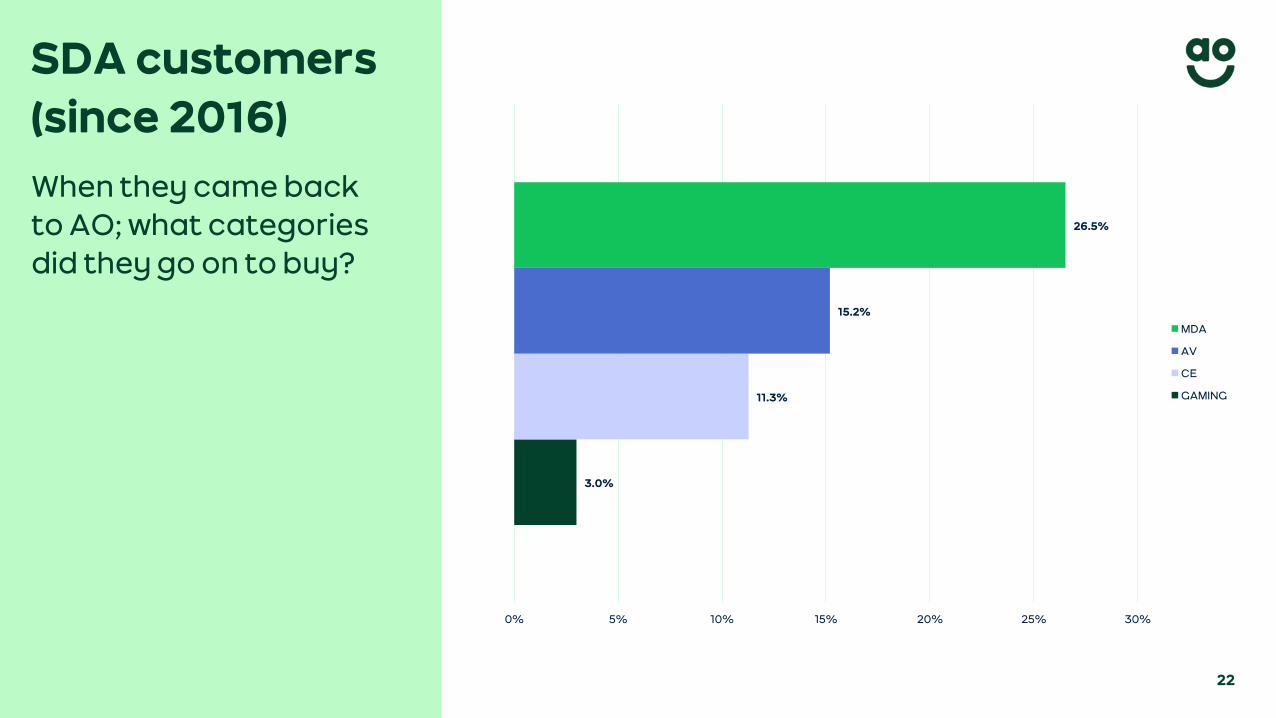
Scale - MDASDA customers(since 2016)
When they came back to AO; what categories did they go on to buy?
3.0%
11.3%
15.2%
26.5%
0% 5% 10% 15% 20% 25% 30%
MDA
AV
CE
GAMING
23
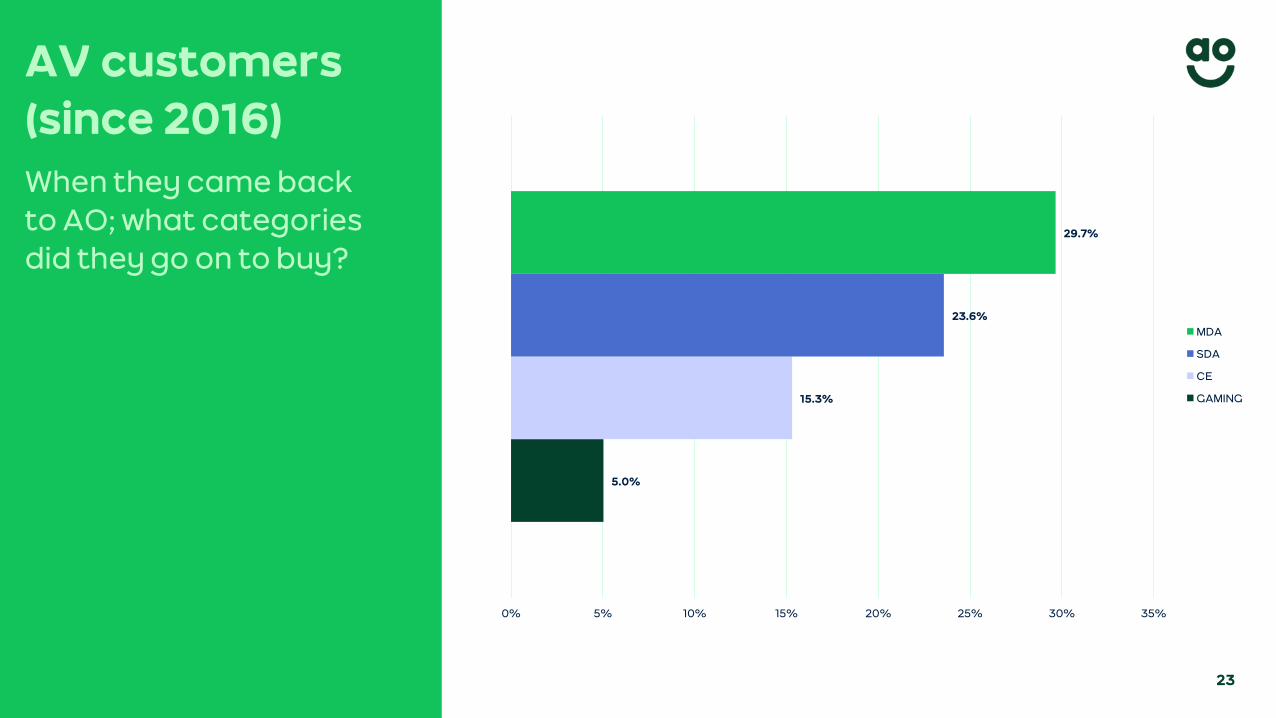
AV customers(since 2016)When they came back to AO; what categories did they go on to buy?
5.0%
15.3%
23.6%
29.7%
0% 5% 10% 15% 20% 25% 30% 35%
MDA
SDA
CE
GAMING
24
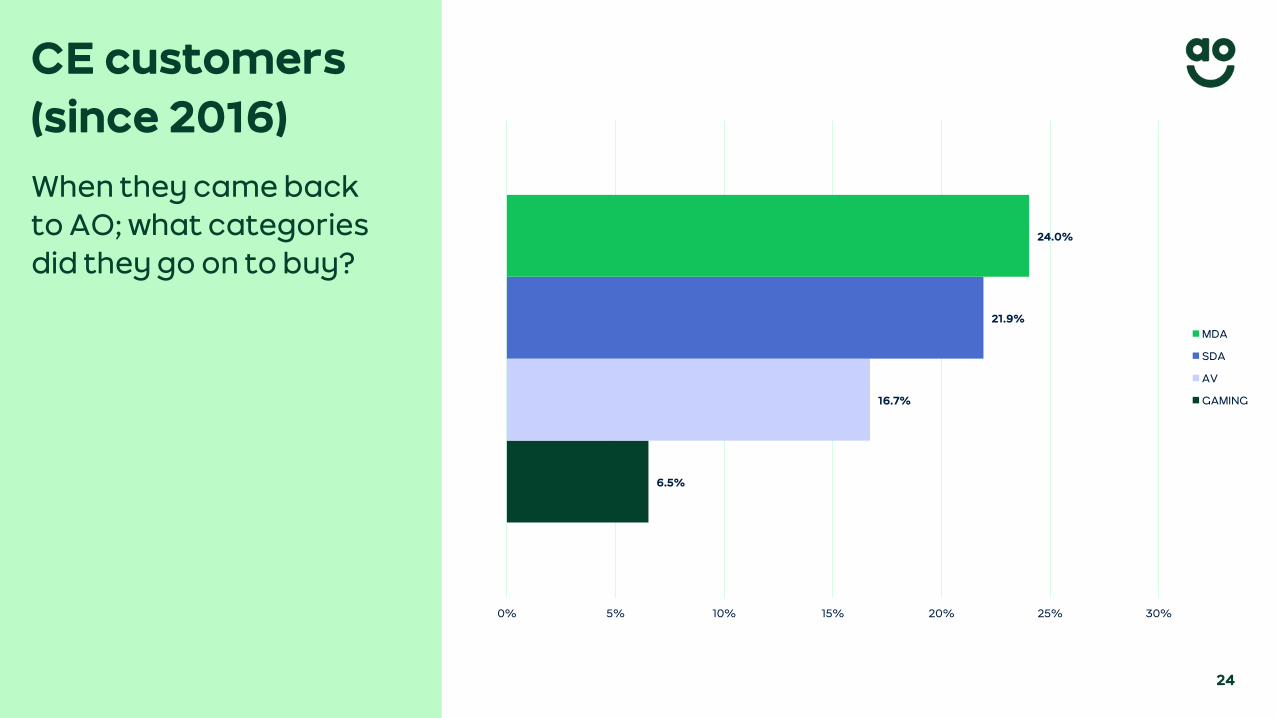
Scale - MDACE customers(since 2016)
When they came back to AO; what categories did they go on to buy?
6.5%
16.7%
21.9%
24.0%
0% 5% 10% 15% 20% 25% 30%
MDA
SDA
AV
GAMING
25
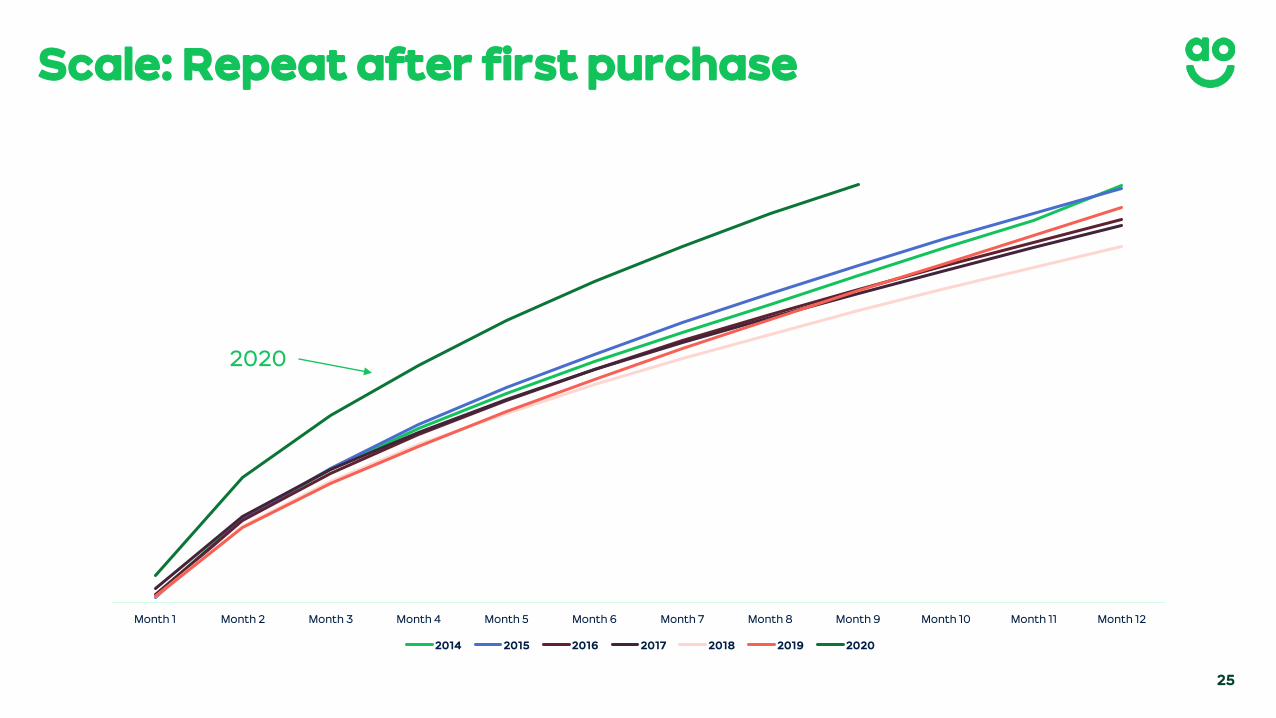
Scale: Repeat after first purchase
Month 1 Month 2 Month 3 Month 4 Month 5 Month 6 Month 7 Month 8 Month 9 Month 10 Month 11 Month 12
2014 2015 2016 2017 2018 2019 2020
2020
26
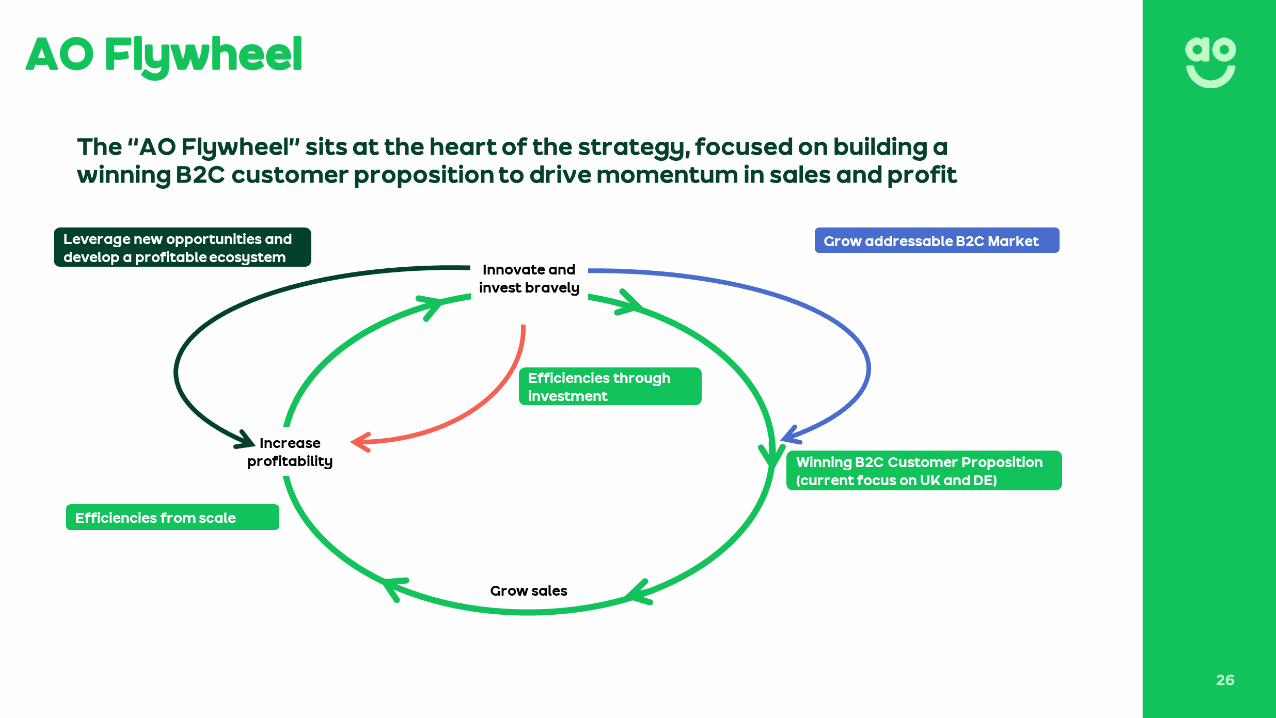
AO Flywheel
27
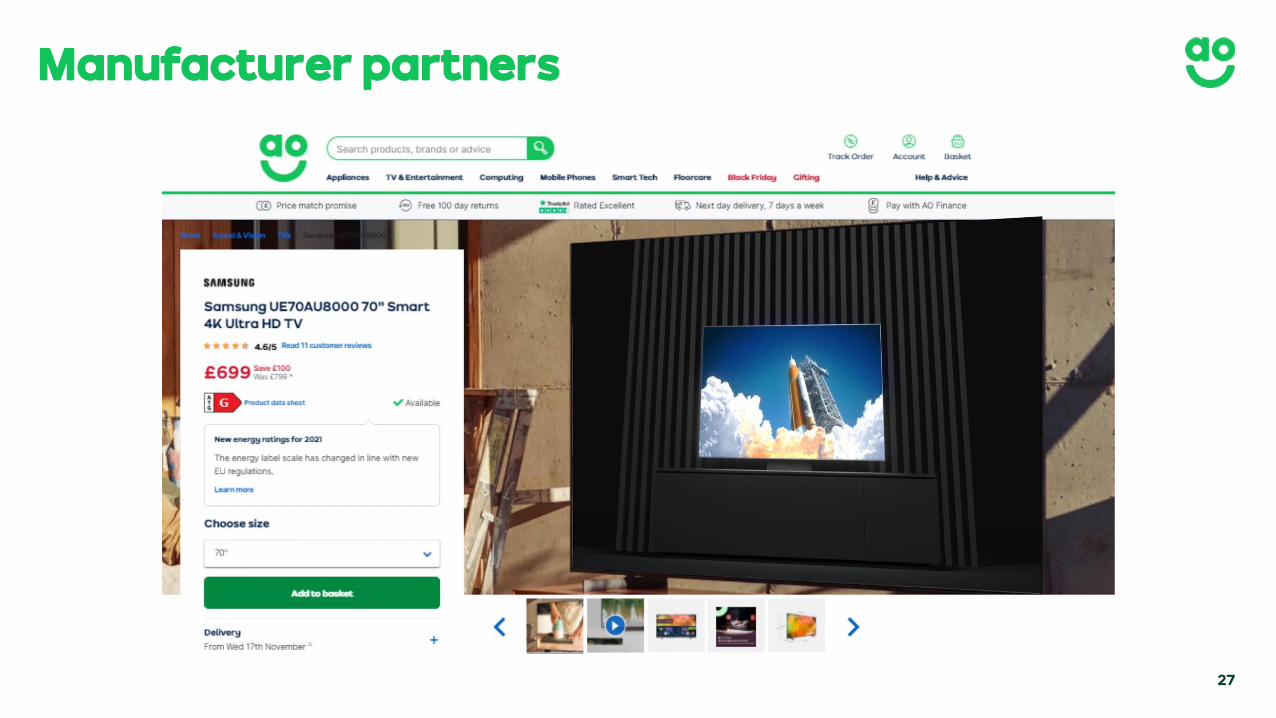
Manufacturer partners
28
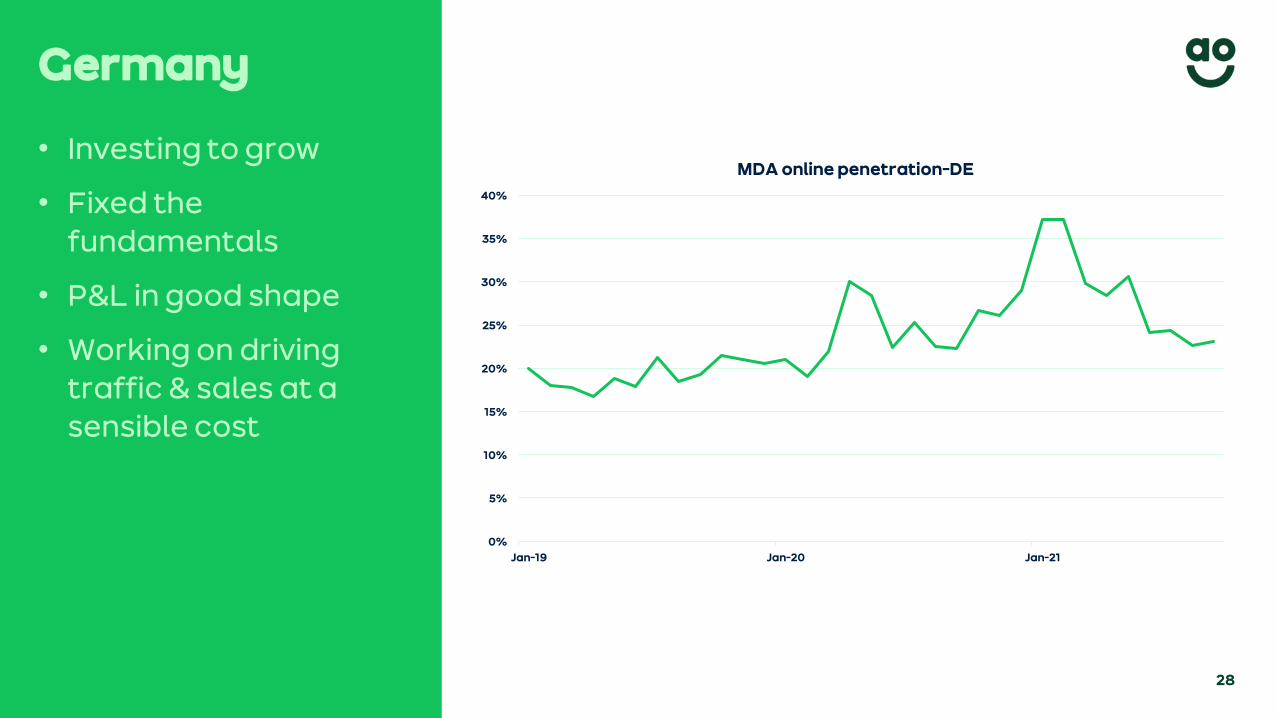
• Investing to grow
• Fixed the fundamentals
• P&L in good shape
• Working on driving traffic & sales at a sensible cost
Germany
0%
5%
10%
15%
20%
25%
30%
35%
40%
Jan-19 Jan-20 Jan-21
MDA online penetration-DE
29
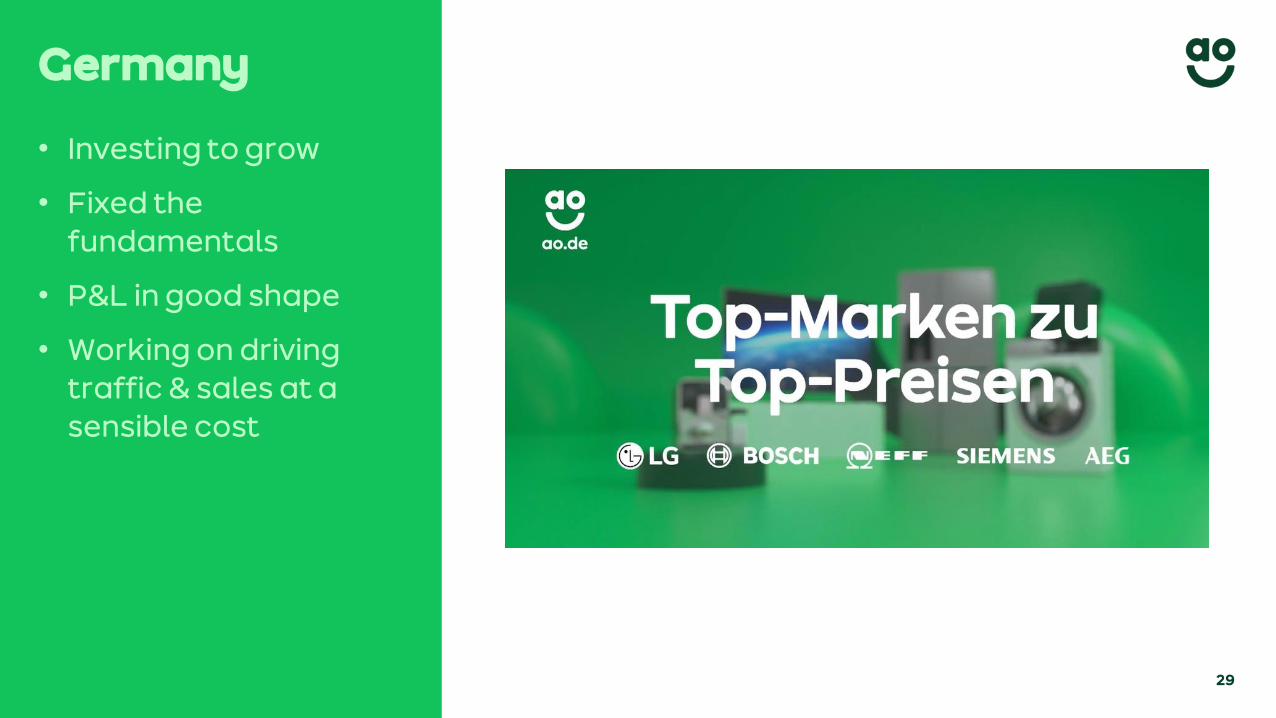
• Investing to grow
• Fixed the fundamentals
• P&L in good shape
• Working on driving traffic & sales at a sensible cost
Germany

30
Further International expansion
• Built a model for international expansion
• Ambition for future territories

Brand
32
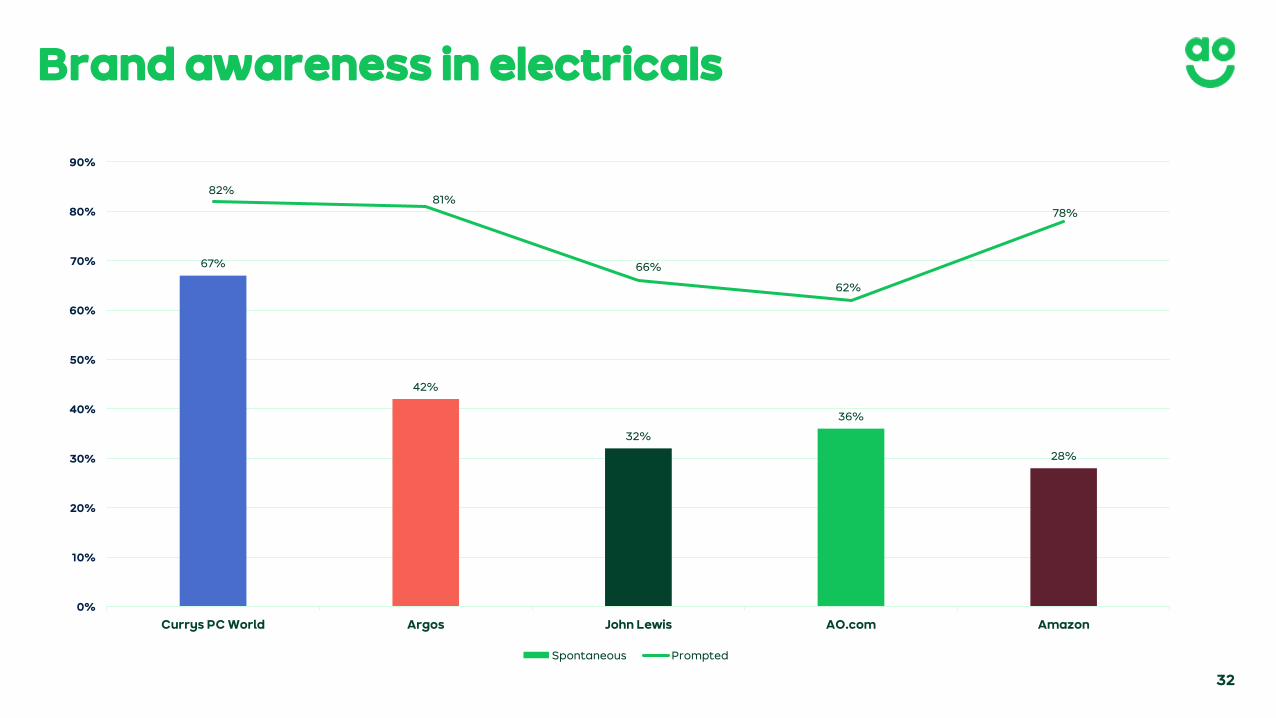
Brand awareness in electricals
67%
42%
32%
36%
28%
82%81%
66%
62%
78%
0%
10%
20%
30%
40%
50%
60%
70%
80%
90%
Currys PC World Argos John Lewis AO.com Amazon
Spontaneous Prompted

33
Doing the right thing
34
Looking ahead
• Challenges are short-term
• Think and invest for long-term while navigating current uncertainty
• Continue putting customers first
• Invest for scale benefits
• Incredible long-term value

Thank youand Questions