Embed Size (px)
Citation preview
Proceedings World Geothermal Congress 2015
Melbourne, Australia, 19-25 April 2015
1
Hydraulic DTH Fluid Hammer Drilling as a Seismic While Drilling (SWD) Source for
Geothermal Exploration and Drilling Prediction
Poletto F. (OGS), Wittig V. (GZB), Schleifer A. (OGS), and Bracke R. (GZB)
(GZB) International Geothermal Centre, Lennershofstrasse 140, 44801 Bochum, Germany; (OGS), Trieste, Italy
[email protected]; [email protected]
Keywords: Geothermal drilling, hydraulic hammer, seismic while drilling, seismic prediction, DTH hammer, water hammer.
ABSTRACT
Hydraulic downhole fluid hammer systems provide an innovative, field proven technology for fast, hard rock drilling from slim to
regular size holes down to potentially any depths. This technology performs via rotary-percussive mechanism, also generating high-
energy downhole axial signals for seismic-while-drilling (SWD) purposes. In this work we describe a seismic-while-drilling
experiment using a down-the-hole (DTH) hydraulic water hammer as the drill-bit source in a shallow well drilled at the GZB test
site. The main objective of the test was to investigate the performance of this type of drill-bit seismic source for 2D and, in
perspective, also 3D reverse VSP purposes, to analyze its seismic emission in relation to the drilling parameters, and to experiment
and evaluate technical aspects for further development of an automated SWD system integrated into the hydraulic DTH hammer
drilling system. We present results with real data obtained during the experiment and by deferred processing, and analyze the
related drilling conditions. We show that the processed seismic signal contains clear and wideband seismic events. Finally we
discuss perspectives for the development and improvement of the DTH-SWD integrated system, to optimize measurements and
implement automated acquisition parameter control for regular full-scale SWD surveys.
1. INTRODUCTION
Drill-bit seismic-while-drilling (SWD) source has been used by oil and gas industry as a borehole seismic technology to provide
usable data while and after drilling in order to describe in detail the geological and geophysical characteristics of the subsurface
around the well and ahead of the drill bit (Poletto and Miranda, 2004; communication by Malin, 2012). The seismic and
geophysical measurements provided by this technology and method help to better understand and predict a geothermal reservoir
and to adjust while-drilling the possible way of mining/reaching it. The SWD data provide structural information to better locate
possible fault zones and their directions, and to identify other anomalies in the geological structure, which is possibly desirable and
important in the 2D and 3D area around the well (Poletto et al., 2011; Poletto and Miranda, 2004).
Without interference with the drilling activity, the typical drill-bit SWD technology so far uses, as its source, the noise of standard
drill bits. These tools may be more favorable than roller-cone bits working by teeth indention and axial loading and unloading
percussive action and, in some cases, less favorable polycrystalline diamond compact (PDC) bits, working mainly by shear action
(e.g., Poletto and Miranda, 2004; Poletto 2005a,b). In the conventional crosscorrelation-deconvolution SWD approach, the method
uses seismic recordings around the well, together with reference (pilot) recordings at the top of the drill string or at bottom hole in
the proximity of the bit (Poletto et al., 2014). Poletto, Corubolo and Comelli (2010) showed that using pilot signals for
crosscorrelation is beneficial also when using the drill-bit source by seismic interferometry (e.g., Wapenaar, Draganov and
Robertsson, 2008; Vasconcelos and Snieder, 2008) SWD approach. In standard SWD applications by roller-cone bits and near-
vertical drilling, surface pilot measurements can be in general successfully utilized to record the drill-bit signal. Advantage of the
approach using only surface pilot sensors is that no recording tools are required in geothermal high-temperature (HT) wells, where
the use of downhole electronics and recording tools tends to be problematic and can be a critical issue. In the process of getting
seismic signals from the vibrating bit, the seismic signature of the drill-bit source varies depending on the type of bit, like roller
cone or PCD, as well as drilling conditions, performance of the drill rig and its driller (Poletto, 2005a; 2005b; Poletto and Bellezza,
2006). To monitor these conditions, quality control during automated SWD is performed driven by drilling parameters, which are
typically transmitted to the SWD system by the mudlogging or drill-control unit available at the rig site (Poletto and Miranda,
2004). In this paper we present SWD conducted with DTH water-hammer drilling technology developed for hard rock and deep
drilling purposes.
New drilling technologies are, amongst others, the key to economic exploitation of deep geothermal reservoirs (Vollmar, Wittig and
Bracke, 2013). The drilling speed or rate of penetration (ROP) of classic drilling technologies, e.g., roller cone and lately also PDC
bits, suffers greatly in deep and hard formations. Thus, the goal is to develop tools with higher ROP and low wear to reduce drilling
and trip time and cost. DTH hammers using air have successfully proven high ROP for a long time in shallow drilling down to
approximately 300 meters. However, to reach greater depth and constant efficiency, the working medium must rather be a liquid,
due to the compressibility and very high inefficiency of air. The use of drill mud for better borehole control is required as a possible
solution. Today, there are only few hydraulic DTH water hammers commercially available based on operation with clean water.
Moreover, it is not yet possible to drill with mud at constant low wear of the hammer parts. Due to this issue, new mud-driven
hammer working principles and prototypes are still being developed and tested at GZB in Germany and private industry worldwide.
Using a downhole DTH fluid hammer with fixed or possibly variable frequency for drilling produces a significant amount of axial
percussive noise. This type of percussive drilling system acts as an intense SWD source with relatively constant percussive
frequency in a process that creates a series of pulses, each of them having a wideband spectrum. When the hydraulic driver will be
able to be operated with a suitable set of drilling percussion frequencies, this hammer technology may eventually allow running
variable frequency sweeps at a given location, and thus may be an improved tool and source for SWD data production and,
consequently, for subsequent data interpretation after processing.
Wittig et al.
2
In recent years GZB in Bochum has done intensive work on testing and developing new DTH fluid and mud hammer systems (e.g.,
Wittig and Bracke, 2012), which shows very promising results to be used for SWD logging purposes in preliminary drilling tests.
Recently, preliminary testing has been conducted at GZB laboratory site together with OGS (Trieste, Italy), making use of the OGS
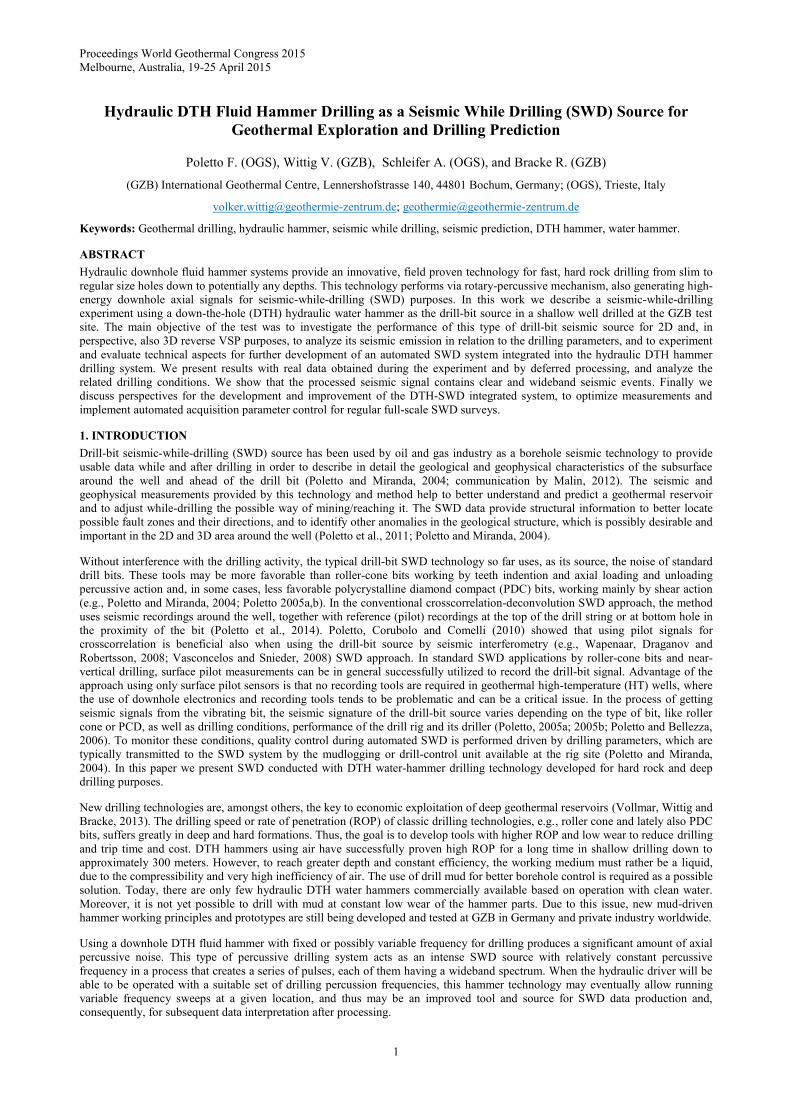
long standing SWD experience and technology adapted for geothermal purposes. Figure 1 shows a schematic layout of the DTH
SWD experiment. The objective was to demonstrate the use of the hammer drilling tool as a source for SWD logging equipment,
for 2D and 3D seismic purposes. For this purpose, the DTH fluid hammer drill rig was instrumented by pilot sensors, and a seismic
recording line was disposed in the proximity of the drilling site, during the drilling of a shallow depth interval from near surface
down to approximately 140 m depth. The analysis and the control of the data required the adaption of the SWD system connected
with the drill-rig control unit for DTH drilling parameters. The integration of drilling and SWD will enable geothermal exploration
to be much more accurate, further targeting the right reservoir location (identify “sweet spot”) by finding and visualizing fault
zones and other anomalies much more precisely via borehole seismic data. Furthermore, by proving seismic signals from sub-
structures underneath / ahead of the drill bit it also makes for a much safer and more economic drilling operation.
In this paper we describe the method, show the results of the preliminary DTH SWD test, and discuss perspectives for this
integrated technology. Some main aspects in the tuning of the SWD and DTH integrated technology are related to the specific
drilling technology based on hydraulic driver and fast drilling conditions, enabling to operate with high rate of penetration (ROP)
and requiring to monitor the signals with appropriate recording parameters.
2. HYDRAULIC FLUID HAMMER DRILLING TECHNOLOGY
The DTH water hammer technology used in the framework of the SWD test presented in this paper was originally developed and
built by Wassara AB in Sweden, a subsidiary of LKAB, the international minerals group based in Sweden (Wittig and Bracke,
2012). This drilling technology is based on intensified flow through water/liquid, driving a downhole piston, resulting in a
percussive drilling action of the drill bit. A rotation action is added by turning the complete drill string from surface via the drill rig
and its top drive. Thus, the working principle of all current DTH water hammer systems is a heavy-weight piston inside a hammer
housing, being powered by a flow through liquid under certain hydraulic energy, meaning flow and pressure (Wittig et al., 2015, in
press). The contained hydraulic energy of the drilling fluid will then be converted via different kinds of valve and control
mechanisms into a fast axial upward and downward motion of the piston, creating a percussive action by directly striking the drill
bit. The percussion frequencies currently vary between 30 and 70 Hz. As the piston transfers its energy directly onto the drill bit
placed underneath, the bit in turn crushes and destroys the rock. The fluid running through this downhole hammer powers the
piston, cools and lubricates the bit, stabilizes the borehole and, most of all, carries up the cuttings from the rock-breaking process.
This process of crushing rock and carrying up cuttings/debris needs to be in good equilibrium in order for the hammer drilling
process to work well and efficiently.
Figure 1: Schematic configuration (not to scale) of DTH water-hammer SWD experiment using the drill bit as a seismic
source. Pilot sensors installed on the drill rig’s top drive record signals transmitted through the drill string and
drilling equipment. Receivers of a nearby seismic line record direct (black continuous arrow) and reflected from
formation interfaces (black dashed arrow), drill-bit seismic signals. The SWD acquisition system hosted in a the
GZB lab was connected to the drill-parameter control system (red arrow), and to the telemetric lines to acquire the
pilot-sensor signals as well as the signals of the line of seismic receivers (blue arrows).
This drill action increases significantly the rate of penetration (ROP), i.e., drill speed, with respect to conventional rock bit rotary
systems. This is a primary target to improve the drilling system, useful for geothermal drilling by fast drilling performance
purposes. At the same time, this type of drilling action provides an effective drill-bit axial source usable for seismic while drilling
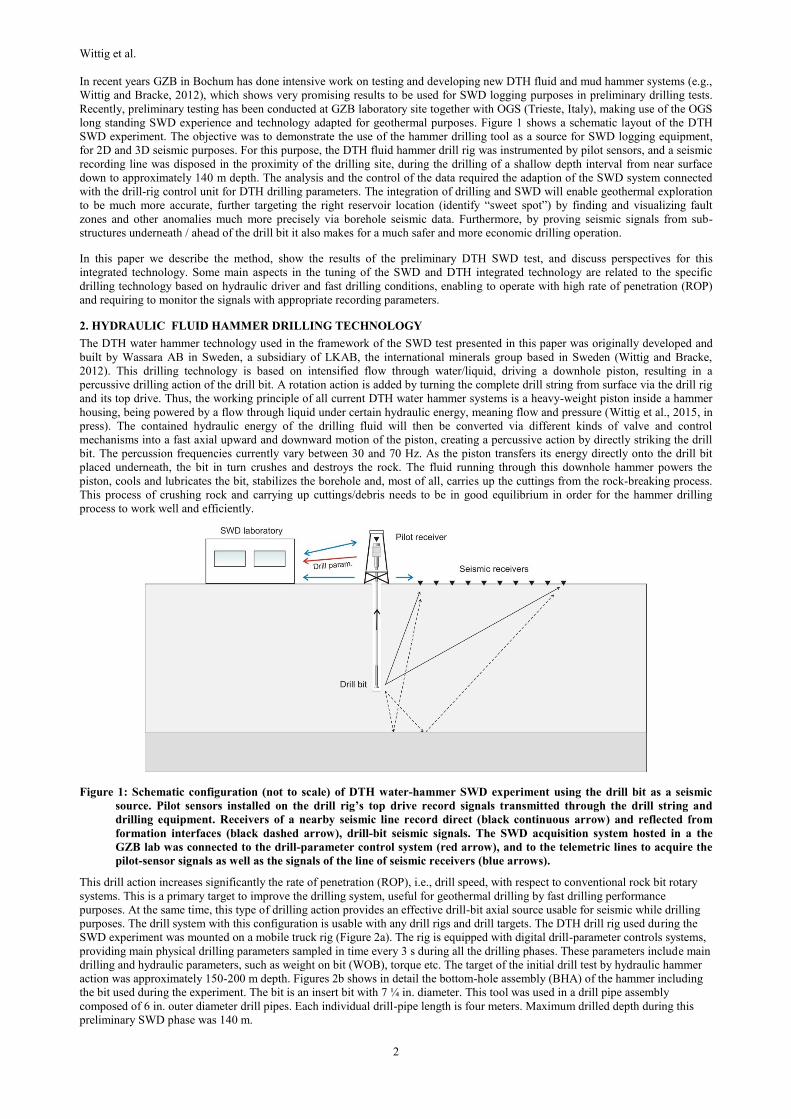
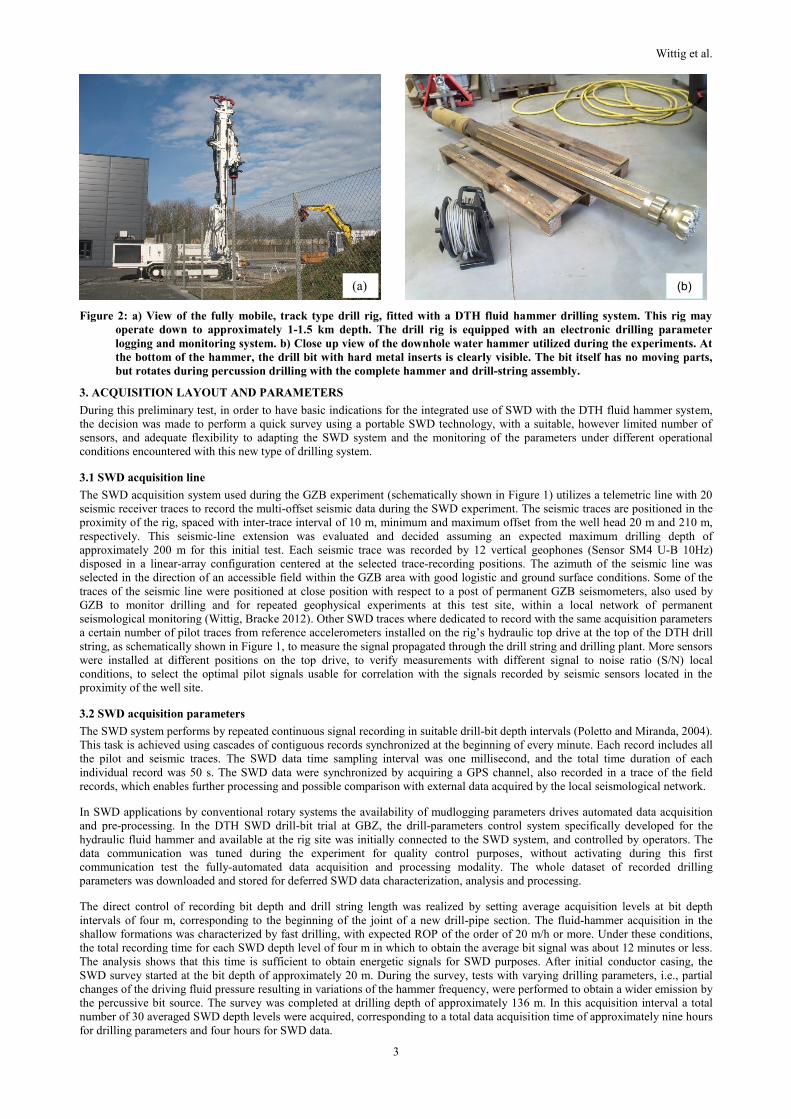
purposes. The drill system with this configuration is usable with any drill rigs and drill targets. The DTH drill rig used during the
SWD experiment was mounted on a mobile truck rig (Figure 2a). The rig is equipped with digital drill-parameter controls systems,
providing main physical drilling parameters sampled in time every 3 s during all the drilling phases. These parameters include main
drilling and hydraulic parameters, such as weight on bit (WOB), torque etc. The target of the initial drill test by hydraulic hammer
action was approximately 150-200 m depth. Figures 2b shows in detail the bottom-hole assembly (BHA) of the hammer including
the bit used during the experiment. The bit is an insert bit with 7 ¼ in. diameter. This tool was used in a drill pipe assembly
composed of 6 in. outer diameter drill pipes. Each individual drill-pipe length is four meters. Maximum drilled depth during this
preliminary SWD phase was 140 m.
Wittig et al.
3
Figure 2: a) View of the fully mobile, track type drill rig, fitted with a DTH fluid hammer drilling system. This rig may
operate down to approximately 1-1.5 km depth. The drill rig is equipped with an electronic drilling parameter
logging and monitoring system. b) Close up view of the downhole water hammer utilized during the experiments. At
the bottom of the hammer, the drill bit with hard metal inserts is clearly visible. The bit itself has no moving parts,
but rotates during percussion drilling with the complete hammer and drill-string assembly.
3. ACQUISITION LAYOUT AND PARAMETERS
During this preliminary test, in order to have basic indications for the integrated use of SWD with the DTH fluid hammer system,
the decision was made to perform a quick survey using a portable SWD technology, with a suitable, however limited number of
sensors, and adequate flexibility to adapting the SWD system and the monitoring of the parameters under different operational
conditions encountered with this new type of drilling system.
3.1 SWD acquisition line
The SWD acquisition system used during the GZB experiment (schematically shown in Figure 1) utilizes a telemetric line with 20
seismic receiver traces to record the multi-offset seismic data during the SWD experiment. The seismic traces are positioned in the
proximity of the rig, spaced with inter-trace interval of 10 m, minimum and maximum offset from the well head 20 m and 210 m,
respectively. This seismic-line extension was evaluated and decided assuming an expected maximum drilling depth of
approximately 200 m for this initial test. Each seismic trace was recorded by 12 vertical geophones (Sensor SM4 U-B 10Hz)
disposed in a linear-array configuration centered at the selected trace-recording positions. The azimuth of the seismic line was
selected in the direction of an accessible field within the GZB area with good logistic and ground surface conditions. Some of the
traces of the seismic line were positioned at close position with respect to a post of permanent GZB seismometers, also used by
GZB to monitor drilling and for repeated geophysical experiments at this test site, within a local network of permanent
seismological monitoring (Wittig, Bracke 2012). Other SWD traces where dedicated to record with the same acquisition parameters
a certain number of pilot traces from reference accelerometers installed on the rig’s hydraulic top drive at the top of the DTH drill
string, as schematically shown in Figure 1, to measure the signal propagated through the drill string and drilling plant. More sensors
were installed at different positions on the top drive, to verify measurements with different signal to noise ratio (S/N) local
conditions, to select the optimal pilot signals usable for correlation with the signals recorded by seismic sensors located in the
proximity of the well site.
3.2 SWD acquisition parameters
The SWD system performs by repeated continuous signal recording in suitable drill-bit depth intervals (Poletto and Miranda, 2004).
This task is achieved using cascades of contiguous records synchronized at the beginning of every minute. Each record includes all
the pilot and seismic traces. The SWD data time sampling interval was one millisecond, and the total time duration of each
individual record was 50 s. The SWD data were synchronized by acquiring a GPS channel, also recorded in a trace of the field
records, which enables further processing and possible comparison with external data acquired by the local seismological network.
In SWD applications by conventional rotary systems the availability of mudlogging parameters drives automated data acquisition
and pre-processing. In the DTH SWD drill-bit trial at GBZ, the drill-parameters control system specifically developed for the
hydraulic fluid hammer and available at the rig site was initially connected to the SWD system, and controlled by operators. The
data communication was tuned during the experiment for quality control purposes, without activating during this first
communication test the fully-automated data acquisition and processing modality. The whole dataset of recorded drilling
parameters was downloaded and stored for deferred SWD data characterization, analysis and processing.
The direct control of recording bit depth and drill string length was realized by setting average acquisition levels at bit depth
intervals of four m, corresponding to the beginning of the joint of a new drill-pipe section. The fluid-hammer acquisition in the
shallow formations was characterized by fast drilling, with expected ROP of the order of 20 m/h or more. Under these conditions,
the total recording time for each SWD depth level of four m in which to obtain the average bit signal was about 12 minutes or less.
The analysis shows that this time is sufficient to obtain energetic signals for SWD purposes. After initial conductor casing, the
SWD survey started at the bit depth of approximately 20 m. During the survey, tests with varying drilling parameters, i.e., partial
changes of the driving fluid pressure resulting in variations of the hammer frequency, were performed to obtain a wider emission by
the percussive bit source. The survey was completed at drilling depth of approximately 136 m. In this acquisition interval a total
number of 30 averaged SWD depth levels were acquired, corresponding to a total data acquisition time of approximately nine hours
for drilling parameters and four hours for SWD data.
(a) (b)
Wittig et al.
4
3.3 Drilling parameters
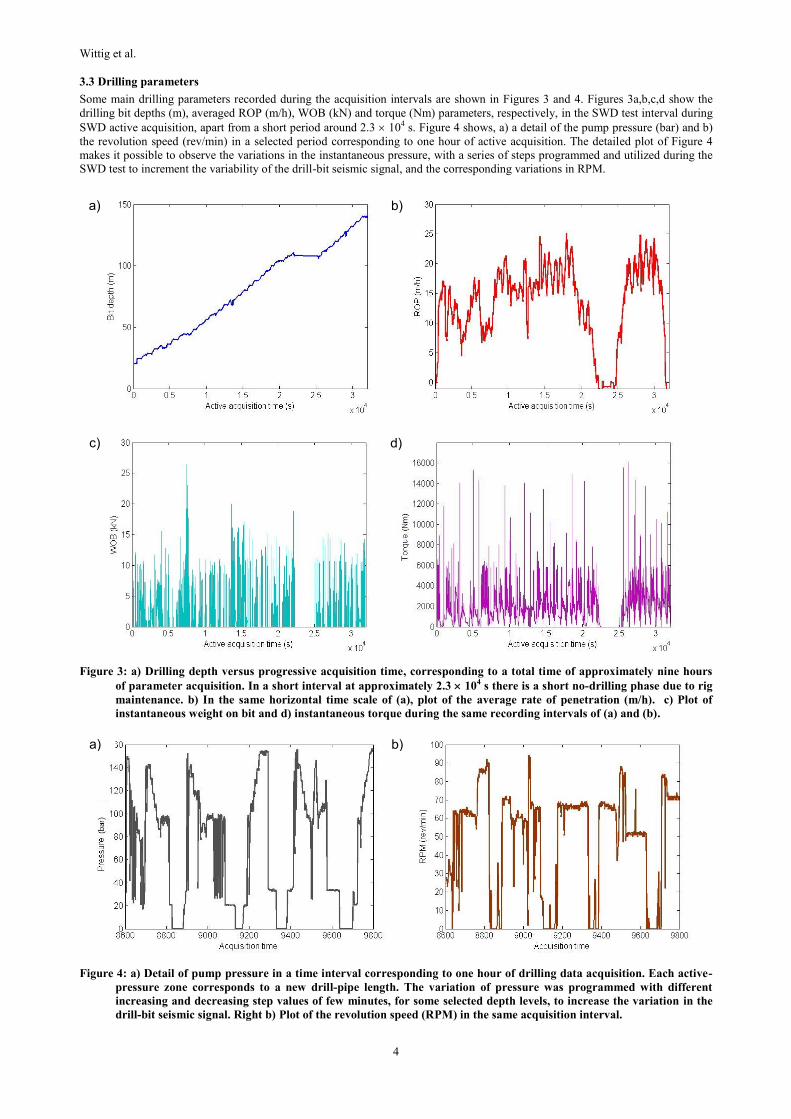
Some main drilling parameters recorded during the acquisition intervals are shown in Figures 3 and 4. Figures 3a,b,c,d show the
drilling bit depths (m), averaged ROP (m/h), WOB (kN) and torque (Nm) parameters, respectively, in the SWD test interval during
SWD active acquisition, apart from a short period around 2.3 104 s. Figure 4 shows, a) a detail of the pump pressure (bar) and b)
the revolution speed (rev/min) in a selected period corresponding to one hour of active acquisition. The detailed plot of Figure 4
makes it possible to observe the variations in the instantaneous pressure, with a series of steps programmed and utilized during the
SWD test to increment the variability of the drill-bit seismic signal, and the corresponding variations in RPM.
Figure 3: a) Drilling depth versus progressive acquisition time, corresponding to a total time of approximately nine hours
of parameter acquisition. In a short interval at approximately 2.3 104 s there is a short no-drilling phase due to rig
maintenance. b) In the same horizontal time scale of (a), plot of the average rate of penetration (m/h). c) Plot of
instantaneous weight on bit and d) instantaneous torque during the same recording intervals of (a) and (b).
Figure 4: a) Detail of pump pressure in a time interval corresponding to one hour of drilling data acquisition. Each active-
pressure zone corresponds to a new drill-pipe length. The variation of pressure was programmed with different
increasing and decreasing step values of few minutes, for some selected depth levels, to increase the variation in the
drill-bit seismic signal. Right b) Plot of the revolution speed (RPM) in the same acquisition interval.
a) b)
c)
a) b)
d)
Wittig et al.
5
4. SWD RESULTS
The acquisition of SWD data at regular drill-bit source depth intervals provides while drilling reverse vertical seismic profile
(RVSP) data, i.e., borehole seismic profiles with reciprocal geometry with respect to the conventional wireline ones (e.g., Poletto
and Miranda, 2004). In this initial test, the recording start and stop was partially automated with the control of the acquisition
parameters managed directly by in-field operators. The acquisition of the SWD data was performed starting at depth 20 m. The
acquisition depth interval was set four m, following the start of each new section of drill pipe. Depending on the different rate of
penetrations and drilling conditions a variable number of records, ranging between 4 and 14, was acquired for each individual drill-
pipe length. The deepest SWD level was at bit depth 136 m, the total number of source depth levels was 30. The total recording
time during drilling was approximately four hours, with average recording time of approximately eight minutes per depth level.
4.1 Raw field data
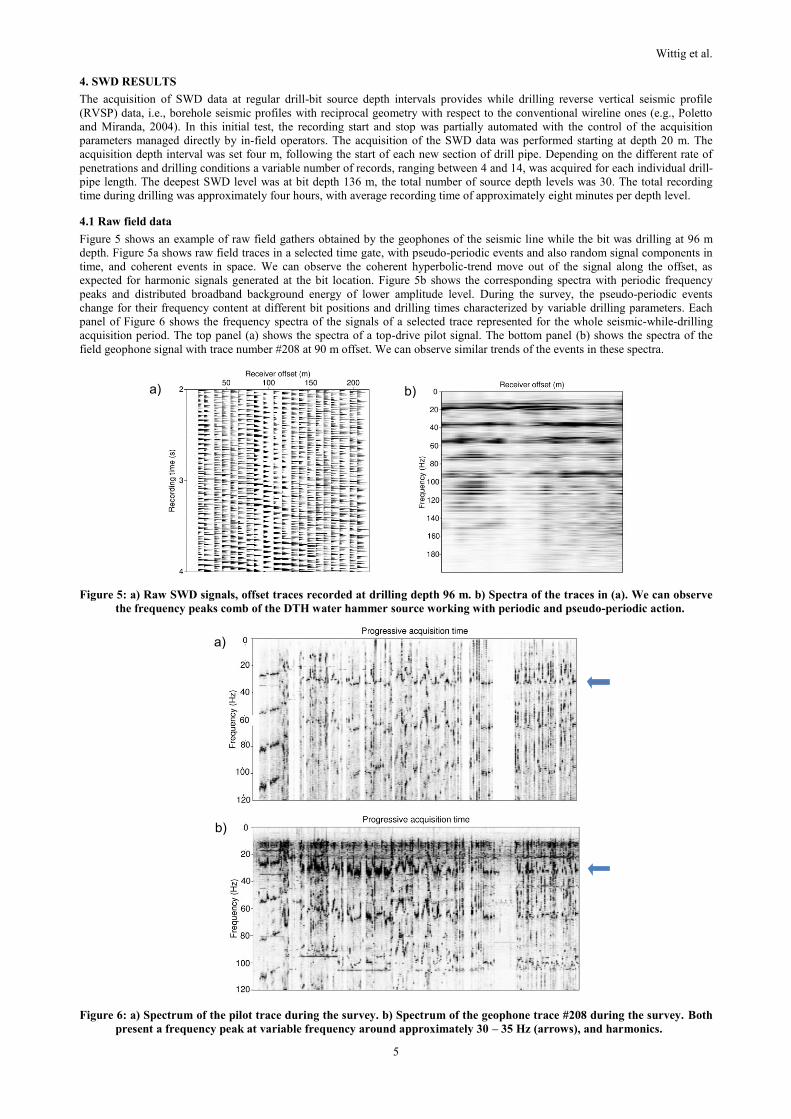
Figure 5 shows an example of raw field gathers obtained by the geophones of the seismic line while the bit was drilling at 96 m
depth. Figure 5a shows raw field traces in a selected time gate, with pseudo-periodic events and also random signal components in
time, and coherent events in space. We can observe the coherent hyperbolic-trend move out of the signal along the offset, as
expected for harmonic signals generated at the bit location. Figure 5b shows the corresponding spectra with periodic frequency
peaks and distributed broadband background energy of lower amplitude level. During the survey, the pseudo-periodic events
change for their frequency content at different bit positions and drilling times characterized by variable drilling parameters. Each
panel of Figure 6 shows the frequency spectra of the signals of a selected trace represented for the whole seismic-while-drilling
acquisition period. The top panel (a) shows the spectra of a top-drive pilot signal. The bottom panel (b) shows the spectra of the
field geophone signal with trace number #208 at 90 m offset. We can observe similar trends of the events in these spectra.
Figure 5: a) Raw SWD signals, offset traces recorded at drilling depth 96 m. b) Spectra of the traces in (a). We can observe
the frequency peaks comb of the DTH water hammer source working with periodic and pseudo-periodic action.
Figure 6: a) Spectrum of the pilot trace during the survey. b) Spectrum of the geophone trace #208 during the survey. Both
present a frequency peak at variable frequency around approximately 30 – 35 Hz (arrows), and harmonics.
a) b)
a)
b)
Wittig et al.
6
4.2 Basic SWD signal processing
The raw field data were pre-processed while drilling to obtain interpretable seismograms. We recall the common and well-known
SWD approach by cross-correlation with a reference pilot signal (e.g., Rector and Marion, 1991; Poletto and Miranda, 2004), in
which the signal of the geophone trace x(t) is cross-correlated with the corresponding signal of a suitable-selected pilot trace p(t).
The pilot trace can be obtained in different ways and, for some aspects, the process is similar to seismic interferometry (e.g.,
Wapenaar et al., 2008). This crosscorrelation process to get interpretable seismograms from raw drill-bit field data can be simply
expressed in the Fourier frequency domain as
),()()( * ii i PXS (1)
where is the angular frequency and ‘*’ denotes complex conjugation. The summation index i represents the field-record index,
and the summation is extended over records all belonging to the same source-depth level, thus providing an average result in the
depth-level interval. In our case the depth level intervals were sampled every four meters, in correspondence of the drill-pipe
lengths. The seismogram s(t) is obtained by inverse-Fourier transforming Equation (1). The cross-correlation approach extracts the
drill-bit correlated signal in the seismic recordings. It requires also correcting for propagation and filtering effects contained in the
pilot trace p(t), to obtain the seismic signal in the trace s(t) with correct delays, and preserve only the bit-to-receiver seismic transfer
function of x(t). In case of ideal wideband random source signals, say, as when using a white random source, this process recovers a
seismic trace as from a transient source of impulsive waveform acting at the bit location. Depending on the nature of the drill and of
the bit source dynamic behavior, the drill-bit SWD data typically deviate from these conditions, so that additional processing is
necessary to improve the RVSP result by removing the source signature and pilot transfer function. An effective approach is to use
the average pilot autocorrelation
),()()( * ii i PPA (2)
to calculate a deconvolution operator D(), so that the deconvolved seismogram becomes
).()()()( * ii iD PXDS (3)
Previous equations assume in some way stationary transfer functions over the summation domain. Depending on the variability and
characteristics of the source, Equations (2) and (3) can be also used in a modified form to calculate and apply, record per record (or
time gate per time gate), non- averaged operators Di() derived from autocorrelations Ai()=Pi()P*i() before the summation of
the data of a depth level, namely
).()()()( * ii iiDI PXDS (4)
The deconvolution operators are calculated and applied either one-sided using D(), to remove anti-causal cross-correlation events
introduced by the pilot signal, or two sided by including and applying a causal operator for the bit radiated signal when the source
periodic or pseudo-periodic effects are relevant and persistent also in the seismic signal. A causal deconvolution operator can be
obtained, as an approximation, from the complex conjugate of D() or by signal focusing methods. These different deconvolution
approaches provide different approximated solutions, in terms of transient-signal focusing and presence of residual noise after
inverse filtering. The type and quality of pilot signal is important in this process. In the DTH SWD trial we have investigated the
drilling and recording conditions, by experimenting different pilot sensor solutions, in terms of reference transducer (accelerometer)
optimal location on the top drive on the rig, and the use of off-rig sensors (geophone), which also detect a relevant component of
drill bit signal on the ground, also at high seismic frequencies. Figures 7 and 8 show two different examples of cross-correlated and
two-sided deconvolved data obtained at close drilling depth positions using the reference pilot signal of an accelerometer installed
on the top drive. These two levels are characterized by different source emission, with (Figure 7) less relevant and (Figure 8) more
relevant periodic behavior of the hammer bit source, interpreted as relative to a percussion frequency of 31-33 Hz (see also the
general trends of Figure 6).
4.3 Pilot signal analysis
The quality control of the drill-bit SWD signal typically uses the axial pilot signal analysis to characterize the bit source and the
wave propagation in the drill string from bottom hole to surface. The average pilot signal transfer function per depth level can be
represented, aligned at zero time, by the pilot-signal auto correlations after one-sided deconvolution, which is applied to remove the
anti-causal events in the pilot autocorrelation. This approach makes it possible to identify and interpret drill-string events, such as
long period multiples between bottom hole and top of the drill string, as well as short period bottom hole reverberations, and other
possible acoustic events developed during drilling. It also may evidence possible presence of other noise sources.
In the DTH SWD experiment at GZB test site the drilling interval is quite short, from 20 to 136 m, and this makes the signal
analysis in depth less effective. The signal analysis confirms that the observed events represent contributions of the pilot signal
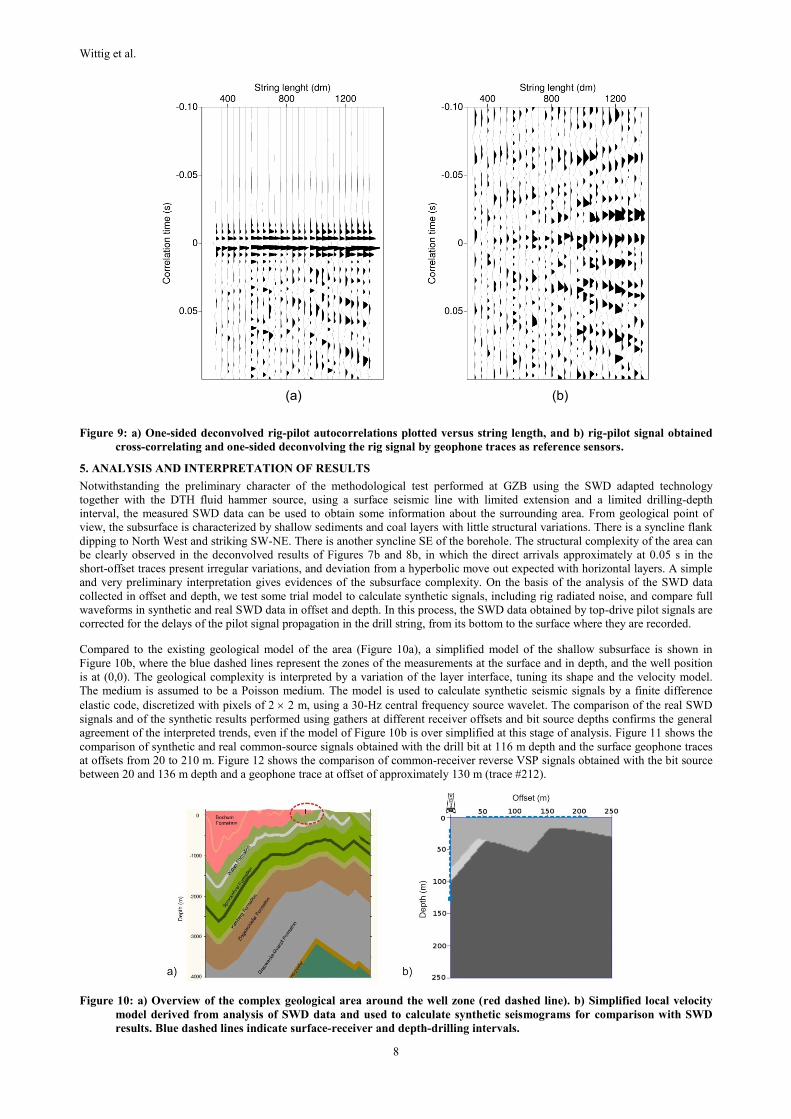
from the bit. Figure 9a shows the top-drive pilot signals plotted versus drill-string length. In this example the data are filtered in a
high-frequency bandwidth above 36 Hz, to better evidence short-range propagation details in a short-time correlation window. The
direct arrival aligned at zero time is represented by negative polarity, to better evidence reflection events at approximately 0.05 s at
positive correlation times in the deeper traces. At this stage, the analysis is only partial, also due to the short length of the
investigated interval. Also in the presence of a significant amount of drill-bit signal energy in the pilot signal, some noise is present
due to local noisy conditions at the pilot recording position on the top drive, and due to the limited capability to increase the amount
of the stacked data to improve S/N (random), due to high rate of penetration with this type of system.
Wittig et al.
7
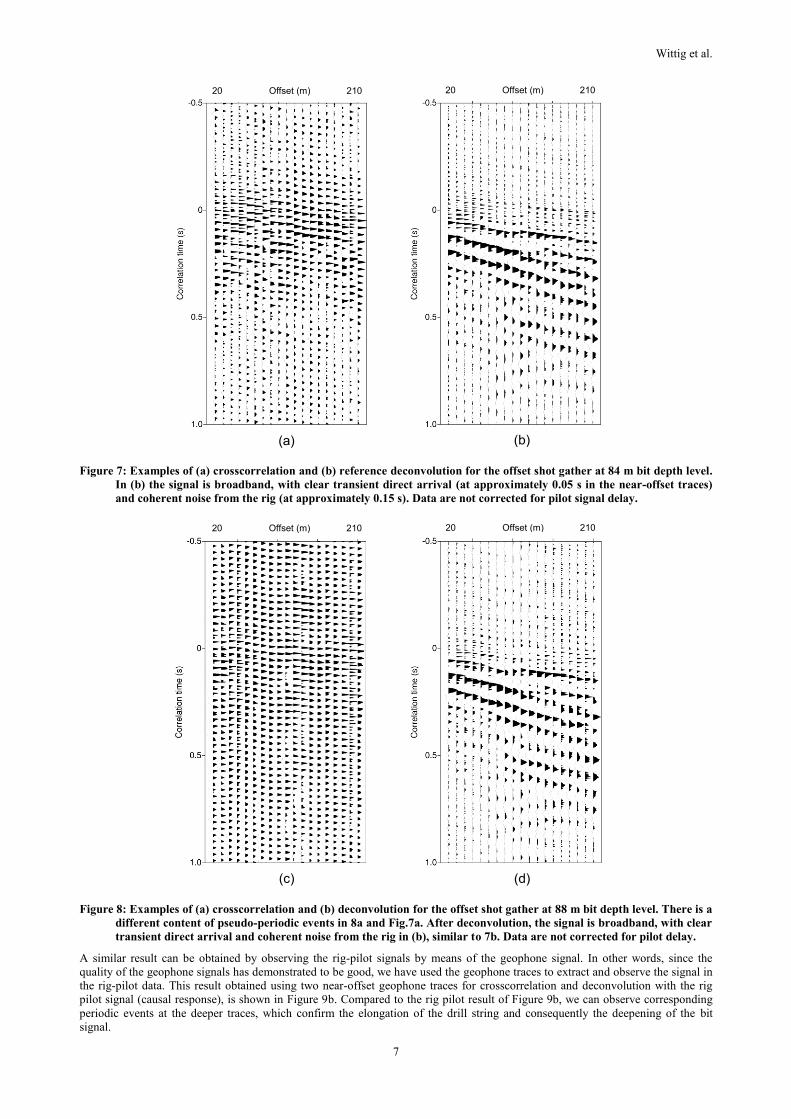
Figure 7: Examples of (a) crosscorrelation and (b) reference deconvolution for the offset shot gather at 84 m bit depth level.
In (b) the signal is broadband, with clear transient direct arrival (at approximately 0.05 s in the near-offset traces)
and coherent noise from the rig (at approximately 0.15 s). Data are not corrected for pilot signal delay.
Figure 8: Examples of (a) crosscorrelation and (b) deconvolution for the offset shot gather at 88 m bit depth level. There is a
different content of pseudo-periodic events in 8a and Fig.7a. After deconvolution, the signal is broadband, with clear
transient direct arrival and coherent noise from the rig in (b), similar to 7b. Data are not corrected for pilot delay.
A similar result can be obtained by observing the rig-pilot signals by means of the geophone signal. In other words, since the
quality of the geophone signals has demonstrated to be good, we have used the geophone traces to extract and observe the signal in
the rig-pilot data. This result obtained using two near-offset geophone traces for crosscorrelation and deconvolution with the rig
pilot signal (causal response), is shown in Figure 9b. Compared to the rig pilot result of Figure 9b, we can observe corresponding
periodic events at the deeper traces, which confirm the elongation of the drill string and consequently the deepening of the bit
signal.
(a) (b)
(c) (d)
20 Offset (m) 210 20 Offset (m) 210
20 Offset (m) 210 20 Offset (m) 210
Wittig et al.
8
Figure 9: a) One-sided deconvolved rig-pilot autocorrelations plotted versus string length, and b) rig-pilot signal obtained
cross-correlating and one-sided deconvolving the rig signal by geophone traces as reference sensors.
5. ANALYSIS AND INTERPRETATION OF RESULTS
Notwithstanding the preliminary character of the methodological test performed at GZB using the SWD adapted technology
together with the DTH fluid hammer source, using a surface seismic line with limited extension and a limited drilling-depth
interval, the measured SWD data can be used to obtain some information about the surrounding area. From geological point of
view, the subsurface is characterized by shallow sediments and coal layers with little structural variations. There is a syncline flank
dipping to North West and striking SW-NE. There is another syncline SE of the borehole. The structural complexity of the area can
be clearly observed in the deconvolved results of Figures 7b and 8b, in which the direct arrivals approximately at 0.05 s in the
short-offset traces present irregular variations, and deviation from a hyperbolic move out expected with horizontal layers. A simple
and very preliminary interpretation gives evidences of the subsurface complexity. On the basis of the analysis of the SWD data
collected in offset and depth, we test some trial model to calculate synthetic signals, including rig radiated noise, and compare full
waveforms in synthetic and real SWD data in offset and depth. In this process, the SWD data obtained by top-drive pilot signals are
corrected for the delays of the pilot signal propagation in the drill string, from its bottom to the surface where they are recorded.
Compared to the existing geological model of the area (Figure 10a), a simplified model of the shallow subsurface is shown in
Figure 10b, where the blue dashed lines represent the zones of the measurements at the surface and in depth, and the well position
is at (0,0). The geological complexity is interpreted by a variation of the layer interface, tuning its shape and the velocity model.
The medium is assumed to be a Poisson medium. The model is used to calculate synthetic seismic signals by a finite difference
elastic code, discretized with pixels of 2 2 m, using a 30-Hz central frequency source wavelet. The comparison of the real SWD
signals and of the synthetic results performed using gathers at different receiver offsets and bit source depths confirms the general
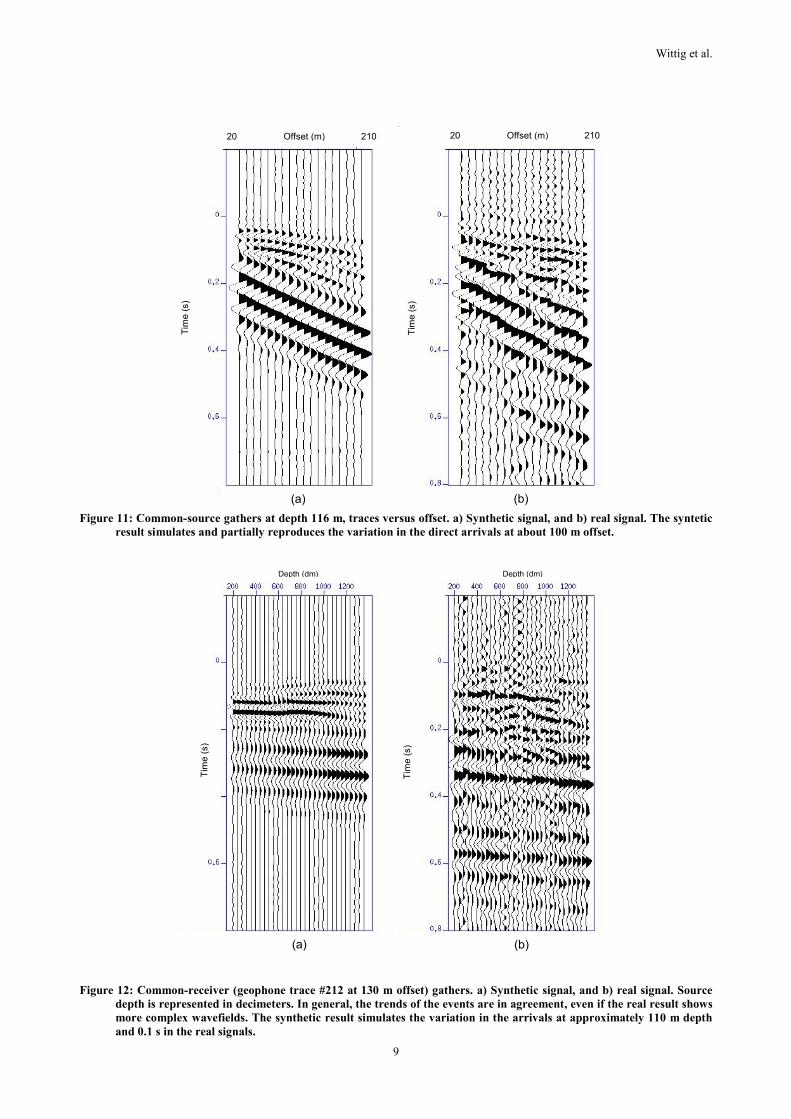
agreement of the interpreted trends, even if the model of Figure 10b is over simplified at this stage of analysis. Figure 11 shows the
comparison of synthetic and real common-source signals obtained with the drill bit at 116 m depth and the surface geophone traces
at offsets from 20 to 210 m. Figure 12 shows the comparison of common-receiver reverse VSP signals obtained with the bit source
between 20 and 136 m depth and a geophone trace at offset of approximately 130 m (trace #212).
Figure 10: a) Overview of the complex geological area around the well zone (red dashed line). b) Simplified local velocity
model derived from analysis of SWD data and used to calculate synthetic seismograms for comparison with SWD
results. Blue dashed lines indicate surface-receiver and depth-drilling intervals.
(b) (a)
Wittig et al.
9
Figure 11: Common-source gathers at depth 116 m, traces versus offset. a) Synthetic signal, and b) real signal. The syntetic
result simulates and partially reproduces the variation in the direct arrivals at about 100 m offset.
Figure 12: Common-receiver (geophone trace #212 at 130 m offset) gathers. a) Synthetic signal, and b) real signal. Source
depth is represented in decimeters. In general, the trends of the events are in agreement, even if the real result shows
more complex wavefields. The synthetic result simulates the variation in the arrivals at approximately 110 m depth
and 0.1 s in the real signals.
(b) (a)
(b)
20 Offset (m) 210 20 Offset (m) 210
Tim
e (
s)
Tim
e (
s)
Tim
e (
s)
Tim
e (
s)
Depth (dm) Depth (dm)
(a)
Wittig et al.
10
6. USE OF OTHER PILOT SIGNALS
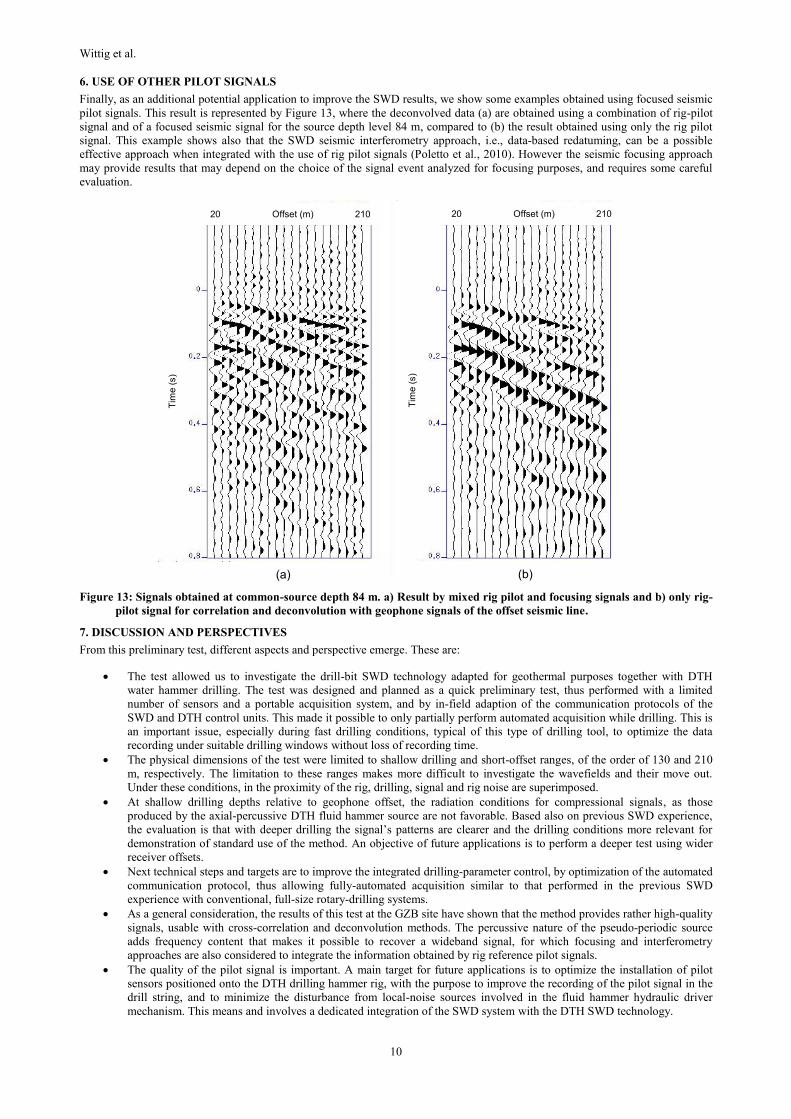
Finally, as an additional potential application to improve the SWD results, we show some examples obtained using focused seismic
pilot signals. This result is represented by Figure 13, where the deconvolved data (a) are obtained using a combination of rig-pilot
signal and of a focused seismic signal for the source depth level 84 m, compared to (b) the result obtained using only the rig pilot
signal. This example shows also that the SWD seismic interferometry approach, i.e., data-based redatuming, can be a possible
effective approach when integrated with the use of rig pilot signals (Poletto et al., 2010). However the seismic focusing approach
may provide results that may depend on the choice of the signal event analyzed for focusing purposes, and requires some careful
evaluation.
Figure 13: Signals obtained at common-source depth 84 m. a) Result by mixed rig pilot and focusing signals and b) only rig-
pilot signal for correlation and deconvolution with geophone signals of the offset seismic line.
7. DISCUSSION AND PERSPECTIVES
From this preliminary test, different aspects and perspective emerge. These are:
The test allowed us to investigate the drill-bit SWD technology adapted for geothermal purposes together with DTH
water hammer drilling. The test was designed and planned as a quick preliminary test, thus performed with a limited
number of sensors and a portable acquisition system, and by in-field adaption of the communication protocols of the
SWD and DTH control units. This made it possible to only partially perform automated acquisition while drilling. This is
an important issue, especially during fast drilling conditions, typical of this type of drilling tool, to optimize the data
recording under suitable drilling windows without loss of recording time.
The physical dimensions of the test were limited to shallow drilling and short-offset ranges, of the order of 130 and 210
m, respectively. The limitation to these ranges makes more difficult to investigate the wavefields and their move out.
Under these conditions, in the proximity of the rig, drilling, signal and rig noise are superimposed.
At shallow drilling depths relative to geophone offset, the radiation conditions for compressional signals, as those
produced by the axial-percussive DTH fluid hammer source are not favorable. Based also on previous SWD experience,
the evaluation is that with deeper drilling the signal’s patterns are clearer and the drilling conditions more relevant for
demonstration of standard use of the method. An objective of future applications is to perform a deeper test using wider
receiver offsets.
Next technical steps and targets are to improve the integrated drilling-parameter control, by optimization of the automated
communication protocol, thus allowing fully-automated acquisition similar to that performed in the previous SWD
experience with conventional, full-size rotary-drilling systems.
As a general consideration, the results of this test at the GZB site have shown that the method provides rather high-quality
signals, usable with cross-correlation and deconvolution methods. The percussive nature of the pseudo-periodic source
adds frequency content that makes it possible to recover a wideband signal, for which focusing and interferometry
approaches are also considered to integrate the information obtained by rig reference pilot signals.
The quality of the pilot signal is important. A main target for future applications is to optimize the installation of pilot
sensors positioned onto the DTH drilling hammer rig, with the purpose to improve the recording of the pilot signal in the
drill string, and to minimize the disturbance from local-noise sources involved in the fluid hammer hydraulic driver
mechanism. This means and involves a dedicated integration of the SWD system with the DTH SWD technology.
(a) (b)
20 Offset (m) 210 20 Offset (m) 210
Tim
e (
s)
Tim
e (
s)
Wittig et al.
11
8. CONCLUSION
We show the results of a DTH fluid hammer drill-bit SWD survey performed with a hydraulic water hammer drilling system while
drilling a shallow well at GZB in Bochum. This highly efficient, rapid drilling system performs through intense downhole axial
vibration, which provides a suitable source for reverse VSP purposes. The test was performed by adapting the automated SWD
technology already used with conventional geothermal rotary drill systems. The results give significant indications about signal
quality, and show that seismic frequency content is relevant also at high frequency. Improvement of the method and technology
usable for fast geothermal drilling purposes, for investigation of structures to be drilled and around of the well in 2D and 3D
configurations, are envisaged. The analysis shows the presence of structural variations for the local geological conditions around
the well and ahead of the drill bit.
ACKNOWLEDGMENTS
Authors thank Fabio Meneghini for the preparation and management of the acquisition system in the field, and Massimo Lovo for
the technical assistance during acquisition and data analysis. Authors thank also Biancamaria Farina and Aronne Craglietto (OGS)
for the assistance in the preparation of synthetic signals and software assistance. We thank the RUB seismologists, in particular,
Marc Boxberg, and Kasper Fisher for their participating and sharing. At GZB, we especially thank Mandy Duda, Thomas
Andolfsson and Gregor Bussman for providing auxiliary data and helpful comments on geological model analysis; and, last but not
least, we do thank the complete GZB field staff and the drilling team for their excellent work and support and for being such good
hosts.
REFERENCES
Malin, P.: Combining seismic and electromagnetic observations in complex rock. Communication by Presentation at AGIS meeting
in Karlsruhe, Germany (2012).
Poletto, F.: Energy balance of a drill-bit seismic source. Part 1: Rotary energy and radiation properties. Geophysics 70, T13-T28
(2005a).
Poletto, F.: Energy balance of a drill-bit seismic source. Part 2: Drill-bit versus conventional seismic sources. Geophysics 70, T29-
T44 (2005b).
Poletto, F., and Bellezza, C.: Drill-bit displacement-source model: Source performance and drilling parameters. Geophysics 71,
F121 (2006).
Poletto, F., Corubolo, P., and Comelli, P.: Drill-bit seismic interferometry with and without pilot signals. Geophysical Prospecting
58, 257–265 (2010).
Poletto, F., Corubolo, P., Schleifer, A., Farina, B., Pollard, J. S., and Grozdanich, B.: Seismic while Drilling for Geophysical
Exploration in a Geothermal Well: Proceedings of the GRC Conference San Diego, CA, US (2011).
Poletto, F., and Miranda, F.: Seismic while drilling. Fundamentals of drill-bit seismic for exploration, Elsevier, Pergamon vol 35
(2004).
Poletto, F., Miranda, F., Corubolo, P., Schleifer, A., and Comelli, P.: Drill-bit seismic monitoring while drilling by downhole
wired-pipe. Geophysical Prospecting, in Press, doi: 10.1111/1365-2478.12135 (2014).
Rector III J. W., and Marion, B. P.: The use of drill-bit energy as a downhole seismic source. Geophysics 56, 628-634 (1991).
Vasconcelos, I., and Snieder, R.: Interferometry by Deconvolution: Part 2 – Theory for elastic waves and application to drill-bit
seismic imaging. Geophysics, 73, S129-141 (2008).
Vollmar, D., Wittig, V., and Bracke, R.: Geothermal Drilling Best Practices: The Geothermal translation of conventional drilling
recommendations - main potential challenges; IGA Academy report, international Finance Corporation IFC; Bochum,
Germany (2013).
Wapenaar K., Draganov, D., and Robertsson, J.: Seismic interferometry: History and present status. Society of Exploration
Geophysicists, Geophysics Reprint Series No. 26, ISBN 978-1-56080-150-4 (2008).
Wittig, V., and Bracke, R.: DTH Fluid Hammer drilling developments and latest R&D activities at GZB in Bochum; International
Geothermal conference “GeoTherm” in Offenburg, Germany (3-2012).
Wittig, V., et al.: Hydraulic DTH Fluid / Mud Hammers with Recirculation capabilities to improve ROP and Hole Cleaning for
deep, hard rock Geothermal Drilling; WGC 2015 abstract #21053, In Press (2015).