Embed Size (px)
Citation preview
Biogeosciences, 15, 669–691, 2018https://doi.org/10.5194/bg-15-669-2018© Author(s) 2018. This work is distributed underthe Creative Commons Attribution 3.0 License.
Hydro-ecological controls on dissolved carbon dynamics ingroundwater and export to streams in a temperate pine forestLoris Deirmendjian1, Denis Loustau2, Laurent Augusto2, Sébastien Lafont2, Christophe Chipeaux2,Dominique Poirier1, and Gwenaël Abril1,3,a
1Laboratoire Environnements et Paléoenvironnements Océaniques et Continentaux (EPOC), CNRS, Université de Bordeaux,Allée Geoffroy Saint-Hilaire, 33615 Pessac CEDEX, France2INRA, UMR 1391 Interactions Sol-Plante-Atmosphère (ISPA), 33140 Villenave-d’Ornon, France3Departamento de Geoquímica, Universidade Federal Fluminense, Outeiro São João Batista s/n, 24020015, Niterói, RJ, Brazilaalso at: Laboratoire d’Océanographie et du Climat, Expérimentations et Approches Numériques (LOCEAN),Centre IRD France-Nord, 32, Avenue Henri Varagnat, 93143 Bondy, France
Correspondence: Loris Deirmendjian ([email protected])
Received: 14 March 2017 – Discussion started: 12 April 2017Revised: 10 December 2017 – Accepted: 28 December 2017 – Published: 1 February 2018
Abstract. We studied the export of dissolved inorganiccarbon (DIC) and dissolved organic carbon (DOC) fromforested shallow groundwater to first-order streams, basedon groundwater and surface water sampling and hydrologicaldata. The selected watershed was particularly convenient forsuch study, with a very low slope, with pine forest growingon sandy permeable podzol and with hydrology occurring ex-clusively through drainage of shallow groundwater (no sur-face runoff). A forest plot was instrumented for continuouseddy covariance measurements of precipitation, evapotran-spiration, and net ecosystem exchanges of sensible and latentheat fluxes as well as CO2 fluxes. Shallow groundwater wassampled with three piezometers located in different plots, andsurface waters were sampled in six first-order streams; riverdischarge and drainage were modeled based on four gaug-ing stations. On a monthly basis and on the plot scale, wefound a good consistency between precipitation on the onehand and the sum of evapotranspiration, shallow groundwa-ter storage and drainage on the other hand. DOC and DICstocks in groundwater and exports to first-order streams var-ied drastically during the hydrological cycle, in relation withwater table depth and amplitude. In the groundwater, DOCconcentrations were maximal in winter when the water tablereached the superficial organic-rich layer of the soil. In con-trast, DIC (in majority excess CO2) in groundwater showedmaximum concentrations at low water table during late sum-mer, concomitant with heterotrophic conditions of the forest
plot. Our data also suggest that a large part of the DOC mo-bilized at high water table was mineralized to DIC duringthe following months within the groundwater itself. In first-order streams, DOC and DIC followed an opposed seasonaltrend similar to groundwater but with lower concentrations.On an annual basis, leaching of carbon to streams occurredas DIC and DOC in similar proportion, but DOC export oc-curred in majority during short periods of the highest watertable, whereas DIC export was more constant throughout theyear. Leaching of forest carbon to first-order streams repre-sented a small portion (approximately 2 %) of the net landCO2 sink at the plot. In addition, approximately 75 % of theDIC exported from groundwater was not found in streams,as it returned very fast to the atmosphere through CO2 de-gassing.
1 Introduction
Since the beginning of the industrial era, human activitieshave greatly modified the fluxes of carbon between the at-mosphere and the continents, as well as those occurringalong the aquatic continuum that connect land and the coastalocean (Ciais et al., 2013; Cole et al., 2007; Regnier et al.,2013). Globally, land (vegetation and soil) is a major reser-voir of carbon that acts as a net annual sink of atmosphericCO2, therefore modulating the climate system (Ciais et al.,
Published by Copernicus Publications on behalf of the European Geosciences Union.
670 L. Deirmendjian et al.: Hydro-ecological controls on dissolved carbon dynamics in groundwater
2013; Heimann and Reichstein, 2008), and is thought to offera mitigation strategy to reduce global warming (Schimel etal., 2001). In European forests, 70 % of the net land sink is se-questered in plants as woody biomass increments and 30 % issequestered in soils (Luyssaert et al., 2010). However, largeuncertainty concerning the drivers and future of the soil or-ganic carbon remains (Luyssaert et al., 2010). Therefore, in-vestigating the mechanisms that impact storage and export ofsoil carbon from forest ecosystems is of first interest in bothecosystem and climate research.
Streams and small rivers are important links between ter-restrial and aquatic ecosystems because they receive inputsof carbon from land and then transform these materials atthe land–stream interface and in stream channels as waterflows to larger rivers (McClain et al., 2003; Raymond et al.,2013). The carbon dynamics in forest stream ecosystems re-sults from the interaction among biological activity, weath-ering, water infiltration, drainage and retention–mobilizationmechanisms in soils (Jones and Mulholland, 1998; Kawasakiet al., 2005; Shibata et al., 2001). Indeed, biogeochemical cy-cling within and across the terrestrial–aquatic interface is dy-namically linked to the water cycle (Battin et al., 2009; John-son et al., 2006) because dissolved carbon is primarily mobi-lized and transported by the movement of water (Hagerdon etal., 2000; Hope et al., 1994; Kawasaki et al., 2005). Further-more, numerous works in different environments came to thesame conclusion that streams and small rivers are hotspots ofCO2 degassing (Butman and Raymond, 2011; Johnson et al.,2008; Kokic et al., 2015; Polsenaere and Abril, 2012; Wallinet al., 2013). In small streams, the CO2 degassing flux pri-mary results from inputs of groundwater enriched in CO2(Hotchkiss et al., 2015), which comes from plant root res-piration and from microbial respiration in soils and ground-water.
The quantification of dissolved carbon fluxes transportedby water from terrestrial to aquatic environments is funda-mental to resolving the carbon balance on the catchmentscale (Billett et al., 2004; Jonsson et al., 2007; Kindler et al.,2011; Magin et al., 2017; Shibata et al., 2005). Leaching ofcarbon from terrestrial ecosystems to streams could poten-tially represent up to 160 % of the net ecosystem exchange(NEE) in a Scotland peat catchment (Billett et al., 2004), 6 %in a Sweden boreal catchment dominated by coniferous for-est (Jonsson et al., 2007), on average 6 % in five forest plotsacross Europe (Kindler et al., 2011), 2 % in a Japanese tem-perate catchment dominated by deciduous forest (Shibata etal., 2005) or 2.7 % of the net primary production in differentwoody and tilled subcatchments across southwestern Ger-many (Magin et al., 2017). Such large variations in carbonexport rates are not well understood and it is therefore im-portant to extend this investigation to other landscapes andclimatic zones. More studies focused on the processes thatgovern the mobilization of soil carbon to surface waters arenecessary to improve and predict carbon budgets in terrestrialecosystems.
Some authors reported high concentrations of dis-solved inorganic carbon (DIC) (Kawasaki et al., 2005;Venkiteswaran et al., 2014) and dissolved organic carbon(DOC) (Artinger et al., 2000; Baker et al., 2000) in forest-dominated groundwater (i.e., in the saturated zone of thesoil). However, estimations of terrestrial carbon leachingfrom direct simultaneous measurements in groundwater andstreams are scarce. These studies are generally restricted tosubmarine and coastal environments (Atkins et al., 2013;Sadat-Noori et al., 2016; Santos et al., 2012) and boreal lakes(Einarsdottir et al., 2017), but rarely streams. The few stud-ies that estimate exports of carbon from forested landscapesto streams are generally (i) based on carbon observations insoil water (i.e., in the unsaturated zone of the soil) com-bined with a soil water model that simulates the volume ofsoil water leached to streams (Öquist et al., 2009; Kindleret al., 2011; Leith et al., 2015), (ii) based on carbon obser-vations in stream combined with stream discharge (Billett etal., 2004; Dawson et al., 2002; Olefeldt et al., 2013; Shibataet al., 2001, 2005), or (iii) as described by the active pipeconcept (Cole et al., 2007), as the sum of the three majorriverine carbon fluxes: CO2 degassing, organic carbon burialin sediments and carbon export downstream (Jonsson et al.,2007). These studies do not provide a complete understand-ing of the link between carbon hydrological export and thephysicochemical and biological processes occurring in soilsand groundwater. In addition, the approaches based on onlystream sampling may miss part of the DIC export flux as ex-cess CO2 that might rapidly degas upstream of the samplingpoints (Venkiteswaran et al., 2014).
In this study, we instrumented a temperate watershed thatoffers the convenience of a homogeneous lithology (perme-able sandy soil), vegetation (pine forest), topography (veryflat coastal plain), and a simple hydrology functioning ex-clusively as shallow groundwater drainage. This simple con-figuration with no surface runoff allows us to identify whatare the main factors that control the DIC–DOC leaching tostreams, the DIC : DOC ratio in groundwater and streams,and their variation in space and over time. On the plot scale,we relate DIC and DOC temporal dynamics in groundwaterwith hydrology and metabolic activity of the forest ecosys-tem. On the watershed scale, we quantify DIC and DOCtransfers through the groundwater–stream interface, and wedescribe the fate of this carbon in first-order streams.
2 Materials and methods
2.1 Study site
The Leyre watershed (2100 km2) is located in the southwestof France, in the “Landes de Gascogne” area (Fig. 1). Thelandscape is a very flat coastal plain with a mean slope lowerthan 0.125 % (generally NW–SE) (Jolivet et al., 2007), butwith local gentle slopes (notably near some streams). The
Biogeosciences, 15, 669–691, 2018 www.biogeosciences.net/15/669/2018/
L. Deirmendjian et al.: Hydro-ecological controls on dissolved carbon dynamics in groundwater 671
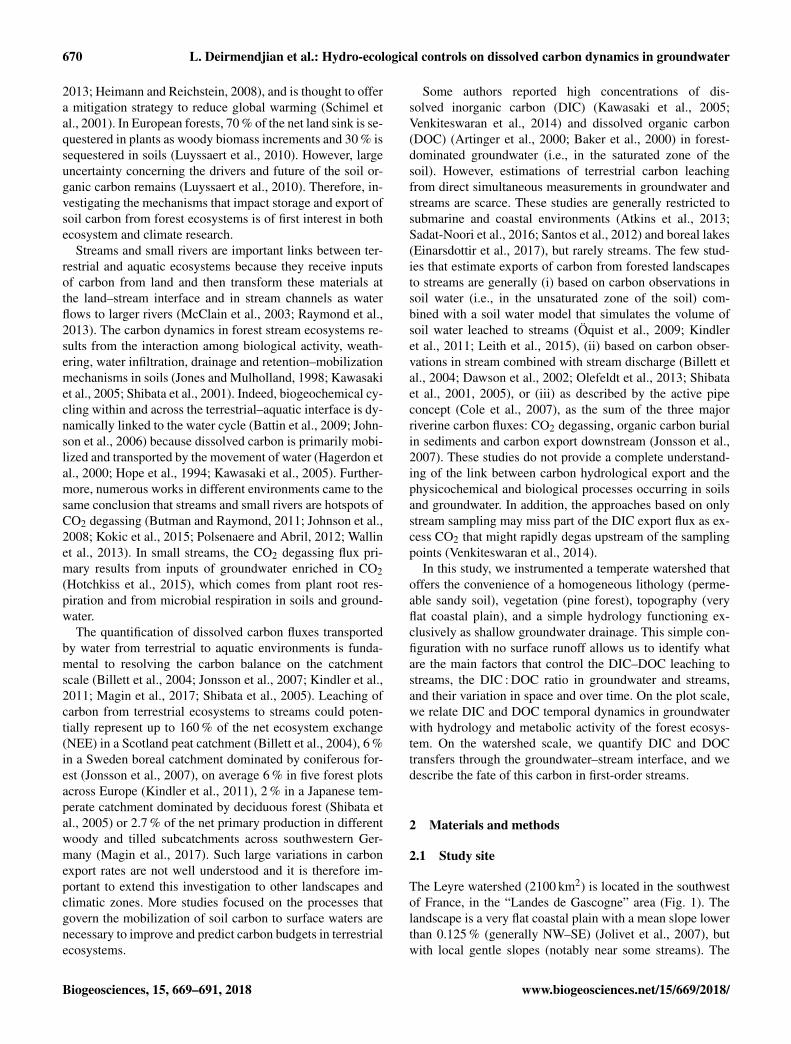
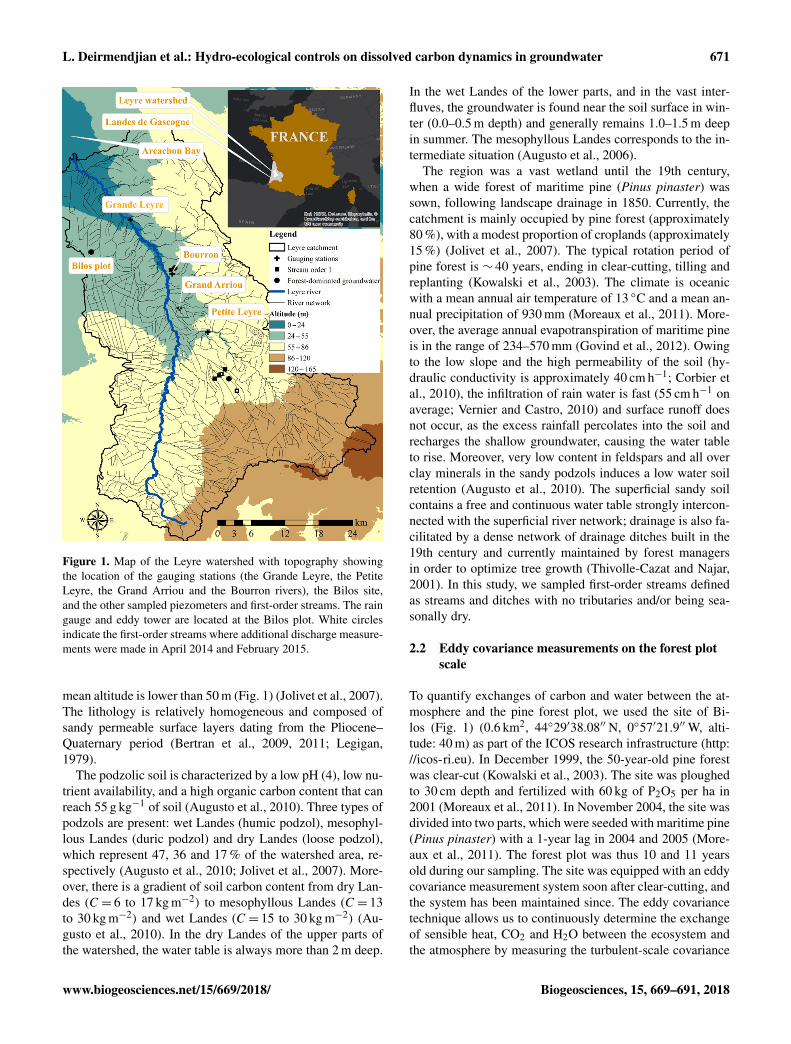
Figure 1. Map of the Leyre watershed with topography showingthe location of the gauging stations (the Grande Leyre, the PetiteLeyre, the Grand Arriou and the Bourron rivers), the Bilos site,and the other sampled piezometers and first-order streams. The raingauge and eddy tower are located at the Bilos plot. White circlesindicate the first-order streams where additional discharge measure-ments were made in April 2014 and February 2015.
mean altitude is lower than 50 m (Fig. 1) (Jolivet et al., 2007).The lithology is relatively homogeneous and composed ofsandy permeable surface layers dating from the Pliocene–Quaternary period (Bertran et al., 2009, 2011; Legigan,1979).
The podzolic soil is characterized by a low pH (4), low nu-trient availability, and a high organic carbon content that canreach 55 g kg−1 of soil (Augusto et al., 2010). Three types ofpodzols are present: wet Landes (humic podzol), mesophyl-lous Landes (duric podzol) and dry Landes (loose podzol),which represent 47, 36 and 17 % of the watershed area, re-spectively (Augusto et al., 2010; Jolivet et al., 2007). More-over, there is a gradient of soil carbon content from dry Lan-des (C= 6 to 17 kg m−2) to mesophyllous Landes (C= 13to 30 kg m−2) and wet Landes (C= 15 to 30 kg m−2) (Au-gusto et al., 2010). In the dry Landes of the upper parts ofthe watershed, the water table is always more than 2 m deep.
In the wet Landes of the lower parts, and in the vast inter-fluves, the groundwater is found near the soil surface in win-ter (0.0–0.5 m depth) and generally remains 1.0–1.5 m deepin summer. The mesophyllous Landes corresponds to the in-termediate situation (Augusto et al., 2006).
The region was a vast wetland until the 19th century,when a wide forest of maritime pine (Pinus pinaster) wassown, following landscape drainage in 1850. Currently, thecatchment is mainly occupied by pine forest (approximately80 %), with a modest proportion of croplands (approximately15 %) (Jolivet et al., 2007). The typical rotation period ofpine forest is ∼ 40 years, ending in clear-cutting, tilling andreplanting (Kowalski et al., 2003). The climate is oceanicwith a mean annual air temperature of 13 ◦C and a mean an-nual precipitation of 930 mm (Moreaux et al., 2011). More-over, the average annual evapotranspiration of maritime pineis in the range of 234–570 mm (Govind et al., 2012). Owingto the low slope and the high permeability of the soil (hy-draulic conductivity is approximately 40 cm h−1; Corbier etal., 2010), the infiltration of rain water is fast (55 cm h−1 onaverage; Vernier and Castro, 2010) and surface runoff doesnot occur, as the excess rainfall percolates into the soil andrecharges the shallow groundwater, causing the water tableto rise. Moreover, very low content in feldspars and all overclay minerals in the sandy podzols induces a low water soilretention (Augusto et al., 2010). The superficial sandy soilcontains a free and continuous water table strongly intercon-nected with the superficial river network; drainage is also fa-cilitated by a dense network of drainage ditches built in the19th century and currently maintained by forest managersin order to optimize tree growth (Thivolle-Cazat and Najar,2001). In this study, we sampled first-order streams definedas streams and ditches with no tributaries and/or being sea-sonally dry.
2.2 Eddy covariance measurements on the forest plotscale
To quantify exchanges of carbon and water between the at-mosphere and the pine forest plot, we used the site of Bi-los (Fig. 1) (0.6 km2, 44◦29′38.08′′ N, 0◦57′21.9′′W, alti-tude: 40 m) as part of the ICOS research infrastructure (http://icos-ri.eu). In December 1999, the 50-year-old pine forestwas clear-cut (Kowalski et al., 2003). The site was ploughedto 30 cm depth and fertilized with 60 kg of P2O5 per ha in2001 (Moreaux et al., 2011). In November 2004, the site wasdivided into two parts, which were seeded with maritime pine(Pinus pinaster) with a 1-year lag in 2004 and 2005 (More-aux et al., 2011). The forest plot was thus 10 and 11 yearsold during our sampling. The site was equipped with an eddycovariance measurement system soon after clear-cutting, andthe system has been maintained since. The eddy covariancetechnique allows us to continuously determine the exchangeof sensible heat, CO2 and H2O between the ecosystem andthe atmosphere by measuring the turbulent-scale covariance
www.biogeosciences.net/15/669/2018/ Biogeosciences, 15, 669–691, 2018
672 L. Deirmendjian et al.: Hydro-ecological controls on dissolved carbon dynamics in groundwater
between vertical wind velocity and the scalar concentrationof sensible heat, CO2 and H2O.
Wind velocity, temperature and CO2–water vapor fluctua-tions were measured with a sonic anemometer (model R3,Gill instruments Lymington, UK) and an open-path dualCO2–H2O infrared gas analyzer (model Li7500, LI-COR,Lincoln, USA) at the top of a 9.6 m tower (1 Januaryto 10 May 2014) and with another sonic anemometer(model HS50, Gill instruments) and an enclosed dual CO2–H2O infrared gas analyzer (model Li7200, LI-COR©) at thetop of a 15 m tower (9 July 2014 to 31 December 2015).Consequently, there were no eddy covariance measurementsavailable between 11 May and 8 July 2014 and thus betweenthese two dates the latent heat fluxes were determined fol-lowing the procedure of Thornthwaite (1948).
Raw data were processed following a standard method-ology (Aubinet et al., 1999). The post-processing softwareEddyPro v6.0 (http://www.licor.com) was used to treat rawdata and compute average fluxes (30 min period) by apply-ing the following steps: (1) spike removal in anemometeror gas analyzer data using statistical analysis; (2) coordinat-ing rotation to align the coordinate system with the streamlines of the 30 min averages; (3) blocking average detrend-ing of sonic temperature, H2O and CO2 channels; (4) de-termining time lag values for H2O and CO2 channels usinga cross-correlation procedure; (5) computing mean values,turbulent fluxes and characteristic parameters; and (6) mak-ing spectral corrections (Ibrom et al., 2007). Thereafter, CO2and H2O fluxes were filtered in order to remove points cor-responding to technical problems, meteorological conditionsnot satisfying eddy correlation theory or data out of realisticbounds. Different statistical tests were applied for this filter-ing: stationarity and turbulent conditions were tested with thesteady-state test and the turbulence characteristic test recom-mended by Foken and Wichura (1996) and Kaimal and Finni-gan (1994). Only values of CO2 and H2O fluxes that pass allthe filters were retained. Then, missing values of CO2 andH2O fluxes were gap-filled. The NEE of CO2 was partitionedinto two components, gross primary production (GPP) andecosystem respiration (Reco), with the R package REddyProc(version 0.8-2) by applying the following steps (Reichstein etal., 2005).
(i) During nighttime GPP= 0 so NEE=Reco. (ii) Statis-tical regression between Reco and nighttime air temperatureand meteorological conditions is adjusted with a Arrhenius-type equation (Lloyd and Taylor, 1994). (iii) Daytime Recois obtained by extrapolating nighttime fluxes using the tem-perature response. (iv) GPP is calculated as the differencebetween daytime NEE and Reco; additional checks are per-formed to avoid unrealistic values of GPP. Finally, a positiveNEE indicates an upward flux whereas a negative NEE indi-cates a downward flux; GPP is positive or zero and Reco ispositive. NEE=Reco−GPP.
2.3 Groundwater and surface water monitoring
To compare groundwater carbon dynamics on both the plotand the watershed scales, we selected three piezometers indifferent forest types (Fig. 1). According to the depth andamplitude of the water table, the three piezometers were rep-resentative of dry Landes (piezometer 2), mesophyllous Lan-des (piezometer 3) and a situation between mesophyllousand wet Landes (piezometer Bilos). Moreover, the piezome-ter 2 is located in a riparian mixed pine and oak forest near afirst-order stream whereas piezometer 3 is located in anotherpine forest (approximately the same age as the Bilos pineforest). We also selected six first-order streams whose water-sheds were dominated largely by pine forest (∼ 90 %), whichlimits biogeochemical signal from crops. Shallow groundwa-ter and stream waters were sampled for partial pressure ofCO2 (pCO2), total alkalinity and DOC with approximatelymonthly time intervals (Table S1 in the Supplement).
2.4 Chemical analysis
We measured the pCO2 directly in the field and total alka-linity and DOC back in the laboratory. The pCO2 in thegroundwater and streams was measured directly using anequilibrator (Frankignoulle and Borges, 2001; Polsenaere etal., 2013). This equilibrator was connected to an infraredgas analyzer (LI-COR®, LI-820), which was calibrated oneday before sampling, on two linear segments because of itsnonlinear response in the range of observed pCO2 values(0–90 000 ppmv). This nonlinearity was due to saturationof the infrared cell at pCO2 values above 20 000 ppmv. Weused certified standards (Air Liquide™ France) of 2079± 42;19 500± 390 and 90 200± 1800 ppmv, as well as nitrogenflowing through soda lime for zero. For the first linear seg-ment (0–20 000 ppmv), which corresponded to the river wa-ters, we set the LI-COR (LI-820) to zero and spanned theLI-COR (LI-820) at 19 500 ppmv, and then we checked forlinearity at 2042 ppmv. For the second segment (20 000–90 000 ppmv), which corresponded to the sampled ground-water, we measured the response of the LI-COR (LI-820)with the standard at 90 000 ppmv and used this measuredvalue to make a post correction of the measured value in thefield. Before sampling, the groundwater was pumped fromthe piezometer during the time necessary to obtain stablereadings with portable probes of electrical conductivity, tem-perature, pH and dissolved oxygen concentration.
Total alkalinity was analyzed using automated electro-titration on 50 mL filtered samples with 0.1N HCl as thetitrant. The equivalence point was determined to be from apH between 4 and 3 with the Gran method (Gran, 1952).The precision based on replicate analyses was better than±5 µM. For samples with a very low pH (< 4.5), we bub-bled the water with atmospheric air in order to degas theCO2. Consequently, the initial pH increased above the valueof 5, and total alkalinity titration could be performed (Abril
Biogeosciences, 15, 669–691, 2018 www.biogeosciences.net/15/669/2018/
L. Deirmendjian et al.: Hydro-ecological controls on dissolved carbon dynamics in groundwater 673
et al., 2015). We calculated DIC from pCO2, total alkalin-ity and temperature measurements using carbonic acid dis-sociation constants of Millero (1979) and the CO2 solubil-ity from Weiss (1974) as implemented in the CO2SYS pro-gram (Lewis et al., 1998). Contrary to the pCO2 calcula-tion from pH and total alkalinity (Abril et al., 2015), theDIC calculation from measured pCO2 and total alkalinitywas weakly affected by the presence of organic alkalinity be-cause 80± 20 % of DIC in our samples was dissolved CO2.The DOC samples were obtained in the field through pre-combusted GF/F filters after filtration (porosity of 0.7 µm).The samples were acidified with 50 µL of HCl 37 % to reacha pH of 2 and stored in pre-combusted Pyrex 25 mL vialsat 4 ◦C in the dark before analysis. The DOC concentrationswere measured with a Shimadzu TOC 500 analyzer with re-peatability better than 0.1 mg L−1.
2.5 Hydrological monitoring
The precipitation was measured continuously at the Bilosplot using automatic rain gauges with a 30 min integration:one tipping bucket rain gauge SBS500 (Campbell Scientific,Logan, USA) was located in a small clear-cut area at 3 mabove ground from 1 January to 10 May 2014 and one totalrain weighing sensor, TRwS 405 (MPS system, Bratislava,Slovakia) was located at the top of the canopy on a 6 m towerfrom 1 July 2014 to 31 December 2015. Hence, between11 May and 31 June 2014, no precipitation measurementswere available at the Bilos site. Thus, during this period,we used data from Météo France© at Belin-Béliet (approx-imately 30 km from the Bilos site). The precipitation mea-surements were also checked weekly in the field with manualreports.
The groundwater table depth was measured continuouslyat the Bilos plot using high-performance level pressure sen-sors (PDCR/PTX 1830, Druck and CS451451, CampbellScientific) in one piezometer located at the Bilos site. Tem-perature and air pressure fluctuations were fully compen-sated for in the pressure measurements. The measurementswere obtained at 60 s intervals and integrated in a 30 min pe-riod. They were checked weekly with a manual probe. Thegroundwater table depth was also measured punctually witha manual piezometric probe in piezometers 2 and 3 beforeeach groundwater sampling.
Our study benefited from four calibrated gauging stationsof DIREN (French water survey agency), with a daily tem-poral resolution, located at two second-order streams (Bour-ron and Grand Arriou rivers), one third-order stream (Pe-tite Leyre river) and one fourth-order stream (Grande Leyreriver) (Fig. 1). We also performed additional discharge mea-surements in first-order streams (Fig. 1). For each streamorder, we calculated the drainage with a daily temporalresolution for a 2-year period (i.e., discharge divided bythe corresponding catchment area, in m3 km−2 day−1 or inmm day−1) (Deirmendjian and Abril, 2018). We then de-
termined the increase in drainage between two streams ofsuccessive orders. Because of the specific characteristics ofthe Leyre watershed with no surface runoff, we observed aregular increase in drainage values between two streams ofsuccessive orders. In addition, the proportion of additionaldrainage occurring in each stream order was relatively con-stant temporally. Our analysis based on daily discharge mon-itoring in second-, third-, and fourth-order streams and sea-sonal gauging of first-order streams revealed that monthlydrainage values in first-order streams were on average 2.3times lower than those measured in fourth-order streams andallowed us to reconstruct robust monthly drainage valuesin first-order streams (Deirmendjian and Abril, 2018). Wewrote the water mass balance equation at the Bilos forest plotas follows:
P =D+ETR+GWS+1S, (1)
where P , D, ETR, GWS and 1S were, respectively, pre-cipitation, drainage, evapotranspiration, groundwater storageand change of soil water content in the unsaturated zone, allexpressed in millimeters per day. P was the cumulative pre-cipitation measured over a given period t at the Bilos site. Dwas the drainage at the Bilos site deduced from daily obser-vation at four gauging stations and the hydrological model(Deirmendjian and Abril, 2018). ETR was the cumulativeevapotranspiration obtained from eddy covariance measure-ments of latent heat fluxes over a period t at the Bilos site.GWS was calculated as the net change in water table depthover the period t times the soil effective porosity at the Bi-los site of 0.2 (Augusto et al., 2010; Moreaux et al., 2011).Finally, no reliable measurements of soil water content wereavailable, and with the 1S term likely being small, the vari-ation in soil water content in the unsaturated zone was ne-glected in the water mass balance.
2.6 Carbon stocks in groundwater, exports to streamsand degassing to the atmosphere
We calculated four different terms that describe the dynam-ics of carbon at the Bilos plot: the stocks of DIC (DICstock)
and DOC (DOCstock) in groundwater and the exports of DIC(DICexport) and DOC (DOCexport) from groundwater to first-order streams, all integrated between two sampling dates (Ta-ble S2). Because we do not know the total height of the per-meable surface soil layer in piezometers 2 and 3, we cal-culated the stocks of carbon in the groundwater only at theBilos site. However, in order to account for spatial differ-ences among the dry, mesophyllous and wet Landes, specificDIC and DOC exports were calculated for the three study sitepiezometers. We wrote
DICstock = (Si+ Sf) /2= (DICi×Vi+DICf×Vf) /2, (2)
where DICstock was the mean stock of DIC in groundwaterbetween two sampling dates in millimoles per square me-ter. Sf and Si were the final and the initial stocks of DIC in
www.biogeosciences.net/15/669/2018/ Biogeosciences, 15, 669–691, 2018
674 L. Deirmendjian et al.: Hydro-ecological controls on dissolved carbon dynamics in groundwater
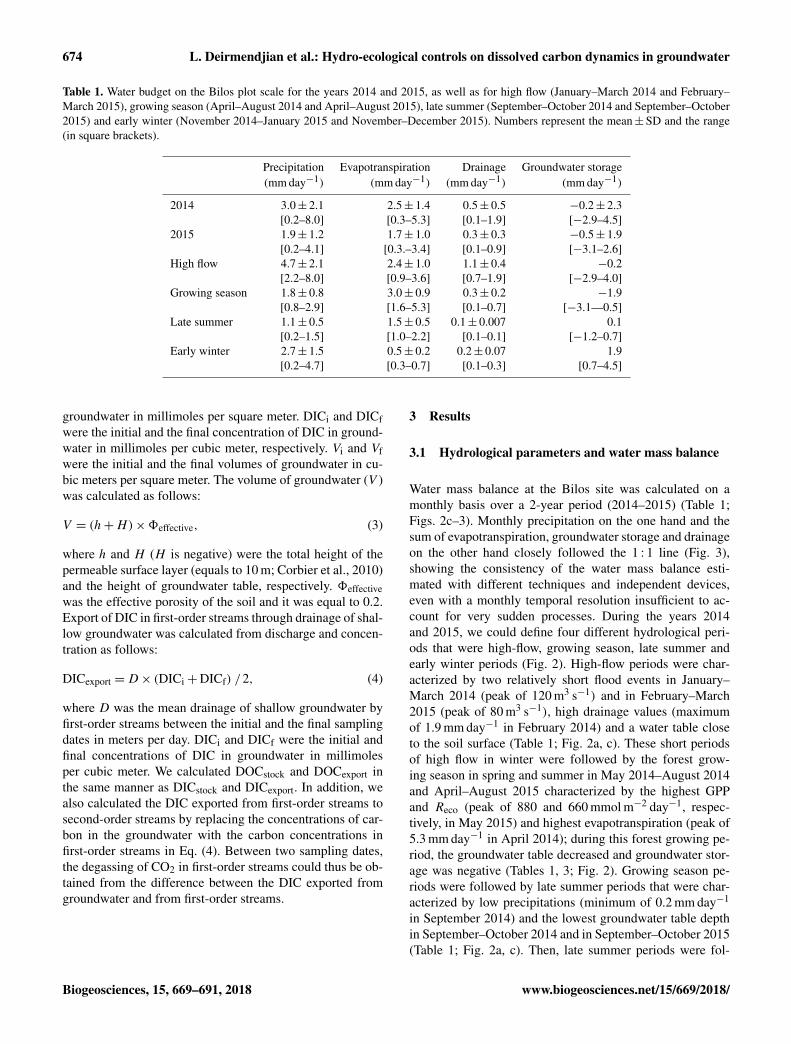
Table 1. Water budget on the Bilos plot scale for the years 2014 and 2015, as well as for high flow (January–March 2014 and February–March 2015), growing season (April–August 2014 and April–August 2015), late summer (September–October 2014 and September–October2015) and early winter (November 2014–January 2015 and November–December 2015). Numbers represent the mean±SD and the range(in square brackets).
Precipitation Evapotranspiration Drainage Groundwater storage(mm day−1) (mm day−1) (mm day−1) (mm day−1)
2014 3.0± 2.1 2.5± 1.4 0.5± 0.5 −0.2± 2.3[0.2–8.0] [0.3–5.3] [0.1–1.9] [−2.9–4.5]
2015 1.9± 1.2 1.7± 1.0 0.3± 0.3 −0.5± 1.9[0.2–4.1] [0.3.–3.4] [0.1–0.9] [−3.1–2.6]
High flow 4.7± 2.1 2.4± 1.0 1.1± 0.4 −0.2[2.2–8.0] [0.9–3.6] [0.7–1.9] [−2.9–4.0]
Growing season 1.8± 0.8 3.0± 0.9 0.3± 0.2 −1.9[0.8–2.9] [1.6–5.3] [0.1–0.7] [−3.1—0.5]
Late summer 1.1± 0.5 1.5± 0.5 0.1± 0.007 0.1[0.2–1.5] [1.0–2.2] [0.1–0.1] [−1.2–0.7]
Early winter 2.7± 1.5 0.5± 0.2 0.2± 0.07 1.9[0.2–4.7] [0.3–0.7] [0.1–0.3] [0.7–4.5]
groundwater in millimoles per square meter. DICi and DICfwere the initial and the final concentration of DIC in ground-water in millimoles per cubic meter, respectively. Vi and Vfwere the initial and the final volumes of groundwater in cu-bic meters per square meter. The volume of groundwater (V )was calculated as follows:
V = (h+H)×8effective, (3)
where h and H (H is negative) were the total height of thepermeable surface layer (equals to 10 m; Corbier et al., 2010)and the height of groundwater table, respectively. 8effectivewas the effective porosity of the soil and it was equal to 0.2.Export of DIC in first-order streams through drainage of shal-low groundwater was calculated from discharge and concen-tration as follows:
DICexport =D× (DICi+DICf) /2, (4)
where D was the mean drainage of shallow groundwater byfirst-order streams between the initial and the final samplingdates in meters per day. DICi and DICf were the initial andfinal concentrations of DIC in groundwater in millimolesper cubic meter. We calculated DOCstock and DOCexport inthe same manner as DICstock and DICexport. In addition, wealso calculated the DIC exported from first-order streams tosecond-order streams by replacing the concentrations of car-bon in the groundwater with the carbon concentrations infirst-order streams in Eq. (4). Between two sampling dates,the degassing of CO2 in first-order streams could thus be ob-tained from the difference between the DIC exported fromgroundwater and from first-order streams.
3 Results
3.1 Hydrological parameters and water mass balance
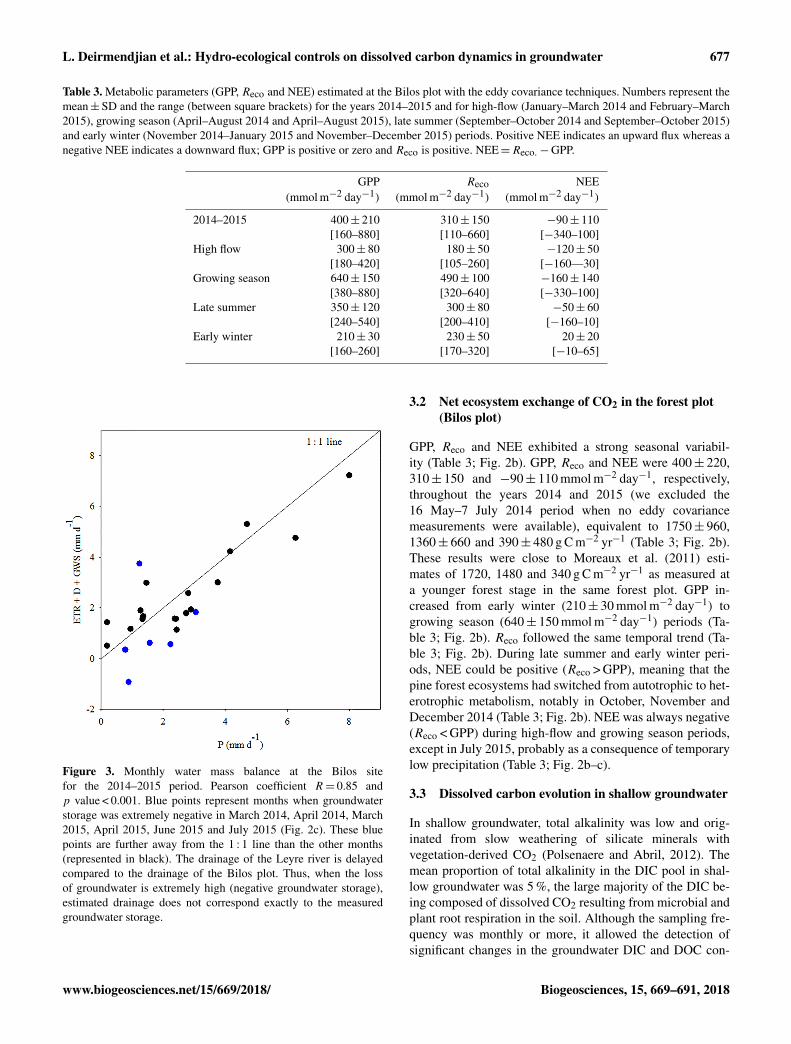
Water mass balance at the Bilos site was calculated on amonthly basis over a 2-year period (2014–2015) (Table 1;Figs. 2c–3). Monthly precipitation on the one hand and thesum of evapotranspiration, groundwater storage and drainageon the other hand closely followed the 1 : 1 line (Fig. 3),showing the consistency of the water mass balance esti-mated with different techniques and independent devices,even with a monthly temporal resolution insufficient to ac-count for very sudden processes. During the years 2014and 2015, we could define four different hydrological peri-ods that were high-flow, growing season, late summer andearly winter periods (Fig. 2). High-flow periods were char-acterized by two relatively short flood events in January–March 2014 (peak of 120 m3 s−1) and in February–March2015 (peak of 80 m3 s−1), high drainage values (maximumof 1.9 mm day−1 in February 2014) and a water table closeto the soil surface (Table 1; Fig. 2a, c). These short periodsof high flow in winter were followed by the forest grow-ing season in spring and summer in May 2014–August 2014and April–August 2015 characterized by the highest GPPand Reco (peak of 880 and 660 mmol m−2 day−1, respec-tively, in May 2015) and highest evapotranspiration (peak of5.3 mm day−1 in April 2014); during this forest growing pe-riod, the groundwater table decreased and groundwater stor-age was negative (Tables 1, 3; Fig. 2). Growing season pe-riods were followed by late summer periods that were char-acterized by low precipitations (minimum of 0.2 mm day−1
in September 2014) and the lowest groundwater table depthin September–October 2014 and in September–October 2015(Table 1; Fig. 2a, c). Then, late summer periods were fol-
Biogeosciences, 15, 669–691, 2018 www.biogeosciences.net/15/669/2018/
L. Deirmendjian et al.: Hydro-ecological controls on dissolved carbon dynamics in groundwater 675
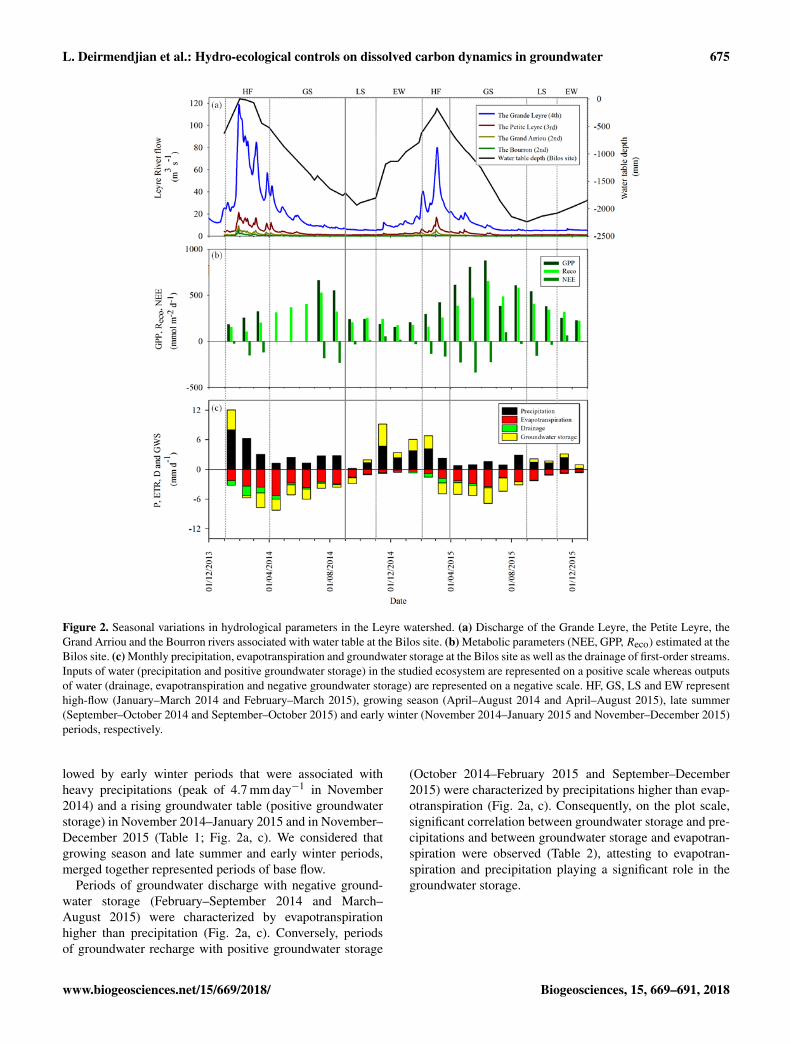
Figure 2. Seasonal variations in hydrological parameters in the Leyre watershed. (a) Discharge of the Grande Leyre, the Petite Leyre, theGrand Arriou and the Bourron rivers associated with water table at the Bilos site. (b) Metabolic parameters (NEE, GPP,Reco) estimated at theBilos site. (c) Monthly precipitation, evapotranspiration and groundwater storage at the Bilos site as well as the drainage of first-order streams.Inputs of water (precipitation and positive groundwater storage) in the studied ecosystem are represented on a positive scale whereas outputsof water (drainage, evapotranspiration and negative groundwater storage) are represented on a negative scale. HF, GS, LS and EW representhigh-flow (January–March 2014 and February–March 2015), growing season (April–August 2014 and April–August 2015), late summer(September–October 2014 and September–October 2015) and early winter (November 2014–January 2015 and November–December 2015)periods, respectively.
lowed by early winter periods that were associated withheavy precipitations (peak of 4.7 mm day−1 in November2014) and a rising groundwater table (positive groundwaterstorage) in November 2014–January 2015 and in November–December 2015 (Table 1; Fig. 2a, c). We considered thatgrowing season and late summer and early winter periods,merged together represented periods of base flow.
Periods of groundwater discharge with negative ground-water storage (February–September 2014 and March–August 2015) were characterized by evapotranspirationhigher than precipitation (Fig. 2a, c). Conversely, periodsof groundwater recharge with positive groundwater storage
(October 2014–February 2015 and September–December2015) were characterized by precipitations higher than evap-otranspiration (Fig. 2a, c). Consequently, on the plot scale,significant correlation between groundwater storage and pre-cipitations and between groundwater storage and evapotran-spiration were observed (Table 2), attesting to evapotran-spiration and precipitation playing a significant role in thegroundwater storage.
www.biogeosciences.net/15/669/2018/ Biogeosciences, 15, 669–691, 2018
676 L. Deirmendjian et al.: Hydro-ecological controls on dissolved carbon dynamics in groundwater
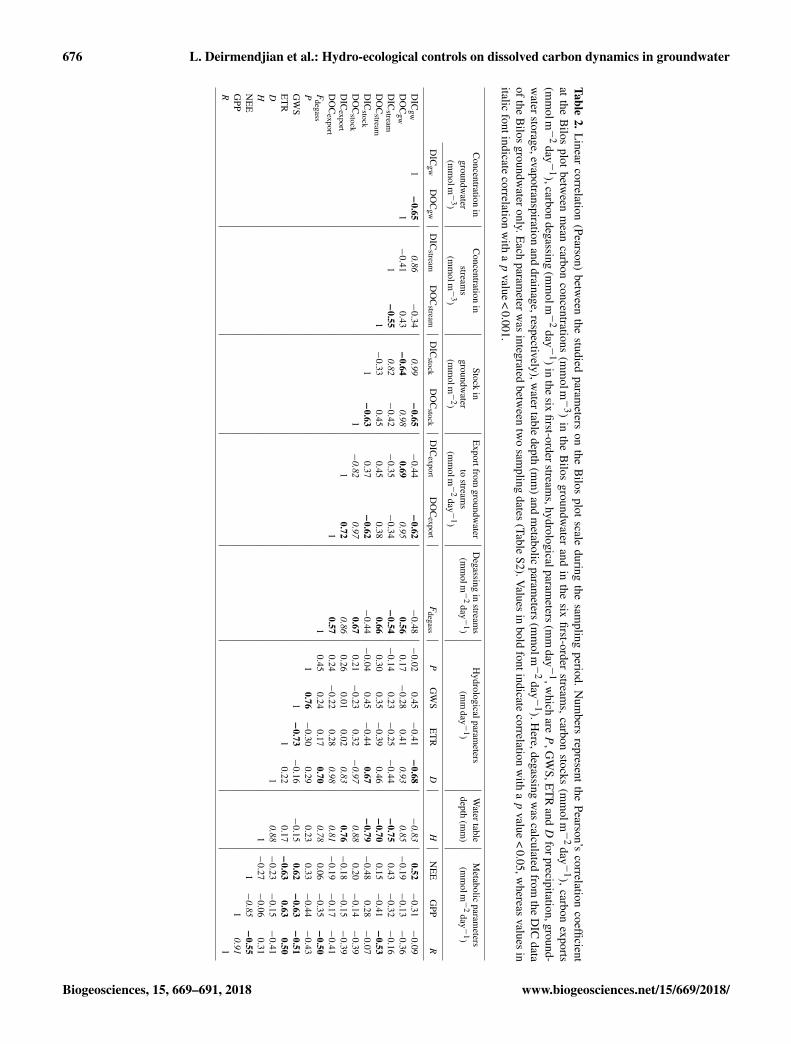
Table2.
Linear
correlation(Pearson)
between
thestudied
parameters
onthe
Bilos
plotscale
duringthe
sampling
period.N
umbers
representthe
Pearson’scorrelation
coefficientat
theB
ilosplot
between
mean
carbonconcentrations
(mm
olm−
3)
inthe
Bilos
groundwater
andin
thesix
first-orderstream
s,carbon
stocks(m
molm−
2day−
1),
carbonexports
(mm
olm−
2day−
1),carbon
degassing(m
molm−
2day−
1)
inthe
sixfirst-orderstream
s,hydrologicalparameters
(mm
day−
1,which
areP
,GW
S,ET
Rand
Dforprecipitation,ground-
waterstorage,evapotranspiration
anddrainage,respectively),w
atertabledepth
(mm
)andm
etabolicparam
eters(m
molm−
2day−
1).H
ere,degassingw
ascalculated
fromthe
DIC
dataofthe
Bilos
groundwateronly.E
achparam
eterwas
integratedbetw
eentw
osam
plingdates
(TableS2).V
aluesin
boldfontindicate
correlationw
ithap
value<
0.05,whereas
valuesin
italicfontindicate
correlationw
ithap
value<
0.001.
Concentration
inC
oncentrationin
Stockin
Exportfrom
groundwater
Degassing
instream
sH
ydrologicalparameters
Watertable
Metabolic
parameters
groundwater
streams
groundwater
tostream
s(m
molm−
2day−
1)
(mm
day−
1)
depth(m
m)
(mm
olm−
2day−
1)
(mm
olm−
3)
(mm
olm−
3)
(mm
olm−
2)
(mm
olm−
2day−
1)
DIC
gwD
OC
gwD
ICstream
DO
Cstream
DIC
stockD
OC
stockD
ICexport
DO
Cexport
Fdegass
PG
WS
ET
RD
HN
EE
GPP
R
DIC
gw1
−0.65
0.86−
0.340.99
−0.65
−0.44
−0.62
−0.48
−0.02
0.45−
0.41−
0.68−
0.830.52
−0.31
−0.09
DO
Cgw
1−
0.410.43
−0.64
0.980.69
0.950.56
0.17−
0.280.41
0.930.85
−0.19
−0.13
−0.36
DIC
stream1
−0.55
0.82−
0.42−
0.35−
0.34−
0.54−
0.140.23
−0.25
−0.44
−0.75
0.43−
0.32−
0.16D
OC
stream1
−0.33
0.450.45
0.380.66
0.300.35
−0.39
0.46−
0.700.15
−0.41
−0.53
DIC
stock1
−0.63
0.37−
0.62−
0.44−
0.040.45
−0.44
0.67−
0.79−
0.480.28
−0.07
DO
Cstock
1−
0.820.97
0.670.21
−0.23
0.32−
0.970.88
0.20−
0.14−
0.39D
ICexport
10.72
0.860.26
0.010.02
0.830.76
−0.18
−0.15
−0.39
DO
Cexport
10.57
0.24−
0.220.28
0.980.81
−0.19
−0.17
−0.41
Fdegass
10.45
0.240.17
0.700.78
0.06−
0.35−
0.50P
10.76
−0.30
0.290.23
0.33−
0.44−
0.43G
WS
1−
0.73−
0.16−
0.150.62
−0.63
−0.51
ET
R1
0.220.17
−0.63
0.630.50
D1
0.88−
0.23−
0.15−
0.41H
1−
0.27−
0.060.31
NE
E1−
0.85−
0.55G
PP1
0.91R
1
Biogeosciences, 15, 669–691, 2018 www.biogeosciences.net/15/669/2018/
L. Deirmendjian et al.: Hydro-ecological controls on dissolved carbon dynamics in groundwater 677
Table 3. Metabolic parameters (GPP, Reco and NEE) estimated at the Bilos plot with the eddy covariance techniques. Numbers represent themean±SD and the range (between square brackets) for the years 2014–2015 and for high-flow (January–March 2014 and February–March2015), growing season (April–August 2014 and April–August 2015), late summer (September–October 2014 and September–October 2015)and early winter (November 2014–January 2015 and November–December 2015) periods. Positive NEE indicates an upward flux whereas anegative NEE indicates a downward flux; GPP is positive or zero and Reco is positive. NEE=Reco.−GPP.
GPP Reco NEE(mmol m−2 day−1) (mmol m−2 day−1) (mmol m−2 day−1)
2014–2015 400± 210 310± 150 −90± 110[160–880] [110–660] [−340–100]
High flow 300± 80 180± 50 −120± 50[180–420] [105–260] [−160—30]
Growing season 640± 150 490± 100 −160± 140[380–880] [320–640] [−330–100]
Late summer 350± 120 300± 80 −50± 60[240–540] [200–410] [−160–10]
Early winter 210± 30 230± 50 20± 20[160–260] [170–320] [−10–65]
Figure 3. Monthly water mass balance at the Bilos sitefor the 2014–2015 period. Pearson coefficient R= 0.85 andp value < 0.001. Blue points represent months when groundwaterstorage was extremely negative in March 2014, April 2014, March2015, April 2015, June 2015 and July 2015 (Fig. 2c). These bluepoints are further away from the 1 : 1 line than the other months(represented in black). The drainage of the Leyre river is delayedcompared to the drainage of the Bilos plot. Thus, when the lossof groundwater is extremely high (negative groundwater storage),estimated drainage does not correspond exactly to the measuredgroundwater storage.
3.2 Net ecosystem exchange of CO2 in the forest plot(Bilos plot)
GPP, Reco and NEE exhibited a strong seasonal variabil-ity (Table 3; Fig. 2b). GPP, Reco and NEE were 400± 220,310± 150 and −90± 110 mmol m−2 day−1, respectively,throughout the years 2014 and 2015 (we excluded the16 May–7 July 2014 period when no eddy covariancemeasurements were available), equivalent to 1750± 960,1360± 660 and 390± 480 g C m−2 yr−1 (Table 3; Fig. 2b).These results were close to Moreaux et al. (2011) esti-mates of 1720, 1480 and 340 g C m−2 yr−1 as measured ata younger forest stage in the same forest plot. GPP in-creased from early winter (210± 30 mmol m−2 day−1) togrowing season (640± 150 mmol m−2 day−1) periods (Ta-ble 3; Fig. 2b). Reco followed the same temporal trend (Ta-ble 3; Fig. 2b). During late summer and early winter peri-ods, NEE could be positive (Reco > GPP), meaning that thepine forest ecosystems had switched from autotrophic to het-erotrophic metabolism, notably in October, November andDecember 2014 (Table 3; Fig. 2b). NEE was always negative(Reco < GPP) during high-flow and growing season periods,except in July 2015, probably as a consequence of temporarylow precipitation (Table 3; Fig. 2b–c).
3.3 Dissolved carbon evolution in shallow groundwater
In shallow groundwater, total alkalinity was low and orig-inated from slow weathering of silicate minerals withvegetation-derived CO2 (Polsenaere and Abril, 2012). Themean proportion of total alkalinity in the DIC pool in shal-low groundwater was 5 %, the large majority of the DIC be-ing composed of dissolved CO2 resulting from microbial andplant root respiration in the soil. Although the sampling fre-quency was monthly or more, it allowed the detection ofsignificant changes in the groundwater DIC and DOC con-
www.biogeosciences.net/15/669/2018/ Biogeosciences, 15, 669–691, 2018
678 L. Deirmendjian et al.: Hydro-ecological controls on dissolved carbon dynamics in groundwater
Table 4. Carbon concentrations in the sampled groundwater and in the sampled first-order streams during the sampling period (January 2014–July 2015) for high-flow (January–March 2014 and February–March 2015), growing season (April–August 2014 and April–August 2015),late summer (September–October 2014 and September–October 2015) and early winter (November 2014–January 2015 and November–December 2015) periods. Numbers represent the mean±SD, the range (between square brackets) and the number (N ) of samples for eachhydrological period.
DOC (mmol m−3) DIC (mmol m−3)
Piezometer Bilos Piezometer 2 Piezometer 3 Streams Piezometer Bilos Piezometer 2 Piezometer 3 Streams
High 3500± 200 280 1500 490± 10 1160± 470 1380 1510 280± 40flow [3200–3700] [460–510] [570–1700] [220–310]
N = 3 N = 1 N = 1 N = 15 N = 3 N = 1 N = 1 N = 15Growing 750± 440 380± 40 880± 400 360± 100 2570± 240 1450± 380 2030± 220 330± 120season [320–950] [300–400] [550–830] [200–540] [2350–3030] [1000–2100] [1650–2160] [210–550]
N = 7 N = 5 N = 4 N = 41 N = 7 N = 5 N = 4 N = 41Late 540± 60 420± 80 370± 30 5240± 140 3900± 100 1030± 240summer [480–600] [340–500] [340–400] [5100–5400] [3800–4000] [790–1270]
N = 2 N = 2 N = 0 N = 4 N = 2 N = 2 N = 0 N = 4Early 640± 50 470± 110 760 510± 30 2600± 980 2370± 1500 2040 300± 90winter [580–670] [350–620] [480–550] [1850–4000] [940–4500] [240–430]
N = 3 N = 3 N = 1 N = 17 N = 3 N = 3 N = 1 N = 17
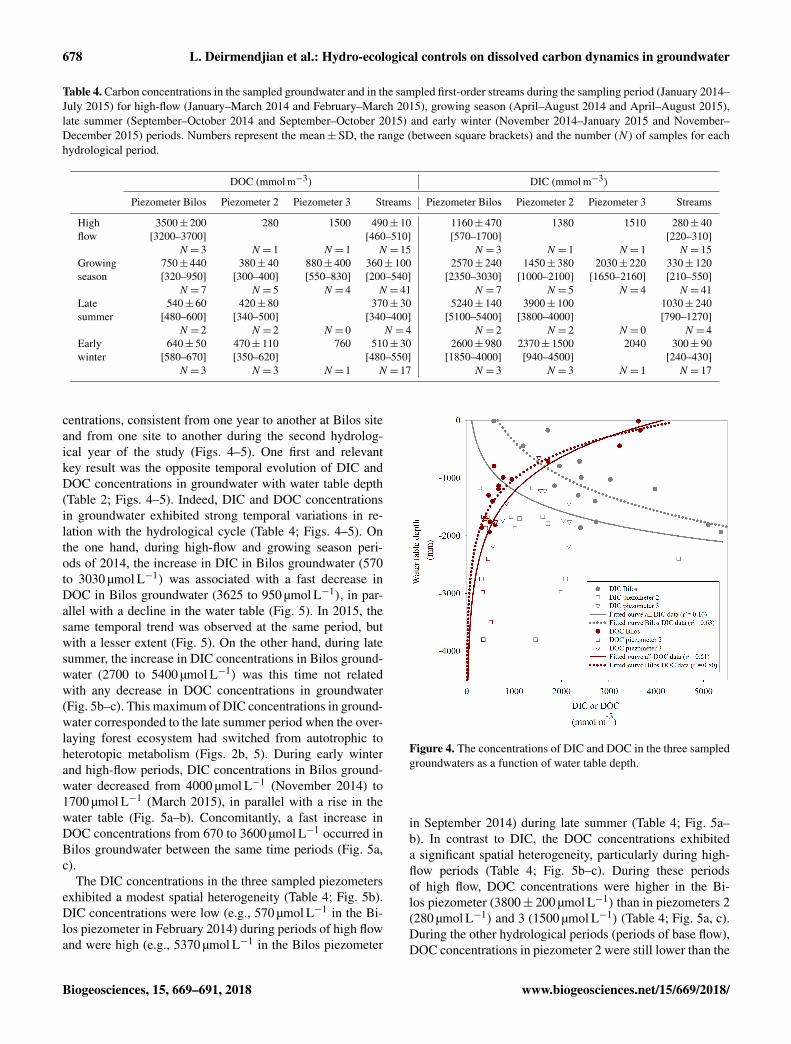
centrations, consistent from one year to another at Bilos siteand from one site to another during the second hydrolog-ical year of the study (Figs. 4–5). One first and relevantkey result was the opposite temporal evolution of DIC andDOC concentrations in groundwater with water table depth(Table 2; Figs. 4–5). Indeed, DIC and DOC concentrationsin groundwater exhibited strong temporal variations in re-lation with the hydrological cycle (Table 4; Figs. 4–5). Onthe one hand, during high-flow and growing season peri-ods of 2014, the increase in DIC in Bilos groundwater (570to 3030 µmol L−1) was associated with a fast decrease inDOC in Bilos groundwater (3625 to 950 µmol L−1), in par-allel with a decline in the water table (Fig. 5). In 2015, thesame temporal trend was observed at the same period, butwith a lesser extent (Fig. 5). On the other hand, during latesummer, the increase in DIC concentrations in Bilos ground-water (2700 to 5400 µmol L−1) was this time not relatedwith any decrease in DOC concentrations in groundwater(Fig. 5b–c). This maximum of DIC concentrations in ground-water corresponded to the late summer period when the over-laying forest ecosystem had switched from autotrophic toheterotopic metabolism (Figs. 2b, 5). During early winterand high-flow periods, DIC concentrations in Bilos ground-water decreased from 4000 µmol L−1 (November 2014) to1700 µmol L−1 (March 2015), in parallel with a rise in thewater table (Fig. 5a–b). Concomitantly, a fast increase inDOC concentrations from 670 to 3600 µmol L−1 occurred inBilos groundwater between the same time periods (Fig. 5a,c).
The DIC concentrations in the three sampled piezometersexhibited a modest spatial heterogeneity (Table 4; Fig. 5b).DIC concentrations were low (e.g., 570 µmol L−1 in the Bi-los piezometer in February 2014) during periods of high flowand were high (e.g., 5370 µmol L−1 in the Bilos piezometer
Figure 4. The concentrations of DIC and DOC in the three sampledgroundwaters as a function of water table depth.
in September 2014) during late summer (Table 4; Fig. 5a–b). In contrast to DIC, the DOC concentrations exhibiteda significant spatial heterogeneity, particularly during high-flow periods (Table 4; Fig. 5b–c). During these periodsof high flow, DOC concentrations were higher in the Bi-los piezometer (3800± 200 µmol L−1) than in piezometers 2(280 µmol L−1) and 3 (1500 µmol L−1) (Table 4; Fig. 5a, c).During the other hydrological periods (periods of base flow),DOC concentrations in piezometer 2 were still lower than the
Biogeosciences, 15, 669–691, 2018 www.biogeosciences.net/15/669/2018/
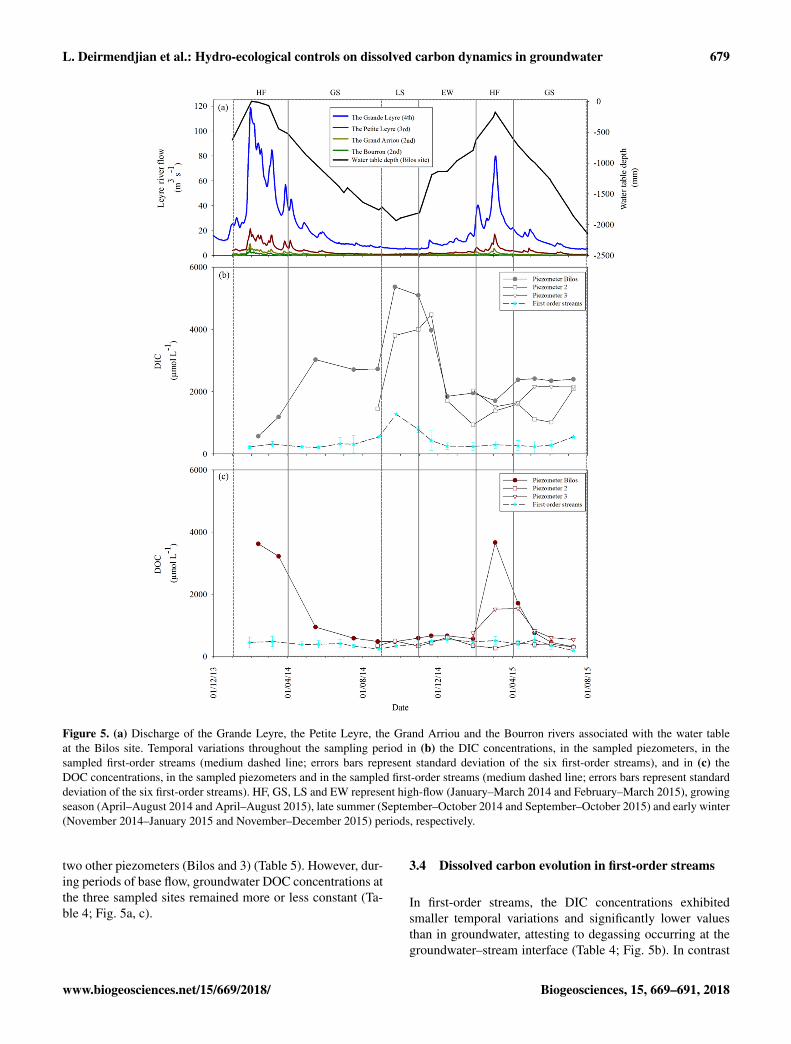
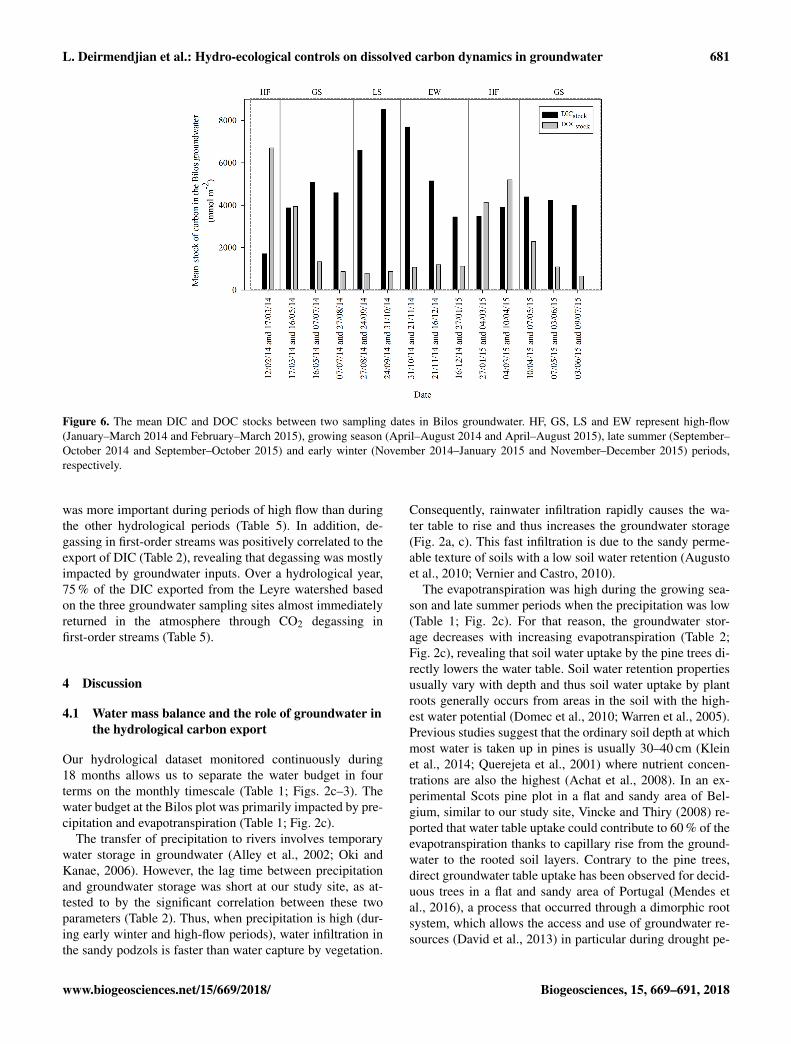
L. Deirmendjian et al.: Hydro-ecological controls on dissolved carbon dynamics in groundwater 679
Figure 5. (a) Discharge of the Grande Leyre, the Petite Leyre, the Grand Arriou and the Bourron rivers associated with the water tableat the Bilos site. Temporal variations throughout the sampling period in (b) the DIC concentrations, in the sampled piezometers, in thesampled first-order streams (medium dashed line; errors bars represent standard deviation of the six first-order streams), and in (c) theDOC concentrations, in the sampled piezometers and in the sampled first-order streams (medium dashed line; errors bars represent standarddeviation of the six first-order streams). HF, GS, LS and EW represent high-flow (January–March 2014 and February–March 2015), growingseason (April–August 2014 and April–August 2015), late summer (September–October 2014 and September–October 2015) and early winter(November 2014–January 2015 and November–December 2015) periods, respectively.
two other piezometers (Bilos and 3) (Table 5). However, dur-ing periods of base flow, groundwater DOC concentrations atthe three sampled sites remained more or less constant (Ta-ble 4; Fig. 5a, c).
3.4 Dissolved carbon evolution in first-order streams
In first-order streams, the DIC concentrations exhibitedsmaller temporal variations and significantly lower valuesthan in groundwater, attesting to degassing occurring at thegroundwater–stream interface (Table 4; Fig. 5b). In contrast
www.biogeosciences.net/15/669/2018/ Biogeosciences, 15, 669–691, 2018
680 L. Deirmendjian et al.: Hydro-ecological controls on dissolved carbon dynamics in groundwater
Table 5. Export of DIC and DOC from the sampled groundwater to first-order streams, as well as degassing in first-order streams, forthe sampling period and for high-flow (January–March 2014 and February–March 2015), growing season (April–August 2014 and April–August 2015), late summer (September–October 2014 and September–October 2015) and early winter (November 2014–January 2015 andNovember–December 2015) periods. Numbers represent the mean±SD whereas numbers in square brackets represent the range. Here,degassing was calculated with the DIC data from the three sampled groundwaters.
DOCexport (mmol m−2 day−1) DICexport (mmol m−2 day−1) Degassing(mmol m−2 day−1)
Bilos Piezometer 2 Piezometer 3 Streamsb Bilos Piezometer 2 Piezometer 3 Streamsb Streamspiezometer piezometer
High flow 3.4± 1.1 0.4± 0.02 1.5± 0.2 0.6± 0.1 1.8± 0.4 1.4± 0.2 1.8± 0.1 0.3± 0.1 1.4± 0.2[2.3–4.9] [0.3–0.4] [1.2–1.7] [0.5–0.7] [1.3–2.2] [1.3–1.6] [1.7–1.9] [0.3–0.4] [0.8–1.9]
Growing season 0.4± 0.4 0.05± 0.02 0.2± 0.2 0.1± 0.1 0.7± 0.3 0.3± 0.1 0.6± 0.1 0.1± 0.03 0.5± 0.2[0.1–1.2] [0.1–0.2] [0.1–0.4] [0.05–0.3] [0.4–1.3] [0.3–0.5] [0.4–0.7] [0.05–0.2] [0.3–1.3]
Late summer 0.1± 0.01 0.1± 0.04 0.1± 0.01 0.6± 0.03 0.4± 0.05 0.1± 0.01 0.4± 0.1[0.1–0.1] [0.1–0.1] [0.05–0.1] [0.6–0.7] [0.4–0.5] [0.1–0.1] [0.4–0.6]
Early winter 0.1± 0.02 0.1± 0.03 0.2 0.1± 0.02 0.7± 0.1 0.6± 0.2 0.6 0.1± 0.02 0.5± 0.1[0.1–0.2] [0.1–0.1] [0.1–0.1] [0.5–0.8] [0.4–0.8] [0.1–0.1] [0.5–0.6]
2014–2015 0.9± 1.4 0.1± 0.1 0.6± 0.5 0.2± 0.2 0.9± 0.5 0.6± 0.4 1.0± 0.6 0.2± 0.1 0.6± 0.3[0.1–4.9] [0.05–0.4] [0.1–1.7] [0.05–0.7] [0.4–2.2] [0.3–1.6] [0.4–1.9] [0.05–0.4] [0.2–1.3]
Entire watershed 0.7± 0.7a 0.2± 0.2 0.9± 0.5a 0.2± 0.1 0.7± 0.5(2014–2015)
a Mean carbon export weighted by surface, assuming that the Bilos piezometer is representative of the wet Landes, that piezometer 2 is representative of the dry Landes and thatpiezometer 3 is representative of the mesophyllous Landes using the relative surface area of each type of Landes. b Carbon exports from first- to second-order streams calculatedfrom the drainage of first-order streams (mm day−1) and the mean concentrations of DOC and DIC in first-order streams (mmol m−3).
to DIC, the DOC concentrations in first-order streams wereof the same order of magnitude as in piezometer 2 (dry Lan-des) and significantly lower than in the two other piezometers(wet to mesophyllous Landes), in particular during periodsof high flow (Table 4; Fig. 5c). As in groundwater, DOC andDIC concentrations in first-order streams were significantlyanticorrelated (Table 2), suggesting that carbon dynamics infirst-order streams was mostly impacted by groundwater in-puts.
3.5 Carbon stocks in groundwater and exports tostreams
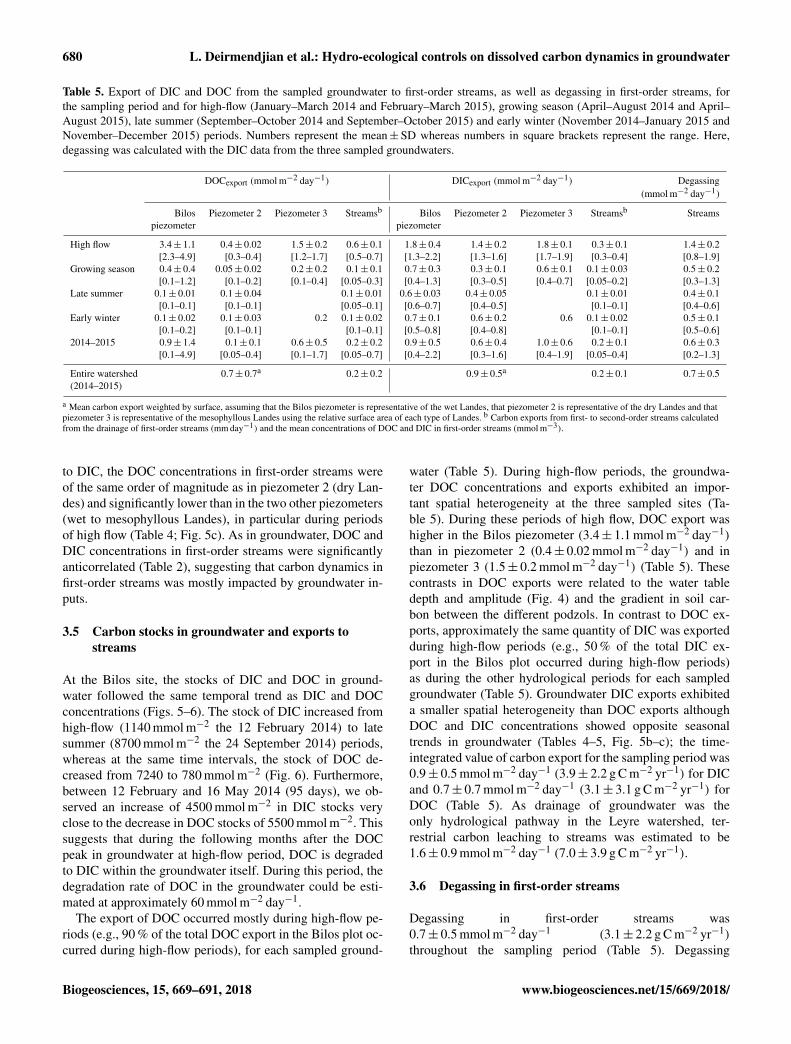
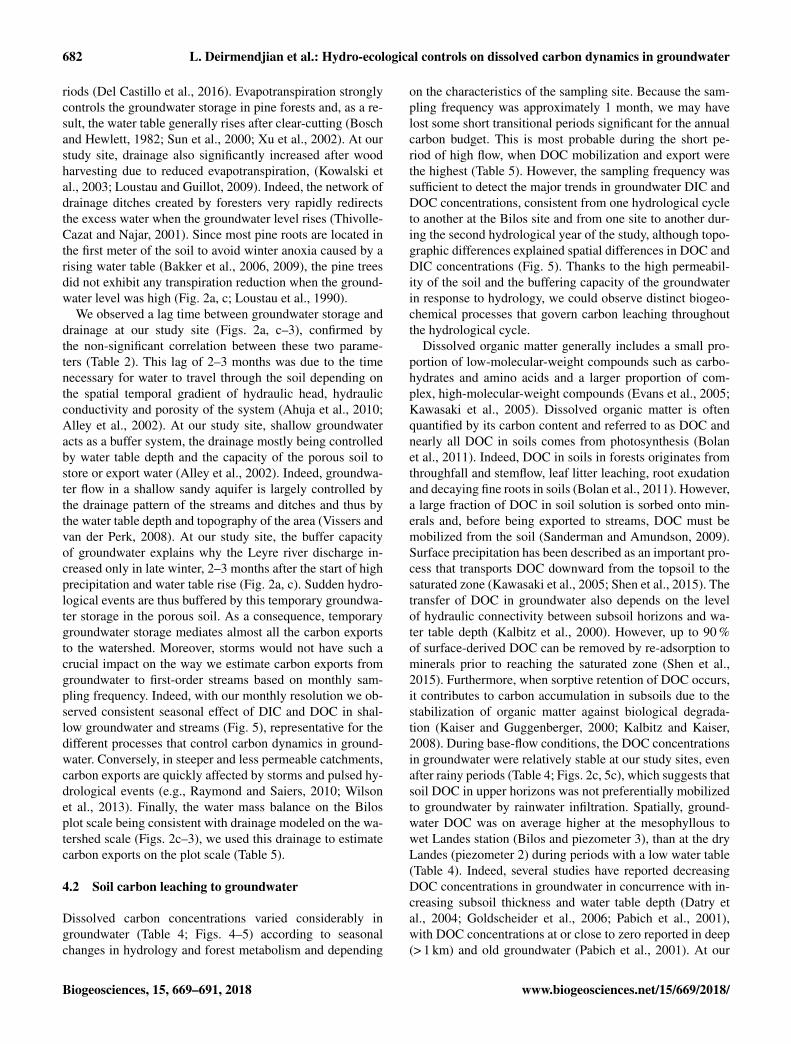
At the Bilos site, the stocks of DIC and DOC in ground-water followed the same temporal trend as DIC and DOCconcentrations (Figs. 5–6). The stock of DIC increased fromhigh-flow (1140 mmol m−2 the 12 February 2014) to latesummer (8700 mmol m−2 the 24 September 2014) periods,whereas at the same time intervals, the stock of DOC de-creased from 7240 to 780 mmol m−2 (Fig. 6). Furthermore,between 12 February and 16 May 2014 (95 days), we ob-served an increase of 4500 mmol m−2 in DIC stocks veryclose to the decrease in DOC stocks of 5500 mmol m−2. Thissuggests that during the following months after the DOCpeak in groundwater at high-flow period, DOC is degradedto DIC within the groundwater itself. During this period, thedegradation rate of DOC in the groundwater could be esti-mated at approximately 60 mmol m−2 day−1.
The export of DOC occurred mostly during high-flow pe-riods (e.g., 90 % of the total DOC export in the Bilos plot oc-curred during high-flow periods), for each sampled ground-
water (Table 5). During high-flow periods, the groundwa-ter DOC concentrations and exports exhibited an impor-tant spatial heterogeneity at the three sampled sites (Ta-ble 5). During these periods of high flow, DOC export washigher in the Bilos piezometer (3.4± 1.1 mmol m−2 day−1)
than in piezometer 2 (0.4± 0.02 mmol m−2 day−1) and inpiezometer 3 (1.5± 0.2 mmol m−2 day−1) (Table 5). Thesecontrasts in DOC exports were related to the water tabledepth and amplitude (Fig. 4) and the gradient in soil car-bon between the different podzols. In contrast to DOC ex-ports, approximately the same quantity of DIC was exportedduring high-flow periods (e.g., 50 % of the total DIC ex-port in the Bilos plot occurred during high-flow periods)as during the other hydrological periods for each sampledgroundwater (Table 5). Groundwater DIC exports exhibiteda smaller spatial heterogeneity than DOC exports althoughDOC and DIC concentrations showed opposite seasonaltrends in groundwater (Tables 4–5, Fig. 5b–c); the time-integrated value of carbon export for the sampling period was0.9± 0.5 mmol m−2 day−1 (3.9± 2.2 g C m−2 yr−1) for DICand 0.7± 0.7 mmol m−2 day−1 (3.1± 3.1 g C m−2 yr−1) forDOC (Table 5). As drainage of groundwater was theonly hydrological pathway in the Leyre watershed, ter-restrial carbon leaching to streams was estimated to be1.6± 0.9 mmol m−2 day−1 (7.0± 3.9 g C m−2 yr−1).
3.6 Degassing in first-order streams
Degassing in first-order streams was0.7± 0.5 mmol m−2 day−1 (3.1± 2.2 g C m−2 yr−1)
throughout the sampling period (Table 5). Degassing
Biogeosciences, 15, 669–691, 2018 www.biogeosciences.net/15/669/2018/
L. Deirmendjian et al.: Hydro-ecological controls on dissolved carbon dynamics in groundwater 681
Figure 6. The mean DIC and DOC stocks between two sampling dates in Bilos groundwater. HF, GS, LS and EW represent high-flow(January–March 2014 and February–March 2015), growing season (April–August 2014 and April–August 2015), late summer (September–October 2014 and September–October 2015) and early winter (November 2014–January 2015 and November–December 2015) periods,respectively.
was more important during periods of high flow than duringthe other hydrological periods (Table 5). In addition, de-gassing in first-order streams was positively correlated to theexport of DIC (Table 2), revealing that degassing was mostlyimpacted by groundwater inputs. Over a hydrological year,75 % of the DIC exported from the Leyre watershed basedon the three groundwater sampling sites almost immediatelyreturned in the atmosphere through CO2 degassing infirst-order streams (Table 5).
4 Discussion
4.1 Water mass balance and the role of groundwater inthe hydrological carbon export
Our hydrological dataset monitored continuously during18 months allows us to separate the water budget in fourterms on the monthly timescale (Table 1; Figs. 2c–3). Thewater budget at the Bilos plot was primarily impacted by pre-cipitation and evapotranspiration (Table 1; Fig. 2c).
The transfer of precipitation to rivers involves temporarywater storage in groundwater (Alley et al., 2002; Oki andKanae, 2006). However, the lag time between precipitationand groundwater storage was short at our study site, as at-tested to by the significant correlation between these twoparameters (Table 2). Thus, when precipitation is high (dur-ing early winter and high-flow periods), water infiltration inthe sandy podzols is faster than water capture by vegetation.
Consequently, rainwater infiltration rapidly causes the wa-ter table to rise and thus increases the groundwater storage(Fig. 2a, c). This fast infiltration is due to the sandy perme-able texture of soils with a low soil water retention (Augustoet al., 2010; Vernier and Castro, 2010).
The evapotranspiration was high during the growing sea-son and late summer periods when the precipitation was low(Table 1; Fig. 2c). For that reason, the groundwater stor-age decreases with increasing evapotranspiration (Table 2;Fig. 2c), revealing that soil water uptake by the pine trees di-rectly lowers the water table. Soil water retention propertiesusually vary with depth and thus soil water uptake by plantroots generally occurs from areas in the soil with the high-est water potential (Domec et al., 2010; Warren et al., 2005).Previous studies suggest that the ordinary soil depth at whichmost water is taken up in pines is usually 30–40 cm (Kleinet al., 2014; Querejeta et al., 2001) where nutrient concen-trations are also the highest (Achat et al., 2008). In an ex-perimental Scots pine plot in a flat and sandy area of Bel-gium, similar to our study site, Vincke and Thiry (2008) re-ported that water table uptake could contribute to 60 % of theevapotranspiration thanks to capillary rise from the ground-water to the rooted soil layers. Contrary to the pine trees,direct groundwater table uptake has been observed for decid-uous trees in a flat and sandy area of Portugal (Mendes etal., 2016), a process that occurred through a dimorphic rootsystem, which allows the access and use of groundwater re-sources (David et al., 2013) in particular during drought pe-
www.biogeosciences.net/15/669/2018/ Biogeosciences, 15, 669–691, 2018
682 L. Deirmendjian et al.: Hydro-ecological controls on dissolved carbon dynamics in groundwater
riods (Del Castillo et al., 2016). Evapotranspiration stronglycontrols the groundwater storage in pine forests and, as a re-sult, the water table generally rises after clear-cutting (Boschand Hewlett, 1982; Sun et al., 2000; Xu et al., 2002). At ourstudy site, drainage also significantly increased after woodharvesting due to reduced evapotranspiration, (Kowalski etal., 2003; Loustau and Guillot, 2009). Indeed, the network ofdrainage ditches created by foresters very rapidly redirectsthe excess water when the groundwater level rises (Thivolle-Cazat and Najar, 2001). Since most pine roots are located inthe first meter of the soil to avoid winter anoxia caused by arising water table (Bakker et al., 2006, 2009), the pine treesdid not exhibit any transpiration reduction when the ground-water level was high (Fig. 2a, c; Loustau et al., 1990).
We observed a lag time between groundwater storage anddrainage at our study site (Figs. 2a, c–3), confirmed bythe non-significant correlation between these two parame-ters (Table 2). This lag of 2–3 months was due to the timenecessary for water to travel through the soil depending onthe spatial temporal gradient of hydraulic head, hydraulicconductivity and porosity of the system (Ahuja et al., 2010;Alley et al., 2002). At our study site, shallow groundwateracts as a buffer system, the drainage mostly being controlledby water table depth and the capacity of the porous soil tostore or export water (Alley et al., 2002). Indeed, groundwa-ter flow in a shallow sandy aquifer is largely controlled bythe drainage pattern of the streams and ditches and thus bythe water table depth and topography of the area (Vissers andvan der Perk, 2008). At our study site, the buffer capacityof groundwater explains why the Leyre river discharge in-creased only in late winter, 2–3 months after the start of highprecipitation and water table rise (Fig. 2a, c). Sudden hydro-logical events are thus buffered by this temporary groundwa-ter storage in the porous soil. As a consequence, temporarygroundwater storage mediates almost all the carbon exportsto the watershed. Moreover, storms would not have such acrucial impact on the way we estimate carbon exports fromgroundwater to first-order streams based on monthly sam-pling frequency. Indeed, with our monthly resolution we ob-served consistent seasonal effect of DIC and DOC in shal-low groundwater and streams (Fig. 5), representative for thedifferent processes that control carbon dynamics in ground-water. Conversely, in steeper and less permeable catchments,carbon exports are quickly affected by storms and pulsed hy-drological events (e.g., Raymond and Saiers, 2010; Wilsonet al., 2013). Finally, the water mass balance on the Bilosplot scale being consistent with drainage modeled on the wa-tershed scale (Figs. 2c–3), we used this drainage to estimatecarbon exports on the plot scale (Table 5).
4.2 Soil carbon leaching to groundwater
Dissolved carbon concentrations varied considerably ingroundwater (Table 4; Figs. 4–5) according to seasonalchanges in hydrology and forest metabolism and depending
on the characteristics of the sampling site. Because the sam-pling frequency was approximately 1 month, we may havelost some short transitional periods significant for the annualcarbon budget. This is most probable during the short pe-riod of high flow, when DOC mobilization and export werethe highest (Table 5). However, the sampling frequency wassufficient to detect the major trends in groundwater DIC andDOC concentrations, consistent from one hydrological cycleto another at the Bilos site and from one site to another dur-ing the second hydrological year of the study, although topo-graphic differences explained spatial differences in DOC andDIC concentrations (Fig. 5). Thanks to the high permeabil-ity of the soil and the buffering capacity of the groundwaterin response to hydrology, we could observe distinct biogeo-chemical processes that govern carbon leaching throughoutthe hydrological cycle.
Dissolved organic matter generally includes a small pro-portion of low-molecular-weight compounds such as carbo-hydrates and amino acids and a larger proportion of com-plex, high-molecular-weight compounds (Evans et al., 2005;Kawasaki et al., 2005). Dissolved organic matter is oftenquantified by its carbon content and referred to as DOC andnearly all DOC in soils comes from photosynthesis (Bolanet al., 2011). Indeed, DOC in soils in forests originates fromthroughfall and stemflow, leaf litter leaching, root exudationand decaying fine roots in soils (Bolan et al., 2011). However,a large fraction of DOC in soil solution is sorbed onto min-erals and, before being exported to streams, DOC must bemobilized from the soil (Sanderman and Amundson, 2009).Surface precipitation has been described as an important pro-cess that transports DOC downward from the topsoil to thesaturated zone (Kawasaki et al., 2005; Shen et al., 2015). Thetransfer of DOC in groundwater also depends on the levelof hydraulic connectivity between subsoil horizons and wa-ter table depth (Kalbitz et al., 2000). However, up to 90 %of surface-derived DOC can be removed by re-adsorption tominerals prior to reaching the saturated zone (Shen et al.,2015). Furthermore, when sorptive retention of DOC occurs,it contributes to carbon accumulation in subsoils due to thestabilization of organic matter against biological degrada-tion (Kaiser and Guggenberger, 2000; Kalbitz and Kaiser,2008). During base-flow conditions, the DOC concentrationsin groundwater were relatively stable at our study sites, evenafter rainy periods (Table 4; Figs. 2c, 5c), which suggests thatsoil DOC in upper horizons was not preferentially mobilizedto groundwater by rainwater infiltration. Spatially, ground-water DOC was on average higher at the mesophyllous towet Landes station (Bilos and piezometer 3), than at the dryLandes (piezometer 2) during periods with a low water table(Table 4). Indeed, several studies have reported decreasingDOC concentrations in groundwater in concurrence with in-creasing subsoil thickness and water table depth (Datry etal., 2004; Goldscheider et al., 2006; Pabich et al., 2001),with DOC concentrations at or close to zero reported in deep(> 1 km) and old groundwater (Pabich et al., 2001). At our
Biogeosciences, 15, 669–691, 2018 www.biogeosciences.net/15/669/2018/
L. Deirmendjian et al.: Hydro-ecological controls on dissolved carbon dynamics in groundwater 683
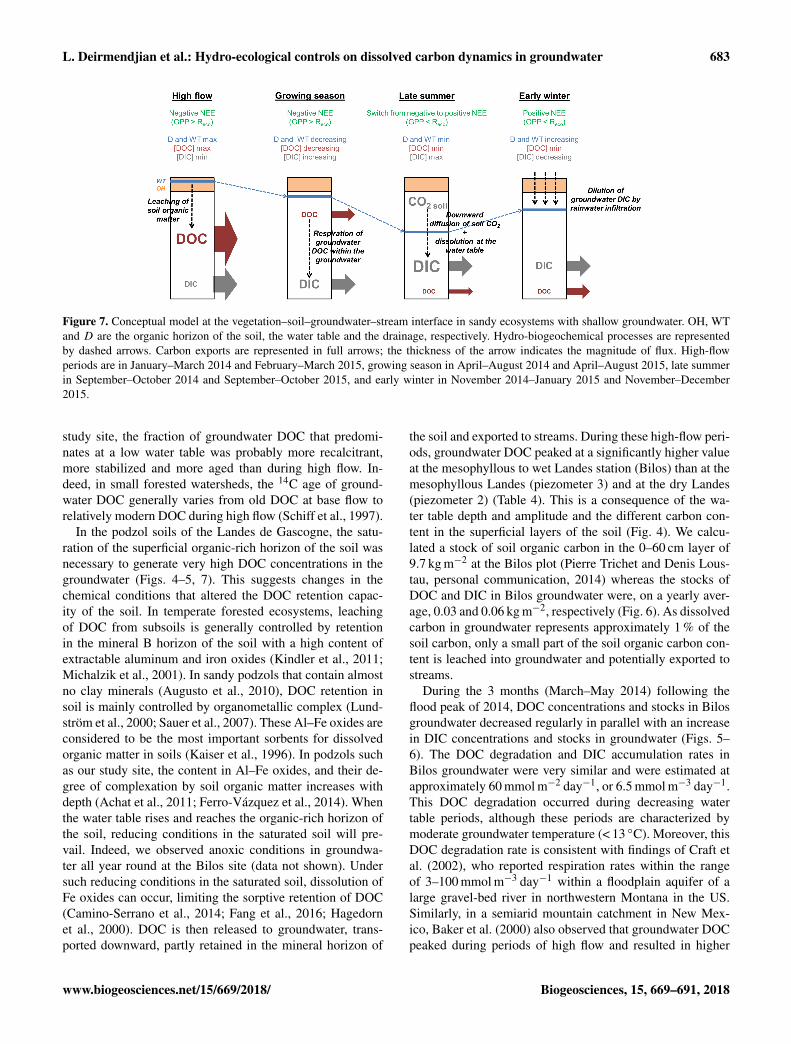
Figure 7. Conceptual model at the vegetation–soil–groundwater–stream interface in sandy ecosystems with shallow groundwater. OH, WTand D are the organic horizon of the soil, the water table and the drainage, respectively. Hydro-biogeochemical processes are representedby dashed arrows. Carbon exports are represented in full arrows; the thickness of the arrow indicates the magnitude of flux. High-flowperiods are in January–March 2014 and February–March 2015, growing season in April–August 2014 and April–August 2015, late summerin September–October 2014 and September–October 2015, and early winter in November 2014–January 2015 and November–December2015.
study site, the fraction of groundwater DOC that predomi-nates at a low water table was probably more recalcitrant,more stabilized and more aged than during high flow. In-deed, in small forested watersheds, the 14C age of ground-water DOC generally varies from old DOC at base flow torelatively modern DOC during high flow (Schiff et al., 1997).
In the podzol soils of the Landes de Gascogne, the satu-ration of the superficial organic-rich horizon of the soil wasnecessary to generate very high DOC concentrations in thegroundwater (Figs. 4–5, 7). This suggests changes in thechemical conditions that altered the DOC retention capac-ity of the soil. In temperate forested ecosystems, leachingof DOC from subsoils is generally controlled by retentionin the mineral B horizon of the soil with a high content ofextractable aluminum and iron oxides (Kindler et al., 2011;Michalzik et al., 2001). In sandy podzols that contain almostno clay minerals (Augusto et al., 2010), DOC retention insoil is mainly controlled by organometallic complex (Lund-ström et al., 2000; Sauer et al., 2007). These Al–Fe oxides areconsidered to be the most important sorbents for dissolvedorganic matter in soils (Kaiser et al., 1996). In podzols suchas our study site, the content in Al–Fe oxides, and their de-gree of complexation by soil organic matter increases withdepth (Achat et al., 2011; Ferro-Vázquez et al., 2014). Whenthe water table rises and reaches the organic-rich horizon ofthe soil, reducing conditions in the saturated soil will pre-vail. Indeed, we observed anoxic conditions in groundwa-ter all year round at the Bilos site (data not shown). Undersuch reducing conditions in the saturated soil, dissolution ofFe oxides can occur, limiting the sorptive retention of DOC(Camino-Serrano et al., 2014; Fang et al., 2016; Hagedornet al., 2000). DOC is then released to groundwater, trans-ported downward, partly retained in the mineral horizon of
the soil and exported to streams. During these high-flow peri-ods, groundwater DOC peaked at a significantly higher valueat the mesophyllous to wet Landes station (Bilos) than at themesophyllous Landes (piezometer 3) and at the dry Landes(piezometer 2) (Table 4). This is a consequence of the wa-ter table depth and amplitude and the different carbon con-tent in the superficial layers of the soil (Fig. 4). We calcu-lated a stock of soil organic carbon in the 0–60 cm layer of9.7 kg m−2 at the Bilos plot (Pierre Trichet and Denis Lous-tau, personal communication, 2014) whereas the stocks ofDOC and DIC in Bilos groundwater were, on a yearly aver-age, 0.03 and 0.06 kg m−2, respectively (Fig. 6). As dissolvedcarbon in groundwater represents approximately 1 % of thesoil carbon, only a small part of the soil organic carbon con-tent is leached into groundwater and potentially exported tostreams.
During the 3 months (March–May 2014) following theflood peak of 2014, DOC concentrations and stocks in Bilosgroundwater decreased regularly in parallel with an increasein DIC concentrations and stocks in groundwater (Figs. 5–6). The DOC degradation and DIC accumulation rates inBilos groundwater were very similar and were estimated atapproximately 60 mmol m−2 day−1, or 6.5 mmol m−3 day−1.This DOC degradation occurred during decreasing watertable periods, although these periods are characterized bymoderate groundwater temperature (< 13 ◦C). Moreover, thisDOC degradation rate is consistent with findings of Craft etal. (2002), who reported respiration rates within the rangeof 3–100 mmol m−3 day−1 within a floodplain aquifer of alarge gravel-bed river in northwestern Montana in the US.Similarly, in a semiarid mountain catchment in New Mex-ico, Baker et al. (2000) also observed that groundwater DOCpeaked during periods of high flow and resulted in higher
www.biogeosciences.net/15/669/2018/ Biogeosciences, 15, 669–691, 2018
684 L. Deirmendjian et al.: Hydro-ecological controls on dissolved carbon dynamics in groundwater
rates of heterotrophic metabolism, presumably because ofthe supply of labile DOC via more intense hydrologic con-nections between the soil and the groundwater. The bioavail-ability of groundwater DOC is related to the content of com-pounds of low molecular weight, such as amino acids or car-bohydrates, and compounds of high molecular weight suchas fulvic or humic acids are more recalcitrant to decomposi-tion by microbes. Our results suggest that DOC degradationwithin the groundwater occurred the following months afterthe mobilization of biodegradable DOC during a high watertable.
The increase in DIC concentrations in groundwater dur-ing late summer of 2014 (September–October 2014) was dueto another process, this time not associated with any DOCdegradation in groundwater (Fig. 5b–c). At our study site,the late summer period, when the forest ecosystem is a netsource of CO2 for the atmosphere (positive NEE), also cor-responds to a maximum in CO2 concentration in groundwa-ter (Figs. 2b, 5b) and thus a maximum contribution of soilrespiration to groundwater DIC. Transfer of CO2 from soilair to groundwater requires input of fluid, i.e., gas or water(Tsypin and Macpherson, 2012). Typical pathways are down-ward CO2 transport from soil in the dissolved (Kessler andHarvey, 2001) or gaseous form (Appelo and Postma, 2005),upward flux of deep CO2 of various origins through gas vents(Chiodini et al., 1999) or leakage from adjacent aquifers. Atour study site there is no evidence of a deep CO2 sourceor leakage from adjacent aquifers (Bertran et al., 2011). Inaddition, during late dry summer, no rainy events occurred(Fig. 2c), and the high temperatures observed during this pe-riod are favorable for a high production of gaseous CO2 in theunsaturated region of the soil, which follows the Arrheniusequation (Lloyd and Taylor, 1994; Reth et al., 2005). Duringhigh temperature periods in summer, the amount of CO2 inequilibrium with groundwater lower than in soil upper hori-zons favored a downward flux of gaseous CO2 (Tsypin andMacpherson, 2012), which suggests that soil CO2 must havebeen transported to groundwater in gaseous form by sim-ple downward diffusion (Fig. 7). In a North American tall-grass prairie resting on limestone, downward movement ofCO2 gas followed by equilibration with groundwater at thewater table was favorable during a drought period, whereastransport of soil CO2 in the dissolved form with diffuse flowof recharge water was the most effective during wet peri-ods (Tsypin and Macpherson, 2012). In temperate forestedlandscapes, other authors noticed that during dry periods,a strong reduction in soil CO2 flux to the atmosphere (up-ward diffusion) is associated with a decline in soil watercontent that stresses roots and microorganisms (Davidson etal., 1998; Epron et al., 1999). This suggests that the peak ofgroundwater pCO2 observed in October 2014 (Fig. 5b) origi-nates from soil CO2 that was produced before, certainly dur-ing July–August 2014 when the temperature was the high-est and precipitation was sufficient to maintain a soil mois-ture that did not limit soil respiration (Fig. 2b–c). The lag
time of 2–3 months between the peak of groundwater CO2and soil CO2 has been documented by Tsypin and Macpher-son (2012), who concluded that it corresponded to the traveltime of soil-generated CO2 to the water table. In the sandypodzols, during the drought period, the high porosity in thesandy soil may favor downward diffusion of CO2 and its dis-solution in groundwater. Thereafter, during the early winterperiod, concentrations of DIC in groundwater decreased as aconsequence of dilution with rainwater with low DIC content(Fig. 7).
4.3 Carbon transfer at thegroundwater–stream–atmosphere interface
In the Leyre watershed, carbon exports are influenced by thesoil types, which are characterized by a different water ta-ble depth and amplitude (Fig. 4), as well as a gradient ofcarbon content in the different soil types (Augusto et al.,2006). However, these last parameters have a stronger ef-fect on the spatial heterogeneity of DOC exports than DICexports (Table 5). Indeed, drainage and DOC concentrationsin groundwater have a cumulative positive effect on DOCexports (Tables 1–2, 4–5; Fig. 5b–c); in contrast, drainageand DIC concentrations in groundwater have antagonisticeffects on DIC exports (Tables 1–2, 4–5; Fig. 5b–c). Asa consequence, groundwater exports the majority of DOCduring the 2–3 months of high flow, but approximately thesame quantity of DIC is exported during periods of highflow and periods of base flow (Table 5). In addition, dur-ing the study period the discharge varied by up to 100-fold(Fig. 2a); the corresponding variations in DIC and DOC con-centrations and exports from the groundwater varied up to10-fold (Tables 4–5; Figs. 4–5). As reported in other stud-ies (Fiedler et al., 2006; Öquist et al., 2009), carbon exportrates were mainly determined by discharge, the variationsin carbon concentrations and exports being relatively smallcompared to the flow variation. However, for the whole sam-pling period, the mean weighted carbon export is almost thesame for both DIC (0.9± 0.5 mmol m−2 day−1) and DOC(0.7± 0.7 mmol m−2 day−1) (Table 5), and the forest ecosys-tem exports in total 1.6± 0.9 mmol m−2 day−1 (equivalentto 7.0± 3.9 g C m−2 yr−1), 40 % as DOC and 60 % as DIC(Table 6). This terrestrial carbon leaching from groundwa-ter to streams is of the same order of magnitude as carbonleaching from subsoils (11.9± 5.9 g C m−2 yr−1) in five tem-perate forest plots across Europe (Kindler et al., 2011), in atemperate Japanese deciduous forest from soils to streams(4.0 g C m−2 yr−1) (Shibata et al., 2005), or in Europeanforests (9.6± 3.2 g C m−2 yr−1) (Luyssaert et al., 2010).
As in groundwater, DOC and DIC concentrations in first-order streams were significantly anticorrelated (Table 2),suggesting that dissolved carbon dynamics in streams aremostly impacted by groundwater inputs (Kawasaki et al.,2005; Öquist et al., 2009). We could observe higher DOCconcentrations in streams during early winter and high-flow
Biogeosciences, 15, 669–691, 2018 www.biogeosciences.net/15/669/2018/
L. Deirmendjian et al.: Hydro-ecological controls on dissolved carbon dynamics in groundwater 685
periods than during growing season and late summer pe-riods (Table 4). Increase in DOC concentrations with dis-charge and a high water table has been reported in theLeyre watershed (Polsenaere et al., 2013) and in many otherforested catchments (Alvarez-Cobelas et al., 2012; Daw-son et al., 2002; Raymond and Saiers, 2010; Striegl etal., 2005). At our study site, during periods of high flow,first-order streams exported 0.2± 0.2 mmol m−2 day−1 tosecond-order streams, a flux significantly lower than DOCexports (0.7± 0.7 mmol m−2 day−1) from groundwater tofirst-order streams (Table 5). As a consequence, during thesampling period, 70 % of the groundwater DOC was eitherdegraded or re-immobilized at the groundwater–stream in-terface (Table 5). Indeed, when groundwater DOC enters thesuperficial river network through drainage part of it might berapidly recycled by photooxidation (Macdonald and Minor,2013; Moody and Worrall, 2016) or by respiration within thestream (Hall et al., 2016; Roberts et al., 2007). Alternatively,DOC can be re-adsorbed on Fe or Al oxides that are partic-ularly abundant at the riverbed oxic–anoxic interface. As amatter of fact, flocculation with Fe or Al can remove DOCfrom solution (Sharp et al., 2006). In contrast, DOC concen-trations and exports were similar and stable in groundwa-ter and streams during periods of base flow (Table 5). Thissuggests that groundwater DOC behaved conservatively dur-ing low-flow stages (Schiff et al., 1997) and that DOC instreams was more labile during high-flow stages (Aravenaet al., 2004). Indeed, in a small temperate and forested catch-ment in Pennsylvania (US), McLaughlin and Kaplan (2013)reported an increase in concentrations of labile DOC of up to27-fold during high-flow stages compared to base-flow con-ditions.
DIC concentration in streams increased during the latesummer period in parallel with those in groundwater (Ta-ble 4; Fig. 5b). Indeed, concentrations of DIC show an in-verse relationship with discharge in the Leyre watershed(Polsenaere et al., 2013) and in other temperate catchments(Billett et al., 2004; Dawson and Smith, 2007) as the re-sult of dilution with rain water and a lower contributionof deep CO2-enriched groundwater during high-flow peri-ods. The discharge of DIC-rich groundwater supersaturatedwith CO2, together with the oxidation of dissolved organicmatter in surface waters, results in a large CO2 supersatu-ration of rivers (Hotchkiss et al., 2015; Stets et al., 2009).The quick loss of DIC between groundwater and first-orderstreams is due to efficient degassing of CO2 from headwa-ters (Fiedler et al., 2006; Venkiteswaran et al., 2014). Thisrapid degassing is also attested to by the change in the δ13Csignature of the DIC (Deirmendjian and Abril, 2018; Polse-naere and Abril, 2012; Venkiteswaran et al., 2014). Fur-thermore, the positive correlation between degassing andexport of DIC (Table 2) confirms that groundwater DICis the main source of CO2 degassing in superficial streamwaters (Hotchkiss et al., 2015; Öquist et al., 2009). Veryfast degassing was confirmed by observations in spring wa-
ters that lose up to 70 % of their CO2 a few dozen metersdownstream (Deirmendjian and Abril, 2018; Öquist et al.,2009). Venkiteswaran et al. (2014) concluded that most ofthe stream CO2 originating from groundwater drainage wasdegassed before typical in-stream sampling occurs. Through-out the sampling period degassing was, on a yearly aver-age, approximately 0.7± 0.5 mmol m−2 day−1 (equivalent to3.1± 2.2 g C m−2 yr−1). CO2 degassing was higher duringhigh-flow periods than during periods of base flow (Table 5),as a consequence of higher discharge and inputs of ground-water DIC to streams (Tables 1, 4) and higher water turbu-lence. As a matter of fact, degassing depends on water veloc-ity that induces water turbulence and thus increases the gastransfer velocity (Alin et al., 2011; Raymond et al., 2012).Overall, during the whole sampling period CO2 degassing instreams represented approximately 75 % of the DIC exportedfrom groundwater and thus a significant part of the carbonexported from forest rapidly returns to the atmosphere in theform of CO2 through degassing.
Leaching of terrestrial carbon from the pine forest inthe Leyre watershed calculated as the DOC and DICexport per catchment area was 1.6± 0.9 mmol m−2 day−1
(equivalent to 7.0± 3.9 g C m−2 yr−1). Eddy covari-ance measurements at the Bilos plot (Table 3) provideda forest net uptake of atmospheric CO2 of approx-imately −90± 110 mmol m−2 day−1 (equivalent to390± 480 g C m−2 yr−1). In the same way that ground-water DOC and DIC stocks represent a minor fractionof soil carbon, carbon leaching represents a very small(approximately 2 %) fraction of forest NEE, a conclusionconsistent with other studies in temperate forest ecosystems(Kindler et al., 2011; Magin et al., 2017; Shibata et al.,2005). Such weak export of carbon from forest ecosystems,at least in temperate regions, is at odds with recent studiesthat attempt to integrate the contribution of inland waters inthe continents’ carbon budget (Ciais et al., 2013). Indeed, onthe global scale, the quantity of terrestrial carbon necessaryto account for the sum of CO2 degassing from inland waters,organic carbon burial in sediments and carbon export to theocean represents more than 2 Pg C yr−1, a number similarto the actual net land sink of atmospheric CO2 (Ciais et al.,2013). Understanding why local and global carbon massbalances strongly diverge on the proportion of land NEEexported to aquatic systems appears to be a major challengefor the next years of research in this field.
5 Conclusion
The monitoring of DIC and DOC concentrations in ground-water and first-order streams in podzol-dominated catchmentoverlaid by pine forest brings new insights on the natureof processes that control carbon leaching from soils, trans-formation in groundwater, and export to surface waters andback to the atmosphere (Fig. 7). This terrestrial–aquatic–
www.biogeosciences.net/15/669/2018/ Biogeosciences, 15, 669–691, 2018
686 L. Deirmendjian et al.: Hydro-ecological controls on dissolved carbon dynamics in groundwater
atmosphere interface is believed to behave as a hotspot in thecontinental carbon cycle. The permeable character of the soilat the study site enables a clear temporal decomposition ofprocesses involving carbon in groundwaters in relation withwater table depth and amplitude, forest ecosystem produc-tion, and respiration. Hydrology has a strong influence onthe carbon concentrations in shallow groundwater. High pre-cipitation caused the water table to rise and saturate the top-soil, inducing a large mobilization of soil organic matter asDOC in the shallow groundwater, a process also favored bytemporarily reducing conditions in the topsoil. These periodsof a high water table are also associated with low DIC con-centrations in groundwater caused by the groundwater dilu-tion with rainwater. Conversely, groundwater was enriched inDIC during base-flow stages, as the result of two distinct pro-cesses. First, microbial consumption of DOC occurs withinthe groundwater in spring and summer, the following monthsafter the periods of a high water table. Second, heterotrophicconditions in the forest ecosystem during late summer favorthe downward diffusion of soil CO2 to shallow groundwater.
In the absence of surface runoff, the comparison ofdissolved carbon concentrations between groundwater andstreams, associated with drainage data, allows us to under-stand and quantify the processes at the groundwater–stream–atmosphere interface. In the studied catchment, this methodreveals a fast degassing of DIC as CO2 throughout the yearin first-order streams. During base-flow periods, groundwa-ter DOC was exported conservatively to streams, probablybecause groundwater DOC was more recalcitrant, more sta-bilized and more aged during this period. However, duringstages of a high water table, DOC concentrations in ground-water increased at some sites but not at others. This spatialheterogeneity of carbon export in the landscape did not fullytranslate in streams because of fast DOC degradation withinthe groundwater and/or DOC re-adsorption processes in soilsclose to the groundwater–streams interface.
Although spatial extrapolation of quantitative informationfrom the plot scale to first-order streams in the watershedmay have generated some uncertainty, we could make a com-parison of groundwater carbon export to stream with othercarbon fluxes in the landscape. Representing 2 % of the localforest NEE, DIC and DOC exports to surface waters do notseem to be a significant component of the carbon budget atour study site. More detailed work at the land–water interfaceis necessary in order to reconcile the contradictory findingson local and global scales on the significance of hydrologicalcarbon export in the continental carbon budget.
Data availability. Bilos site (FR-BIL) is a station as part of theICOS project (https://www.icos-ri.eu/). Eddy covariance, meteoro-logical and water table depth data are measured continuously atthe Bilos pine plot. These data are available upon request to De-nis Loustau ([email protected]). River discharge data are mea-sured continuously by the French water survey agency (DIREN) and
are available at http://www.hydro.eaufrance.fr. Carbon raw data arestored on data servers and repositories and available upon requestto the corresponding author.
The Supplement related to this article is available onlineat https://doi.org/10.5194/bg-15-669-2018-supplement.
Competing interests. The authors declare that they have no conflictof interest.
Acknowledgements. This research is part of the CNP-Leyre projectfunded by the Cluster of Excellence COTE at the Université deBordeaux (ANR-10-LABX-45). We thank Luiz Carlos Cotovicz Ju-nior, Katixa Lajaunie-Salla, Baptiste Voltz, Gwenaëlle Chaillouand Damien Buquet (EPOC Bordeaux) for their assistance in thefield. We thank Pierre Anshutz (EPOC, Bordeaux), Alain Mollierand Christian Morel (ISPA INRA) for their involvement in theCNP-Leyre project, and Céline Charbonnier for alkalinity titrationsin the laboratory. Pierre Trichet (ISPA INRA) provided SOC dataat the Bilos site.
Edited by: Nobuhito OhteReviewed by: Masanori Katsuyama and one anonymous referee
References
Abril, G., Bouillon, S., Darchambeau, F., Teodoru, C. R., Mar-wick, T. R., Tamooh, F., Ochieng Omengo, F., Geeraert, N., Deir-mendjian, L., Polsenaere, P., and Borges, A. V.: Technical Note:Large overestimation of pCO2 calculated from pH and alkalinityin acidic, organic-rich freshwaters, Biogeosciences, 12, 67–78,https://doi.org/10.5194/bg-12-67-2015, 2015.
Achat, D. L., Bakker, M. R., and Trichet, P.: Rooting patterns andfine root biomass of Pinus pinaster assessed by trench wall andcore methods, J. Forest Res., 13, 165–175, 2008.
Achat, D. L., Augusto, L., Morel, C., and Bakker, M. R.: Predictingavailable phosphate ions from physical–chemical soil propertiesin acidic sandy soils under pine forests, J. Soil. Sediment, 11,452–466, 2011.
Ahuja, L. R., Ma, L., and Green, T. R.: Effective soil properties ofheterogeneous areas for modeling infiltration and redistribution,Soil Sci. Soc. Am. J., 74, 1469–1482, 2010.
Alin, S. R., de Fátima F. L. Rasera, M., Salimon, C. I., Richey,J. E., Holtgrieve, G. W., Krusche, A. V., and Snidvongs,A.: Physical controls on carbon dioxide transfer velocity andflux in low-gradient river systems and implications for re-gional carbon budgets, J. Geophys. Res.-Biogeo., 116, G01009,https://doi.org/10.1029/2010JG001398, 2011.
Alley, W. M., Healy, R. W., LaBaugh, J. W., and Reilly, T. E.: Flowand storage in groundwater systems, Science, 296, 1985–1990,2002.
Alvarez-Cobelas, M., Angeler, D. G., Sánchez-Carrillo, S., and Al-mendros, G.: A worldwide view of organic carbon export fromcatchments, Biogeochemistry, 107, 275–293, 2012.
Biogeosciences, 15, 669–691, 2018 www.biogeosciences.net/15/669/2018/
L. Deirmendjian et al.: Hydro-ecological controls on dissolved carbon dynamics in groundwater 687
Appelo, C. A. J. and Postma, D.: Geochemistry, Groundwater,and Pollution, second ed., Balkema, Rotterdam, the Netherlands,2005.
Aravena, R., Wassenaar, L. I., and Spiker, E. C.: Chemical and car-bon isotopic composition of dissolved organic carbon in a re-gional confined methanogenic aquifer, Isot. Environ. Healt. S.,40, 103–114, 2004.
Artinger, R., Buckau, G., Geyer, S., Fritz, P., Wolf, M., and Kim,J. I.: Characterization of groundwater humic substances: influ-ence of sedimentary organic carbon, Appl. Geochem. 15, 97–116, 2000.
Atkins, M. L., Santos, I. R., Ruiz-Halpern, S., and Maher, D. T.:Carbon dioxide dynamics driven by groundwater discharge in acoastal floodplain creek, J. Hydrol., 493, 30–42, 2013.
Aubinet, M., Grelle, A., Ibrom, A., Rannik, Ü., Moncrieff, J., Fo-ken, T., Kowalski, A. S., Martin, P. H., Berbigier, P., Bernhofer,C., Clement, R., Elbers, A., Granier, A., Grunwald, T., Morgen-sterm, K., Pilegaard, C., Rebmann, C., Snijders, W., Valentini,R., and Vesala, T.: Estimates of the annual net carbon and waterexchange of forests: the EUROFLUX methodology, Adv. Ecol.Res., 30, 113–175, 1999.
Augusto, L., Badeau, V., Arrouays, D., Trichet, P., Flot, J. L., Jo-livet, C., and Merzeau, D.: Caractérisation physico-chimique dessols à l’échelle d’une région naturelle à partir d’une compilationde données. Exemple des sols du massif forestier landais, Etudeet gestion des sols, 13, 7–22, 2006.
Augusto, L., Bakker, M. R., Morel, C., Meredieu, C., Trichet, P.,Badeau, V., Arrouays, D., Plassard, C., Achat, D.L., Gallet-Budynek, A., Merzeau, D., Canteloup, D., Najar, M., and Ranger,J.: Is “grey literature” a reliable source of data to characterizesoils at the scale of a region? A case study in a maritime pineforest in southwestern France, Eur. J. Soil Sci., 61, 807–822,https://doi.org/10.1111/j.1365-2389.2010.01286.x, 2010.
Baker, M. A., Valett, H. M., and Dahm, C. N.: Organic carbon sup-ply and metabolism in a shallow groundwater ecosystem, Ecol-ogy, 81, 3133–3148, 2000.
Bakker, M. R., Augusto, L., and Achat, D. L.: Fine root distributionof trees and understory in mature stands of maritime pine (Pinuspinaster) on dry and humid sites, Plant Soil, 286, 37–51, 2006.
Bakker, M. R., Jolicoeur, E., Trichet, P., Augusto, L., Plassard, C.,Guinberteau, J., and Loustau, D.: Adaptation of fine roots to an-nual fertilization and irrigation in a 13-year-old Pinus pinasterstand, Tree Physiol., 29, 229–238, 2009.
Battin, T. J., Luyssaert, S., Kaplan, L. A., Aufdenkampe, A. K.,Richter, A., and Tranvik, L. J.: The boundless carbon cycle, Nat.Geosci., 2, 598–600, 2009.
Bertran, P., Allenet, G., Gé, T., Naughton, F., Poirier, P., and Goñi,M. F. S.: Coversand and Pleistocene palaeosols in the Landesregion, southwestern France, J. Quaternary Sci., 24, 259–269,2009.
Bertran, P., Bateman, M. D., Hernandez, M., Mercier, N., Millet, D.,Sitzia, L., and Tastet, J.-P.: Inland aeolian deposits of south-westFrance: facies, stratigraphy and chronology, J. Quaternary Sci.,26, 374–388, 2011.
Billett, M. F., Palmer, S. M., Hope, D., Deacon, C., Storeton-West, R., Hargreaves, K. J., Flechard, C., and Fowler,D.: Linking land-atmosphere-stream carbon fluxes in a low-land peatland system, Global Biogeochem. Cy., 18, GB1024,https://doi.org/10.1029/2003GB002058, 2004.
Bolan, N. S., Adriano, D. C., Kunhikrishnan, A., James, T., Mc-Dowell, R., and Senesi, N.: Dissolved organic matter: biogeo-chemistry, dynamics, and environmental significance in soils,Adv. Agron., 110, 1–75, https://doi.org/10.1016/B978-0-12-385531-2.00001-3, 2011.
Bosch, J. M. and Hewlett, J. D.: A review of catchment experimentsto determine the effect of vegetation changes on water yield andevapotranspiration, J. Hydrol., 55, 3–23, 1982.
Butman, D. and Raymond, P. A.: Significant efflux of carbon diox-ide from streams and rivers in the United States, Nat. Geosci., 4,839–842, https://doi.org/10.1038/ngeo1294, 2011.
Camino-Serrano, M., Gielen, B., Luyssaert, S., Ciais, P., Vicca, S.,Guenet, B., Vos, B. D., Cools, N., Ahrens, B., Altaf Arain, M.,Borken, W., Clarke, N., Clarkson, B., Cummins, T., Don, A.,Graf Pannatier, E., Laudon, H., Moore, T., Nieminen, T., Nils-son, M. B., Peichi, M., Schwendenmann, L., Siemens, J., andJanssens, I. A.: Linking variability in soil solution dissolved or-ganic carbon to climate, soil type, and vegetation type, GlobalBiogeochem. Cy., 28, 497–509, 2014.
Chiodini, G., Frondini, F., Kerrick, D. M., Rogie, J., Parello, F.,Peruzzi, L., and Zanzari, A. R.: Quantification of deep CO2fluxes from Central Italy. Examples of carbon balance for re-gional aquifers and of soil diffuse degassing, Chem. Geol., 159,205–222, 1999.
Ciais, P., Sabine, C., Bala, G., Bopp, L., Brovkin, V., Canadell,J., Chhabra, A., DeFries, R., Galloway, J., Heimann, M., Jones,C., Le Quéré, C., Myeni, R., Piao, S., and Thornton, P.: Carbonand other biogeochemical cycles, in: Climate Change 2013: ThePhysical Science Basis. Contribution of Working Group I to theFifth Assessment Report of the Intergovernmental Panel on Cli-mate Change. Cambridge University Press, Cambridge, UK andNew York, NY, USA., 465–570, 2013.
Cole, J. J., Prairie, Y. T., Caraco, N. F., McDowell, W. H.,Tranvik, L. J., Striegl, R. G., Duarte, C. M., Kortelainen, P.,Downing, J. A., Middelburg, J. J., and Melack, J.: Plumb-ing the Global Carbon Cycle: Integrating Inland Waters intothe Terrestrial Carbon Budget, Ecosystems, 10, 171–184,https://doi.org/10.1007/s10021-006-9013-8, 2007.
Corbier, P., Karnay, G., Bourgine, B., and Saltel, M.: Gestion deseaux souterraines en région Aquitaine – Reconnaissance despotentialités aquiferes du Mio-Plio-Quaternaire des Landes deGascogne et du Médoc en relation avec les SAGE, Module 7(No. 57813), BRGM, Orléans, France, 187 pp., 2010.
Craft, J. A., Stanford, J. A., and Pusch, M.: Microbial respirationwithin a floodplain aquifer of a large gravel-bed river, FreshwaterBiol., 47, 251–261, 2002.
Datry, T., Malard, F., and Gibert, J.: Dynamics of solutes and dis-solved oxygen in shallow urban groundwater below a stormwaterinfiltration basin, Sci. Total Environ., 329, 215–229, 2004.
David, T. S., Pinto, C. A., Nadezhdina, N., Kurz-Besson, C., Hen-riques, M. O., Quilhó, T., Cermak, J., Chaves, M. M., Pereira,J. S., and David, J. S.: Root functioning, tree water use andhydraulic redistribution in Quercus suber trees: a modeling ap-proach based on root sap flow, Forest Ecol. Manag., 307, 136–146, 2013.
Davidson, E., Belk, E., and Boone, R. D.: Soil water content andtemperature as independent or confounded factors controllingsoil respiration in a temperate mixed hardwood forest, Glob.Change Biol., 4, 217–227, 1998.
www.biogeosciences.net/15/669/2018/ Biogeosciences, 15, 669–691, 2018
688 L. Deirmendjian et al.: Hydro-ecological controls on dissolved carbon dynamics in groundwater
Dawson, J. J. and Smith, P.: Carbon losses from soil and its conse-quences for land-use management, Sci. Total Environ., 382, 165–190, 2007.
Dawson, J. J. C., Billett, M. F., Neal, C., and Hill, S.: A comparisonof particulate, dissolved and gaseous carbon in two contrastingupland streams in the UK, J. Hydrol., 257, 226–246, 2002.
Deirmendjian, L. and Abril, G.: Carbon dioxide degassing at thegroundwater-stream-atmosphere interface: isotopic equilibrationand hydrological mass balance in a sandy watershed, J. Hydrol.,https://doi.org/10.1016/j.jhydrol.2018.01.003, in press, 2018.
Del Castillo, J., Comas, C., Voltas, J., and Ferrio, J. P.: Dynamics ofcompetition over water in a mixed oak-pine Mediterranean for-est: spatio-temporal and physiological components, Forest Ecol.Manag., 382, 214–224, 2016.
Domec, J.-C., King, J. S., Noormets, A., Treasure, E., Gavazzi, M.J., Sun, G., and McNulty, S. G.: Hydraulic redistribution of soilwater by roots affects whole-stand evapotranspiration and netecosystem carbon exchange, New Phytol. 187, 171–183, 2010.
Einarsdottir, K., Wallin, M. B., and Sobek, S.. High terrestrial car-bon load via groundwater to a boreal lake dominated by surfacewater inflow, J. Geophys. Res.-Biogeo., 122, 15–29, 2017.
Epron, D., Farque, L., Lucot, É., and Badot, P.-M.: Soil CO2 effluxin a beech forest: dependence on soil temperature and soil watercontent, Ann. For. Sci., 56, 221–226, 1999.
Evans, C. D., Monteith, D. T., and Cooper, D. M.: Long-termincreases in surface water dissolved organic carbon: observa-tions, possible causes and environmental impacts, Environ. Pol-lut., 137, 55–71, 2005.
Fang, W., Wei, Y., Liu, J., Kosson, D. S., van der Sloot, H. A., andZhang, P.: Effects of aerobic and anaerobic biological processeson leaching of heavy metals from soil amended with sewagesludge compost, Waste Manage., 58, 324–334, 2016.
Ferro-Vázquez, C., Nóvoa-Muñoz, J. C., Costa-Casais, M.,Klaminder, J., and Martínez-Cortizas, A.: Metal and or-ganic matter immobilization in temperate podzols: Ahigh resolution study, Geoderma, 217–218, 225–234,https://doi.org/10.1016/j.geoderma.2013.10.006, 2014.
Fiedler, S., Höll, B. S., and Jungkunst, H. F.: Discovering the im-portance of lateral CO2 transport from a temperate spruce forest,Sci. Total Environ., 368, 909–915, 2006.
Foken, T. and Wichura, B.: Tools for quality assessment of surface-based flux measurements, Agr. Forest Meteorol., 78, 83–105,1996.
Frankignoulle, M. and Borges, A. V.. Direct and Indirect pCO2Measurements in a Wide Range of pCO2 and Salinity Val-ues (The Scheldt Estuary), Aquat. Geochem., 7, 267–273,https://doi.org/10.1023/A:1015251010481, 2001.
Goldscheider, N., Hunkeler, D., and Rossi, P.: Microbial biocenosesin pristine aquifers and an assessment of investigative methods,Hydrogeol. J., 14, 926–941, 2006.
Govind, A., Bonnefond, J.-M., Kumari, J., Moisy, C., Lous-tau, D., and Wigneron, J.-P.: Modeling the ecohydrologicalprocesses in the Landes de Gascogne, SW France, in:2012 IEEE 4th International Symposium on Plant GrowthModeling, Simulation, Visualization and Applications,31 October–3 November 2012, Shangai, China, 133–140,https://doi.org/10.1109/PMA.2012.6524824, 2012.
Gran, G.: Determination of the equivalence point in potentiometrictitrations of seawater with hydrochloric acid, Oceanol. Acta, 5,209–218, 1952.
Hagerdon, F., Schleppi, P., Waldner, P., and Fluhler, H.: Export ofdissolved organic carbon and nitrogen from Gleysol dominatedcatchments–the significance of water flow paths, Biogeochem-istry, 50, 137–161, 2000.
Hall Jr., R. O., Tank, J. L., Baker, M. A., Rosi-Marshall, E. J., andHotchkiss, E. R.: Metabolism, gas exchange, and carbon spiral-ing in rivers, Ecosystems, 19, 73–86, 2016.
Heimann, M. and Reichstein, M.: Terrestrial ecosystem carbon dy-namics and climate feedbacks, Nature, 451, 289–292, 2008.
Hope, D., Billett, M. F., and Cresser, M. S.: A review of the exportof carbon in river water: fluxes and processes, Environ. Pollut.,84, 301–324, 1994.
Hotchkiss, E. R., Hall Jr., R. O., Sponseller, R. A., Butman, D.,Klaminder, J., Laudon, H., Rosvall, M., and Karlsson, J.: Sourcesof and processes controlling CO2 emissions change with the sizeof streams and rivers, Nat. Geosci., 8, 696–699, 2015.
Ibrom, A., Dellwik, E., Flyvbjerg, H., Jensen, N. O., and Pilegaard,K.: Strong low-pass filtering effects on water vapour flux mea-surements with closed-path eddy correlation systems, Agr. ForestMeteorol., 147, 140–156, 2007.
Johnson, M. S., Lehmann, J., Couto, E. G., Novaes Filho, J. P., andRiha, S. J.: DOC and DIC in flowpaths of Amazonian headwatercatchments with hydrologically contrasting soils, Biogeochem-istry, 81, 45–57, 2006.
Johnson, M. S., Lehmann, J., Riha, S. J., Krusche, A. V., Richey,J. E., Ometto, J. P. H., and Couto, E. G.: CO2 efflux fromAmazonian headwater streams represents a significant fatefor deep soil respiration, Geophys. Res. Lett., 35, L17401,https://doi.org/10.1029/2008GL034619, 2008.
Jolivet, C., Augusto, L., Trichet, P., and Arrouays, D.: Forestsoils in the Gascony Landes Region: formation, history, proper-ties and spatial varaibility, Revue forestière française, 59, 7–30,https://doi.org/10.4267/2042/8480, 2007.
Jones, J. B. and Mulholland, P. J.: Carbon dioxide variation in ahardwood forest stream: an integrative measure of whole catch-ment soil respiration, Ecosystems, 1, 183–196, 1998.
Jonsson, A., Algesten, G., Bergström, A.-K., Bishop, K., Sobek, S.,Tranvik, L. J., and Jansson, M.: Integrating aquatic carbon fluxesin a boreal catchment carbon budget, J. Hydrol., 334, 141–150,2007.
Kaimal, J. C. and Finnigan, J. J.: Atmospheric boundary layer flows:their structure and measurement, Oxford University Press, NewYork, USA, 1994.
Kaiser, K. and Guggenberger, G.: The role of DOM sorption to min-eral surfaces in the preservation of organic matter in soils, Org.Geochem., 31, 711–725, 2000.
Kaiser, K., Guggenberger, G., and Zech, W.: Sorption of DOM andDOM fractions to forest soils, Geoderma, 74, 281–303, 1996.
Kalbitz, K. and Kaiser, K.: Contribution of dissolved organic matterto carbon storage in forest mineral soils, J. Plant Nutr. Soil Sc.,171, 52–60, 2008.
Kalbitz, K., Solinger, S., Park, J.-H., Michalzik, B., and Matzner, E.:Controls on the dynamics of dissolved organic matter in soils: areview, Soil Sci. 165, 277–304, 2000.
Biogeosciences, 15, 669–691, 2018 www.biogeosciences.net/15/669/2018/
L. Deirmendjian et al.: Hydro-ecological controls on dissolved carbon dynamics in groundwater 689
Kawasaki, M., Ohte, N., and Katsuyama, M.: Biogeochemical andhydrological controls on carbon export from a forested catch-ment in central Japan, Ecol. Res., 20, 347–358, 2005.
Kessler, T. J. and Harvey, C. F.: The global flux of carbon dioxideinto groundwater, Geophys. Res. Lett., 28, 279–282, 2001.
Kindler, R., Siemens, J. A. N., Kaiser, K., Walmsley, D. C., Bern-hofer, C., Buchmann, N., Cellier, P., Eugster, W., Gleixner, G.,Grünwald, T., Heim, A., Ibrom, A., Jones, S. K., Jones, M.,Klumpp, K., Kutsch, W., Larsen, K. S., Lehuger, S., Loubet, B.,Mckenzie, R., Moors, E., Osborne, B., Pilegaard, K., Rebmann,C., Saunders, M., Schmidt, M. W. I., Schrumpf, M., Seyfferth, J.,Skiba, U., Soussana, J.-F., Sutton, M. A., Tefs, C., Vowinckel, B.,Zeeman, M. J., and Kaupenjohann, M.: Dissolved carbon leach-ing from soil is a crucial component of the net ecosystem carbonbalance, Glob. Change Biol., 17, 1167–1185, 2011.
Klein, T., Rotenberg, E., Cohen-Hilaleh, E., Raz-Yaseef, N., Tatari-nov, F., Preisler, Y., Ogée, J., Cohen, S., and Yakir, D.: Quanti-fying transpirable soil water and its relations to tree water usedynamics in a water-limited pine forest, Ecohydrology, 7, 409–419, 2014.
Kokic, J., Wallin, M. B., Chmiel, H. E., Denfeld, B. A., andSobek, S.: Carbon dioxide evasion from headwater systemsstrongly contributes to the total export of carbon from a smallboreal lake catchment, J. Geophys. Res.-Biogeo., 120, 13–28,https://doi.org/10.1002/2014JG002706, 2015.
Kowalski, S., Sartore, M., Burlett, R., Berbigier, P., and Loustau, D.:The annual carbon budget of a French pine forest (Pinus pinaster)following harvest, Glob. Change Biol., 9, 1051–1065, 2003.
Legigan, P.: L’élaboration de la formation du sable des Lan-des, dépôt résiduel de l’environnement sédimentaire pliocène-pléïstocène centre aquitain, Thèse de Doctorat d’Etat no. 642,Université de Bordeaux I, Bordeaux, France, 429 pp., 1979.
Leith, F. I., Dinsmore, K. J., Wallin, M. B., Billett, M. F., Heal,K. V., Laudon, H., Öquist, M. G., and Bishop, K.: Carbon diox-ide transport across the hillslope–riparian–stream continuum ina boreal headwater catchment, Biogeosciences, 12, 1881–1892,https://doi.org/10.5194/bg-12-1881-2015, 2015.
Lewis, E., Wallace, D., and Allison, L. J.: Program developed forCO2 system calculations, ORNL/CDIAC-105, Carbon DioxideInformation Analysis Center, Oak Ridge National Laboratory,U.S. Department of Energy, Oak Ridge, Tennessee, USA, 1998.
Lloyd, J. and Taylor, J. A.: On the temperature dependence of soilrespiration, Funct. Ecol., 8, 315–323, 1994.
Loustau, D. and Guillot, M.: Impact écologique de la tempête etconséquences sur les cycles de l’eau et du carbone, InnovationsAgronomiques, 6, 1–6, 2009.
Loustau, D., Granier, A., and El Hadj Moussa, F.: Seasonal varia-tions of sap flow in a maritime pine standard [hydraulic conduc-tance, stomatal conductance], Annales des Sciences Forestieres(France), 21, 599–618, 1990.
Lundström, U., Van Breemen, N., Bain, D. C., Van Hees, P. A.W., Giesler, R., Gustafsson, J. P., Ilvesniemi, H., Karltun, E.,Melkerud, P.-A., Olsson, M., Riise, G., Wahlberg, O., Bergelin,A., Bishop, K., Finlay, R., Jongmans, A. G., Magnusson, T.,Mannerkoski, H., Nordgren, A., Nyberg, L., Starr, M., and TauStrand, L.: Advances in understanding the podzolization processresulting from a multidisciplinary study of three coniferous for-est soils in the Nordic Countries, Geoderma, 94, 335–353, 2000.
Luyssaert, S., Ciais, P., Piao, S. L., Schulze, E.-D., Jung, M., Za-ehle, S., Schelhaas, M. J., Reichstein, M., Churkina, G., Papale,D., Abril, G., Beer, C., Grace, J., Loustau, D., Matteucci, G.,Magnani, F., Nabuurs, G. J., Verbeeck, H., Sulkava, M., Van DerWerf, G. R., Janssens, I. A., and Members Of The Carboeurope-Ip Synthesis Team: The European carbon balance. Part 3: forests,Glob. Change Biol., 16, 1429–1450, 2010.
Macdonald, M. J. and Minor, E. C.: Photochemical degradation ofdissolved organic matter from streams in the western Lake Supe-rior watershed, Aquat. Sci., 75, 509–522, 2013.
Magin, K., Somlai-Haase, C., Schäfer, R. B., and Lorke, A.:Regional-scale lateral carbon transport and CO2 evasion intemperate stream catchments, Biogeosciences, 14, 5003–5014,https://doi.org/10.5194/bg-14-5003-2017, 2017.
McClain, M. E., Boyer, E. W., Dent, C. L., Gergel, S. E., Grimm,N. B., Groffman, P. M., Hart, S. C., Harvey, J. W., Johnston, C.A., Mayorga, E., McDowell, W. H., and Pinay, G.: Biogeochem-ical hot spots and hot moments at the interface of terrestrial andaquatic ecosystems, Ecosystems, 6, 301–312, 2003.
McLaughlin, C. and Kaplan, L. A.: Biological lability of dis-solved organic carbon in stream water and contributing terrestrialsources, Freshw. Sci., 32, 1219–1230, 2013.
Mendes, M. P., Ribeiro, L., David, T. S., and Costa, A.: How depen-dent are cork oak (Quercus suber L.) woodlands on groundwater?A case study in southwestern Portugal, Forest Ecol. Manag., 378,122–130, 2016.
Michalzik, B., Kalbitz, K., Park, J.-H., Solinger, S., and Matzner,E.: Fluxes and concentrations of dissolved organic carbon andnitrogen – a synthesis for temperate forests, Biogeochemistry,52, 173–205, 2001.
Millero, F. J.: The thermodynamics of the carbonate system in sea-water, Geochim. Cosmochim. Ac., 43, 1651–1661, 1979.
Moody, C. S. and Worrall, F.: Sub-daily rates of degradation of flu-vial carbon from a peat headwater stream, Aquat. Sci., 78, 419–431, 2016.
Moreaux, V., Lamaud, É., Bosc, A., Bonnefond, J.-M., Med-lyn, B. E., and Loustau, D.: Paired comparison of water, en-ergy and carbon exchanges over two young maritime pinestands (Pinus pinaster Ait.): effects of thinning and weedingin the early stage of tree growth, Tree Physiol., 31, 903–921,https://doi.org/10.1093/treephys/tpr048, 2011.
Oki, T. and Kanae, S.: Global hydrological cycles and world waterresources, Science, 313, 1068–1072, 2006.
Olefeldt, D., Roulet, N., Giesler, R., and Persson, A.: Total wa-terborne carbon export and DOC composition from ten nestedsubarctic peatland catchments—importance of peatland cover,groundwater influence, and inter-annual variability of precipita-tion patterns, Hydrol. Process., 27, 2280–2294, 2013.
Öquist, M. G., Wallin, M., Seibert, J., Bishop, K., and Laudon, H.:Dissolved inorganic carbon export across the soil/stream inter-face and its fate in a boreal headwater stream, Environ. Sci. Tech-nol., 43, 7364–7369, 2009.
Pabich, W. J., Valiela, I., and Hemond, H. F.: Relationship betweenDOC concentration and vadose zone thickness and depth belowwater table in groundwater of Cape Cod, USA, Biogeochemistry,55, 247–268, 2001.
Polsenaere, P. and Abril, G.: Modelling CO2 degassingfrom small acidic rivers using water pCO2, DIC and
www.biogeosciences.net/15/669/2018/ Biogeosciences, 15, 669–691, 2018
690 L. Deirmendjian et al.: Hydro-ecological controls on dissolved carbon dynamics in groundwater
δ13C-DIC data, Geochim. Cosmochim. Ac., 91, 220–239,https://doi.org/10.1016/j.gca.2012.05.030, 2012.
Polsenaere, P., Savoye, N., Etcheber, H., Canton, M., Poirier, D.,Bouillon, S., and Abril, G.: Export and degassing of terrestrialcarbon through watercourses draining a temperate podzolizedcatchment, Aquat. Sci., 75, 299–319, 2013.
Querejeta, J. I., Roldán, A., Albaladejo, J., and Castillo, V.: Soil wa-ter availability improved by site preparation in a Pinus halepensisafforestation under semiarid climate, Forest Ecol. Manag., 149,115–128, 2001.
Raymond, P. A. and Saiers, J. E.: Event controlled DOC export fromforested watersheds, Biogeochemistry, 100, 197–209, 2010.
Raymond, P. A., Zappa, C. J., Butman, D., Bott, T. L., Potter, J.,Mulholland, P., Laursen, A. E., McDowell, W. H., and Newbold,D.: Scaling the gas transfer velocity and hydraulic geometry instreams and small rivers, Limnol. Oceanogr.: Fluids and Envi-ronments, 2, 41–53, 2012.
Raymond, P. A., Hartmann, J., Lauerwald, R., Sobek, S., Mc-Donald, C., Hoover, M., Butman, D., Striegl, R., Mayorga, E.,Humborg, C., Kortelainen, P., Dürr, H., Meybeck, M., Ciais, P.,and Guth, P.: Global carbon dioxide emissions from inland wa-ters, Nature, 503, 355–359, https://doi.org/10.1038/nature12760,2013.
Regnier, P., Friedlingstein, P., Ciais, P., Mackenzie, F. T., Gru-ber, N., Janssens, I. A., Laruelle, G. G., Lauerwald, R., Luys-saert, S., Andersson, A. J., Arndt, S., Arnosti, C., Borges, A.,Dale, A., Gallego-Sala, A., Goddéris, Y., Goosens, N., Hart-mann, J., Heinze, C., Ilyina, T., Joos, F., LaRowe, D., Leifeld,J., Meysman, J., Munhoven, G., Raymond, P., Spahni, R., Sun-tharalingam, P., and Thullner, M.: Anthropogenic perturbation ofthe carbon fluxes from land to ocean, Nat. Geosci., 6, 597–607,2013.
Reichstein, M., Falge, E., Baldocchi, D., Papale, D., Aubinet,M., Berbigier, P., Bernhofer, C., Buchmann, N., Gilmanov, T.,Granier, A., Grünwald, T., Havránková, K., Ilvesniemi, H.,Janous, D., Knohl, A., Laurila, T., Lohila, A., Loustau, D., Mat-teucci, G., Meyers, T., Miglietta, F., Ourcival, J.-M., Pumpanen,J., Rambal, S., Rotenberg, E., Sanz, M., Tenhunen, J., Seufert, G.,Vaccari, F., Vesala, T., Yakir, D., and Valentini, R.: On the separa-tion of net ecosystem exchange into assimilation and ecosystemrespiration: review and improved algorithm, Glob. Change Biol.,11, 1424–1439, 2005.
Reth, S., Reichstein, M., and Falge, E.: The effect of soil water con-tent, soil temperature, soil pH-value and the root mass on soilCO2 efflux – A modified model, Plant Soil, 268, 21–33, 2005.
Roberts, B. J., Mulholland, P. J., and Hill, W. R.: Multiple scales oftemporal variability in ecosystem metabolism rates: results from2 years of continuous monitoring in a forested headwater stream,Ecosystems, 10, 588–606, 2007.
Sadat-Noori, M., Maher, D. T., and Santos, I. R.: Groundwater dis-charge as a source of dissolved carbon and greenhouse gases ina subtropical estuary, Estuar. Coast., 39, 639–656, 2016.
Sanderman, J. and Amundson, R.: A comparative study of dissolvedorganic carbon transport and stabilization in California forest andgrassland soils, Biogeochemistry, 92, 41–59, 2009.
Santos, I. R., Maher, D. T., and Eyre, B. D.: Coupling automatedradon and carbon dioxide measurements in coastal waters, Envi-ron. Sci. Technol., 46, 7685–7691, 2012.
Sauer, D., Sponagel, H., Sommer, M., Giani, L., Jahn, R., and Stahr,K.: Podzol: Soil of the year 2007. A review on its genesis, occur-rence, and functions, J. Plant Nutr. Soil Sc., 170, 581–597, 2007.
Schiff, S. L., Aravena, R., Trumbore, S. E., Hinton, M. J., Elgood,R., and Dillon, P. J.: Export of DOC from forested catchments onthe Precambrian Shield of Central Ontario: clues from 13C and14C, Biogeochemistry, 36, 43–65, 1997.
Schimel, D. S., House, J. I., Hibbard, K. A., Bousquet, P., Ciais,P., Peylin, P., Braswell, B. H., Apps, M. J., Baker, D., and Bon-deau, A.: Recent patterns and mechanisms of carbon exchangeby terrestrial ecosystems, Nature, 414, 169–172, 2001.
Sharp, E. L., Jarvis, P., Parsons, S. A., and Jefferson, B.: Impactof fractional character on the coagulation of NOM, Colloid. Sur-face. A, 286, 104–111, 2006.
Shen, Y., Chapelle, F. H., Strom, E. W., and Benner, R.: Originsand bioavailability of dissolved organic matter in groundwater,Biogeochemistry, 122, 61–78, 2015.
Shibata, H., Mitsuhashi, H., Miyake, Y., and Nakano, S.: Dissolvedand particulate carbon dynamics in a cool-temperate forestedbasin in northern Japan, Hydrol. Process., 15, 1817–1828, 2001.
Shibata, H., Hiura, T., Tanaka, Y., Takagi, K., and Koike, T.: Carboncycling and budget in a forested basin of southwestern Hokkaido,northern Japan, Ecol. Res., 20, 325–331, 2005.
Stets, E. G., Striegl, R. G., Aiken, G. R., Rosenberry, D. O., andWinter, T. C.: Hydrologic support of carbon dioxide flux revealedby whole-lake carbon budgets, J. Geophys. Res.-Biogeo., 114,G01008, https://doi.org/10.1029/2008JG000783, 2009.
Striegl, R. G., Aiken, G. R., Dornblaser, M. M., Raymond,P. A., and Wickland, K. P.: A decrease in discharge-normalized DOC export by the Yukon River during sum-mer through autumn, Geophys. Res. Lett., 32, L21413,https://doi.org/10.1029/2005GL024413, 2005.
Sun, G., Riekerk, H., and Kornhak, L. V.: Ground-water-table riseafter forest harvesting on cypress-pine flatwoods in Florida, Wet-lands, 20, 101–112, 2000.
Thivolle-Cazat, A. and Najar, M.: Évolution de la productivité et dela récolte du pin maritime dans le massif Landais. Evaluation dela disponibilité future en Gironde, Revue forestière française, 53,351–355, 2001.
Thornthwaite, C. W.: An approach toward a rational classificationof climate, Geogr. Rev., 38, 55–94, 1948.
Tsypin, M. and Macpherson, G. L.: The effect of precipitationevents on inorganic carbon in soil and shallow groundwater,Konza Prairie LTER Site, NE Kansas, USA, Appl. Geochem.,27, 2356–2369, 2012.
Venkiteswaran, J. J., Schiff, S. L., and Wallin, M. B.:Large Carbon Dioxide Fluxes from Headwater Bo-real and Sub-Boreal Streams, PLoS ONE, 9, e101756,https://doi.org/10.1371/journal.pone.0101756, 2014.
Vernier, F. and Castro, A.: Critère “Préservation del’environnement”, sous-critère “Eau”, Rapport d’expert dans lecadre de l’expertise sur l’avenir du massif forestier des Landesde Gascogne: GIP ECOFOR, Bordeaux, France, 39 pp., 2010.
Vincke, C. and Thiry, Y.: Water table is a relevant source for wa-ter uptake by a Scots pine (Pinus sylvestris L.) stand: Evidencesfrom continuous evapotranspiration and water table monitoring,Agr. Forest Meteorol., 148, 1419–1432, 2008.
Biogeosciences, 15, 669–691, 2018 www.biogeosciences.net/15/669/2018/
L. Deirmendjian et al.: Hydro-ecological controls on dissolved carbon dynamics in groundwater 691
Vissers, M. J. and van der Perk, M.: The stability of groundwaterflow systems in unconfined sandy aquifers in the Netherlands, J.Hydrol., 348, 292–304, 2008.
Wallin, M. B., Grabs, T., Buffam, I., Laudon, H., Ågren, A., Öquist,M. G., and Bishop, K.: Evasion of CO2 from streams – Thedominant component of the carbon export through the aquaticconduit in a boreal landscape, Glob. Change Biol., 19, 785–797,https://doi.org/10.1111/gcb.12083, 2013.
Warren, J. M., Meinzer, F. C., Brooks, J. R., and Domec, J. C.: Ver-tical stratification of soil water storage and release dynamics inPacific Northwest coniferous forests, Agr. Forest Meteorol., 130,39–58, 2005.
Weiss, R.: Carbon dioxide in water and seawater: the solubility of anon-ideal gas, Mar. Chem., 2, 203–215, 1974.
Wilson, H. F., Saiers, J. E., Raymond, P. A., and Sobczak, W. V.:Hydrologic drivers and seasonality of dissolved organic carbonconcentration, nitrogen content, bioavailability, and export in aforested New England stream, Ecosystems, 16, 604–616, 2013.
Xu, Y.-J., Burger, J. A., Aust, W. M., Patterson, S. C., Miwa, M.,and Preston, D. P.: Changes in surface water table depth and soilphysical properties after harvest and establishment of loblollypine (Pinus taeda L.) in Atlantic coastal plain wetlands of SouthCarolina, Soil Till. Res., 63, 109–121, 2002.
www.biogeosciences.net/15/669/2018/ Biogeosciences, 15, 669–691, 2018

Reproduced with permission of copyright owner. Further reproductionprohibited without permission.