Embed Size (px)
Citation preview
Hydrologic and Geomorphic Characteristics of the
Bill Williams River, Arizona
by P. Kyle House, Michelle Lee Wood and Philip A. Pearthree
Arizona Geological Survey Open-File Report 99-4
February, 1999
Arizona Geological Survey
416 W. Congress, Suite #100, Tucson, AZ 85701
Includes 46 page text and two 1,'24,000 scale maps in pocket
Investigations funded by the Arizona State Land Department and the Arizona Geological Survey; done in cooperation with SFC Engineering Company
This report is preliminary and has not been edited or reviewed for conformity with Arizona Geological Survey standards

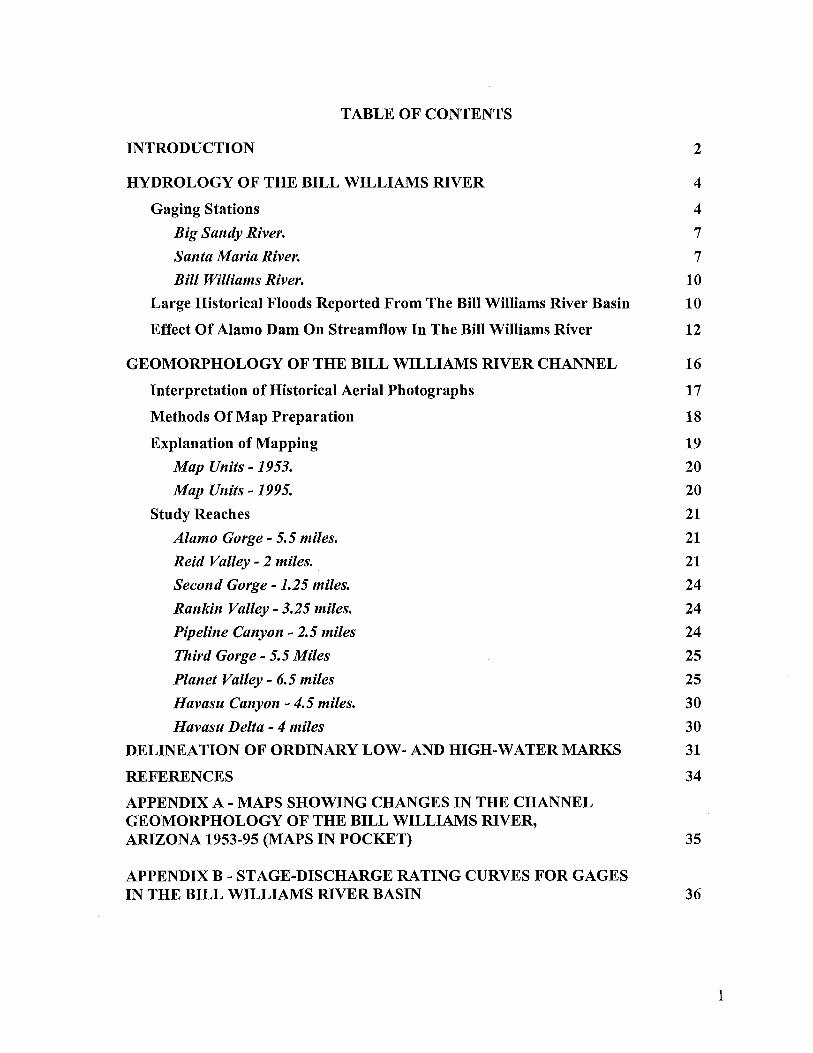
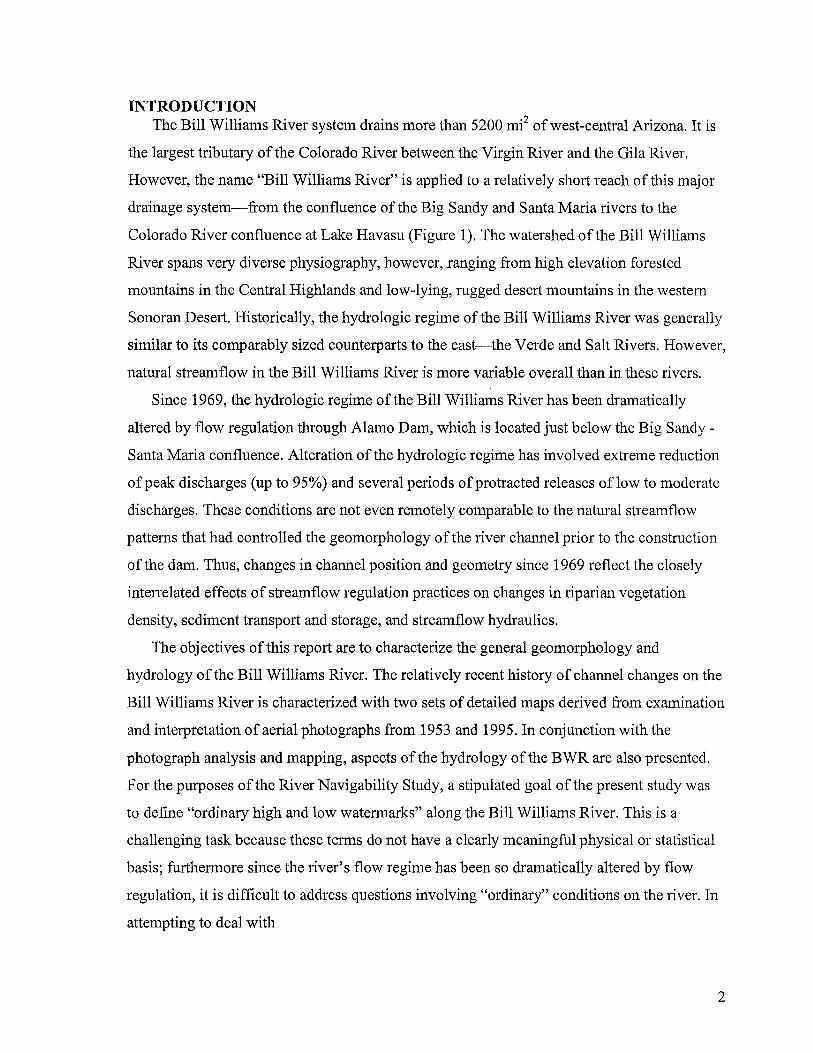
TABLE OF CONTENTS
INTRODUCTION 2
HYDROLOGY OF THE BILL WILLIAMS RIVER 4
Gaging Stations 4
Big Sandy River. 7
Santa Maria River. 7
Bill Williams River. 10
Large Historical Floods Reported From The Bill Williams River Basin 10
Effect Of Alamo Dam On Streamflow In The Bill Williams River 12
GEOMORPHOLOGY OF THE BILL WILLIAMS RIVER CHANNEL 16
Interpretation of Historical Aerial Photographs 17
Methods Of Map Preparation 18
Explanation of Mapping 19
Map Units -1953. 20
Map Units -1995. 20
Study Reaches 21
Alamo Gorge - 5.5 miles. 21
Reid Valley - 2 miles. 21
Second Gorge - 1.25 miles. 24
Rankin Valley - 3.25 miles. 24
Pipeline Canyon - 2.5 miles 24
Third Gorge - 5.5 Miles 25
Planet Valley - 6.5 miles 25
Havasu Canyon - 4.5 miles. 30
Havasu Delta - 4 miles 30
DELINEATION OF ORDINARY LOW- AND HIGH-WATER MARKS 31
REFERENCES 34
APPENDIX A - MAPS SHOWING CHANGES IN THE CHANNEL GEOMORPHOLOGY OF THE BILL WILLIAMS RIVER, ARIZONA 1953-95 (MAPS IN POCKET) 35
APPENDIX B - STAGE-DISCHARGE RATING CURVES FOR GAGES IN THE BILL WILLIAMS RIVER BASIN 36
1

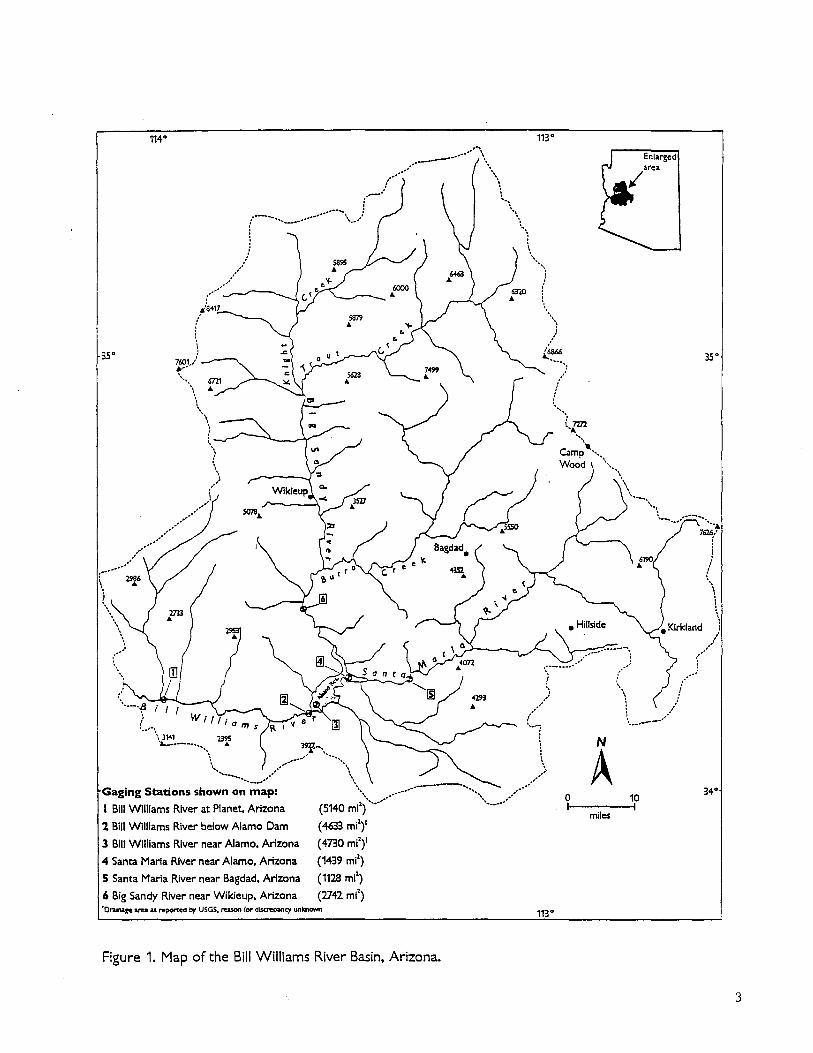
INTRODUCTION The Bill Williams River system drains more than 5200 mi2 of west-central Arizona. It is
the largest tributary of the Colorado River between the Virgin River and the Gila River.
However, the name "Bill Williams River" is applied to a relatively short reach of this major
drainage system-from the confluence of the Big Sandy and Santa Maria rivers to the
Colorado River confluence at Lake Havasu (Figure 1). The watershed ofthe Bill Williams
River spans very diverse physiography, however, ranging from high elevation forested
mountains in the Central Highlands and low-lying, rugged desert mountains in the western
Sonoran Desert. Historically, the hydrologic regime of the Bill Williams River was generally
similar to its comparably sized counterparts to the east-the Verde and Salt Rivers. However,
natural streamflow in the Bill Williams River is more variable overall than in these rivers.
Since 1969, the hydrologic regime of the Bill Williams River has been dramatically
altered by flow regulation through Alamo Dam, which is located just below the Big Sandy
Santa Maria confluence. Alteration of the hydrologic regime has involved extreme reduction
of peak discharges (up to 95%) and several periods of protracted releases oflow to moderate
discharges. These conditions are not even remotely comparable to the natural streamflow
patterns that had controlled the geomorphology of the river channel prior to the construction
of the dam. Thus, changes in channel position and geometry since 1969 reflect the closely
interrelated effects of streamflow regulation practices on changes in riparian vegetation
density, sediment transport and storage, and streamflow hydraulics.
The objectives of this report are to characterize the general geomorphology and
hydrology of the Bill Williams River. The relatively recent history of channel changes on the
Bill Williams River is characterized with two sets of detailed maps derived from examination
and interpretation of aerial photographs from 1953 and 1995. In conjunction with the
photograph analysis and mapping, aspects of the hydrology of the BWR are also presented.
For the purposes of the River Navigability Study, a stipulated goal of the present study was
to define "ordinary high and low watermarks" along the Bill Williams River. This is a
challenging task because these terms do not have a clearly meaningful physical or statistical
basis; furthermore since the river's flow regime has been so dramatically altered by flow
regulation, it is difficult to address questions involving "ordinary" conditions on the river. In
attempting to deal with
2
35°
:' \'-".{J
l ""\31<4,
~--"'\" 233,;i 39ll-\ "" ....... -_ .. ,'" ............... \,
........ _ .. --.. .... _ ..... ,.. ,
Gaging Stations shown on map: \" I Bill Williams River at Planet, Arizona (5140 mil;·.~.····· 1 Bill Williams River below Alamo Dam (4633 mil)1
3 Bill Williams River near Alamo. Arizona (4730 mil)1
4 Santa Maria River near Alamo. Arizona (1439 mil)
5 Santa Marla River near Bagdad. Arizona (1128 mil)
6 Big Sandy River near Wikieup. Arizona (2742 mil) 'O ...... &e ."'" as reponed by USGS. reason for disa'epancy unlcnawn
Figure 1. Map of the Bill Williams River Basin. Arizona.
o I
miles
10 I
35°
34°
3
these issues, our approach was to delineate boundaries of the high and low flow channels in
the pre-dam and post-dam periods from the basis of the earliest and most recent available
aerial photographs. The mapping approach that has been adopted results in a characterization
of the geomorphology of the river from which the spatial distribution of ordinary high and
low watermarks, however defined, should be obtainable.
HYDROLOGY OF THE BILL WILLIAMS RIVER
The Bill Williams River (BWR) begins at the confluence of the Big Sandy and Santa
Maria rivers. Prior to the construction of Alamo Dam, this junction was located in a wide
alluvial valley that is currently occupied by Alamo Reservoir. Consequently, the BWR now
begins at the base of the dam. The river flows for approximately 35 miles through a series of
canyons and alluvial valleys before it terminates as a delta in Lake Havasu near the U.S.
Highway 95 bridge crossing.
At the site of Alamo Dam, the contributing drainage area to the BWR is approximately
4330 mi2. The Big Sandy River basin constitutes 65% (~2810 mi2
) of this area, and the Santa
Maria River basin constitutes the remaining 35% (~1520 mi2). At its mouth, the BWR drains
an estimated 5200 mi2, which makes it slightly larger than the Salt River drainage area above
Roosevelt Lake and only slightly smaller than the Verde River drainage area above
Horseshoe Reservoir. These general physiographic similarities are underscored by the pre
dam record of flooding on the BWR. Several of the largest reported historical peaks on the
BWR are larger than the largest peaks reported for the Salt and the Verde rivers. However, it
is not clear that the earliest and largest estimates are particularly well substantiated.
Gaging Stations
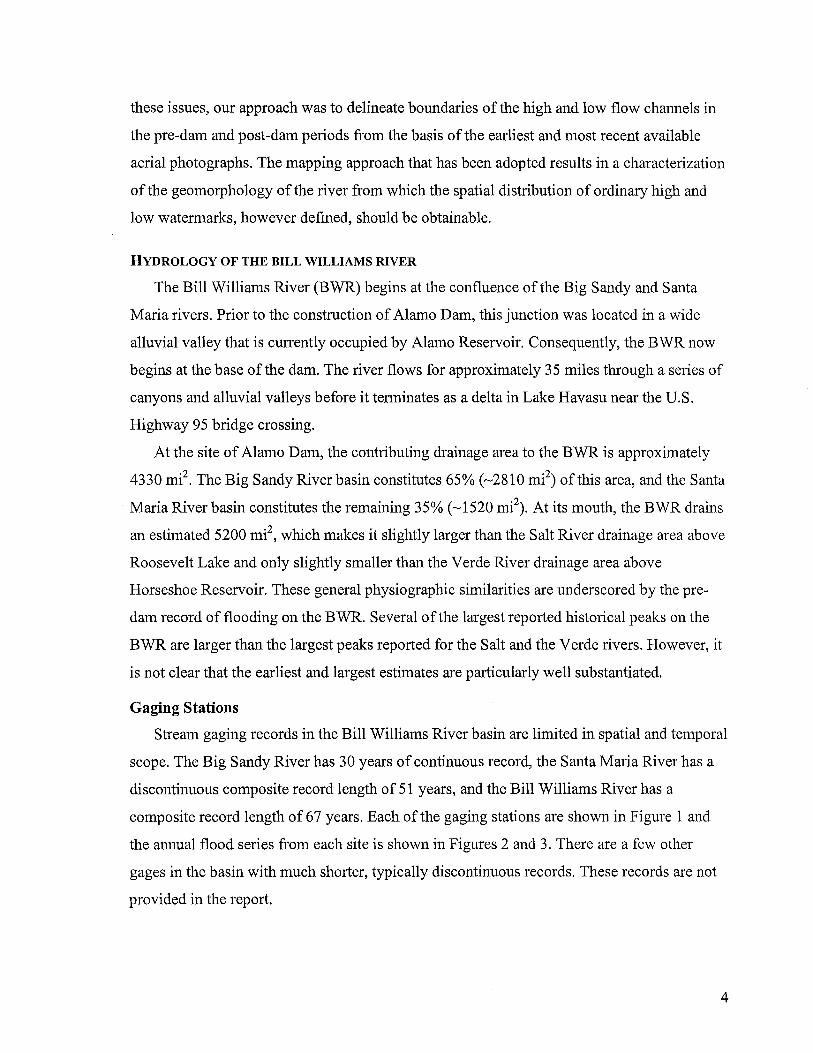
Stream gaging records in the Bill Williams River basin are limited in spatial and temporal
scope. The Big Sandy River has 30 years of continuous record, the Santa Maria River has a
discontinuous composite record length of 51 years, and the Bill Williams River has a
composite record length of 67 years. Each of the gaging stations are shown in Figure 1 and
the annual flood series from each site is shown in Figures 2 and 3. There are a few other
gages in the basin with much shorter, typically discontinuous records. These records are not
provided in the report.
4
120,000 ~,------------------------------Big Sandy River near Wikieup 1966-1995
100,000 +
'7", I 1: 80,000 t
o.f t:O I CO
.J::. 60,000 t u '" ! B
40,000 + ~ co
c£ I i
20,000 + I I
0 ..... I() 0) 0) to to ..... .....
35,000 B
30,000
":'",
. 25,000 1: o.i t:O 20,000 co
.J::. u '" 15,000 ., B ~ I CO
~ 10,000 T I I
I 5,000 T
0 ..... I() 0) 0) to to ... ...
1939: Flood estimate from 'near Signal'
0) C"') ,... ..... I() 0) C"') ,... ..... 0) 0 0 ... ..... ... ('II ('II C"') to 0) 0) 0) 0) 0) 0) 0) 0) ..... ..... ..... ..... ..... ... ..... ..... .....
Water Year
Santa Maria River near Alamo (1939-1966) / near Bagdad (1967-1985; 1989-1995)
0) C"') ,... ... I() 0) C"') ,... ... I() 0) C"') ,... 0) 0 0 ... ... ... ('II ('II C"') C"') C"') '<I' '<I' to 0) 0) 0) 0) 0) 0) 0) 0) 0) 0) 0) 0) ... ... ... ... ... ... ..... ... ... ... ... ... ...
Water Year
... I() 0) ...
I() 0) C"') ,... ..... I() I() <0 <0 ,... 0) 0) 0) 0) 0) ..... ..... ..... ..... .....
Figure 2. Annual flood series for the major tributaries to the Bill Williams River
5
r.-n" , J I() 0) C"') ,... ..... I() ,... .,... to to 0) 0) 0) 0) 0) 0) 0) 0) ..... ..... ..... ..... ..... .....
200,000
180,000
':'11) 160,000
"'.;I:: 140,000 U
120,000 tc "' ..r:: 100,000 u II)
B 80,000 ~.
"' ~ 60,000
40,000
20,000
0
100,000
':'11)
'¢! 80,000
U tc 60,000 "' .s=. u II)
B 40,000 ~
"' ~ 20,000
0
AJ Bill Williams River near Alamo (1937-1968) / below Alamo Dam (1968-1995) 1891, 1916. 1927: Flood estimates from "Striped Canyon"
--
-
-
. hl. 11 ... 1111 II • I "i , , . , . " , .",."",!,. ,j '" ,""" ' '."'" .
.... 10 c» CI'l ,.... .... 10 c» CI'l ,.... .... 10 c» CI'l ,.... .... 10 c» CI'l ,.... .... 10 c» CI'l c» c» c» 0 0 .... .... .... N N CI'l CI'l CI'l ..r ..r 10 10 10 CD CD ,.... ,.... ,.... co co co co c» c» c» c» c» c» c» c» c» c» c» c» c» c» c» c» c» c» c» c» c» .... .... .... .... .... .... .... .... .... .... .... .... .... .... .... .... .... .... .... .... .... .... .... ....
Water Year
[[J Bill Williams River at Planet 1929-1946
-;-
.... 10 c» CI'l ,.... .... 10 c» CI'l ,.... .... 10 c» CI'l ,.... .... 10 c» CI'l c» c» c» 0 0 .... .... .... N N CI'l CI'l CI'l ..r ..r 10 10 10 CD co co co c» c» c» c» c» c» 0) 0) 0) 0) 0) 0) 0) 0) 0) 0) .... .... .... .... .... .... .... .... .... .... .... .... .... .... .... .... .... .... ....
Water Year
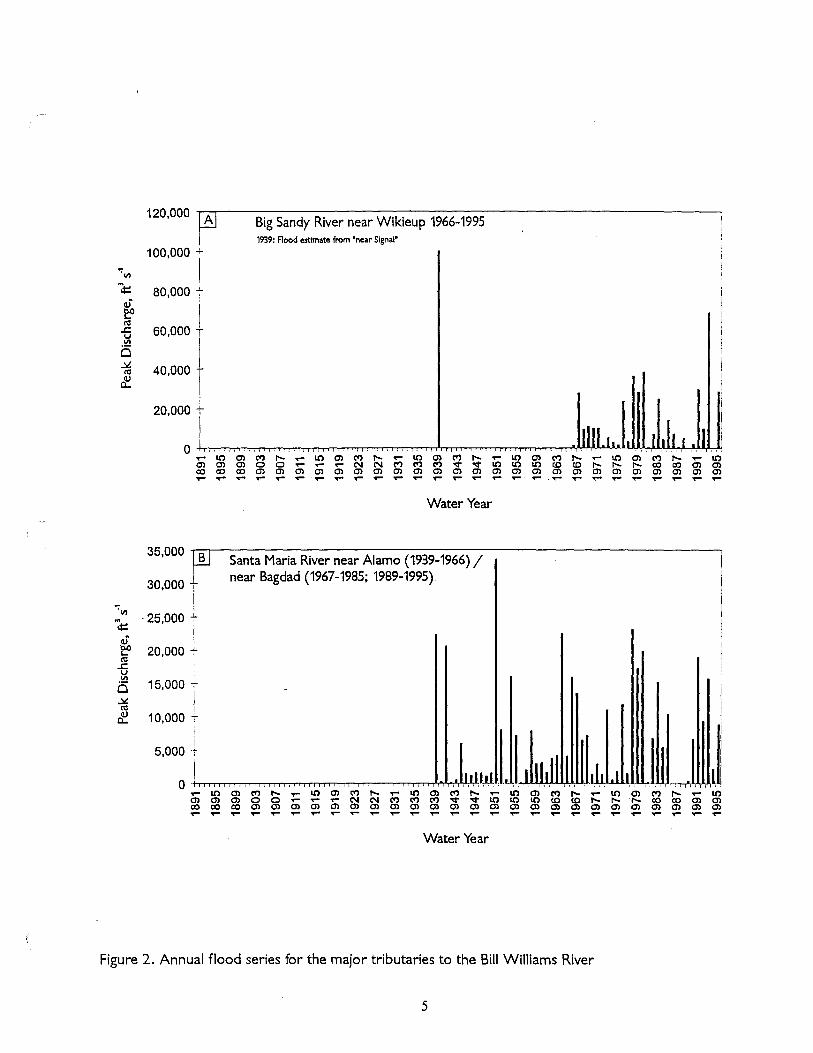
Figure 3. Annual flood series for the stream gages on the Bill Williams River
6
! I I
.1 II "" I ,.... .... 10
co c» c» c» c» c» .... .... ....
Big Sandy River.
The Big Sandy River is the predominant contributor to most streamflows on the Bill
Williams River. It begins at the confluence of Trout and Knight Creeks approximately 30
miles southwest of Kingman, Arizona. The Big Sandy watershed encompasses most of the
eastern half of the Hualapai Mountains from which runoff is received through many small
tributaries. The most significant contribution of runoff comes from streams at the north end
and along the east side of the Big Sandy Valley (e.g. Knight Creek, Trout Creek, and Burro
Creek) where the basin encompasses a large portion of the high, rugged, and massive Mohon
Mountains, Bozarth Mesa, Aquarius Mountains, and Aquarius Cliffs.
The Big Sandy River gaging station--Big Sandy River near Wikieup, Arizona--is actually
located near the old townsite of Signal, Arizona about 30 miles south of Wikieup and
approximately 15 miles upstream ofthe confluence with the Santa Maria. At the gage, the
Big Sandy River drains 2810 mi2• The official period of record is 1966-1996. The flood of
record is 68,700 cfs, which was recorded on February 9, 1993. Much ofthis runoff came
from the Burro Creek watershed; a peak flood discharge estimated at 55,300 cfs occurred
near the mouth of Burro Creek 3 hours prior to the peak discharge on Big Sandy River. The
confluence of the Big Sandy and Burro Creek is 7 miles upstream ofthe gaging station.
The annual flood series for the Big Sandy River is shown in Figure 2a. The continuous
record is from 1966 to the present, and there is one particularly notable historical discharge
estimate of 100,000 cfs reported from "near Signal" in September, 1939 (Smith and Heckler,
1955). This site is quite close to the present site of the gaging station. No attempt was made
to assess the veracity of this extraordinary discharge estimate for the purposes of this report.
It is, however, probably best viewed as a maximum estimate. Descriptive statistics for this
stream gage are listed in Table 1.
Santa Maria River.
The Santa Maria River drains approximately 1520 me of rugged but generally lower
lying and more arid terrain than is characteristic of much of the Big Sandy River watershed.
There have been two different gaging stations on the Santa Maria River, and the composite
period of record is 1939 to the present. The flood of record is 33,600 cfs (at the gage near
Alamo), which occurred in August 1951. The station "Santa Maria River near Alamo" was
7
moved upstream to the station "Santa Maria River near Bagdad" in 1967 so as to eliminate
the influence of inundation and backwater effects from Alamo Lake. The resultant decrease
in the contributing drainage area was 311 me. The location change had a marked effect on
the daily flow characteristics of the river. The station near Alamo has a 27 year record (1939-
1966) and recorded no days of zero flow (although there are 396 missing values). The
discontinuous record for the station near Bagdad is also 27 years long and recorded 6474
days of zero flow (only 382 missing values). This means that for approximately 65% of the
9662 days in the record, there was no streamflow at the gage. Some descriptive statistics of
the daily streamflow records are summarized in Table 1.
8
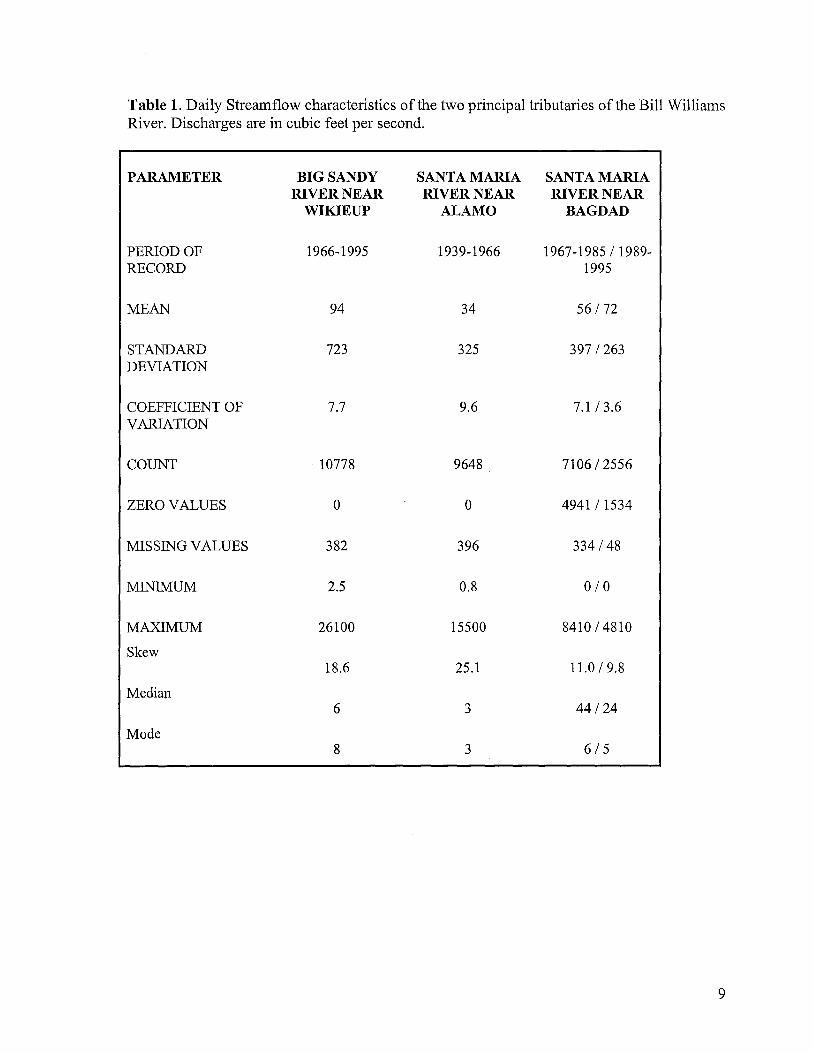
Table 1. Daily Streamflow characteristics of the two principal tributaries of the Bill Williams River. Discharges are in cubic feet per second.
PARAMETER BIG SANDY SANTAMARIA SANTAMARIA RIVER NEAR RIVER NEAR RIVER NEAR
WIKIEUP ALAMO BAGDAD
PERIOD OF 1966-1995 1939-1966 1967-1985/1989-RECORD 1995
MEAN 94 34 56/72
STANDARD 723 325 397/263 DEVIATION
COEFFICIENT OF 7.7 9.6 7.1/3.6 VARIATION
COUNT 10778 9648 7106/2556
ZERO VALVES 0 0 4941/1534
MISSING VALVES 382 396 334/48
MINIMUM 2.5 0.8 0/0
MAXIMUM 26100 15500 8410/4810
Skew 18.6 25.1 11.0/9.8
Median 6 3 44/24
Mode 8 3 6/5
9
Bill Williams River.
There have been two primary gaging stations on the Bill Williams River. Over time, the
history of the gages has become somewhat obscured and discharge values reported for some
gages in relatively recent literature are not necessarily representative of what occurred at the
gage in question. For example, the earliest gaging stations on the BWR were "Bill Williams
River near Swansea (1913-1915), followed by "Williams River near Swansea" (1913-1915),
"Williams River at Planet" (1928-1943), and finally "Bill Williams River near Planet" (1943-
1946). Examination of historical surface water records indicates that each of these
corresponds to the same station (indicated by the number 1 on the map in Figure 1). Listed in
the station record for the Bill Williams River near Planet are three exceptionally large floods
in 1891, 1916, and 1927. According to Patterson and Somers (1960), these values are
estimates made "on the basis of flo 0 dmarks in Striped Canyon, about 23 miles upstream".
This site is very near the present location of Alamo Dam and thus accounts for a difference in
drainage area from the gage near Planet of approximately 500 mi2• This 23 mile stretch also
includes several wide alluvial reaches that would undoubtedly involve attenuation of the peak
from the upper gorge. Thus these estimates relate more directly to the Alamo gage site, and
not the Planet gage site. This is how the data are depicted in Fig. 3a.
In 1939, a gage on the Bill Williams River was established near Alamo, Arizona.
Patterson and Somers report a flood stage estimate from this site for a large flood in 1937,
but the continuous record begins in 1940. The 1937 stage estimate has subsequently been
reported as a discharge value by Garrett and Gellenbeck (1991). This value is shown on the
plot in Figure 3b. In 1968, the gage was moved to a point just below Alamo Dam.
Large Historical Floods Reported From The Bill Williams River Basin
As was noted previously the pre-dam flood history of the Bill Williams River rivals that
of the Salt and Verde Rivers in terms of the reported peak discharge magnitudes. However,
some of the earliest estimates are not particularly well substantiated. Clearly, though, the
floods were large. For example, the reported magnitude of the February 1891 flood is
200,000 cfs, making it the largest reported flood discharge from a basin of approximately
5000 me in the lower Colorado River basin. Unfortunately, original field notes and U.S.
Geological Survey memos regarding these particularly outstanding estimates could not be
obtained during the preparation of this report. Some anomalies in the various flood series of
10
the Bill Williams that are apparent from the published information include:
1. A progressive decrease in the reported discharges oflarge floods between 1891 and
the construction of the dam. This trend is particularly obvious in the early part of the
century.
2. Large floods originally reported only as gage heights were reported as peak
discharges in subsequent reports with minimal or no qualification.
3. Reported flood dates originally qualified with terms like "probably" were reported as
matter-of-fact in subsequent reports.
4. Reports of discharges that were made at a point 23 miles upstream from the gage in
question constituting a 500 mi2 difference in the contributing drainage area.
Given these factors and in absence of follow-up studies on the outstanding historical
flood discharge estimates, it is prudent to treat these values as likely maximum discharges for
the floods in question.
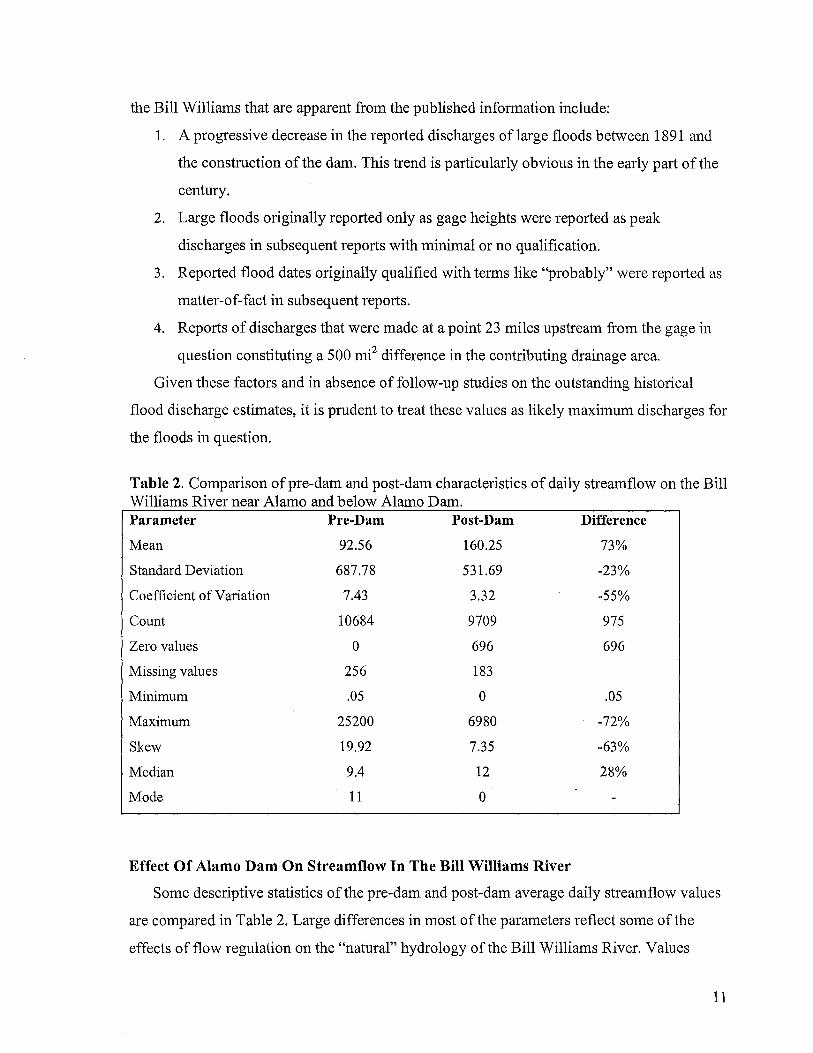
Table 2. Comparison of pre-dam and post-dam characteristics of daily streamflow on the Bill Williams River near Alamo and below Alamo Dam. Parameter Pre-Dam Post-Dam Difference
Mean 92.56 160.25 73%
Standard Deviation 687.78 531.69 -23%
Coefficient of Variation 7.43 3.32 -55%
Count 10684 9709 975
Zero values 0 696 696
Missing values 256 183
Minimum .05 0 .05
Maximum 25200 6980 -72%
Skew 19.92 7.35 -63%
Median 9.4 12 28%
Mode 11 0
Effect Of Alamo Dam On Streamflow In The Bill Williams River
Some descriptive statistics of the pre-dam and post-dam average daily streamflow values
are compared in Table 2. Large differences in most of the parameters reflect some of the
effects of flow regulation on the "natural" hydrology of the Bill Williams River. Values
11
expressed as percentages indicate change in the stated variable from pre-dam to post-dam
conditions. For the most part these changes record the influence of the flow regulation at the
dam but secular climatic variability probably has affected some of the variables as well.
Streamflow variability has been reduced by the dam, which is not surprising.
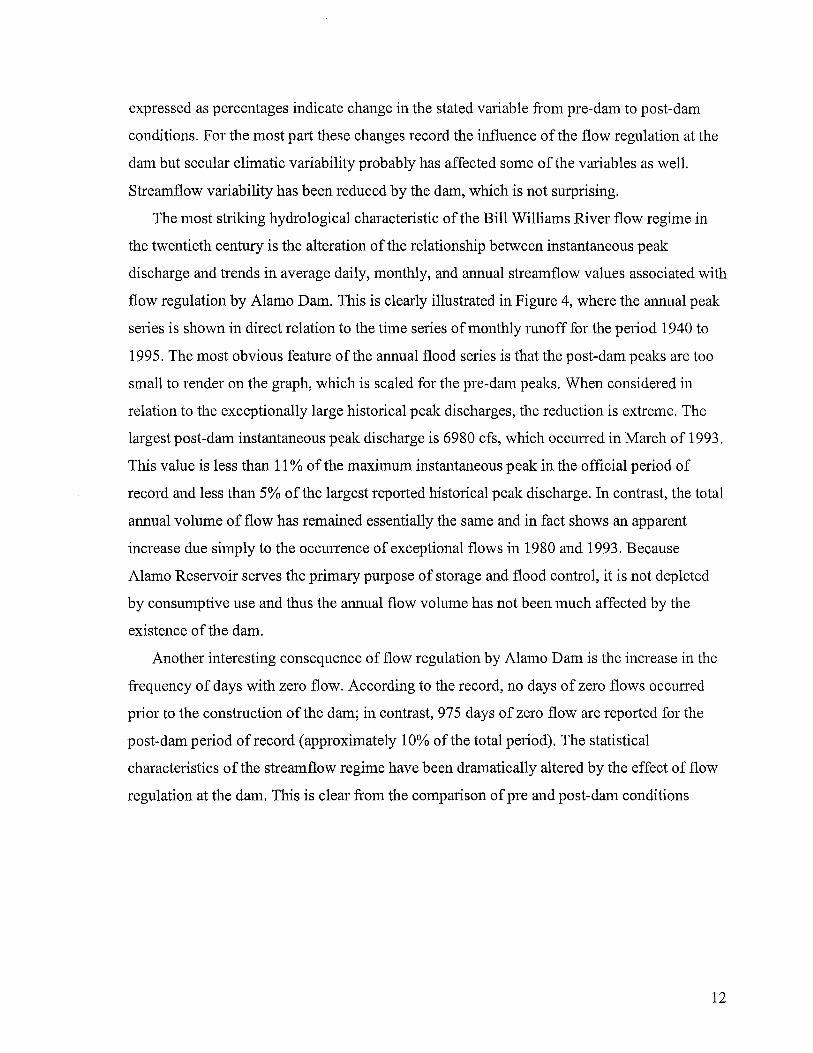
The most striking hydrological characteristic of the Bill Williams River flow regime in
the twentieth century is the alteration of the relationship between instantaneous peak
discharge and trends in average daily, monthly, and annual streamflow values associated with
flow regulation by Alamo Dam. This is clearly illustrated in Figure 4, where the annual peak
series is shown in direct relation to the time series of monthly runoff for the period 1940 to
1995. The most obvious feature of the annual flood series is that the post-dam peaks are too
small to render on the graph, which is scaled for the pre-dam peaks. When considered in
relation to the exceptionally large historical peak discharges, the reduction is extreme. The
largest post-dam instantaneous peak discharge is 6980 cfs, which occurred in March of 1993.
This value is less than 11 % of the maximum instantaneous peak in the official period of
record and less than 5% of the largest reported historical peak discharge. In contrast, the total
annual volume of flow has remained essentially the same and in fact shows an apparent
increase due simply to the occurrence of exceptional flows in 1980 and 1993. Because
Alamo Reservoir serves the primary purpose of storage and flood control, it is not depleted
by consumptive use and thus the annual flow volume has not been much affected by the
existence of the dam.
Another interesting consequence of flow regulation by Alamo Dam is the increase in the
frequency of days with zero flow. According to the record, no days of zero flows occurred
prior to the construction of the dam; in contrast, 975 days of zero flow are reported for the
post-dam period of record (approximately 10% of the total period). The statistical
characteristics of the streamflow regime have been dramatically altered by the effect of flow
regulation at the dam. This is clear from the comparison of pre and post-dam conditions
12
~ I '11'1 80,000 -l-.
~ I ~ 60,000 T I-(13
..c u 40,000 T 11'1
(5 I ~
20,000 -t (13
cf: t i, I'
140,000 I- Bill Williams River near Alamo:
120,000 I-
';"11'1 100,000 I-
~
~ 80,000 lt;: E (13
e ..... VI
60,000 I-
40,000 I-
total monthly flow volume 1940-1995
I
I I I Flow regulation by 1/ Alamo Dam begins
I . . I I I I I I I I I 20,000 -
o l ..1 I 1 I I I. ~ I I I l ~~ I I Il l I i ~ ~u .11
Water Year
Figure 4. Comparison of total monthly flow and instantaneous peak discharges reported from the Bill Williams gage near Alamo (1940-1968) and below Alamo Dam (1969-1995). .
co co a-. .....
13
;i
70,000 -r------------------......, Bill Williams River: Duration - Frequency Analysis
60,000
50,000 -~ u a.i l:" 40,000 n:s
...c: u III
~ 30,000 Post-dam
°cu o
20,000
10,000 -f-"'<------ Maximum post-dam flow (regulated) ----I
o-~------------~--~----------------~ o 20 40 60 80 100 120 140 160 180 200
Recurrence Interval (1 .;. probability), years
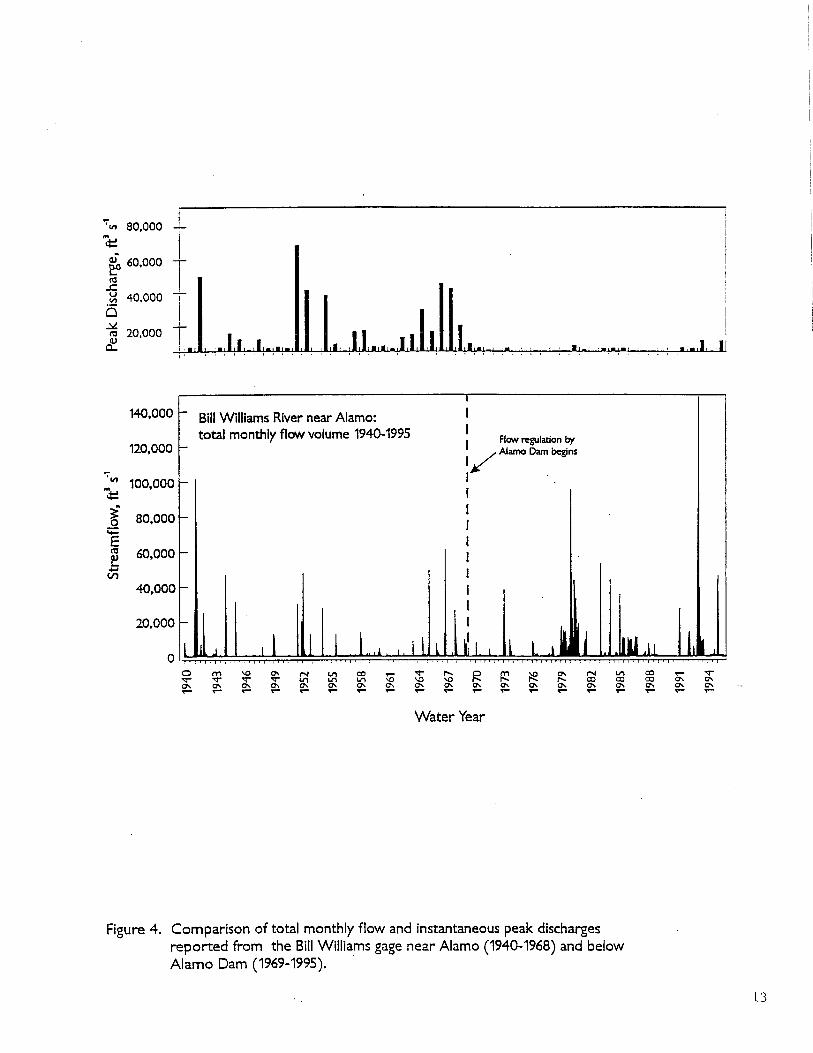
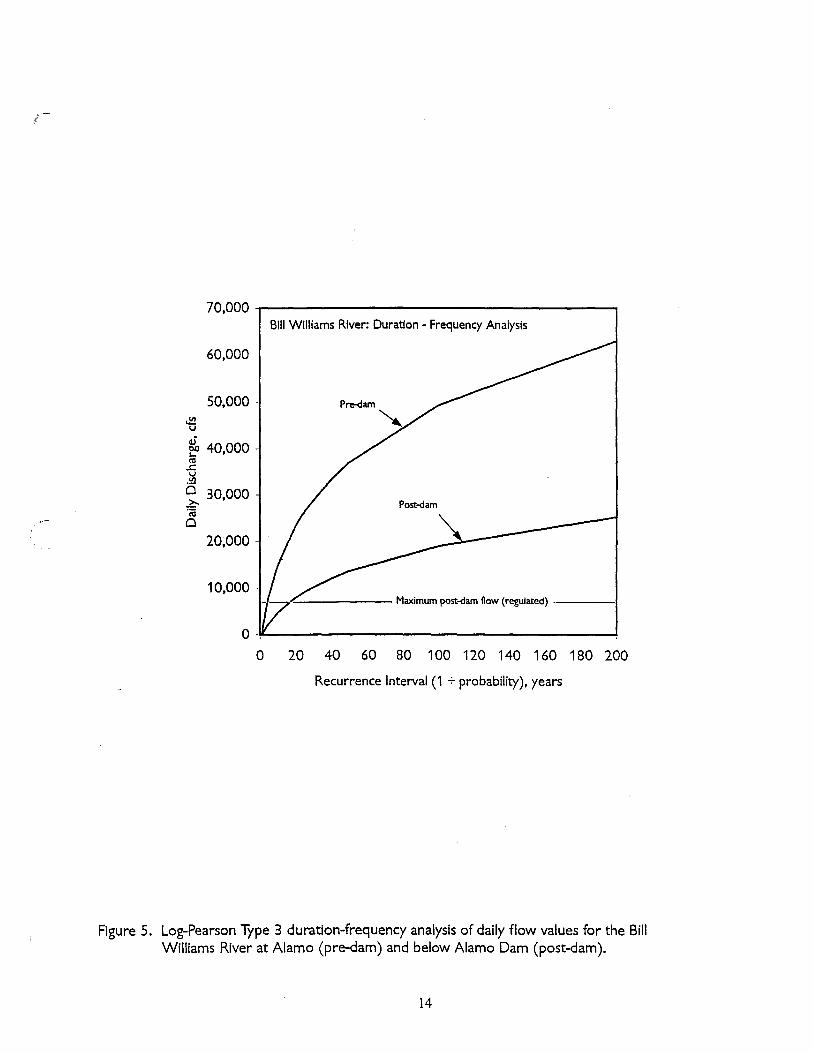
Figure 5. Log-Pearson Type 3 duration-frequency analysis of daily flow values for the Bill Williams River at Alamo (pre-dam) and below Alamo Dam (post-dam).
14
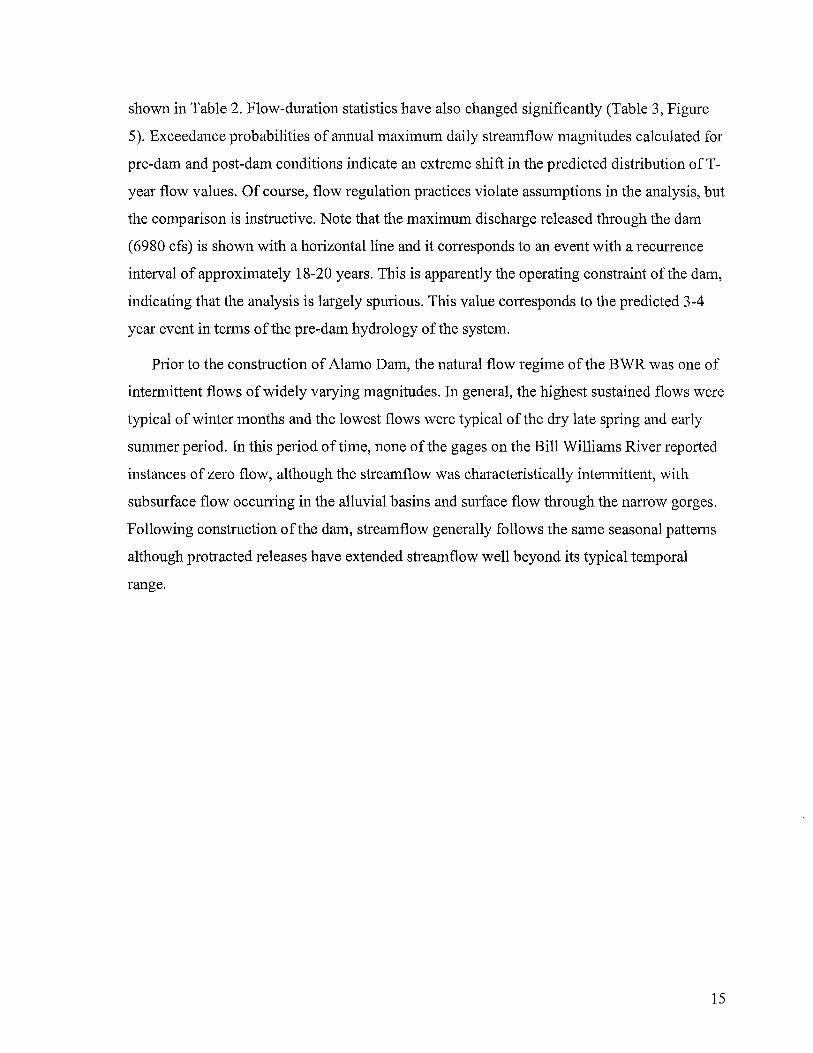
shown in Table 2. Flow-duration statistics have also changed significantly (Table 3, Figure
5). Exceedance probabilities of annual maximum daily streamflow magnitudes calculated for
pre-dam and post-dam conditions indicate an extreme shift in the predicted distribution of T
year flow values. Of course, flow regulation practices violate assumptions in the analysis, but
the comparison is instructive. Note that the maximum discharge released through the dam
(6980 cfs) is shown with a horizontal line and it corresponds to an event with a recurrence
interval of approximately 18-20 years. This is apparently the operating constraint of the dam,
indicating that the analysis is largely spurious. This value corresponds to the predicted 3-4
year event in terms ofthe pre-dam hydrology ofthe system.
Prior to the construction of Alamo Dam, the natural flow regime of the BWR was one of
intermittent flows of widely varying magnitudes. In general, the highest sustained flows were
typical of winter months and the lowest flows were typical of the dry late spring and early
summer period. In this period of time, none of the gages on the Bill Williams River reported
instances of zero flow, although the streamflow was characteristically intermittent, with
subsurface flow occurring in the alluvial basins and surface flow through the narrow gorges.
Following construction ofthe dam, streamflow generally follows the same seasonal patterns
although protracted releases have extended streamflow well beyond its typical temporal
range.
15
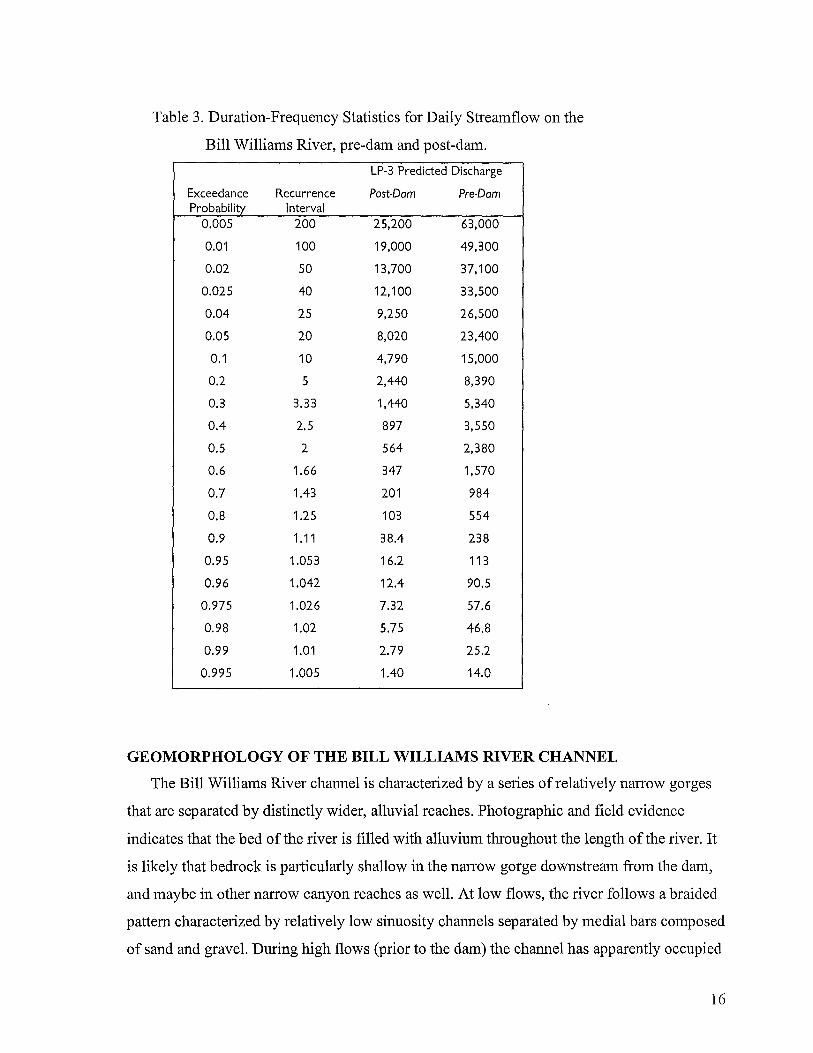
Table 3. Duration-Frequency Statistics for Daily Streamflow on the
Bill Williams River, pre-dam and post-dam.
LP-3 Predicted Discharge
Exceedance Recurrence Post-Dam Pre-Dam Probability Interval
0.005 200 25,200 63,000
0.01 100 19,000 49,300
0.02 50 13,700 37,100
0.025 40 12,100 33,500
0.04 25 9,250 26,500
0.05 20 8,020 23,400
0.1 10 4,790 15,000
0.2 5 2,440 8,390
0.3 3.33 1,440 5,340
0.4 2.5 897 3,550
0.5 2 564 2,380
0.6 1.66 347 1,570
0.7 1.43 201 984
0.8 1.25 103 554
0.9 1.11 38.4 238
0.95 1.053 16.2 113
0.96 1.042 12.4 90.5
0.975 1.026 7.32 57.6
0.98 1.02 5.75 46.8
0.99 1.01 2.79 25.2
0.995 1.005 1.40 14.0
GEOMORPHOLOGY OF THE BILL WILLIAMS RIVER CHANNEL
The Bill Williams River channel is characterized by a series of relatively narrow gorges
that are separated by distinctly wider, alluvial reaches. Photographic and field evidence
indicates that the bed of the river is filled with alluvium throughout the length of the river. It
is likely that bedrock is particularly shallow in the narrow gorge downstream from the dam,
and maybe in other narrow canyon reaches as well. At low flows, the river follows a braided
pattern characterized by relatively low sinuosity channels separated by medial bars composed
of sand and gravel. During high flows (prior to the dam) the channel has apparently occupied
16
all of the late Holocene floodplain except in some peripheral portions of the wide alluvial
valleys. During low flow periods, streamflow in the river is intermittent, with surface flow
only typical of narrow canyon reaches and subsurface flow in the wider valley reaches.
Interpretation of Historical Aerial Photographs
We examined a series of historical aerial photographs to characterize the geomorphology
of the BWR channel. We used seven sets of aerial photographs that covered the length of the
Bill Williams River-1953, 1964, 1976, 1985, 1992, 1993, and 1995. Of these, two sets were
analyzed in detail-1953 and 1995. These particular sets were chosen for several reasons:
1. The 1953 set was the earliest available series of high-quality, large-scale photos.
2. A series oflarge floods that were typical of the pre-dam hydrology of the river
occurred in the years preceding 1953.
3. The 1995 set was the most recent available series of aerial photographs
4. The 1995 photos were taken during and following the second largest sustained release
of streamflow through Alamo Dam since its construction. The prior largest (record)
release was in 1993.
Thus, these two sets of photos serve to bracket a critical and unique period in the recent
history of the Bill Williams River. Analysis and mapping ofthe 1953 photos establishes the
"natural" geomorphic framework of the river and the 1995 photos show its present state.
Comparison of these two photo series reveals the cumulative change that transpired over the
intervening 42 years. Similarly detailed analyses of each of the photo sets between these two
end dates would reveal changes that have subsequently been overprinted by streamflow in
the intervening period, but this level of detail was not feasible given the available resources
for the project. Such an approach is highly recommended for subsequent attempts to
document progressive changes in channel geomorphology and riparian vegetation density
and distribution resulting from the alteration of the flow regime imposed by Alamo Dam.
Over the period 1953-1969, no flows with magnitudes in excess ofthe most recent large
flood preceding the 1953 photos (August 1951; Peak discharge:65,100 cfs) were recorded on
the Bill Williams. Since 1968, no flows even approaching such flood magnitudes have
occurred. Thus the changes that have occurred over the interval spanned by the photos have
been largely restricted to the lowest series of alluvial surfaces along the river. Lateral erosion
of many of the higher surfaces has also occurred. Comparison of the entire chronology of
17
aerial photographs indicates that much of this erosion occurred during the sustained
streamflow releases of 1980, 1993 and 1995 (see Figure 4). Several figures are included in
this report that highlight progressive changes in key reaches at roughly decadal or bi-decadal
intervals over the 42 year period and thus help to supplement the mapping.
Methods of Map Preparation
In preparing the maps, the aerial photographs were analyzed stereoscopically and distinct
channel features were identified and outlined on mylar overlays. Ultimately, a continuous
strip of the river from Alamo Dam to Lake Havasu (approximately to the bridge crossing at
Highway 95) was mapped this way. These photo mapping was then transferred to the
appropriate 7.5 minute USGS topographic quadrangle.
This method of manually transferring line work based on photos to geodetically corrected
base maps is handicapped by the effects of distortion in the aerial photographs. This problem
was particularly pronounced in some broad reaches of the river characterized by few distinct
landmarks. In these instances, xerographic reduction of the overlays to the approximate map
scale was performed with some success. In other instances, the photos were scanned and
subjected to very simplified computer manipulation in Adobe Photoshop ™ so as to try to
"rubber-sheet" the photos to the base map using scaling, skewing, and rotating routines.
Figures in this report that show aerial photograph comparisons were prepared in this way.
Any subsequent study of the morphological evolution of the Bill Williams River should take
advantage of recent advances in GIS modeling and computerized photo matching to precisely
illustrate the time series of channel change (Hilmes and Liebermann, 1996).
In the photo analysis, greatest emphasis was placed on the 1953 photos for establishing
the fluvial geomorphic framework of the river. This was because of the exceptional clarity
and large-scale (~1: 18,000) of these photos, the fact that most of the higher surfaces have
remained largely intact due to the altered flow regime, and subsequent increases in the
density of riparian vegetation that have reduced the relative precision of photo interpretation
III some areas.
Explanation of Mapping
The 1953 aerial photographs were used to characterize the pre-dam geomorphology of
the Bill Williams River channel. The clarity ofthese photos, the lack of post-dam riparian
vegetation growth, and the general lack of agricultural development made these photos the
18
best choice for this purpose. Because of the influence of flow reductions by Alamo Dam, the
Bill Williams River has generally occupied a far smaller width of the canyon thus effectively
abandoning many of the active, high-flow related alluvial surfaces present in 1953.
Therefore, much of the geomorphology peripheral to the lowest surfaces in 1953 remains to
this day-although considerable lateral erosion of some abandoned surfaces has occurred.
The mapping of the 1953 photos establishes the geomorphic framework for evaluation of
subsequent, principally post-dam changes in channel geometry and pattern.
There are four dominant alluvial surfaces along the Bill Williams River. In some areas,
six levels are recognizable in the aerial photographs. These two additional levels have been
classified for the purposes of this report as subdivisions of two of the main group members.
Each of the surfaces has been delineated on the basis of the following criteria: topographic
position (i.e. elevation-based hierarchy), vegetation density, and lateral position relative to
other surfaces and channel boundaries. The last criteria applies to areas that have been
designated as likely fine-grained flood deposits along the perimeter of the channel.
Generally, the first two criteria are the most important for differentiating alluvial
surfaces. They also are positively correlated in most instances-the relative density of
vegetation increases with elevation of the surface. This is a simple consequence of the
frequency of inundation by flood flows along the river. The higher surfaces are inundated
less frequently than the lower surfaces. (Note, these generalizations only apply to the pre
dam situation). There are important exceptions to this generalization. In areas characterized
by significant amounts of riparian vegetation (typically in areas where subsurface flow
resurfaces, e.g. at the downstream end of the alluvial valleys), the lowest surface mayhave
the highest density of vegetation. In these instances, topographic position as well as the type
of vegetation are means of differentiating the surfaces.
19
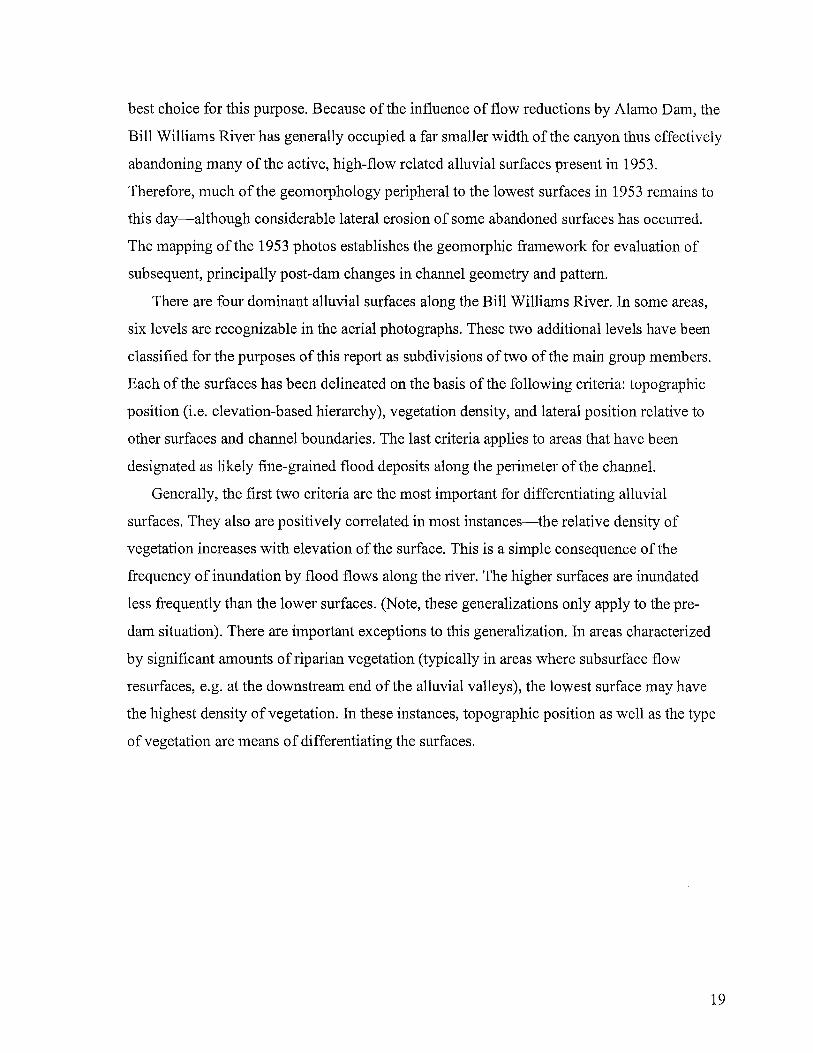
Map Units -1953.
Y r Lowest alluvial surface, water present; inundation frequency very high
Yrv: Same as above, but with relatively dense coverage of riparian vegetation
Y110west dry alluvial surface; completely devoid of vegetation; inundation frequency is
high
Y1a: Slightly higher surface entirely devoid of vegetation. Characterized by small scarp
separating it from bounding Y1 or Y2 surfaces.
Y2: highest surface that is completely or nearly completely devoid of vegetation;
inundation frequency moderate to high
Y2a slightly higher surface with some vegetation present; frequency of inundation is
moderate to high
Y3: Next highest alluvial surface, relatively dense, mature vegetation present;
infrequently inundated
Y 4: Mixed unit comprising the highest alluvial surface and fine-grained alluvial deposits
located along the perimeter of the main channel typically in small re-entrants and
niches. Generally, Unit Y4 represents fine-grained flood deposits of varying
elevations relative to the main channel. Most Y 4 deposits are restricted in spatial
extent and were deposited by the largest floods prior to the construction of Alamo
Dam.
Map Units -1995.
Yr: Portion of river channel inundated by 1995 flood. Vegetation sparse or absent. Yrv
denotes low, inundated areas characterized by relatively dense vegetation.
Y1: Inundated area with moderate density of vegetation. Flood waters appear to be
continuous through these areas, although they are topographically higher than Yr
areas. Y1 v denotes areas with higher vegetation densities.
Y1a Highest Inundated surface with highest density of vegetation. Flood waters appear as
discontinuous channels separated by bars. In some areas, the vegetation density
precludes the assessment of the extent of flood waters.
Study Reaches
For the salce of simplifying the following discussion, the length of the river has been
20
subdivided into a series of generally distinct subreaches. The subreaches were selected to
represent the predominant trends in the morphology of the system. They are differentiated as
follows: (1) Alamo Gorge, (2) Reid Valley, (3) Rankin Valley, (4) Pipeline Canyon, (5)
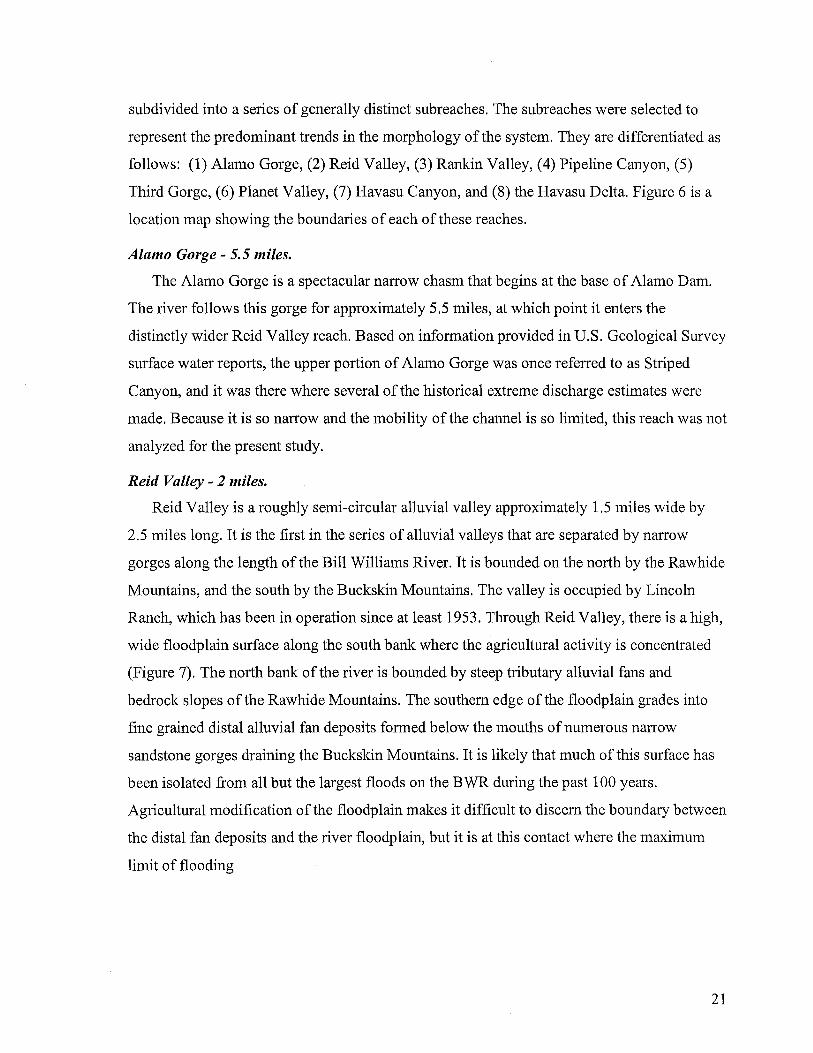
Third Gorge, (6) Planet Valley, (7) Havasu Canyon, and (8) the Havasu Delta. Figure 6 is a
location map showing the boundaries of each of these reaches.
Alamo Gorge - 5.5 miles.
The Alamo Gorge is a spectacular narrow chasm that begins at the base of Alamo Dam.
The river follows this gorge for approximately 5.5 miles, at which point it enters the
distinctly wider Reid Valley reach. Based on information provided in U.S. Geological Survey
surface water reports, the upper portion of Alamo Gorge was once referred to as Striped
Canyon, and it was there where several of the historical extreme discharge estimates were
made. Because it is so narrow and the mobility of the channel is so limited, this reach was not
analyzed for the present study.
Reid Valley - 2 miles.
Reid Valley is a roughly semi-circular alluvial valley approximately 1.5 miles wide by
2.5 miles long. It is the first in the series of alluvial valleys that are separated by narrow
gorges along the length of the Bill Williams River. It is bounded on the north by the Rawhide
Mountains, and the south by the Buckskin Mountains. The valley is occupied by Lincoln
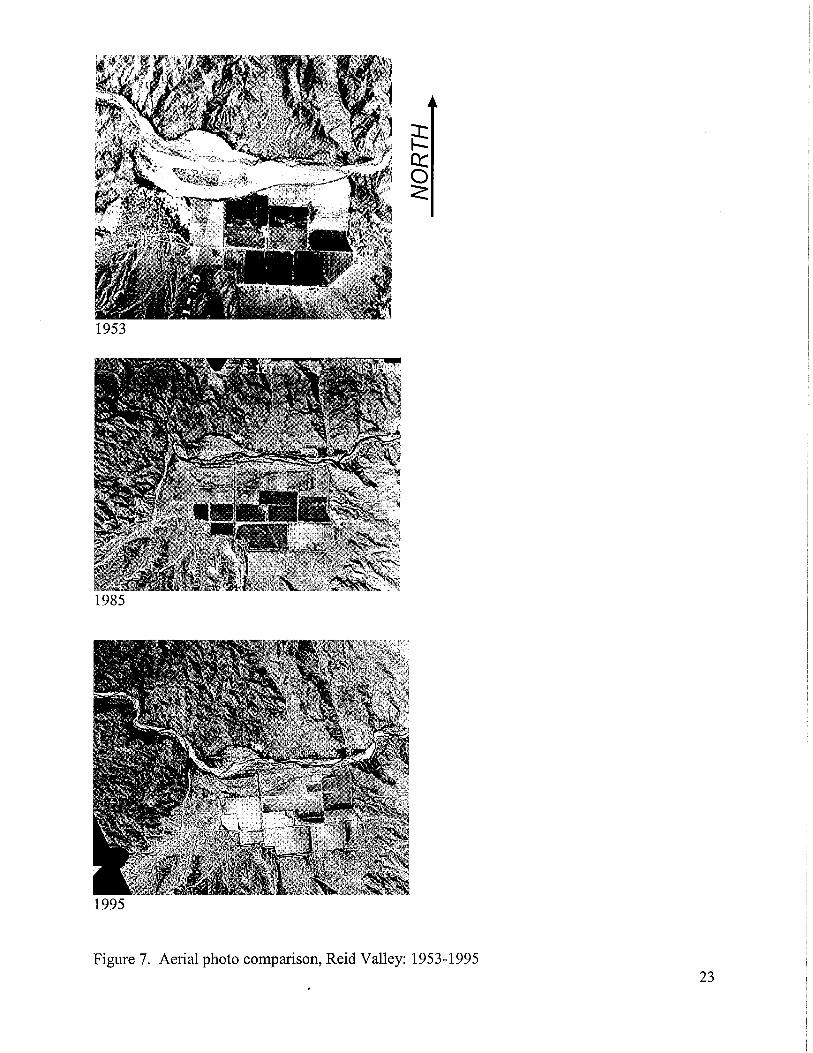
Ranch, which has been in operation since at least 1953. Through Reid Valley, there is a high,
wide floodplain surface along the south bank where the agricultural activity is concentrated
(Figure 7). The north bank of the river is bounded by steep tributary alluvial fans and
bedrock slopes of the Rawhide Mountains. The southern edge of the floodplain grades into
fine grained distal alluvial fan deposits formed below the mouths of numerous narrow
sandstone gorges draining the Buckskin Mountains. It is likely that much of this surface has
been isolated from all but the largest floods on the BWR during the past 100 years.
Agricultural modification of the floodplain makes it difficult to discern the boundary between
the distal fan deposits and the river floodplain, but it is at this contact where the maximum
limit of flooding
21
...... x a>
+-'
a> ..c +-'
c "'0
C a> 0 ..c
>. >. ro a> a> c ~
"C
0) ro a> (j
L..
~ () 0
(/)
0 a>
en (j +-' ::J ::J
"'0
a> (/) (/) e: w "'0 ro ro L.. c > > ro
J: ..c ro ro ro (/)
0 I-;- a. I I a> I I I
« (0 I'- CO en ..c (j
W ro a>
a:: 0:::
>- c ~
a> 0 a>
C a> 0) >. >. > 0) L.. a> c ~
::J L.. >. 0
~ ro
I- 0 ~ (j () (/)
en (j ~ "'0 a> E
0 c c c "~ E "'0 0 :i: a> ~ (j c ro "(j) a> ro Q.
4= 0::: en 0::: a. I I I I
....... N (V) "'l" L{) co a> ..c +-'
0) C 0 ro (/) a> ..c (j ro a> L..
>. "'0 ::J +-' (/)
...... 0 (/) C 0
:;:::; ro (j 0
....J
cD CI) "-:::s C)
i!
22

1953
1985
1995
Figure 7. Aerial photo comparison, Reid Valley: 1953-1995 23

by the BWR is likely to exist.
The map showing cumulative channel changes over the period 1953-1995 (Plate 1)
indicates that the primary mechanism of channel change through Reid Valley has been
channel narrowing and incision. Several extensive areas designated as Y2 (moderate to high
frequency of inundation) have been largely abandoned by the river. Some lateral erosion of
the higher surfaces has clearly occurred, but the most recent large release of flow from
Alamo Dam was mainly restricted to a limited portion of the low flow channel present in
1953.
Second Gorge - 1.25 miles.
This short gorge spans the reach between Reid Valley and Rankin Valley. It is a
relatively narrow reach bounded by steep bedrock walls of the Rawhide and Buckskin
Mountains. Relatively high-standing alluvial surfaces in this reach are restricted to the inner
portions of channel bends, and small embayments along the perimeter of straight sections of
the river. Channel change in the second gorge has been minimal. In general the most obvious
change is an overall increase in the density of vegetation on the higher surfaces.
Rankin Valley - 3.25 miles.
Rankin Valley is the second alluvial valley along the Bill Williams River. The Rankin
Valley reach is characterized by a relatively wide alluvial valley that coincides with a
prominent westward bend in the river. Through much of the valley the river is bounded by
alternating wide alluvial surfaces on either side of the river. Along the northern edge of the
river is a broad, relatively low floodplain surface that was likely to have been inundated
relatively frequently by pre-dam streamflows. However, only small threads of flow have
inundated portions of this surface since the dam was emplaced. This surface coincides with
the outer edge of the distinct westward bend ofthe river and is partially bounded on its south
side by a relatively large bedrock island. On the south side of the river is a similar, but
slightly higher surface where agricultural activity has been concentrated. This surface was
less prone to flooding prior to the construction of the dam, although the photos suggest that
inundation of much of the surface was likely during the largest floods.
Pipeline Canyon - 2.5 miles
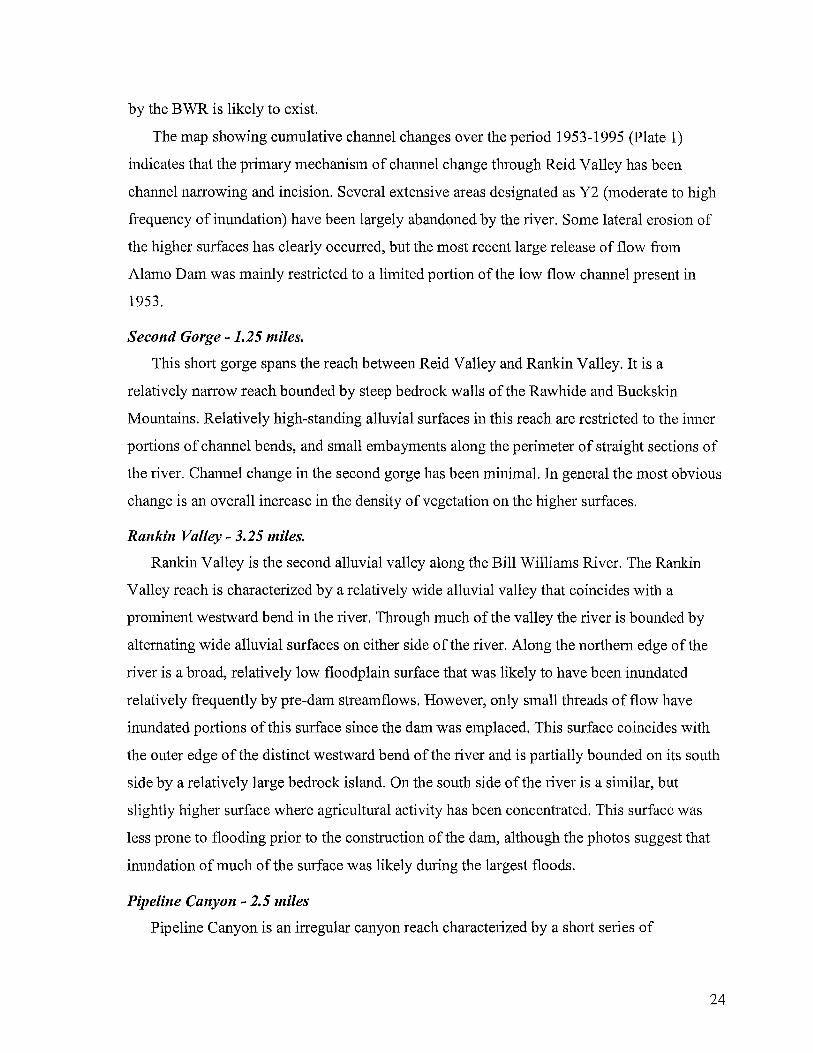
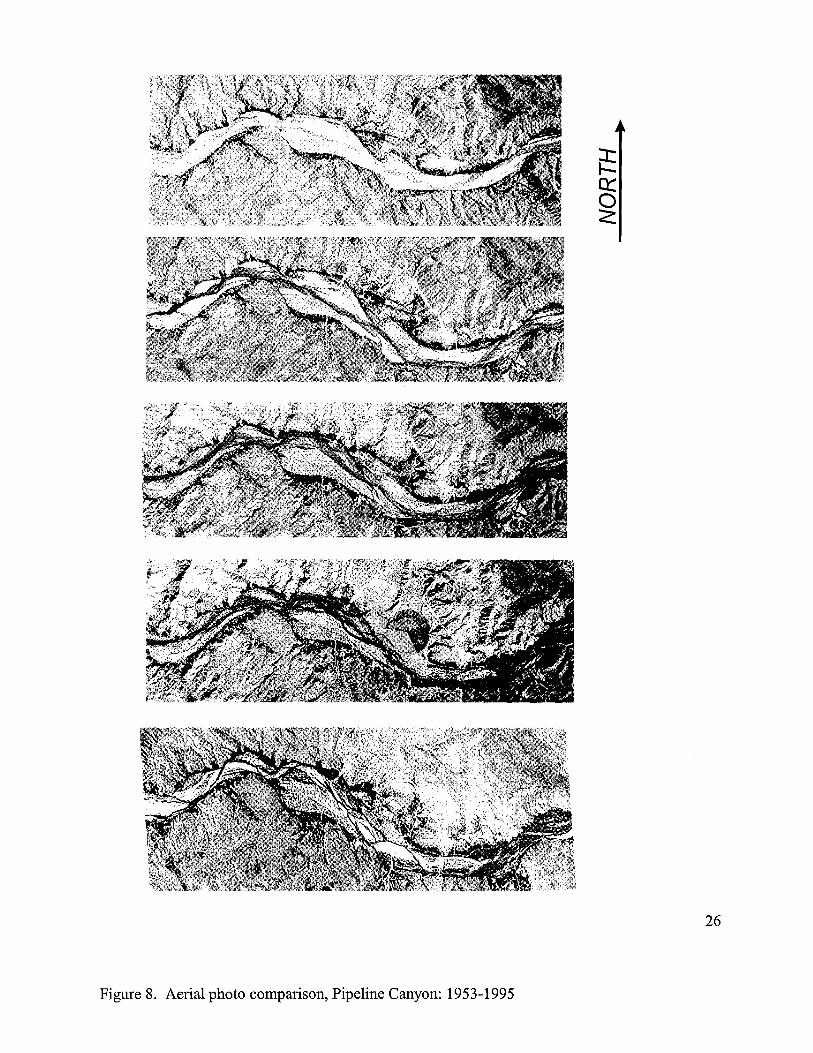
Pipeline Canyon is an irregular canyon reach characterized by a short series of
24
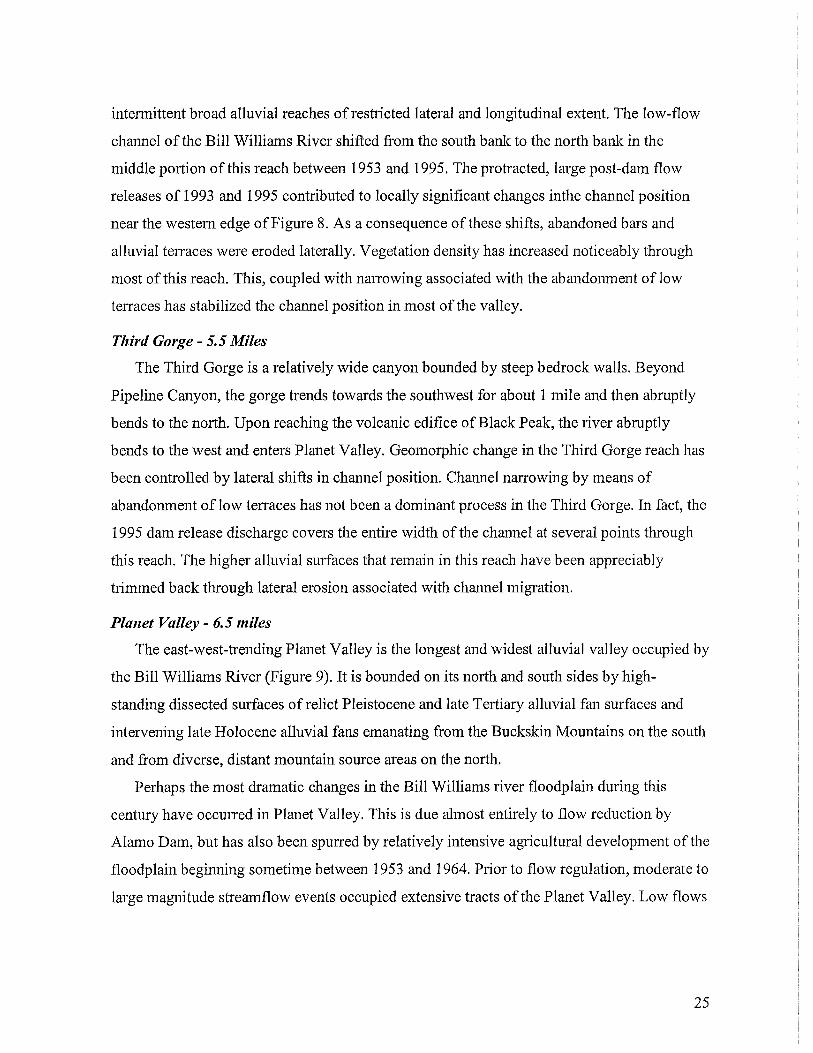
intennittent broad alluvial reaches of restricted lateral and longitudinal extent. The low-flow
channel of the Bill Williams River shifted from the south bank: to the north bank: in the
middle portion of this reach between 1953 and 1995. The protracted, large post-dam flow
releases of 1993 and 1995 contributed to locally significant changes inthe channel position
near the western edge of Figure 8. As a consequence ofthese shifts, abandoned bars and
alluvial terraces were eroded laterally. Vegetation density has increased noticeably through
most of this reach. This, coupled with narrowing associated with the abandonment of low
terraces has stabilized the channel position in most of the valley.
Third Gorge - 5.5 Miles
The Third Gorge is a relatively wide canyon bounded by steep bedrock walls. Beyond
Pipeline Canyon, the gorge trends towards the southwest for about 1 mile and then abruptly
bends to the north. Upon reaching the volcanic edifice of Black Peak, the river abruptly
bends to the west and enters Planet Valley. Geomorphic change in the Third Gorge reach has
been controlled by lateral shifts in channel position. Channel narrowing by means of
abandonment of low terraces has not been a dominant process in the Third Gorge. In fact, the
1995 dam release discharge covers the entire width of the channel at several points through
this reach. The higher alluvial surfaces that remain in this reach have been appreciably
trimmed back through lateral erosion associated with channel migration.
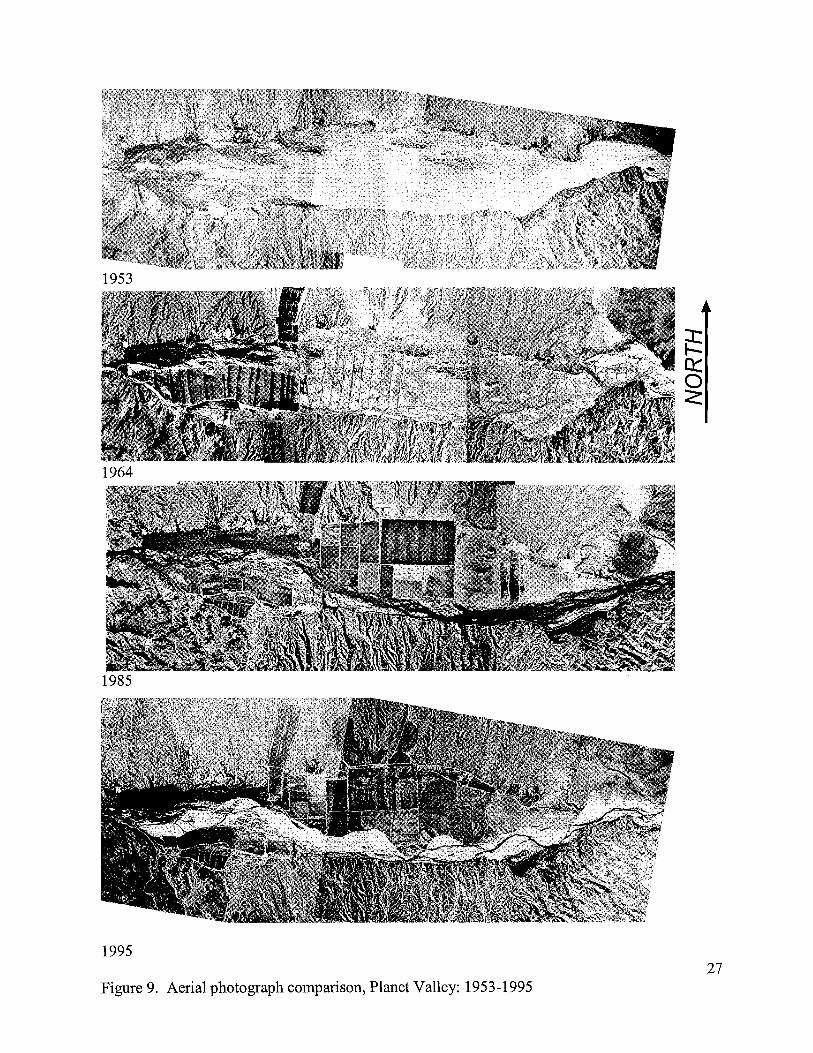
Planet Valley - 6.5 miles
The east-west-trending Planet Valley is the longest and widest alluvial valley occupied by
the Bill Williams River (Figure 9). It is bounded on its north and south sides by high
standing dissected surfaces of relict Pleistocene and late Tertiary alluvial fan surfaces and
intervening late Holocene alluvial fans emanating from the Buckskin Mountains on the south
and from diverse, distant mountain source areas on the north.
Perhaps the most dramatic changes in the Bill Williams river floodplain during this
century have occurred in Planet Valley. This is due almost entirely to flow reduction by
Alamo Dam, but has also been spurred by relatively intensive agricultural development ofthe
floodplain beginning sometime between 1953 and 1964. Prior to flow regulation, moderate to
large magnitude streamflow events occupied extensive tracts of the Planet Valley. Low flows
25
26
Figure 8. Aerial photo comparison, Pipeline Canyon: 1953-1995
1953
1964
1985
1995 27
Figure 9. Aerial photograph comparison, Planet Valley: 1953-1995
,. __ -, __ ,",,,,.:~.!J __ ~_ .. ; 1640 .. l : I. J • \
\ '1 I. - l . I . ; I \ I \
N
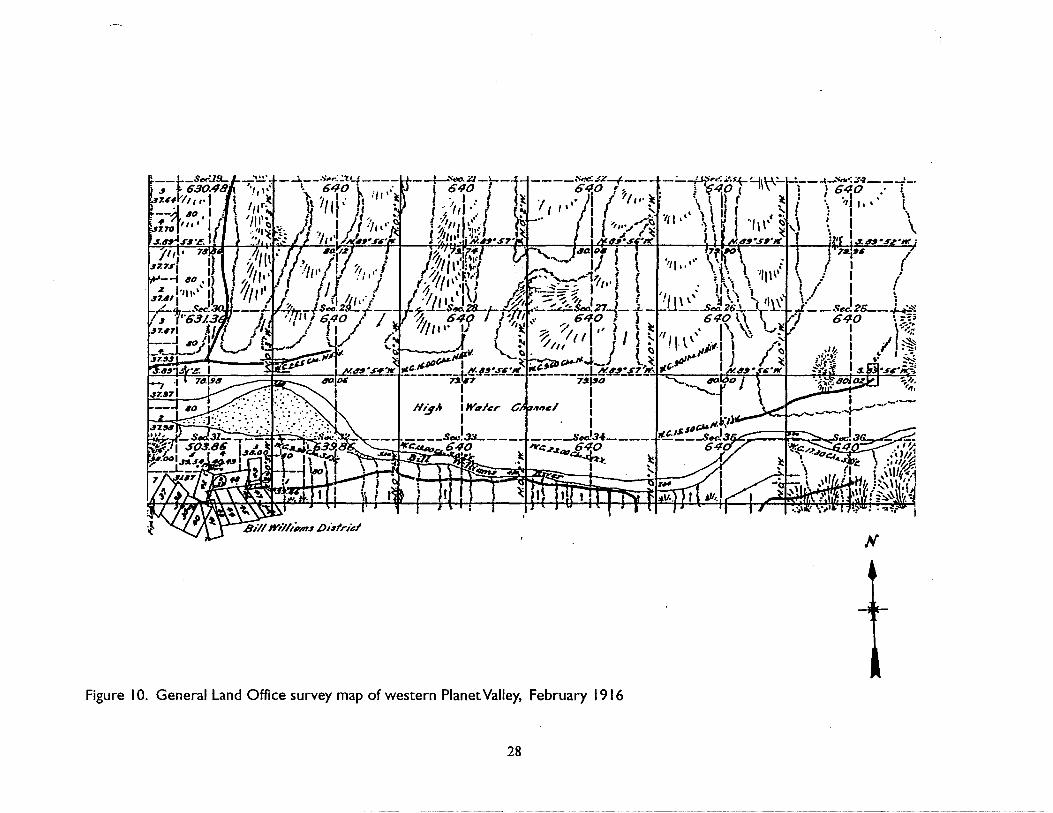
Figure 10. General Land Office survey map of western Planet Valley, February 1916
28
appear to have consistently remained restricted to the southern edge of the valley through
most of its length. This pattern has been in place since at least the extremely large flood on
January 19, 1916 which was reportedly 175,000 cfs (from Striped Canyon near Alamo).
Interestingly, the earliest available General Land Office Map from this area is based on
surveys performed between November 1915 and February 1916, thus bracketing the event.
The GLO map ofthe Planet Valley area is shown in Figure 10. Note the clear demarcation of
the low flow channel along the southern margin of the valley and the classification of the
remaining valley area to the north as the "high water channel". Photographic comparisons
provided in Figure 9 illustrate the pace of the eventual abandonment of this portion of the
valley by all but tributary streamflows.
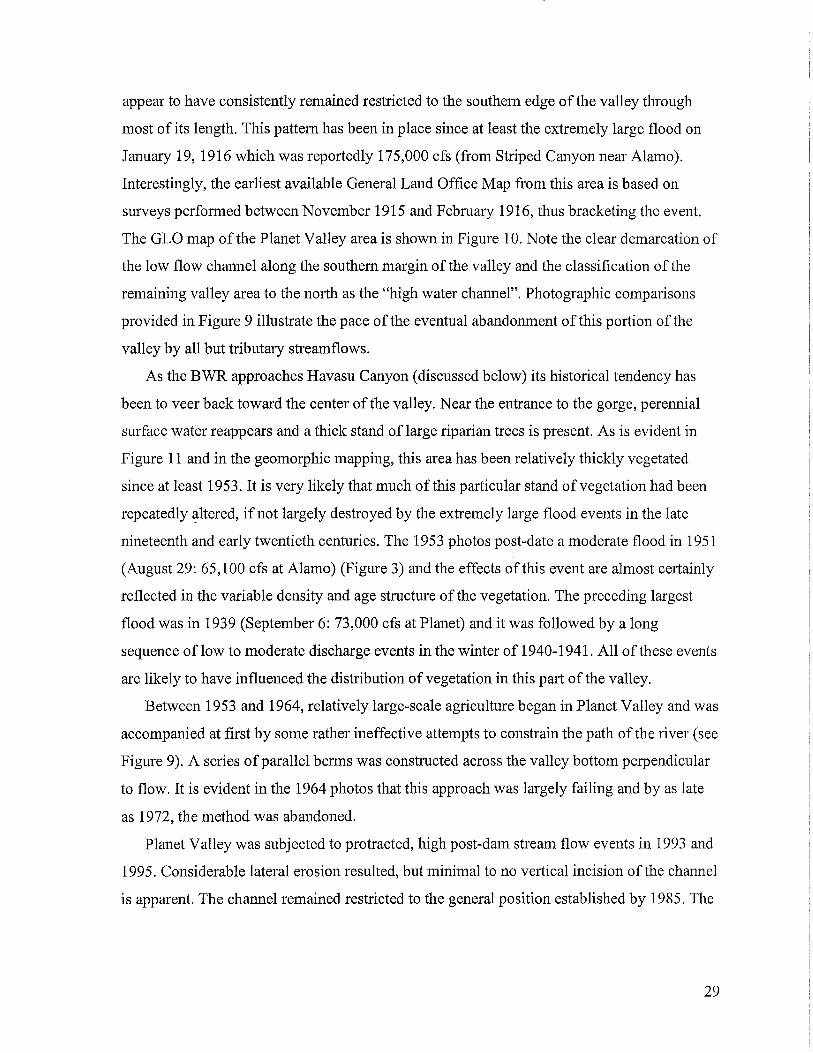
As the BWR approaches Havasu Canyon (discussed below) its historical tendency has
been to veer back toward the center of the valley. Near the entrance to the gorge, perennial
surface water reappears and a thick stand of large riparian trees is present. As is evident in
Figure 11 and in the geomorphic mapping, this area has been relatively thickly vegetated
since at least 1953. It is very likely that much of this particular stand of vegetation had been
repeatedly <:tltered, if not largely destroyed by the extremely large flood events in the late
nineteenth and early twentieth centuries. The 1953 photos post-date a moderate flood in 1951
(August 29: 65,100 cfs at Alamo) (Figure 3) and the effects of this event are almost certainly
reflected in the variable density and age structure ofthe vegetation. The preceding largest
flood was in 1939 (September 6: 73,000 cfs at Planet) and it was followed by a long
sequence of low to moderate discharge events in the winter of 1940-1941. All of these events
are likely to have influenced the distribution of vegetation in this part of the valley.
Between 1953 and 1964, relatively large-scale agriculture began in Planet Valley and was
accompanied at first by some rather ineffective attempts to constrain the path of the river (see
Figure 9). A series of parallel berms was constructed across the valley bottom perpendicular
to flow. It is evident in the 1964 photos that this approach was largely failing and by as late
as 1972, the method was abandoned.
Planet Valley was subjected to protracted, high post-dam stream flow events in 1993 and
1995. Considerable lateral erosion resulted, but minimal to no vertical incision of the channel
is apparent. The channel remained restricted to the general position established by 1985. The
29
30
Figure 11. Aerial photo comparison, Planet Valley (west end): 1953-1995
extent of flooded area in Planet Valley was a mere fraction of the extent subjected to flooding
prior to dam construction.
Havasu Canyon - 4.5 miles.
Some of the most complicated fluvial geomorphology of the river is present in Havasu
Canyon. It begins at the narrow constriction at the west end of Planet Valley, where jagged
cliffs of the Bill Williams Mountains and the Buckskin Mountains jut prominently above the
relatively low lying terrain around Planet Valley. The beginning of the gorge is very near the
site of the old stream gage "at Planet". The gorge is characterized by an extremely tortuous
course with variable width. Complex assemblages of alluvial surfaces are present throughout
the reach.
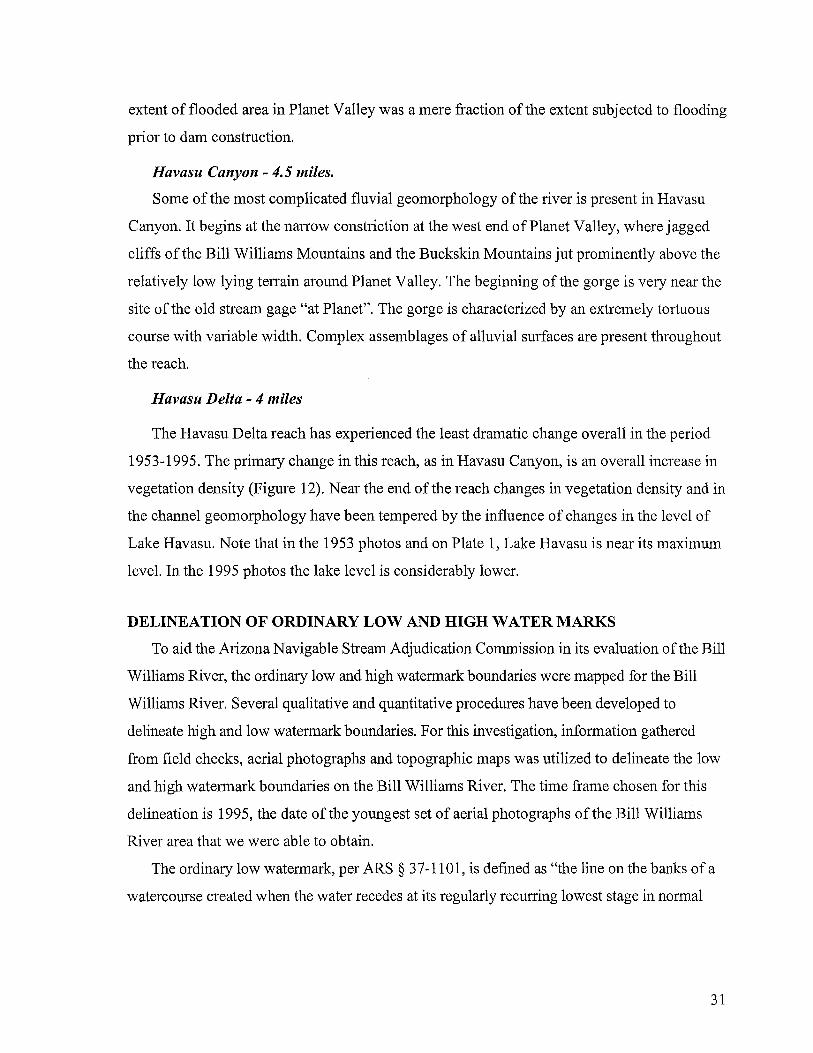
Havasu Delta - 4 miles
The Havasu Delta reach has experienced the least dramatic change overall in the period
1953-1995. The primary change in this reach, as in Havasu Canyon, is an overall increase in
vegetation density (Figure 12). Near the end of the reach changes in vegetation density and in
the channel geomorphology have been tempered by the influence of changes in the level of
Lake Havasu. Note that in the 1953 photos and on Plate 1, Lake Havasu is near its maximum
level. In the 1995 phCltos the lake level is considerably lower.
DELINEATION OF ORDINARY LOW AND HIGH WATER MARKS
To aid the Arizona Navigable Stream Adjudication Commission in its evaluation of the Bill
Williams River, the ordinary low and high watermark boundaries were mapped for the Bill
Williams River. Several qualitative and quantitative procedures have been developed to
delineate high and low watermark boundaries. For this investigation, information gathered
from field checks, aerial photographs and topographic maps was utilized to delineate the low
and high watermark boundaries on the Bill Williams River. The time frame chosen for this
delineation is 1995, the date of the youngest set of aerial photographs of the Bill Williams
River area that we were able to obtain.
The ordinary low watermark, per ARS § 37-110 I, is defined as "the line on the banks of a
watercourse created when the water recedes at its regularly recurring lowest stage in normal
31

1953
1995
Figure 12. Aerial photo comparison, Havasu Delta Reach: 1953-1995
32
years without reference to unusual droughts." Though this definition is fairly straightforward
when used to describe rivers with a baseflow, ambiguity arises when applying such a definition
to the Bill Williams River because it is intermittent or ephemeral in the many of its reaches.
First, physical markers on the landscape left by low flows tend to be quickly erased by periodic
high flows. Second, even ifthere were a statistical definition of the ordinary low watermark
based on hydrological records, much ofthe Bill Williams River is not gaged. For these reasons,
we consider that low watermark boundaries exist only in the reaches in which there was water
at the time the most recent aerial photographs were taken. Along all of the Bill Williams
River, the low watermark boundaries were too close together to draw separately, so one line
was drawn. The approximate position of the low-flow channel along the river as of April
1995 is depicted in Plates 1 and 2 (Appendix A).
The ordinary high watermark is defined as "that line on the bank established by the
fluctuations of water and indicated by physical characteristics such as a clear, natural line
impressed on the bank, shelving, changes in the character of the soil, destruction ofterrestria1
vegetation, the presence of litter and debris, or other appropriate means that consider the
characteristics of the surrounding areas." (33 CFR, Part 328.(e)). We mapped high watermark
boundaries using defined channel banks, channel surfaces cleared of vegetation, and changes
in vegetation type. Current high-water mark boundaries are most readily defined by the
extent of the river channel that was inundated by the 1995 flood. The high-flow channel or
channels are shown by the extent of map unit Yr in 1995 on Plates 1 and 2. Note that these
areas do not encompass the entire extent of the 1995 flood, but rather the channel areas that
were inundated. Thus, low terraces and bars that experienced shallow inundation in 1995 are
not included within the ordinary high-water marks.
CONCLUSIONS
The Bill Williams River and its principal tributaries, Big Sandy River and Santa Maria
River, form a large, rugged, and diverse watershed that drains most of west-central Arizona.
The BWR below the confluence of the Big Sandy and Santa Maria rivers consists of a series
of narrow bedrock gorges and much wider alluvial reaches. Completion of Alamo Dam in
1968 profoundly altered hydrology and geomorphology of the BWR. Natural flow conditions
on the BWR prior to 1968 were extremely variable. Sustained flows typically were moderate
33
in the winter months and intermittent in the dry months, but days with no flow were rare. A
number oflarge floods occurred from 1891 to 1953, including the largest estimated peak
discharge for a basin of this size in the lower Colorado River basin. There is a progressive
decrease in flood peak discharge estimates from 1891 to 1968, however, which suggests that
the early flood discharges may have been systematically overestimated. Since the completion
of Alamo Dam, flood peak discharges have been much lower. Even during the extremely wet
winters of 1993 and 1995, peak discharges downstream of Alamo Dam never exceeded 7,000
cfs. Total flow volumes are similar in the pre-dam and post-dam record, however, and this
has resulted in much longer sustained flood flows. In addition, the number of days with no
flow has increased substantially.
The absence oflarge floods on the BWR since the completion of Alamo Dam has also
impacted the geomorphology of the river. Analysis of repeat aerial photography indicates
that the BWR has eroded laterally into low terraces along its banks since Alamo Dam was
completed. Most of this erosion occurred during prolonged periods of stream flow in 1980,
1993, and 1995. Because no moderately large floods have occurred since dam construction,
many of the pre-dam channel areas that were formerly devoid of vegetation now sustain
moderate to dense riparian vegetation. Changes have been most dramatic in the broad alluvial
reaches, which were occasionally entirely inundated by large floods prior to dam
construction.
REFERENCES
Garrett, J.M., and Gellenbeck, D.l, 1991, Basin characteristics and streamflow statistics in Arizona as of 1989: USGS Water Resources Investigations Report 91-4041,612 p.
Hilmes, M.M., and Liebermann, T.D., 1996, Analysis in changes in channel morphology, lower Virgin River, Arizona and Nevada, using digital methods [abs.]: Geological Society of America Abstracts with Programs, v. 28, p. A464.
Patterson, lL., and Somers, W.P., 1966, Magnitude and frequency of floods in the United States: Part 9. Colorado River Basin: U.S. Geological Survey Water-Supply Paper 1683, 476p.
Smith, W., and Heckler, W.L., 1955, Compilation of flood data in Arizona: 1862-1953: United States Geological Survey, Unnumbered Open-File Report, 113 p.
34
Appendix A
MAPS SHOWING CHANGES IN THE CHANNEL
GEOMORPHOLOGY OF THE BILL WILLIAMS RIVER,
ARIZONA 1953-95
by P. Kyle House
(MAPS IN POCKET)
35

APPENDIXB
STAGE-DISCHARGE RATING CURVES FOR GAGES
IN THE BILL WILLIAMS RIVER BASIN
A stage-discharge rating curve is a graphical plot that shows the relationship between
the monitored water level at a gaging station (the stage) and the corresponding flow rate (the
discharge). The establishment ofa reliable stage-discharge relationship is essential at all river
gauging stations when continuous-flow data are needed from the continuous stage record. 1
While stage-rating curves most often are used to convert stage data to discharge values, the
curves also can be used to do the reverse. Stage-discharge rating curves are provided in this
report so that the Arizona Stream Navigability Commission may determine the water heights
that correspond to the discharge values given in earlier chapters. A brief description of the
meaning and use of stage-discharge rating curves, and examples of curves develop.ed for the
Bill Williams River, are provided below.
The stage-discharge relationship is dependent on the nature of the channel section and -
the length of channel between the site of the gage and the cross-section where the discharge
was measured. Channel conditions in natural rivers tend to change over time; hence, stage
discharge relationships also tend to change over time, especially after flood flows. Typically
new discharge measurements are made throughout a range of stages on a regular basis by the
hydrologists responsible for maintaining USGS streamflow records. The hydrologists plot the
discharge measurements against the corresponding stage measurements on log-log graph
paper and draw a best-fit line through the points. Because the data are plotted on log-log
paper, the data points tend to group in a more linear fashion that makes relationships more
apparent to the hydrologists. If the data were plotted on regular arithmetic graph paper, the
data points would group into a curve; hence, the name "rating curve" is given to the hand
drawn line through the data points. Each time new measurements are collected, a new stage-
1 Shaw, E.M. (1988). Hydrology in Practice, Second Edition. London: Chapman and Hall, 539 p.
36
\. I
discharge rating curve is created. That rating curve is then used until the next time new
discharge measurements are made.
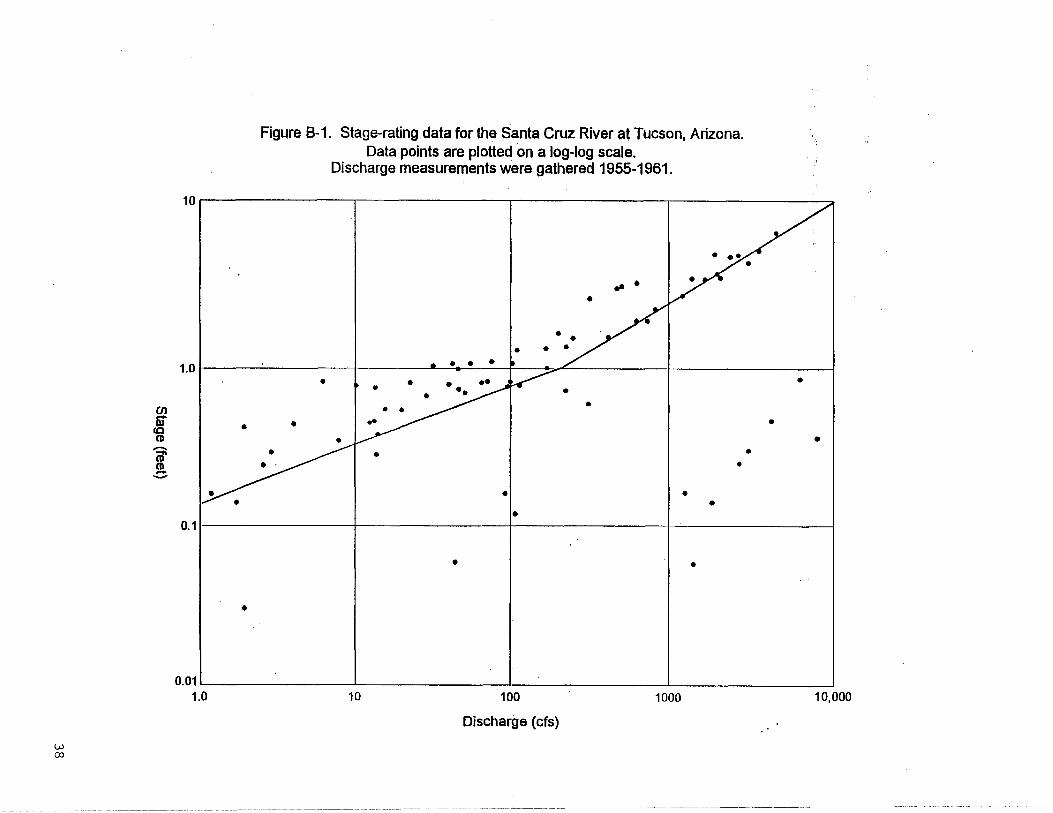
Figure B-f' is an example of such a stage-discharge plot using a log-log scale created
for the Santa Cruz River at Tucson from data gathered during the 1955 to 1961 period .
. There is a great amount of scatter in the data points' location; that is, the points do not cluster
close together. Such scatter often occurs in data collected from rivers with channels
composed of sandy, unconsolidated materials. Rivers with bedrock channels tend to have
flows that remain in a fixed location with a fixed channel geometry; therefore, their stage
discharge points plot closer together. In contrast, channels in unconsolidated materials tend
to shift their locations and dimensions through such processes as scour and deposition within
the channel, and the formation and cut-off of channel meanders. Channel changes may occur
even as a hydrologist is taking the discharge measurements (D. Ufkes, USGS-Water
Resources Division, Tucson, personal communication, 1996). The change in the slope of the
line drawn through the data points in Figure B-1 at the stage height of about one foot
indicatesthat.there was a change,in the channel control governing the stage-discharge
relationship in this reach (i.e. there may have been a change in the slope of the river banks) .
. , In rivers where flood flows overfill the channels' and spill onto floodplains, there may be
another break in the slope of the line at higher discharges because the stage-discharge
relationship of the within-bank flow may be very different from the stage-discharge
relationship of the floodplain flow.
Once the hydrologist establishes a satisfactory rating curve, a rating table is compiled
from values of stage and discharge extracted from the rating curve. Table B-1 provides an
idealized version of the rating table used for the gage on the Bill Williams River below Alamo
Dam for the period October 1, 1970, to August 12, 1971. For this report, we assembled data
from historical rating curves and rating tables archived by the USGS offices in Phoenix,
Tucson, and Yuma, as well as from recently developed rating tables stored digitally by the
USGS offices in Tucson and Phoenix, and by the U.S. Fish and Wudlife Service office located
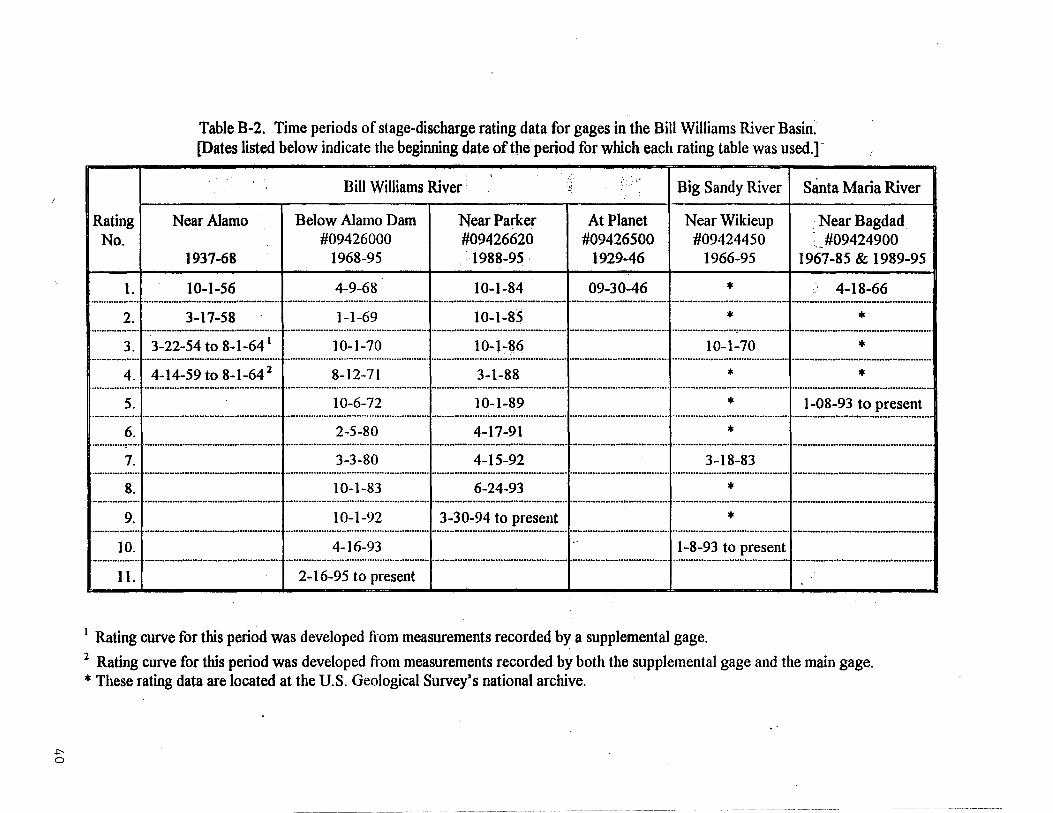
at the Bill Williams National Wudlife Refuge. Table B-2 lists th~ data available for the Bill
Williams River basin.
37
w co
C/)
g CD
.-... cr CD c
Figure B-1. Stage-rating data for the Santa Cruz River at Tucson, Arizona. Data points are plotted on a log-log scale.
Discharge measurements were gathered 1955-1961.
10. A
1.0 I • ••• - r !;.-o .....
•
• • •
• • •
• • • • 0.11--------t--------t---------t--'--------l
• •
•
0.01~. ______ ~------~~--:-----~-----_~ 1.0 10 100
Discharge (cfs)
1000 10,000
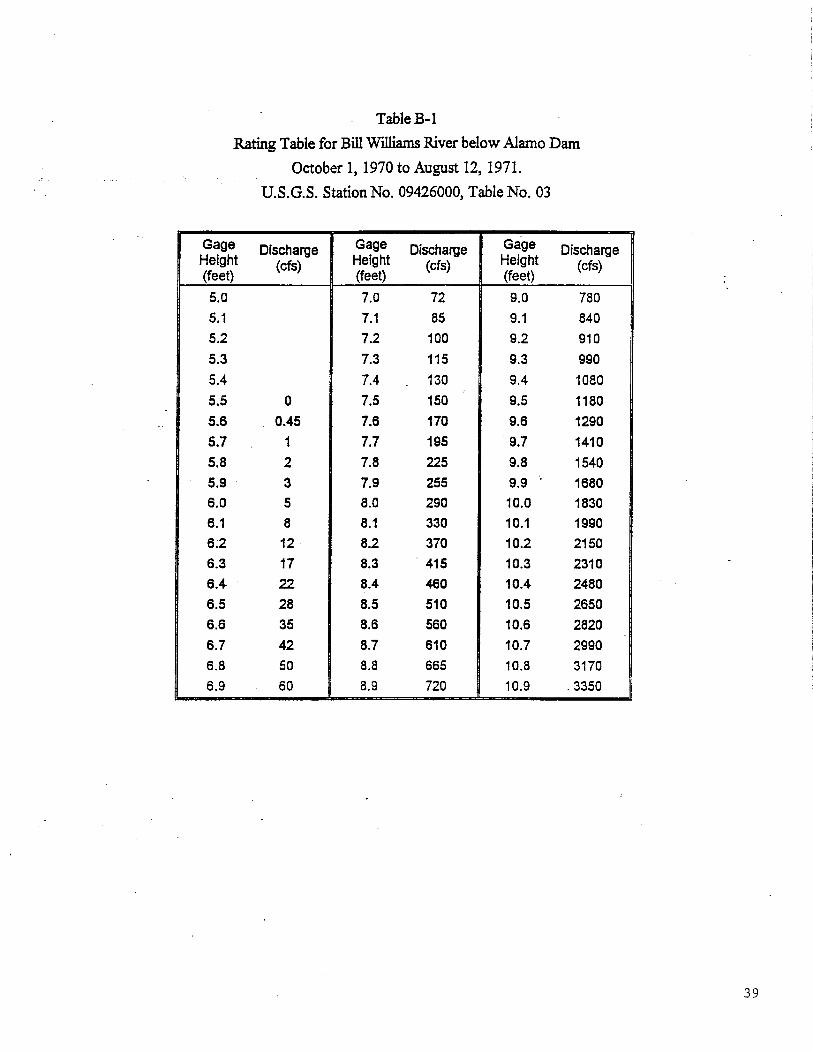
Table B-1
Rating Table for Bill Williams River below Alamo Dam
October 1, 1970 to August 12, 1971.
U.S.G.S. Station No. 09426000, Table No. 03
Gage Discharge Gage Discharge Gage Discharge Height (cfs) Height (cfs) Height (cfs) (feet) (feet) (feet)
5.0 7.0 72 9.0 780 5.1 7.1 85 9.1 840 5.2 7.2 100 9.2 910 5.3 7.3 115 9.3 990 5.4 7.4 130 9.4 1080 5.5 0 7.5 150 9.5 1180 5.6 0.45 7.6 170 9.6 1290 5.7 1 7.7 195 9.7 1410 5.8 2 7.8 225 9.8 1540 5.9 3 7.9 255 9.9 ". 1680 6.0 5 8.0 290 10.0 1830 6.1 8 8.1 330 10.1 1990 6.2 12 8.2 370 10.2 2150 6.3 17 8.3 - 415 10.3 2310 6.4- 22. 8.4 460 10.4- 2480 6.5 28 8.5 510 10.5 2650 6.6 35 8.6 560 10.6 2820 6.7 42 8.7 610 10.7 2990 6.8 50 8.8 665 10.8 3170 6.9 60 8.9 720 10.9 " 3350
39
+:o
Table B-2. Time periods of stage-discharge rating data for gages in the Bill Williams River Basin: [Dates listed below indicate the beginning date of the period for which each rating table was used.]-
Bill Williams River· )\ ,-
Big Sandy River I Santa Maria River ;:
Rating I Near Alamo Below Alamo Dam Near Parker At Planet Near Wikieup . Near Bagdad No. #09426000 #09426620 #09426500 #09424450 .;, _ #09424900
1937-68 1968-95 1988-95· 1929-46 1966-95 1967-85 & 1989-95
1.1 10-1-56 4-9-68 10-1-84 09-30-46 * 4-18-66
2 . 3-17-58 1-1-69 10-1-85 * *. .......................................................................... u ........... + .................................................................... 1 ......................................................... ·1 .......................................................................... : ......................................... _ ....................................... .
3. 13-22-54 to 8-1-64 1 10-1-70 10-1-86 10-1-70 * 4. I 4-14-59 to 8-1-64 2 8-12-71 3-1-88 * * 5. 10-6-72 10-1-89 * 1-08-93 to present
6. 2-5-80 4-17-91 * 7. 3-3-80 4-15-92 3-18-83
8. 10-1-83 6-24-93 * 9. 10-1-92 3-30-94 to present *
10. 4-16-93 1-8-93 to present
11. 2-16-95 to present
I Rating curve for this peri~d was developed from measurements recorded by a supplemental gage.
2 Rating curve for this period was developed from measurements recorded by both the supplemental gage and the main gage. * These rating data are located at the u.s. Geological Survey's national archive.
We entered the data from the rating curves and rating tables into a computer spreadsheet.
Because it is common for a discharge of zero not to correspond to a stage of zero, we subtracted
the stage that corresponds to zero flow from all of the stage values for a given record so that
water depth, not stage height, would be compared to discharge. We then plotted the data as ,
curves using an arithmetic scale, rather than as straight lines on a log-log scale, to make the
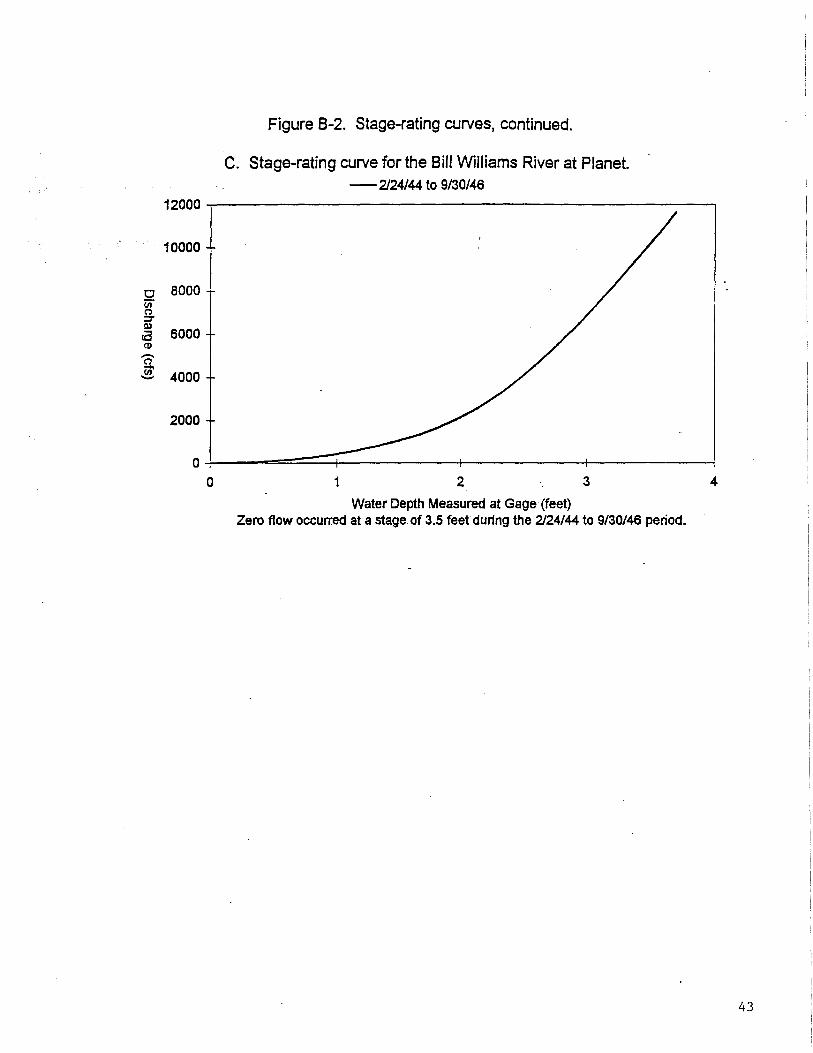
graphs easier to read. Figure B-2 illustrates how the stage-discharge relationships at different
gages on the Bill Williams River have changed over time. Figure B-3 provides enlargements of
the curves presented in Figure B-2 that better show the stage-discharge relationships for lower
stage heights.
The following is an example of how to extract information from the rating curves. Table 2
indicated that the Bill Wtlliams River gage below Alamo Dam experienced a daily discharge mean
of 160 cfs for the post-dam period of 1968 to 1995. Figure B-4 contains an enlarged illustration
of the rating-curve used for the period October 1, 1970, to August 12,. 1971. According to this
rating curve, a discharge of 160 cfs would have a corresponding water depth of approximately
2 feet.
The earliest rating tables we retrieved from the USGS date to the 1940's and 1950's.
Because of the multitude of channel changes that have occurred on the Bill Wtlliams River, and
because of the effects of the Alamo Dam, the reader is advised not to use the 1950's curves to
determine the water depths corresponding to earlier discharges presented in this report except to
get very rough estimates. Table B-3 provides a comparison of the estimated water depth and
discharge values extracted from the stage-rating curves of the gages at Planet, near Alamo, and
below Alamo Dam.
41
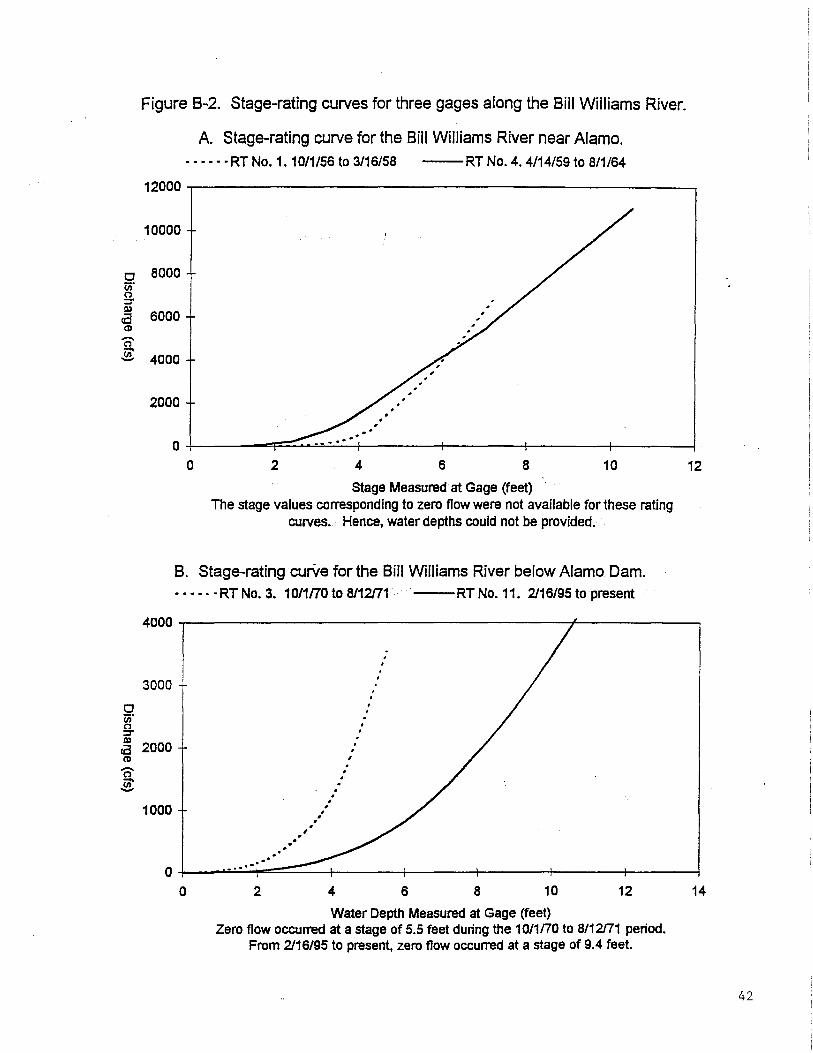
Figure B-2. Stage-rating curves for three gages along the Bill Williams River.
A Stage-rating curve for the Bill Williams River near Alamo. - 0 0 0 0 0 RT No.1. 10/1/56 to 3/16/58 --RT No.4. 4114/59 to 8/1/64
12000.------------------------------------------------~
10000
c 8000 iii" C') ;;;r
ca 6000 (1)
e;-.g 4000
2000
O+-------~~~~~------~r_------+_------_r------~
o iii' £.
o 2 4 6 8 10
stage Measured at Gage (feet) The stage values corresponding to zero flow were not available for these rating
curves.. Hence, water depths could not be provided.
B. Stage-rating curVe for the Bill Williams River below Alamo Dam. 0000. oRT NO.3. 10/1flO to 8/12n1 --RT No. 11. 2116/95 to present
12
4000.---------------------------------------~----------~
3000
. . . . .
. . . . .
ca 2000 . . , (1)
e;.g
1000
.. ' .. -" .
. . . . . . . . . . .. '
O+-__ ~·o~.~o~~~~------~----_+------+_----~------~ a 2 4 6 8 10 12 14
Water Depth Measured at Gage (feet) Zero flow occurred at a stage of 5.5 feet during the 1 0/1 flO to 8112n1 period.
From 2116/95 to present, zero flow occurred at a stage of 9.4 feet.
42
12000
10000
0 8000 (ji" n =r II)
6000 ca (1)
...... n (jj' - 4000
2000
0 0
c.
Figure B-2. Stage-rating curves, continued.
Stage-rating curve for the Bill Williams River at Planet. -2124/44 to 9130146
1 2 3
Water Depth Measured at Gage (feet) Zero flow occurred at a stage of 3.5 feet during the 2124/44 to 9/30/46 period.
4
43
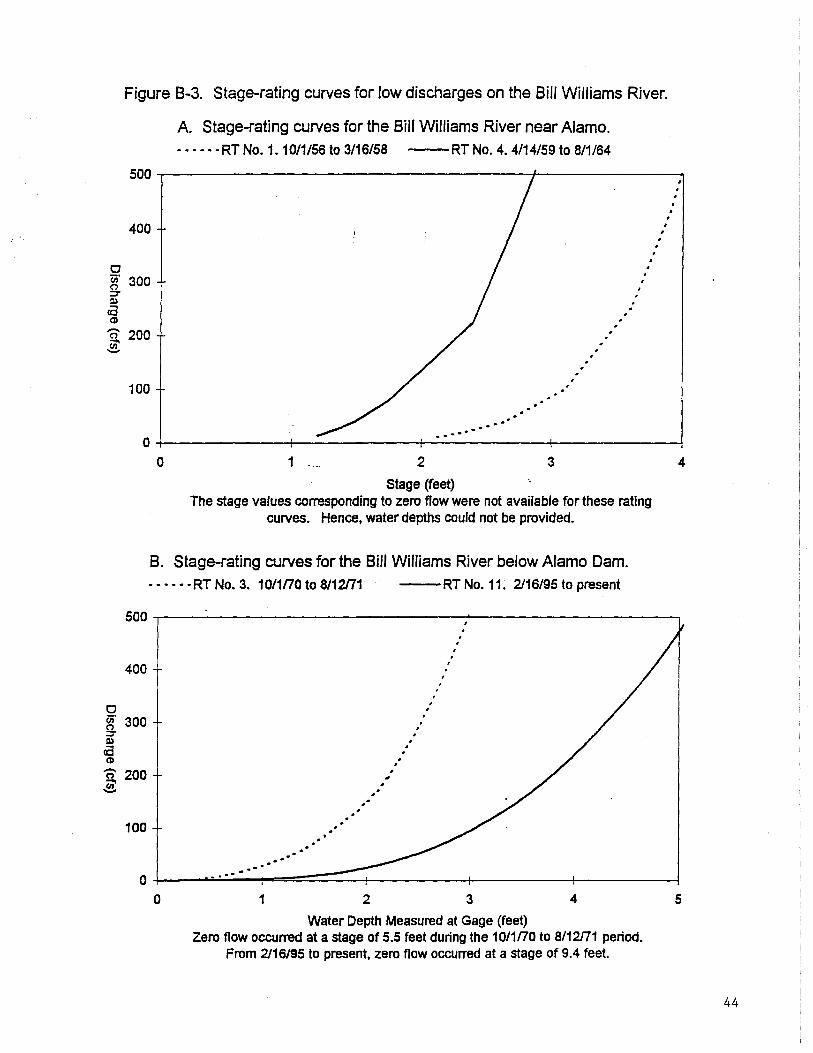
Figure B-3. Stage-rating curves for low discharges on the Bill Williams River.
A. Stage-rating curves for the Bill Williams River near Alamo. •...• ·RT No. 1.1011/56 to 3/16/58 --RT NO.4. 4/14/59 to 8/1164
500~-------------------------------------+--------------~
400
o (ii' 300 g. III
a Ol
n 200 i.ii' ......
100 I'
I
I
I . I
I
I
I
I
I
:
I
I
I
I I
I
I I
I
, , , , , I ,
O+-------------r-----------~------------~------------~ o 1 .... 2 3
Stage (feet) The stage values corresponding to zero flow were not available for these rating
curves. Hence, water depths could not be provided.
B. Stage-rating curves for the Bill Williams River below Alamo Dam. ••••• ·RT No.3. 1011170 to 8/12n1 --RT No. 11. 2116/95 to present
4
500~------------------------------~--------------------~
400
o (ii' 300 g. III a Ol
'C) 200 $
100
.. .. ' 0+---~~·~·-~~~~~~--------+_------_4--------~
o 1 2 3 4 5
Water Depth Measured at Gage (feet) Zero flow occurred at a stage of 5.5 feet during the 1011170 to 8112171 period.
From 2116/95 to present, zero flow occurred at a stage of 9.4 feet.
44
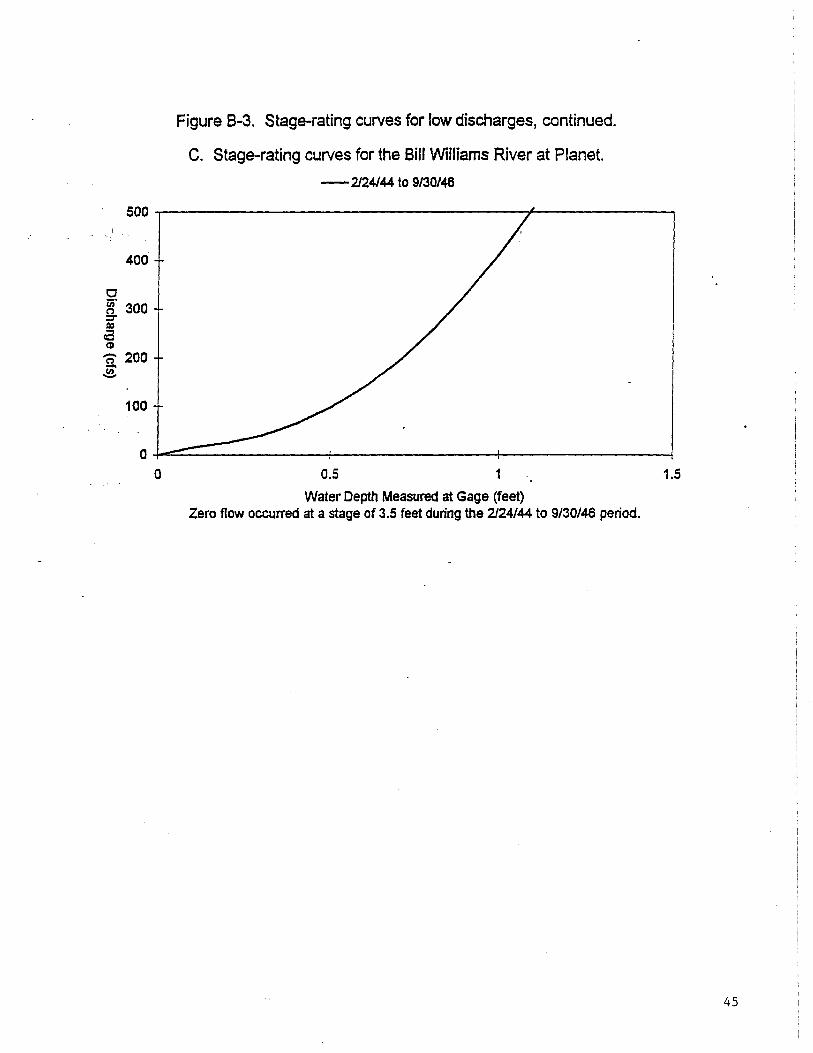
Figure 8-3. Stage-rating curves for low discharges, continued.
C. Stage-rating curves for the Bill Williams River at Planet.
- 2124/44 to 9130148
500
400
c ~. 300 =:r 0)
c3 ClI
1l 200 .!!!.
100
0 0 0.5 1 1.5
Water Depth Measured at Gage (feet) Zero flow occurred at a stage of 3.5 feet during the 2124/44 to 9130/46 period.
45
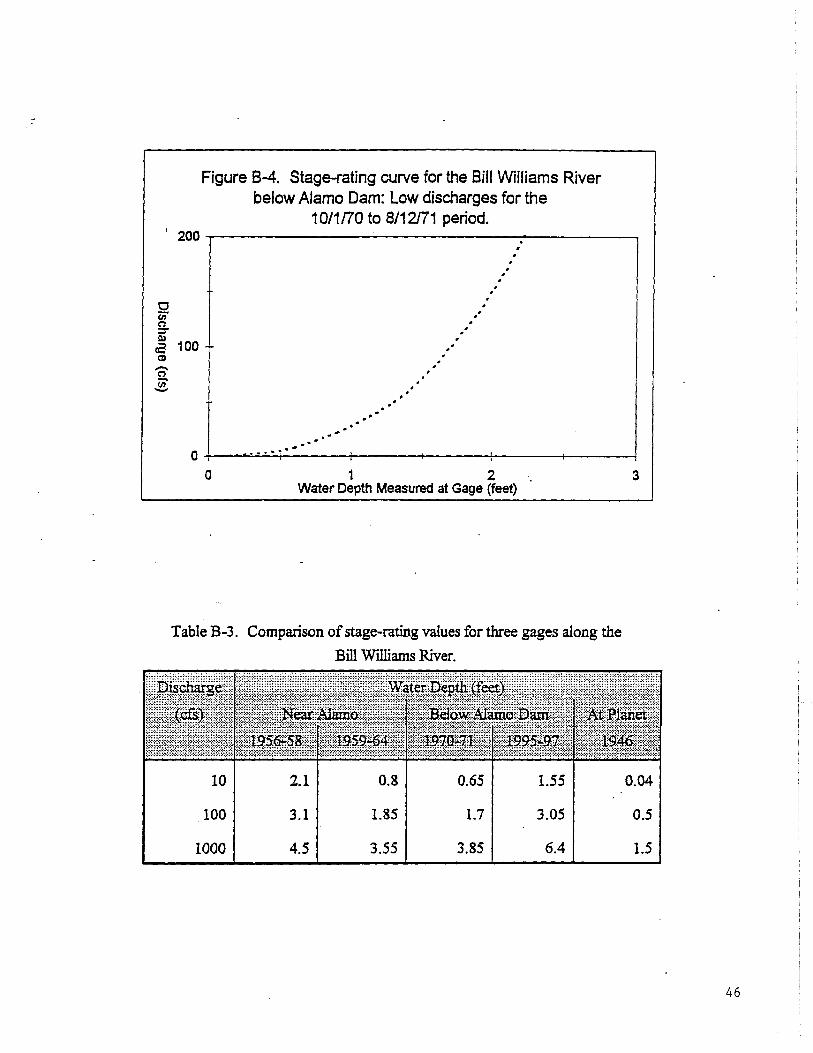
Figure 8-4. Stage-rating curve for the Bill Williams River below Alamo Dam: Low discharges for the
10/1[70 to 8/12171 period . . ' 200~------------------------------.----------~ .
o Cii C') ::r ca 100 ell
'2 en' -
.. . '
. " ."
. . . . . .
. . . . . . . . . . .
. . . .
O+-~~~·~·-··----~-------r------r------+----~ o 1 2
Water Depth Measured at Gage (feet)
Table B-3. Comparison of stage-rating values for three gages along the
Bill Williams River.
10
100
1000
2.1
3.1
4.5
0.8
1.85
3.S5
0.65
1.7
3.85
1.55
3.05
6.4
3
0.04
0.5
1.5
46