Embed Size (px)
Citation preview
Hypothesis TestingChapter 10
What is the process that determines whether or not your hypothesis
regarding data is an accurate one?
Hypothesis and Test procedures 10.1
• What are the hypothesis and alternate for an event?
• Hypothesis—a claim about a population statistic
• Test of the hypothesis (test procedure)—a method for using sample data to decide between two competing claims the second is the alternate
( , , )
• Null hypothesis—H0
• —the claim initially assumed true
• Alternate hypothesis—Ha
—the competing claim—must have same value, but different
inequality and be a population statistic
since Ho —hypothesized value (given)Ha must be > H0 or < H0 or ≠ H0
• Ho is rejected in favor of Ha iff evidence suggests H0 is false
• You can only demonstrate strong support for Ha by rejecting H0
• NOT rejecting H0 does NOT mean strong support for Ho just a lack of support for Ha
Example 1
• K mart brand 60 watt lightbulbs state on the package, “Ave. life 1000 hrs.”
• Let µ denote the true mean life of the Kmart 60 watt bulb.
• People would be upset if µ were less than 1000• Therefore we test Ho = 1000 vs. Ha <1000
• HW Pg 481-482 10.1, 2, 4, 6, 8
Errors in Hypothesis testing10.2
• What types of errors exist in hypothesis testing?
• Type I error—rejecting H0 when H0 is true
• Type II error—failing to rejecting H0 when H0 is false
• The only way to be certain an error will not occur is work with the entire population.
Level of significance• =the probability of a type I error – % of time it is “ok” to reject H0 when it is true
• =the probability of a type II error – % of time you fail to reject H0 when it is false
• An ideal test has = =0
• You can control , you can not control– sometimes if you make too small it makes
larger than it needs to be

• Typical ‘s• .01—used when it is for health reasons or
major legal battles• .05—the default value• .1—when you are just curious
Example 1
• A type of lie detector that measures brain waves was developed by a professor of neurobiology at Northwestern University. He said, “it would probably not falsely accuse any innocent people and it would probably pick up 70-90% of guilty people.” Suppose this lie detector test is allowed as evidence and is the sole basis of a decision between the two hypotheses: (not a true test)
• What are the hypotheses?• H0 = accused is innocent• Ha = accused is guilty (technically is not innocent)
• What would happen if a type I error occurred?• an innocent person would be found guilty
• What would happen if a type II error occurred?• a guilty person would be found innocent
Example 2
• The Associated Press reported that the EPA had warned 819 communities that their tap water contained too much lead. Drinking water is considered unsafe if the mean concentration of lead is 15 parts per billion or greater. The EPA required the cited communities to take corrective action and to monitor lead levels.
• What are the hypothesis:• H0 : µ=15 (the lead levels are 15 parts or higher)• Ha : µ<15 (the lead levels are acceptable)• What happens for type I and II errors:• Type I it meets the standards when it doesn’t (reject H0 when its true)
Type II it doesn’t meet the standards when it does(failing to reject H0 when false)• What are the consequences of each type of error?
Type I—possible health risksType II—the elimination of a public water source
What alpha level would you choose and why?.01—to eliminate health issues associated with lead
• What if the community only has one water source?• would an alpha of .05 then become acceptable???????
• HW PG 486-488 10.10, 11, 12, 14, 18
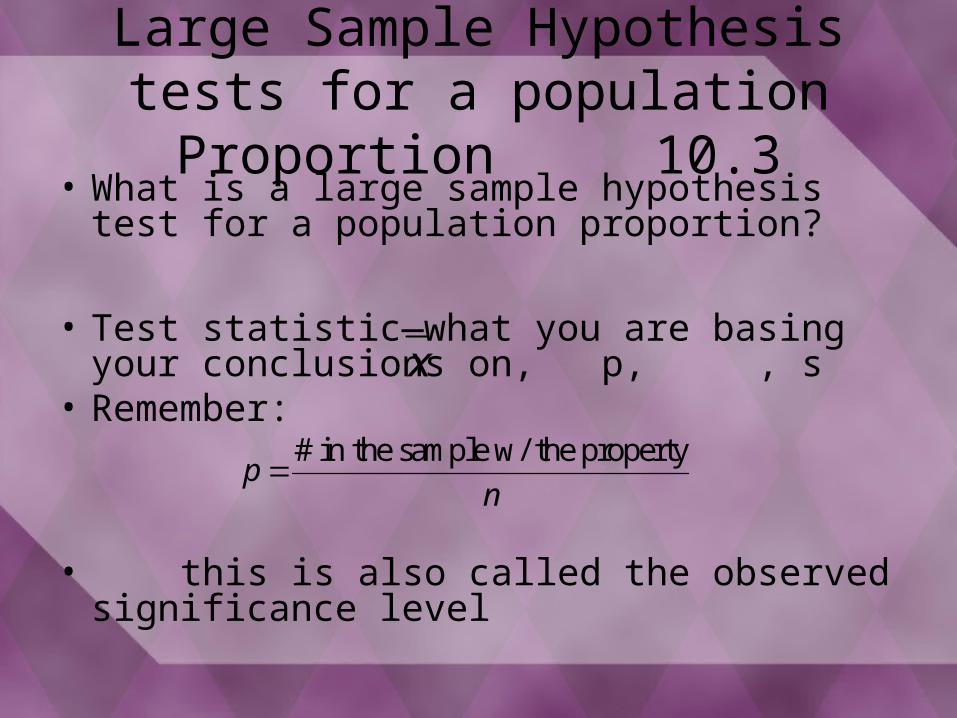
Large Sample Hypothesis tests for a population Proportion 10.3
• What is a large sample hypothesis test for a population proportion?
• Test statistic—what you are basing your conclusions on, p, , s
• Remember:
• this is also called the observed significance level
x
# in the sample w/ the propertyp
n
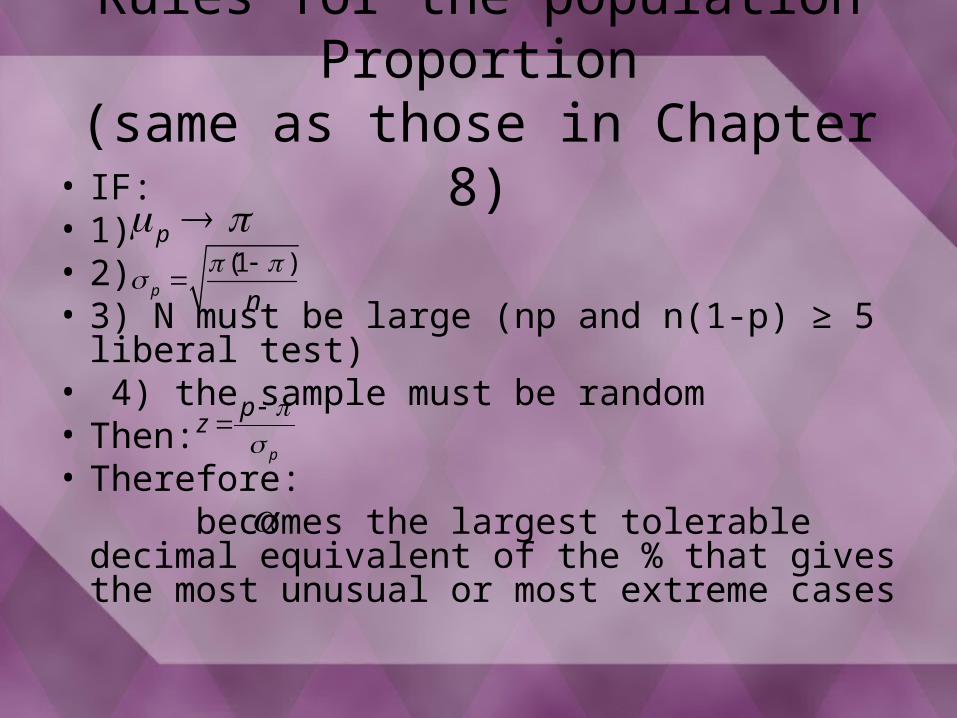
Rules for the population Proportion(same as those in Chapter 8)
• IF:• 1)• 2)• 3) N must be large (np and n(1-p) ≥ 5 liberal test)• 4) the sample must be random• Then: • Therefore:
becomes the largest tolerable decimal equivalent of the % that gives the most unusual or most extreme cases
p (1 )
p n
p
pz
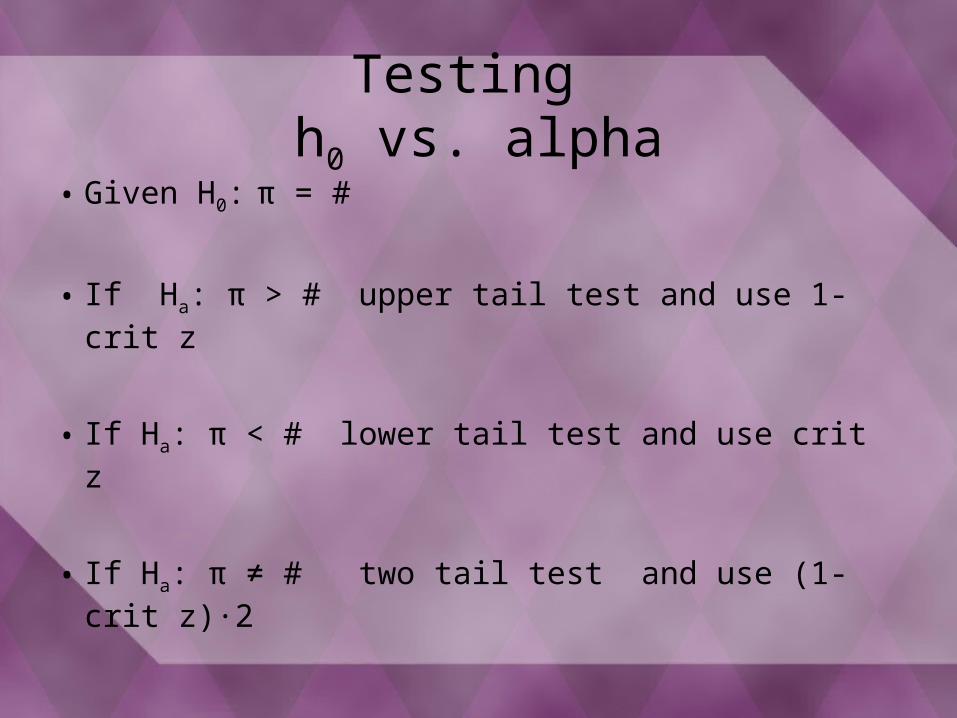
Testing h0 vs. alpha
• Given H0: π = #
• If Ha: π > # upper tail test and use 1- crit z
• If Ha: π < # lower tail test and use crit z
• If Ha: π ≠ # two tail test and use (1-crit z) 2∙
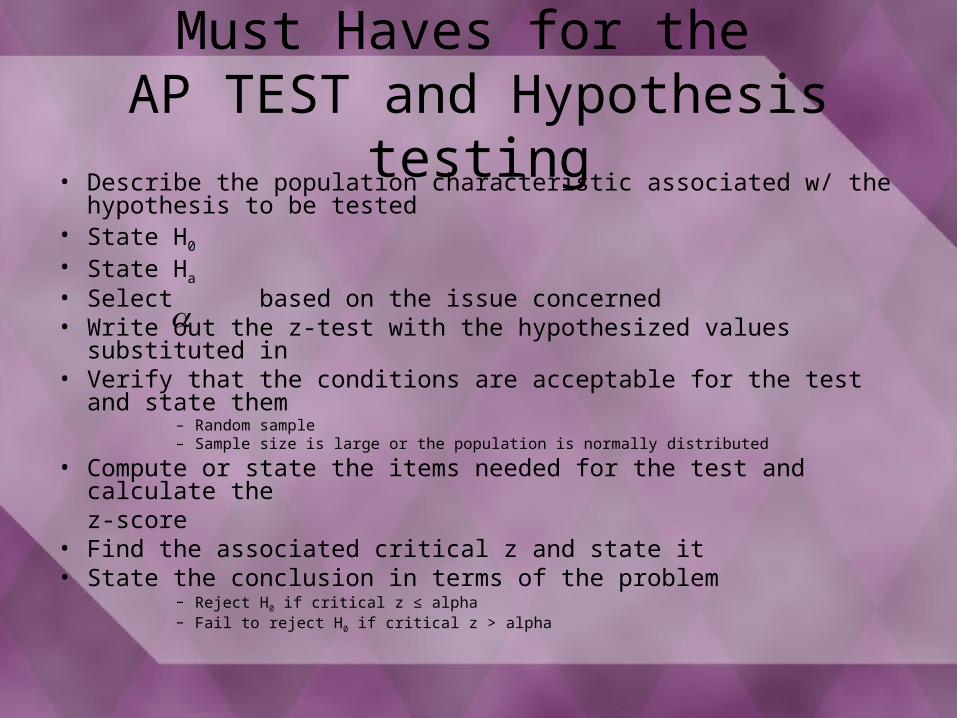
Must Haves for the AP TEST and Hypothesis testing
• Describe the population characteristic associated w/ the hypothesis to be tested
• State H0
• State Ha
• Select based on the issue concerned • Write out the z-test with the hypothesized values substituted in• Verify that the conditions are acceptable for the test and state them
– Random sample– Sample size is large or the population is normally distributed
• Compute or state the items needed for the test and calculate the z-score
• Find the associated critical z and state it• State the conclusion in terms of the problem
– Reject H0 if critical z ≤ alpha– Fail to reject H0 if critical z > alpha

Example• An article on Credit Cards and College students describes the study of
payment practices of college students. According to the credit industry, 50% of the college students carry a monthly balance. The Authors randomly polled 310 college students and found 217 carried a balance. Does the sample provide evidence to reject the industries claim to a significance of .05?
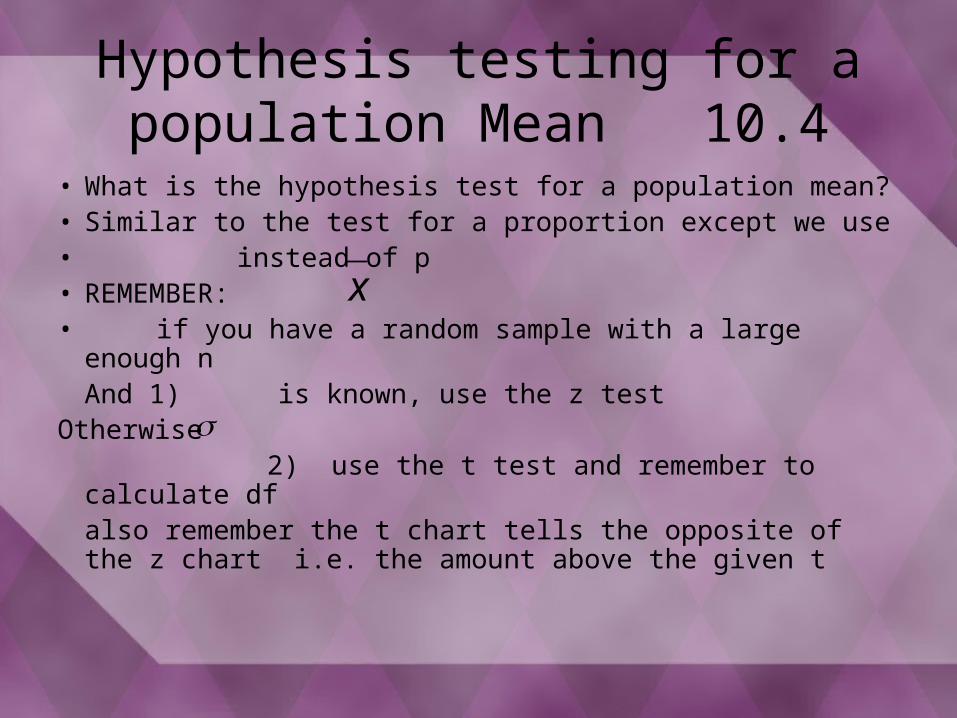
Hypothesis testing for a population Mean 10.4
• What is the hypothesis test for a population mean?• Similar to the test for a proportion except we use• instead of p• REMEMBER:• if you have a random sample with a large enough
nAnd 1) is known, use the z test
Otherwise 2) use the t test and remember to calculate df
also remember the t chart tells the opposite of the z chart i.e. the amount above the given t
x
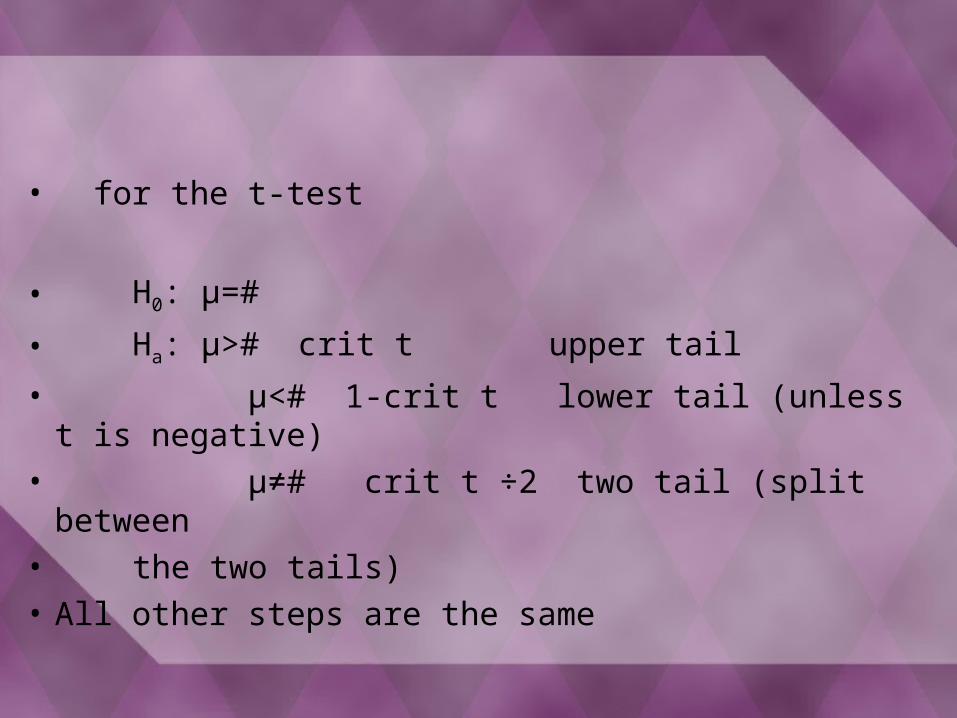
• for the t-test
• H0: µ=#
• Ha: µ># crit t upper tail
• µ<# 1-crit t lower tail (unless t is negative)• µ≠# crit t ÷2 two tail (split between • the two tails)• All other steps are the same

ExamplePg 507 Speed, size, and strength are thought to be important factors in football
performance. When the top 20 Division I teams were evaluated it was found that the mean weight of starters was 105 kg. A random sample of 33 starting players from Division I schools that were not ranked in the top 20 resulted in a mean of 103.3 kg with a sample standard deviation of 16.3 kg. Is there sufficient evidence to conclude that the mean weight for non-top 20 starters is less than 105, the known value for the top 20 teams?
• Statistical significance occurs when the value of p or leads to the rejection of H0 at a particular level of alpha
• HW pg 513-516 40, 44, 48, 52, 55(show the work)
x
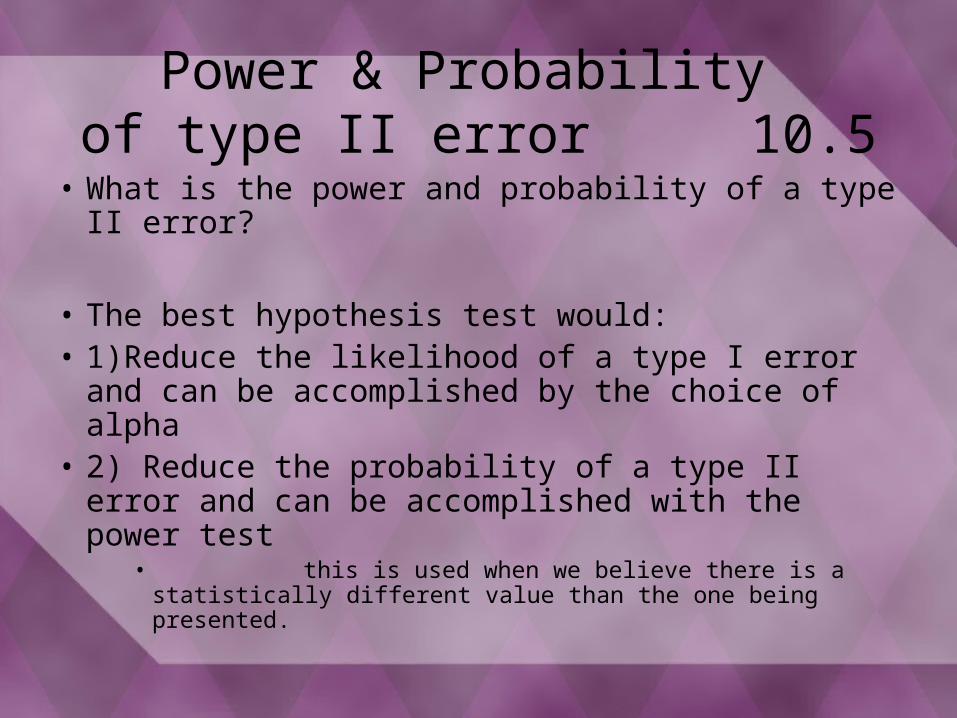
Power & Probability of type II error 10.5
• What is the power and probability of a type II error?
• The best hypothesis test would:• 1)Reduce the likelihood of a type I error and can
be accomplished by the choice of alpha• 2) Reduce the probability of a type II error and
can be accomplished with the power test• this is used when we believe there is a
statistically different value than the one being presented.
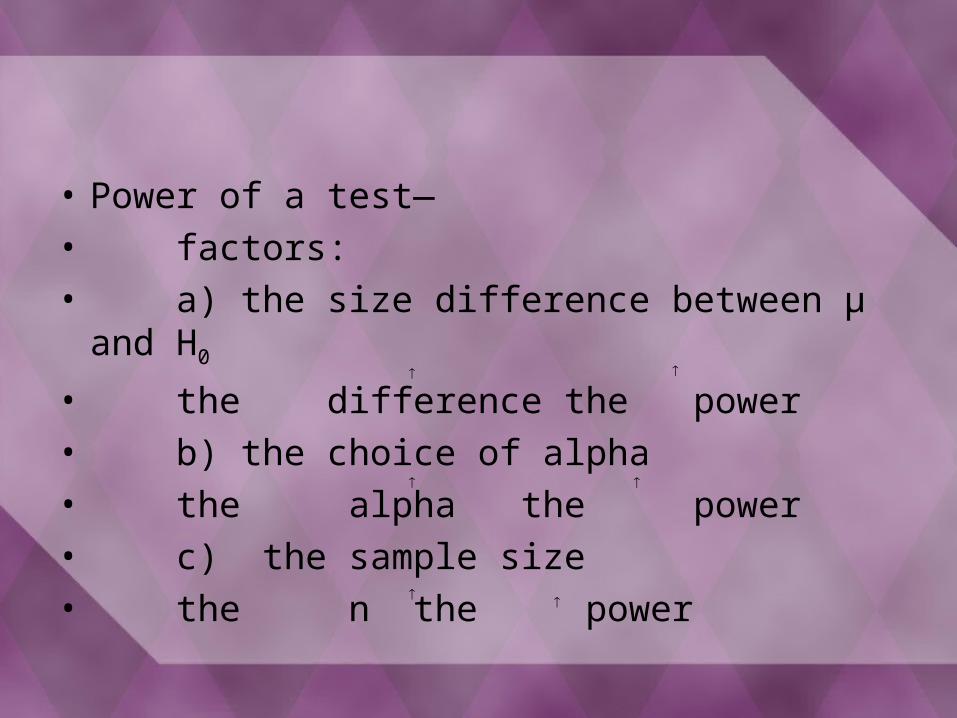
• Power of a test—• factors:• a) the size difference between µ and H0
• the difference the power • b) the choice of alpha• the alpha the power• c) the sample size• the n the power

Since power = prob of rejecting a false H0
= not rejecting a false H0
power = 1-
So how do we find the powersubstitute z in by looking up z=1-
and solve for
Insert the value we think is true for µ and re-solve for z, =this crit z
The power test for a t-test is optional
xz
n
x
ExampleA package delivery service advertises that at least 90% of all packages brought to its office by 9 A.M. for delivery in the same city are delivered by noon that day. Let π denote the proportion of all such packages actually delivered by noon.
The hypotheses of interest are π = on time deliveries
H0: π = .9Ha: π < .9
Where the alternative hypothesis states that the company’s claim is untrue. In random sampling 225 packages delivered, 180 arrived on time.The value of π= .8 represents a substantial departure from the company’s claim. If the hypotheses are tested at level .01 using the sample of n = 225 packages, what is the probability that the departure from H0 represented by this alternative value will go undetected?

Determining Power
1) π = on time deliveries2) Ho: π = .93) Ha: π < .94) 5) We have a random sample and a
large # sampled6) Lower tail test, means
Z = -2.33, n = 225
.01
.92.33
.9 .1
225.0466 .9
.853
p
p
p
7) Since we found π=.8
8) Crit z = = .97679) Power = 1-.9767=.0233
When π=.8 and alpha =.01 then 2.33% of all samples of 225 will result in a type two error therefore, we do not have a great chance of rejecting a false H0
.853 .81.99
.8 .2225
z

Verifying the power test
• We found
• So crit z = 0• Since crit z < alpha we reject H0
• Which means our data supports a different H0 (and we are 97.67% confident that we are correct—last slide)
• HW pg 525-536 56, 58, 59 show all work
.8 .9 .15
.2.9 .1225
z

REVIEWChapter 10
• HW Page 529-530 63, 64, 65, 68, 70, 72, 75