Embed Size (px)
Citation preview
Hypothesis Testing for the Mean (Large Samples)
1
Section 7.2
Section 7.2 Objectives
2
Find P-values and use them to test a mean μ
Use P-values for a z-testFind critical values and rejection regions in
a normal distributionUse rejection regions for a z-test
Using P-values to Make a Decision
3
Decision Rule Based on P-valueTo use a P-value to make a conclusion in a
hypothesis test, compare the P-value with .1. If P , then reject H0.
2. If P > , then fail to reject H0.
Example: Interpreting a P-value
4
The P-value for a hypothesis test is P = 0.0237. What is your decision if the level of significance is1.0.05?
2.0.01?
Solution:Because 0.0237 < 0.05, you should reject the null hypothesis.
Solution:Because 0.0237 > 0.01, you should fail to reject the null hypothesis.
Finding the P-value
5
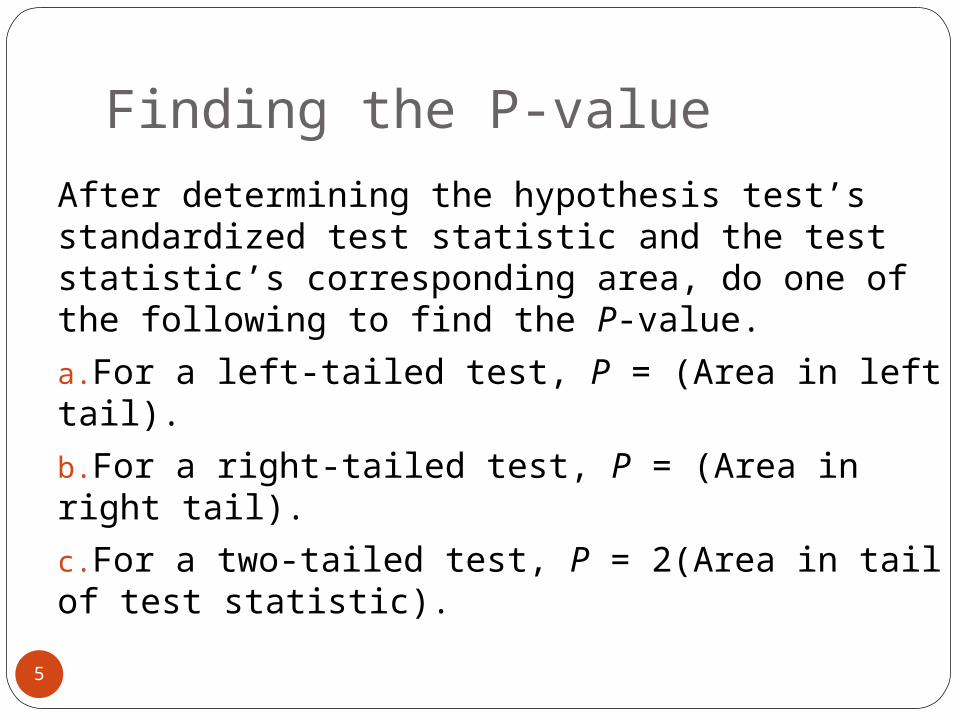
After determining the hypothesis test’s standardized test statistic and the test statistic’s corresponding area, do one of the following to find the P-value.
a.For a left-tailed test, P = (Area in left tail).
b.For a right-tailed test, P = (Area in right tail).
c.For a two-tailed test, P = 2(Area in tail of test statistic).
Example: Finding the P-value
6
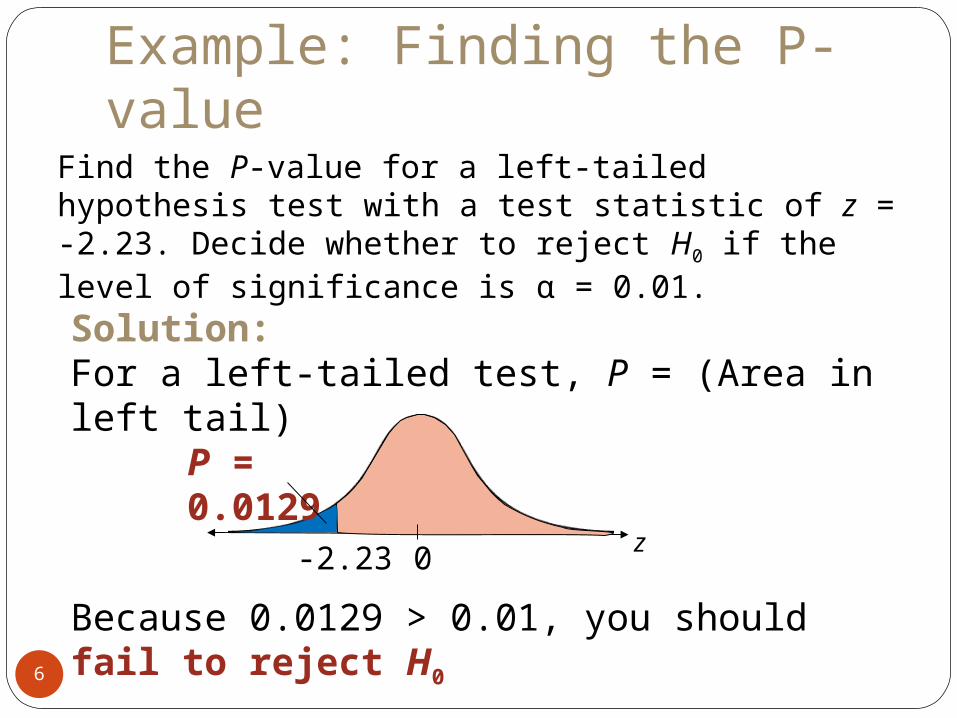
Find the P-value for a left-tailed hypothesis test with a test statistic of z = -2.23. Decide whether to reject H0 if the level of significance is α = 0.01.
z0-2.23
P = 0.0129
Solution:For a left-tailed test, P = (Area in left tail)
Because 0.0129 > 0.01, you should fail to reject H0
z0 2.14
Example: Finding the P-value
7
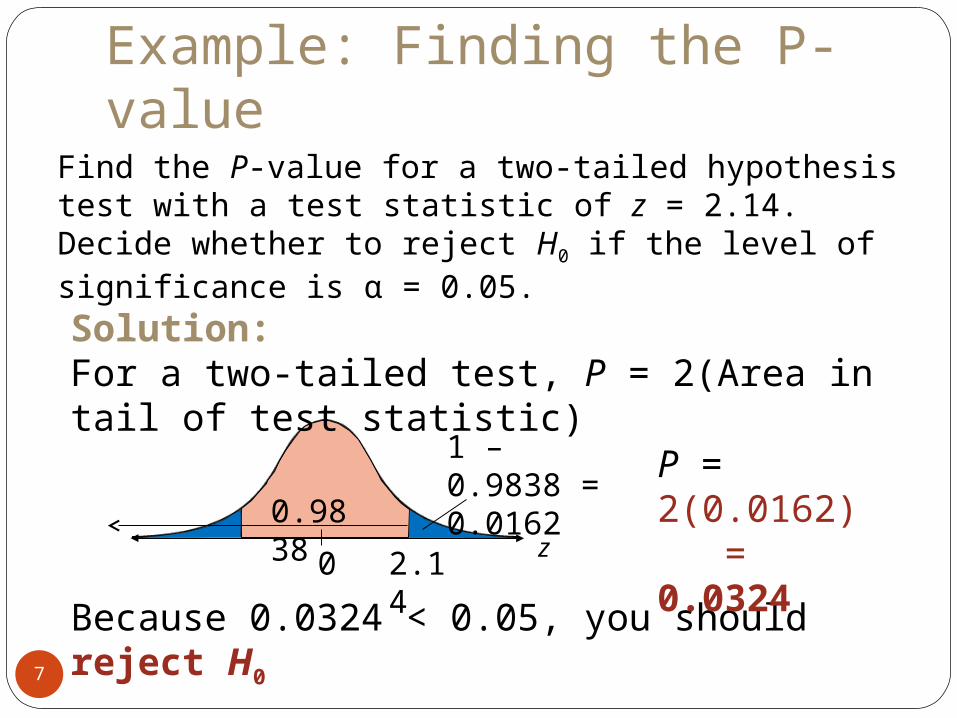
Find the P-value for a two-tailed hypothesis test with a test statistic of z = 2.14. Decide whether to reject H0 if the level of significance is α = 0.05.
Solution:For a two-tailed test, P = 2(Area in tail of test statistic)
Because 0.0324 < 0.05, you should reject H0
0.9838
1 – 0.9838 = 0.0162
P = 2(0.0162) = 0.0324
Z-Test for a Mean μ
8
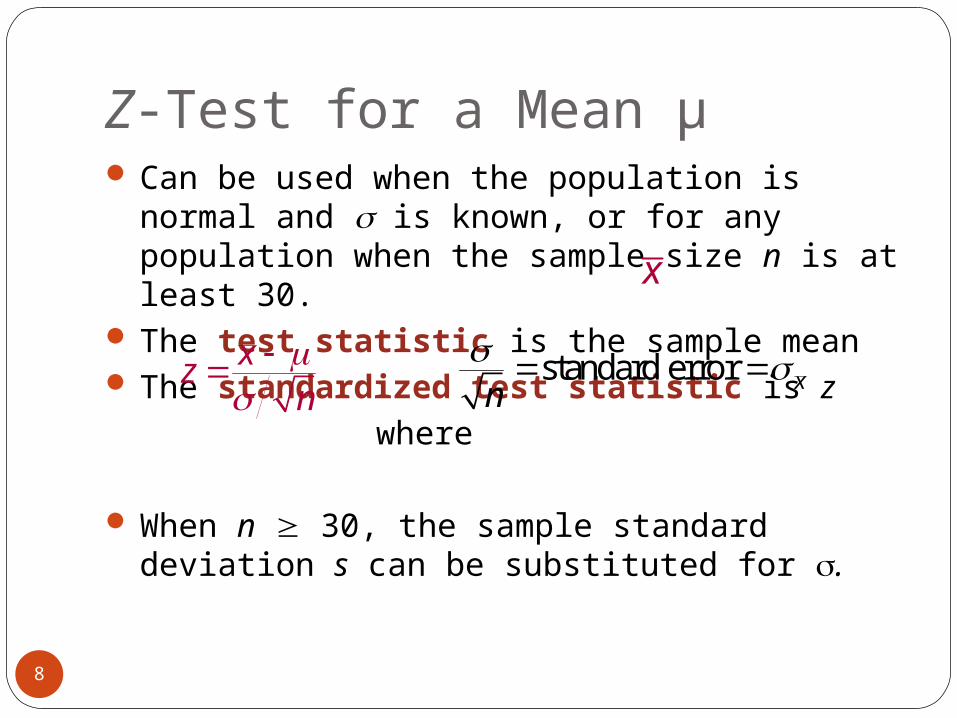
Can be used when the population is normal and is known, or for any population when the sample size n is at least 30.
The test statistic is the sample mean The standardized test statistic is z where
When n 30, the sample standard deviation s can be substituted for .
xzn
standard error xn
x
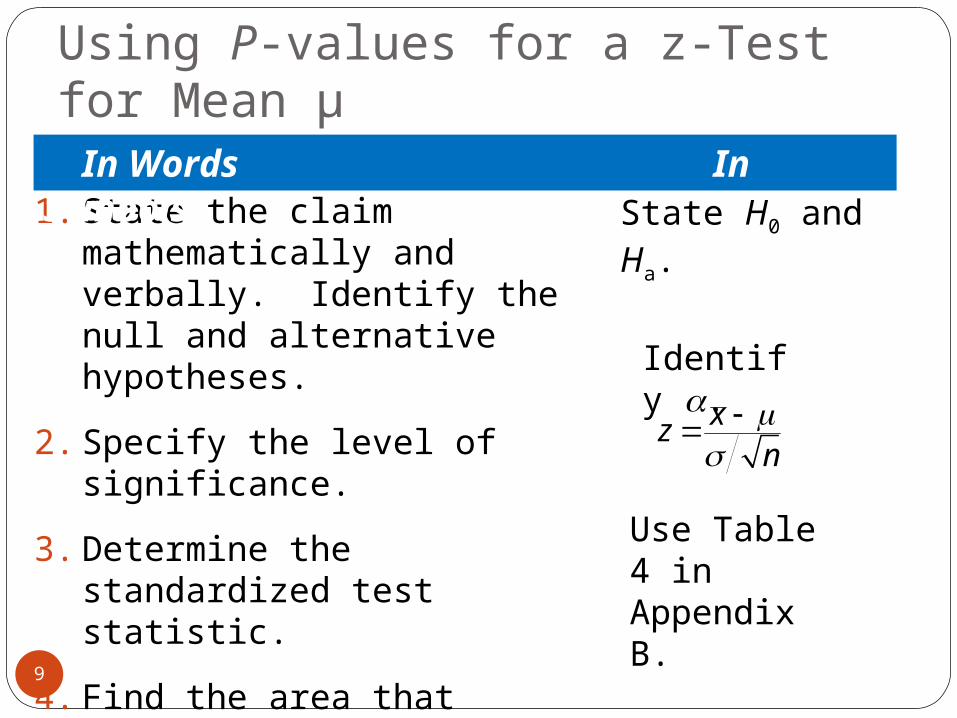
Using P-values for a z-Test for Mean μ
9
xzn
1. State the claim mathematically and verbally. Identify the null and alternative hypotheses.
2. Specify the level of significance.
3. Determine the standardized test statistic.
4. Find the area that corresponds to z.
State H0 and Ha.
Identify .
Use Table 4 in Appendix B.
In Words In Symbols
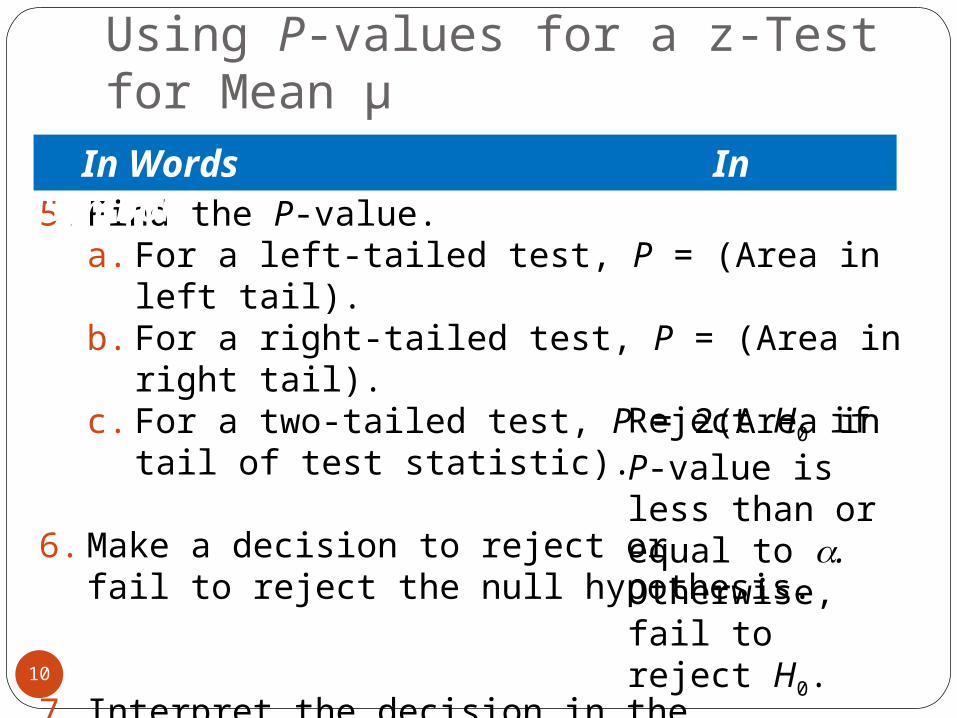
Using P-values for a z-Test for Mean μ
10
Reject H0 if P-value is less than or equal to . Otherwise, fail to reject H0.
5. Find the P-value.a. For a left-tailed test, P = (Area in left tail).b. For a right-tailed test, P = (Area in right tail).c. For a two-tailed test, P = 2(Area in tail of test statistic).
6. Make a decision to reject or fail to reject the null hypothesis.
7. Interpret the decision in the context of the original claim.
In Words In Symbols
Example: Hypothesis Testing Using P-values
11
In an advertisement, a pizza shop claims that its mean delivery time is less than 30 minutes. A random selection of 36 delivery times has a sample mean of 28.5 minutes and a standard deviation of 3.5 minutes. Is there enough evidence to support the claim at = 0.01? Use a P-value.
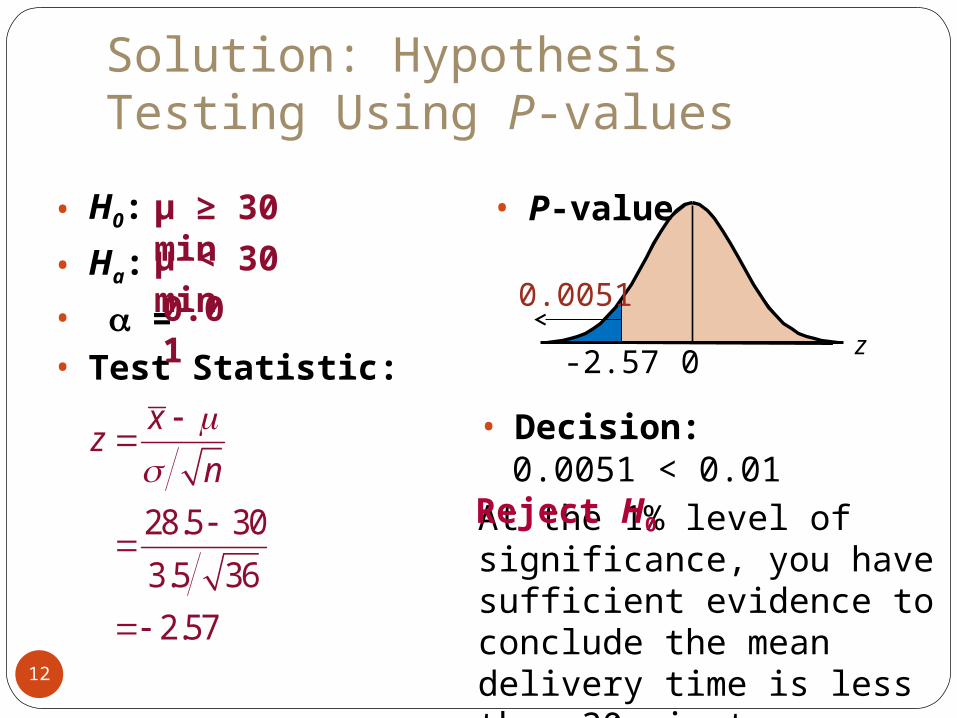
Solution: Hypothesis Testing Using P-values
12
• H0:
• Ha:
• = • Test Statistic:
μ ≥ 30 minμ < 30 min0.01
28.5 30
3.5 36
2.57
xz
n
• Decision:
At the 1% level of significance, you have sufficient evidence to conclude the mean delivery time is less than 30 minutes.
z0-2.57
0.0051
• P-value
0.0051 < 0.01Reject H0
Example: Hypothesis Testing Using P-values
13
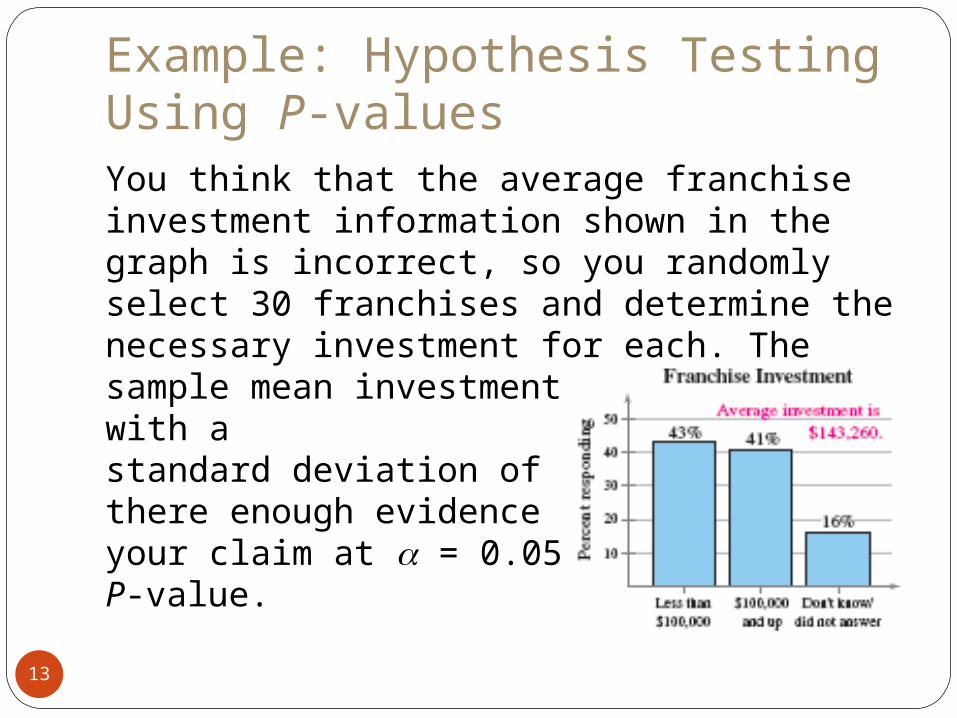
You think that the average franchise investment information shown in the graph is incorrect, so you randomly select 30 franchises and determine the necessary investment for each. The sample mean investment is $135,000 with astandard deviation of $30,000. Is there enough evidence to support your claim at = 0.05? Use a P-value.
Solution: Hypothesis Testing Using P-values
14
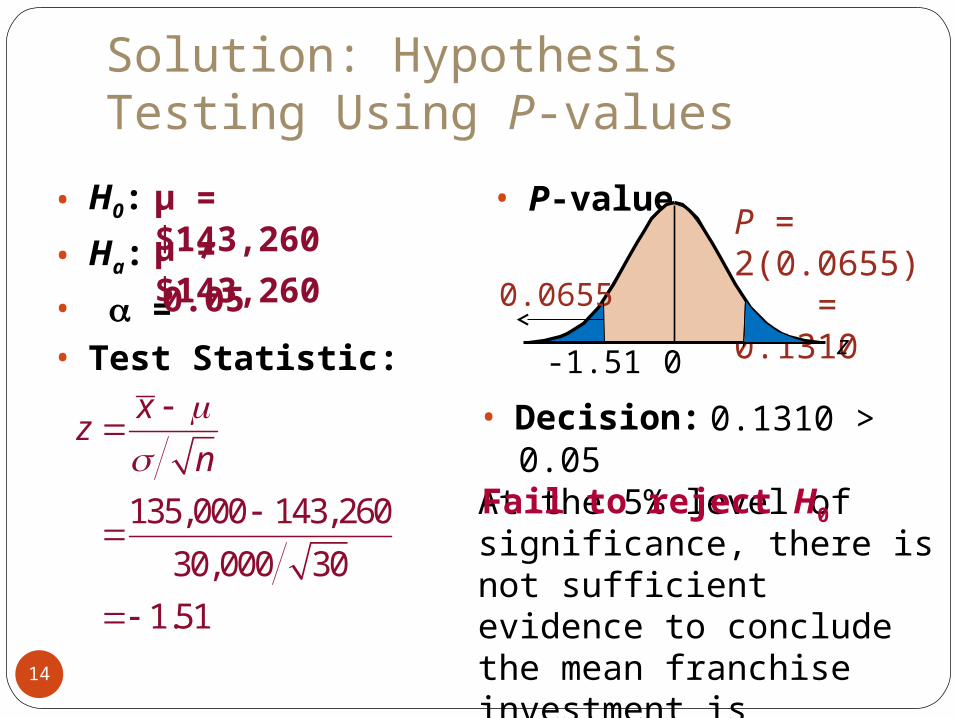
• H0:
• Ha:
• = • Test Statistic:
μ = $143,260μ ≠ $143,2600.05
135,000 143,260
30,000 30
1.51
xz
n
• Decision:
At the 5% level of significance, there is not sufficient evidence to conclude the mean franchise investment is different from $143,260.
• P-valueP = 2(0.0655) = 0.1310
0.1310 > 0.05
Fail to reject H0
z0-1.51
0.0655
Rejection Regions and Critical Values
15
Rejection region (or critical region) The range of values for which the null
hypothesis is not probable. If a test statistic falls in this region, the null
hypothesis is rejected. A critical value z0 separates the rejection
region from the nonrejection region.
Rejection Regions and Critical Values
16
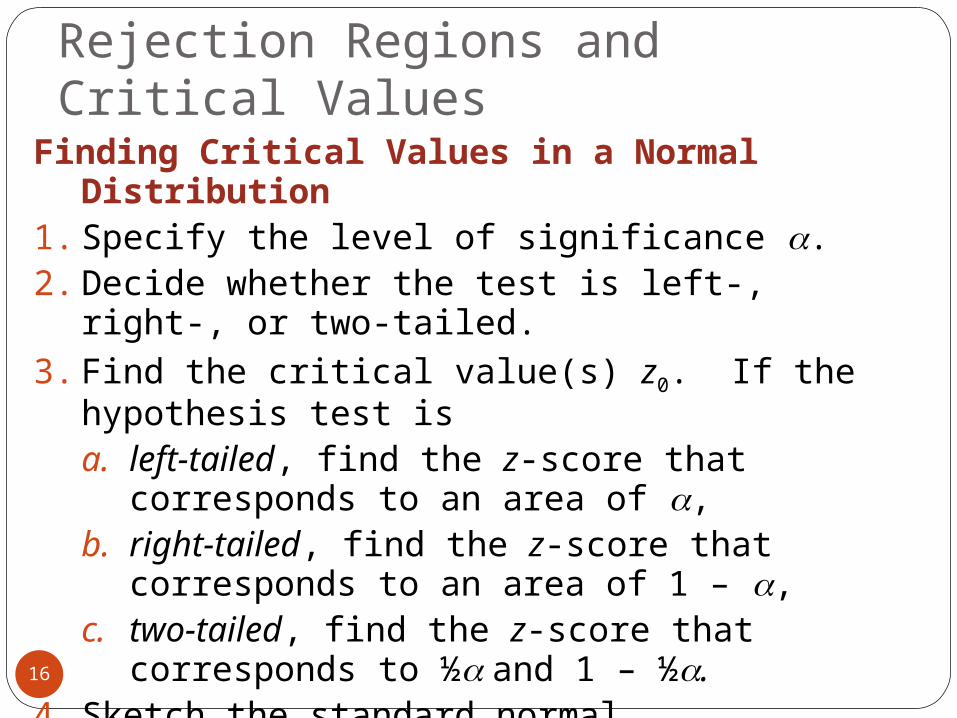
Finding Critical Values in a Normal Distribution1. Specify the level of significance .2. Decide whether the test is left-, right-, or two-tailed.
3. Find the critical value(s) z0. If the hypothesis test is
a. left-tailed, find the z-score that corresponds to an area of ,
b. right-tailed, find the z-score that corresponds to an area of 1 – ,
c. two-tailed, find the z-score that corresponds to ½ and 1 – ½.
4. Sketch the standard normal distribution. Draw a vertical line at each critical value and shade the rejection region(s).
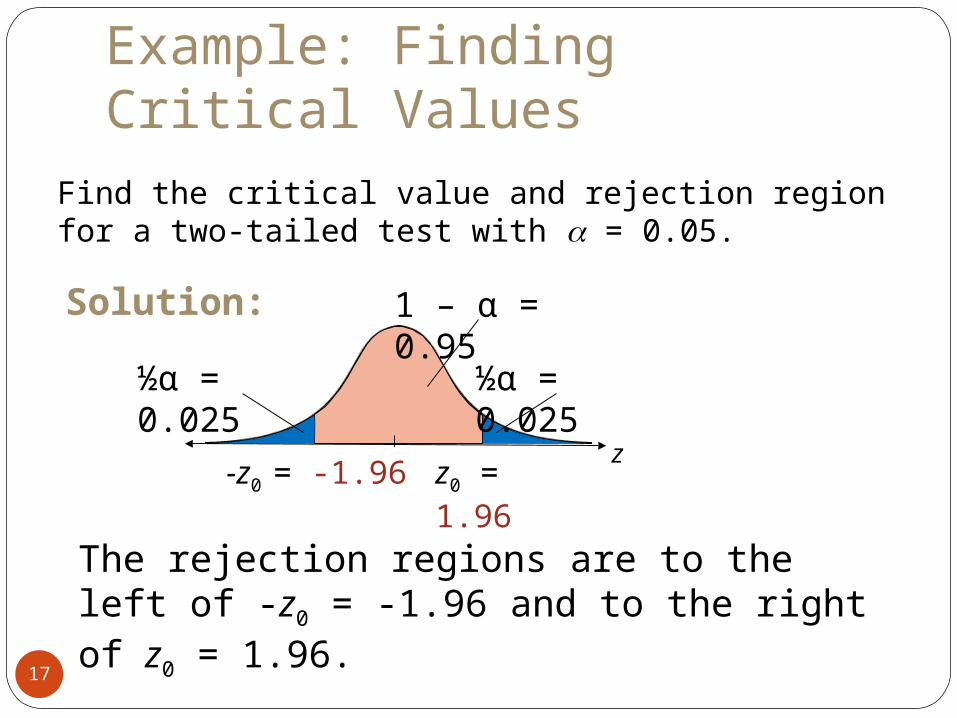
Example: Finding Critical Values
17
Find the critical value and rejection region for a two-tailed test with = 0.05.
z0 z0z0
½α = 0.025 ½α = 0.025
1 – α = 0.95
The rejection regions are to the left of -z0 = -1.96 and to the right of z0 = 1.96.
z0 = 1.96
-z0 = -1.96
Solution:
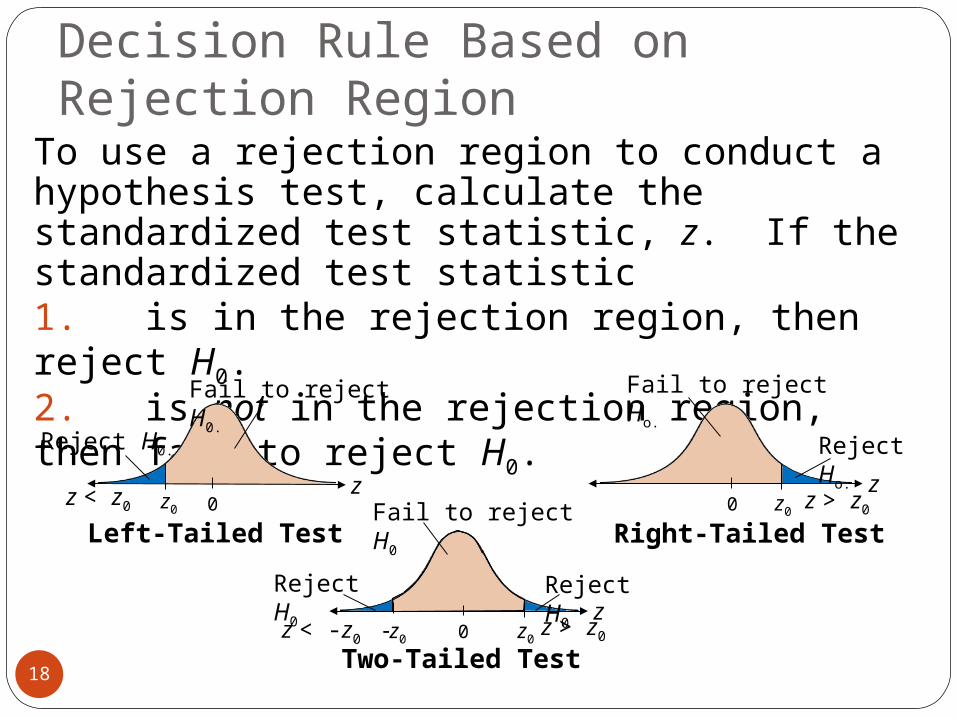
Decision Rule Based on Rejection Region
18
To use a rejection region to conduct a hypothesis test, calculate the standardized test statistic, z. If the standardized test statistic1. is in the rejection region, then reject H0.2. is not in the rejection region, then fail to reject H0.
z0z0
Fail to reject H0.
Reject H0.
Left-Tailed Test
z < z0 z
0 z0
Reject Ho.
Fail to reject Ho.
z > z0
Right-Tailed Test
z0z0
Two-Tailed Testz0z < -z0 z > z0
Reject H0
Fail to reject H0
Reject H0
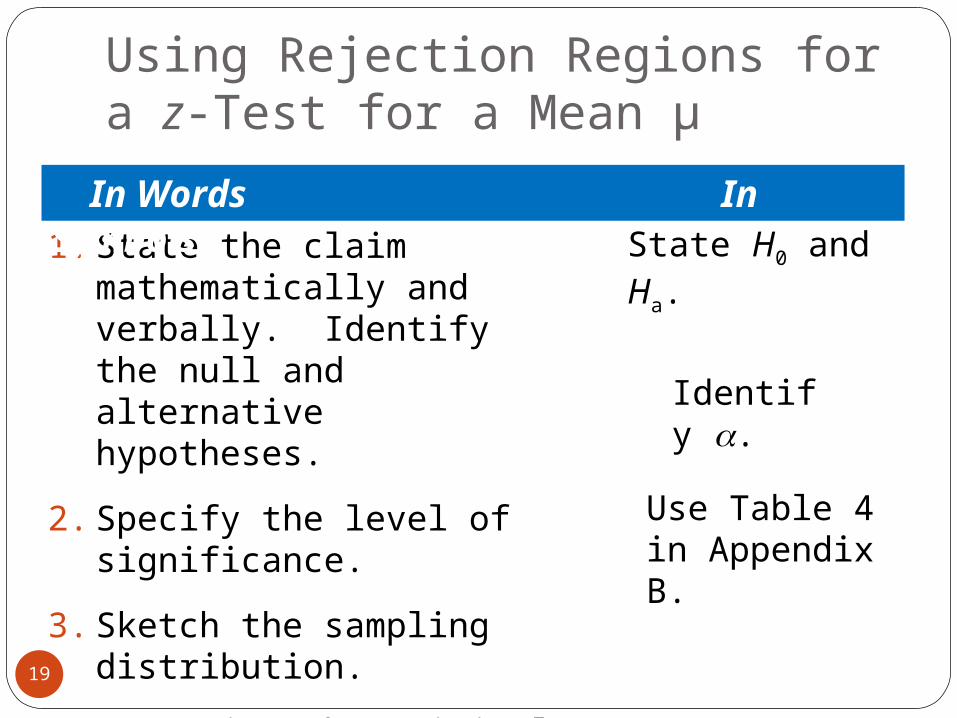
Using Rejection Regions for a z-Test for a Mean μ
19
1. State the claim mathematically and verbally. Identify the null and alternative hypotheses.
2. Specify the level of significance.
3. Sketch the sampling distribution.
4. Determine the critical value(s).
5. Determine the rejection region(s).
State H0 and Ha.
Identify .
Use Table 4 in Appendix B.
In Words In Symbols
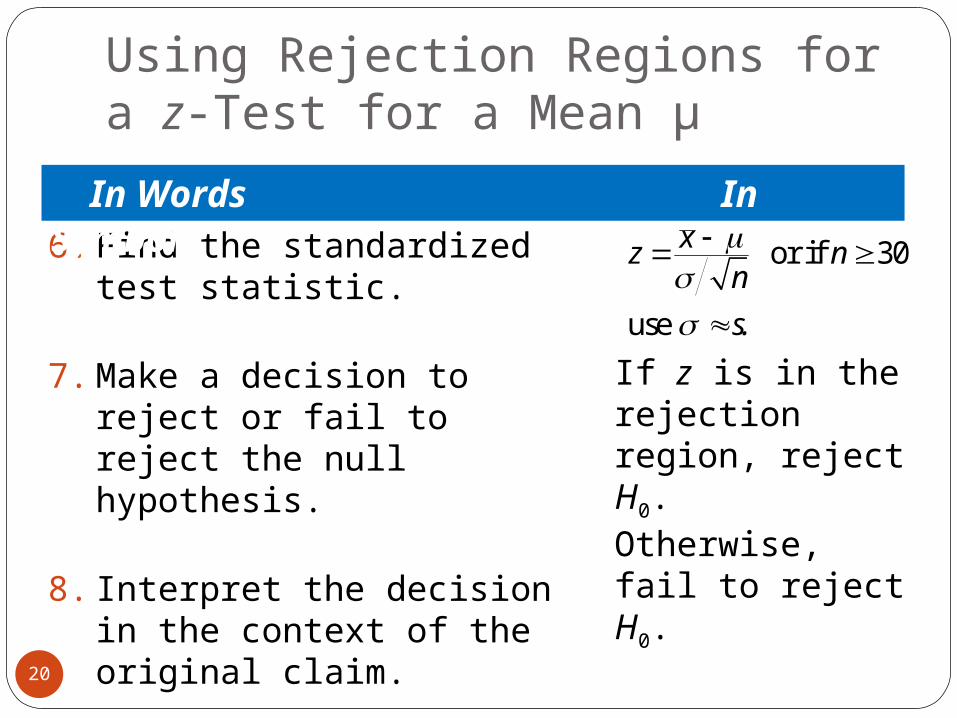
Using Rejection Regions for a z-Test for a Mean μ
20
6. Find the standardized test statistic.
7. Make a decision to reject or fail to reject the null hypothesis.
8. Interpret the decision in the context of the original claim.
or if 30
use
xz nn
s
.
If z is in the rejection region, reject H0. Otherwise, fail to reject H0.
In Words In Symbols
Example: Testing with Rejection Regions
21
Employees in a large accounting firm claim that the mean salary of the firm’s accountants is less than that of its competitor’s, which is $45,000. A random sample of 30 of the firm’s accountants has a mean salary of $43,500 with a standard deviation of $5200. At α = 0.05, test the employees’ claim.
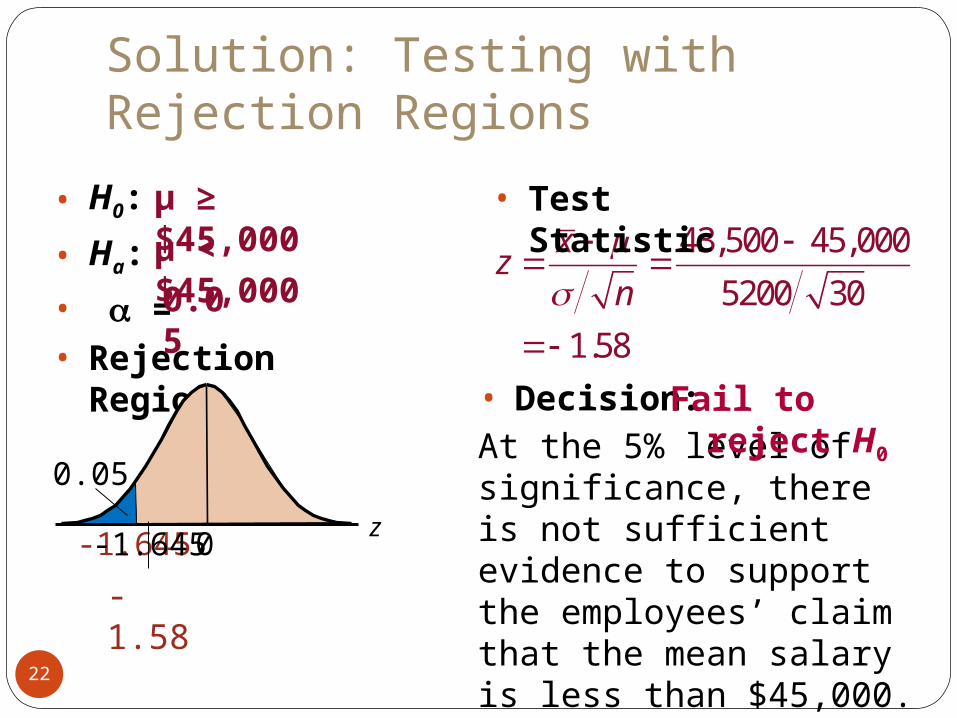
Solution: Testing with Rejection Regions
22
• H0:
• Ha:
• = • Rejection Region:
μ ≥ $45,000μ < $45,0000.05
43,500 45,000
5200 30
1.58
xz
n
• Decision:At the 5% level of significance, there is not sufficient evidence to support the employees’ claim that the mean salary is less than $45,000.
• Test Statistic
z0-1.645
0.05
-1.58
-1.645
Fail to reject H0
Example: Testing with Rejection Regions
23
The U.S. Department of Agriculture reports that the mean cost of raising a child from birth to age 2 in a rural area is $10,460. You believe this value is incorrect, so you select a random sample of 900 children (age 2) and find that the mean cost is $10,345 with a standard deviation of $1540. At α = 0.05, is there enough evidence to conclude that the mean cost is different from $10,460? (Adapted from U.S. Department of Agriculture Center for Nutrition Policy and Promotion)
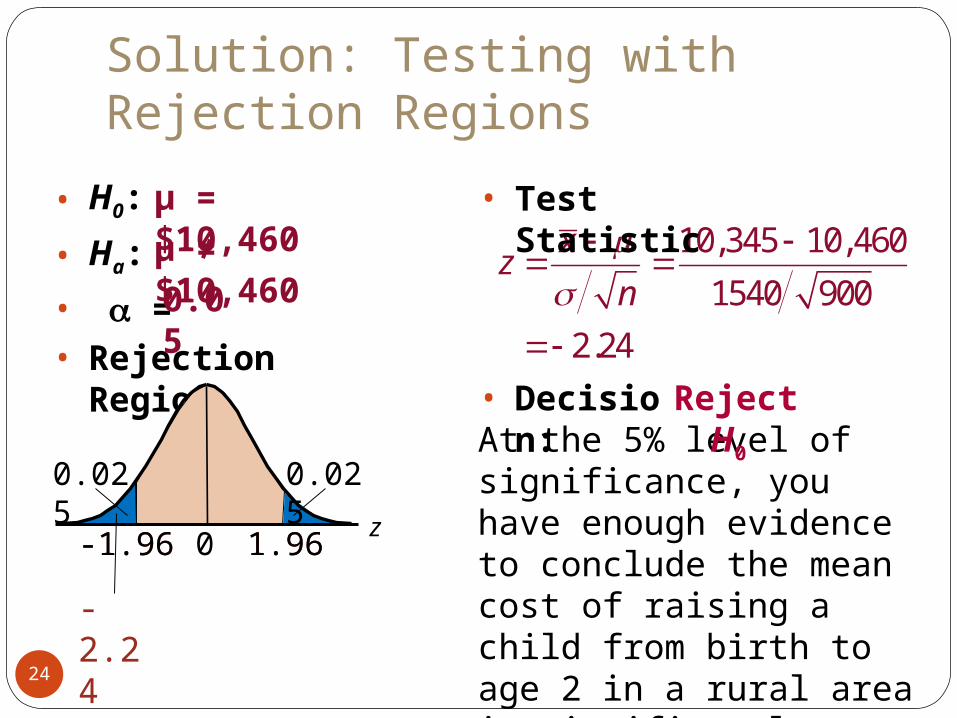
Solution: Testing with Rejection Regions
24
• H0:
• Ha:
• = • Rejection Region:
μ = $10,460μ ≠ $10,4600.05
10,345 10,460
1540 900
2.24
xz
n
• Decisio
n:At the 5% level of significance, you have enough evidence to conclude the mean cost of raising a child from birth to age 2 in a rural area is significantly different from $10,460.
• Test Statistic
z0-1.96
0.025
1.96
0.025
-1.96 1.96
-2.24
Reject H0
Section 7.2 Summary
25
Found P-values and used them to test a mean μ
Used P-values for a z-testFound critical values and rejection regions
in a normal distributionUsed rejection regions for a z-test