Embed Size (px)
Citation preview
Hypothesis Testing
Making HypothesesHypothesis Testing:
Example-1: Probability distr.Example-2: Z-distribution
Errors in Hypothesis TestingOne- vs. Two-sided Tests
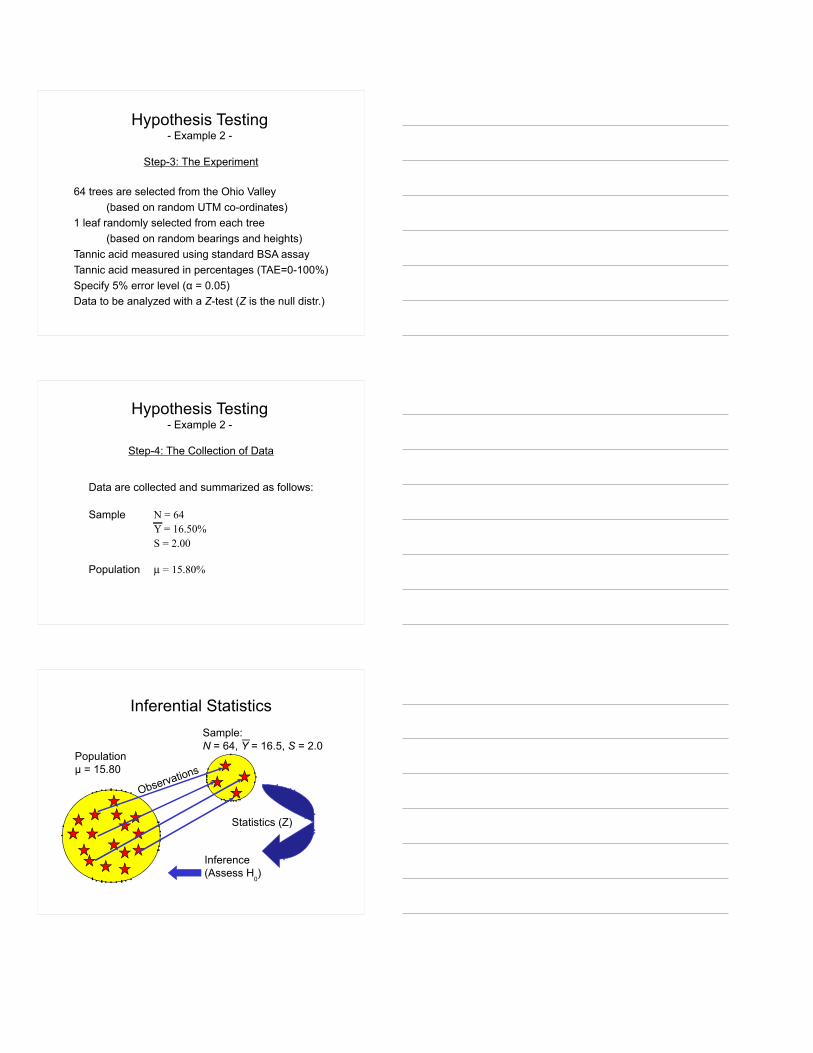
Population
Sample
Inference
Statistics
Inferential Statistics
Observations
Hypothesis Testing
Hypothesis testing compares data to the expectations of a specific null hypothesis. If the data are too unusual, assuming that the null hypothesis is true, the the null hypothesis is rejected.
The null hypothesis is a specific statement about a population parameter made for the purpose of argument. A good null hypothesis is a statement that would be interesting to reject.
Cf: “Straw-man hypothesis”
Hypothesis Testing
The alternative hypothesis includes all other possible values for the population parameter besides the value stated in the null hypothesis.
The null hypothesis is rejected based upon probabilities (i.e., a quantification of the level of uncertainty) determined from the null distribution.
Hypotheses can be 1-tailed or 2-tailed.
Hypothesis Testing
Making HypothesesHypothesis Testing:
Example-1: Probability distr.Example-2: Z-distribution
Errors in Hypothesis TestingOne- vs. Two-sided Tests
Hypothesis Testing- An Example -
Let's work through Example 6.2 (p. 130) of your text to get a feel for the process of hypothesis testing.
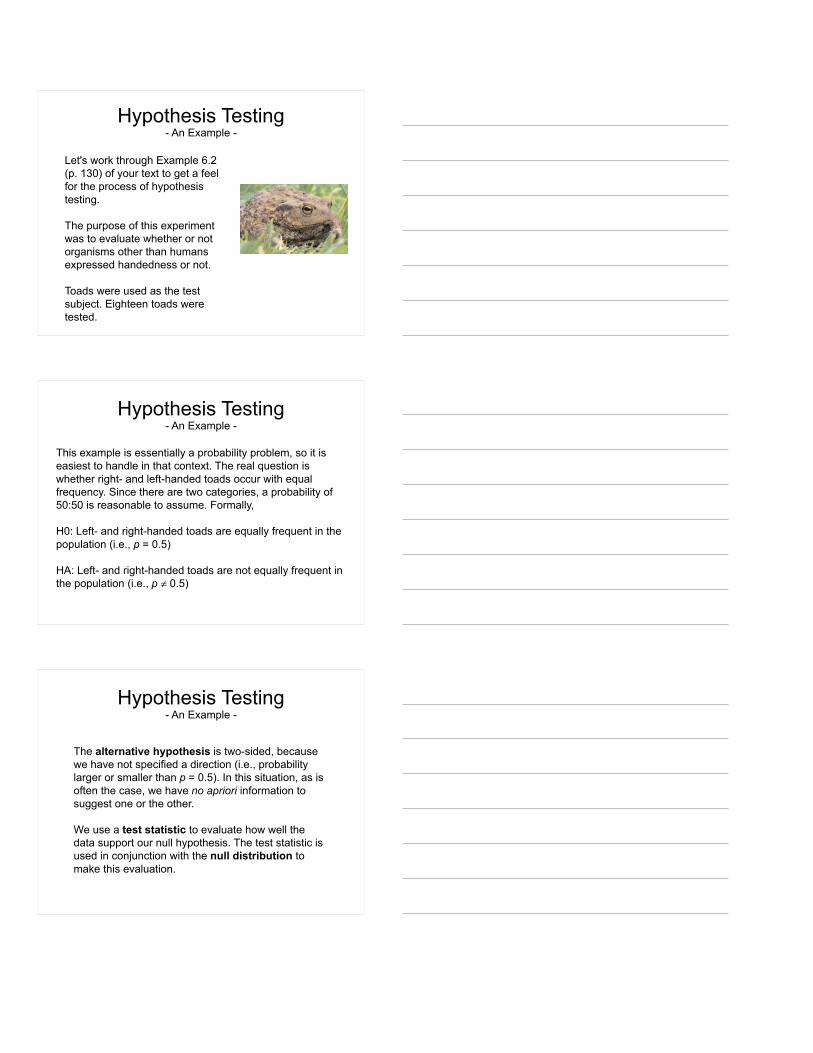
The purpose of this experiment was to evaluate whether or not organisms other than humans expressed handedness or not.
Toads were used as the test subject. Eighteen toads were tested.
Hypothesis Testing- An Example -
This example is essentially a probability problem, so it is easiest to handle in that context. The real question is whether right- and left-handed toads occur with equal frequency. Since there are two categories, a probability of 50:50 is reasonable to assume. Formally,
H0: Left- and right-handed toads are equally frequent in the population (i.e., p = 0.5)
HA: Left- and right-handed toads are not equally frequent in the population (i.e., p ≠ 0.5)
The alternative hypothesis is two-sided, because we have not specified a direction (i.e., probability larger or smaller than p = 0.5). In this situation, as is often the case, we have no apriori information to suggest one or the other.
We use a test statistic to evaluate how well the data support our null hypothesis. The test statistic is used in conjunction with the null distribution to make this evaluation.
Hypothesis Testing- An Example -
Hypothesis Testing- An Example -
In this example, a toad is much like a coin flipping scenario. If you flip a coin, it has a 50:50 chance of being heads or tails. A toad can be either left- or right-handed.
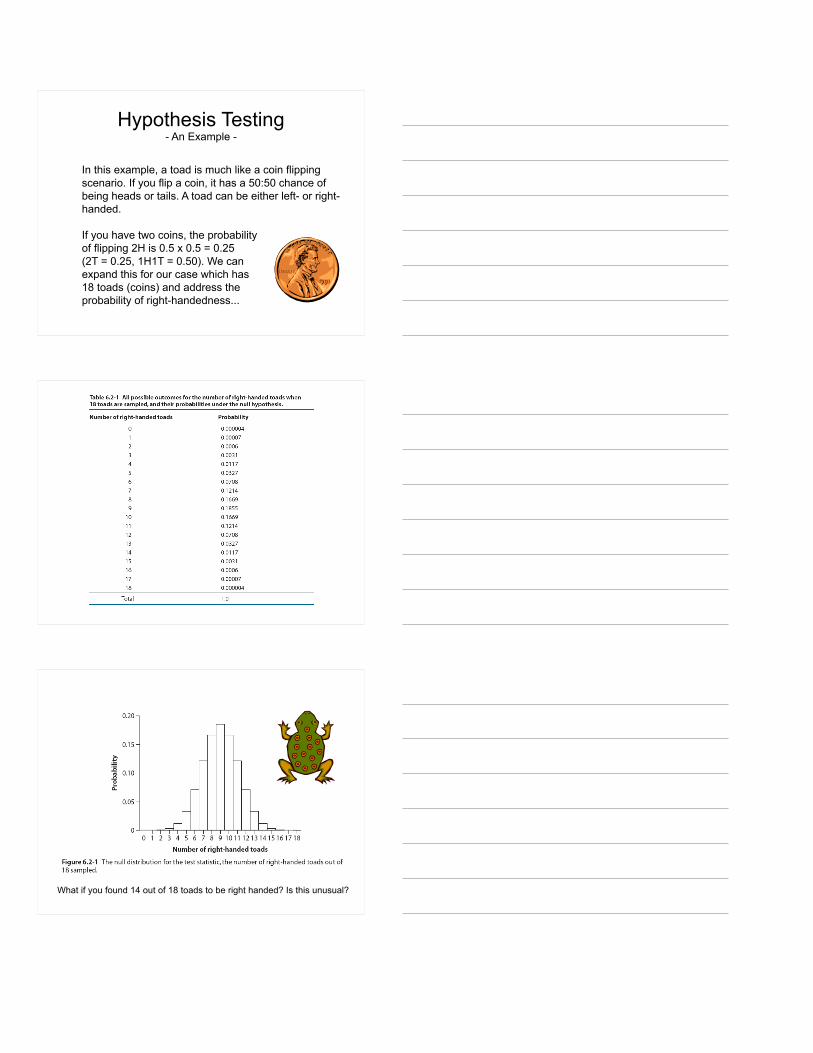
If you have two coins, the probability of flipping 2H is 0.5 x 0.5 = 0.25 (2T = 0.25, 1H1T = 0.50). We can expand this for our case which has 18 toads (coins) and address the probability of right-handedness...
What if you found 14 out of 18 toads to be right handed? Is this unusual?
Hypothesis Testing- An Example -
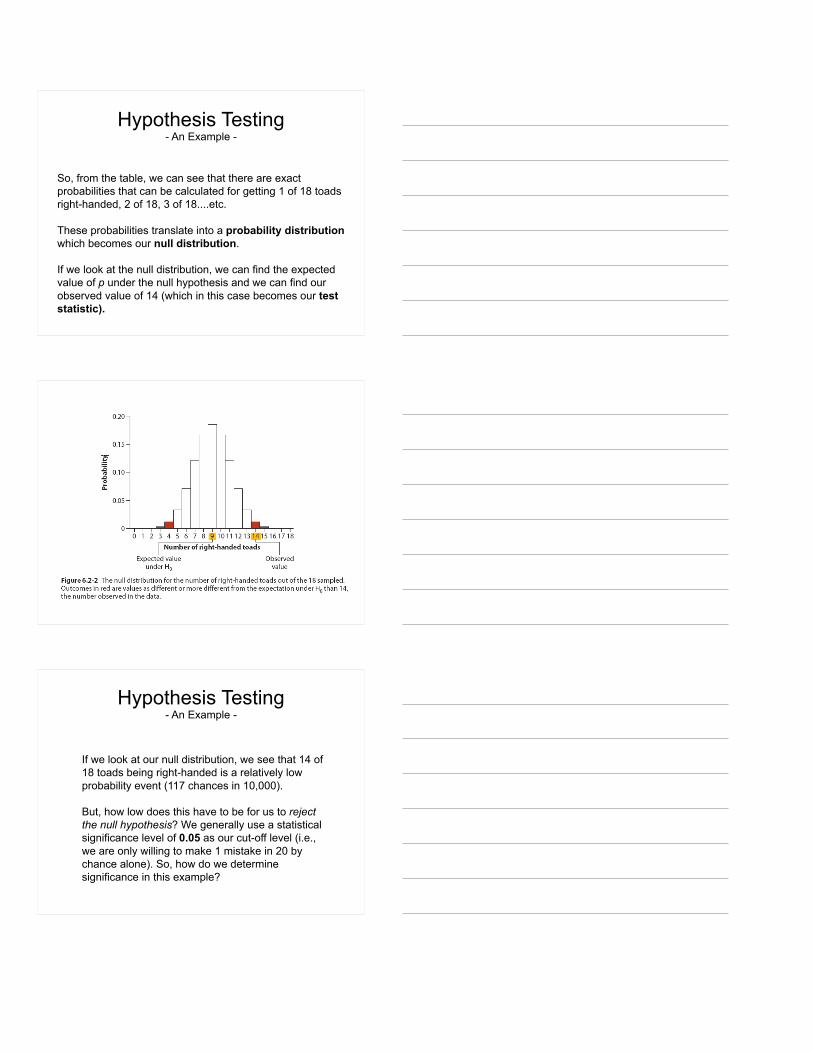
So, from the table, we can see that there are exact probabilities that can be calculated for getting 1 of 18 toads right-handed, 2 of 18, 3 of 18....etc.
These probabilities translate into a probability distribution which becomes our null distribution.
If we look at the null distribution, we can find the expected value of p under the null hypothesis and we can find our observed value of 14 (which in this case becomes our test statistic).
Hypothesis Testing- An Example -
If we look at our null distribution, we see that 14 of 18 toads being right-handed is a relatively low probability event (117 chances in 10,000).
But, how low does this have to be for us to reject the null hypothesis? We generally use a statistical significance level of 0.05 as our cut-off level (i.e., we are only willing to make 1 mistake in 20 by chance alone). So, how do we determine significance in this example?
Hypothesis Testing- An Example -
We need to determine the area under the curve determined by the probability distribution that lies to the right of 14. Using the basic additive property of probabilities:
Pr = Pr[14] + Pr[15] + Pr[16] + Pr [17] + Pr [18]Pr = 0.0155
However, this is only the area in one tail. We need to calculate the potential area in two tails so, Pr = 2 × 0.0155 = 0.0310.
Hypothesis Testing- An Example -
Because P = 0.031 < P = 0.05, we conclude that this result is unusual enough (i.e., not likely due to chance alone) that it is statistically significant.
Because the significance level is below this threshold, we reject the null hypothesis that handedness is equally probable in toads and conclude that left- and right-handed toads are not equally frequent in the population.
Congratulations!
You just did your first statistical test.

Let's do one more example to make sure you understand the concept, but this time, let's use the normal distribution that we have been studying and see how it can be used to test an hypothesis (it may be a bit more clear than a probability example).
Let's switch from toads to trees.Note the “steps” that I have addedto illustrate the statistical process.
Hypothesis Testing- Example 2 -
Hypothesis Testing- Example 2 -
Step-1: Observations & Question
Many observations were made during 1950’s on the tannic acid content of
white oak leaves.
After thousands of leaves, the mean was determined to be 15.80%.
Since the 1950’s there have been many changesin air quality, precipitation chemistry, etc.
Q: Has leaf tannic acid content changed over time?
Now that a biological question has been posed,we need to formulate a testable hypothesis.
Simply:
Ho: µ = Y (no difference between sample & pop.)
Ha: µ ≠ Y (sample differs from population)
Step-2: The Hypothesis
Hypothesis Testing- Example 2 -
Step-3: The Experiment
64 trees are selected from the Ohio Valley(based on random UTM co-ordinates)
1 leaf randomly selected from each tree(based on random bearings and heights)
Tannic acid measured using standard BSA assayTannic acid measured in percentages (TAE=0-100%)Specify 5% error level (α = 0.05)Data to be analyzed with a Z-test (Z is the null distr.)
Hypothesis Testing- Example 2 -
Step-4: The Collection of Data
Data are collected and summarized as follows:
Sample N = 64Y = 16.50%S = 2.00
Population µ = 15.80%
Hypothesis Testing- Example 2 -
Populationµ = 15.80
Sample:N = 64, Y = 16.5, S = 2.0
Inference(Assess H
0)
Statistics (Z)
Inferential Statistics
Observations
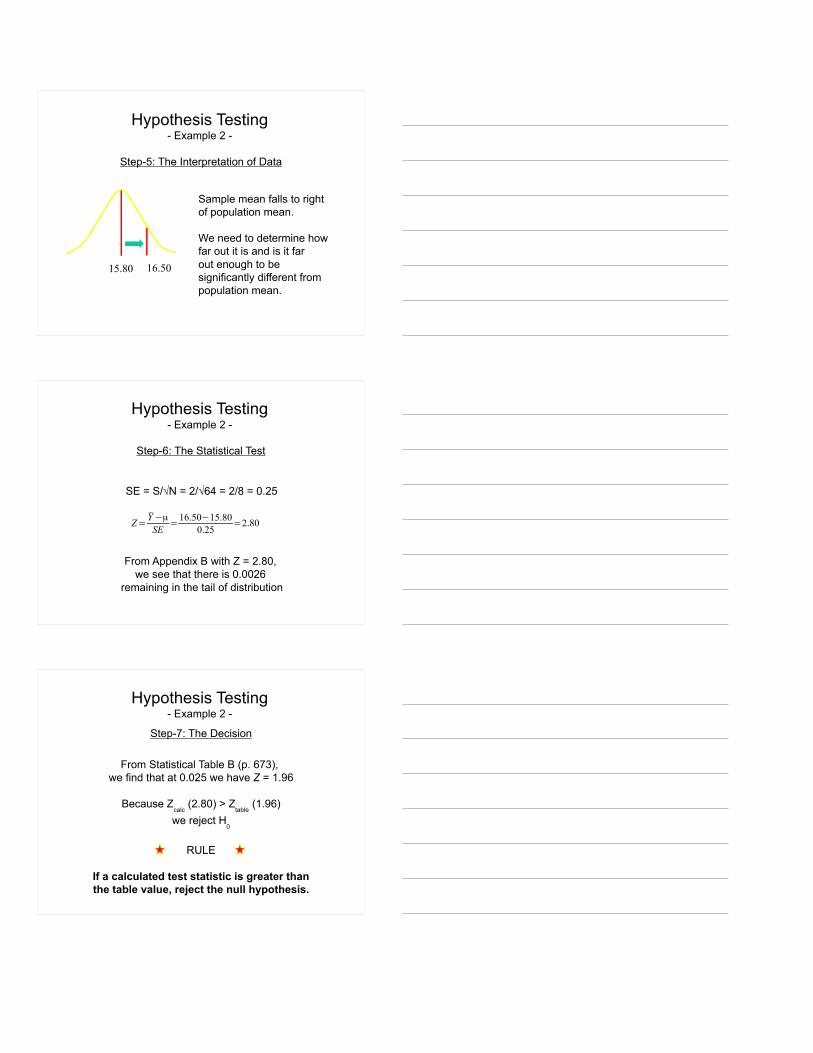
Step-5: The Interpretation of Data
15.80 16.50
Sample mean falls to rightof population mean.
We need to determine howfar out it is and is it farout enough to besignificantly different frompopulation mean.
Hypothesis Testing- Example 2 -
Step-6: The Statistical Test
SE = S/√N = 2/√64 = 2/8 = 0.25
From Appendix B with Z = 2.80, we see that there is 0.0026
remaining in the tail of distribution
Hypothesis Testing- Example 2 -
Z= Y−µSE
=16.50−15.800.25
=2.80
From Statistical Table B (p. 673), we find that at 0.025 we have Z = 1.96
Because Zcalc
(2.80) > Ztable
(1.96)we reject H
0
RULE
If a calculated test statistic is greater than the table value, reject the null hypothesis.
Step-7: The Decision
Hypothesis Testing- Example 2 -
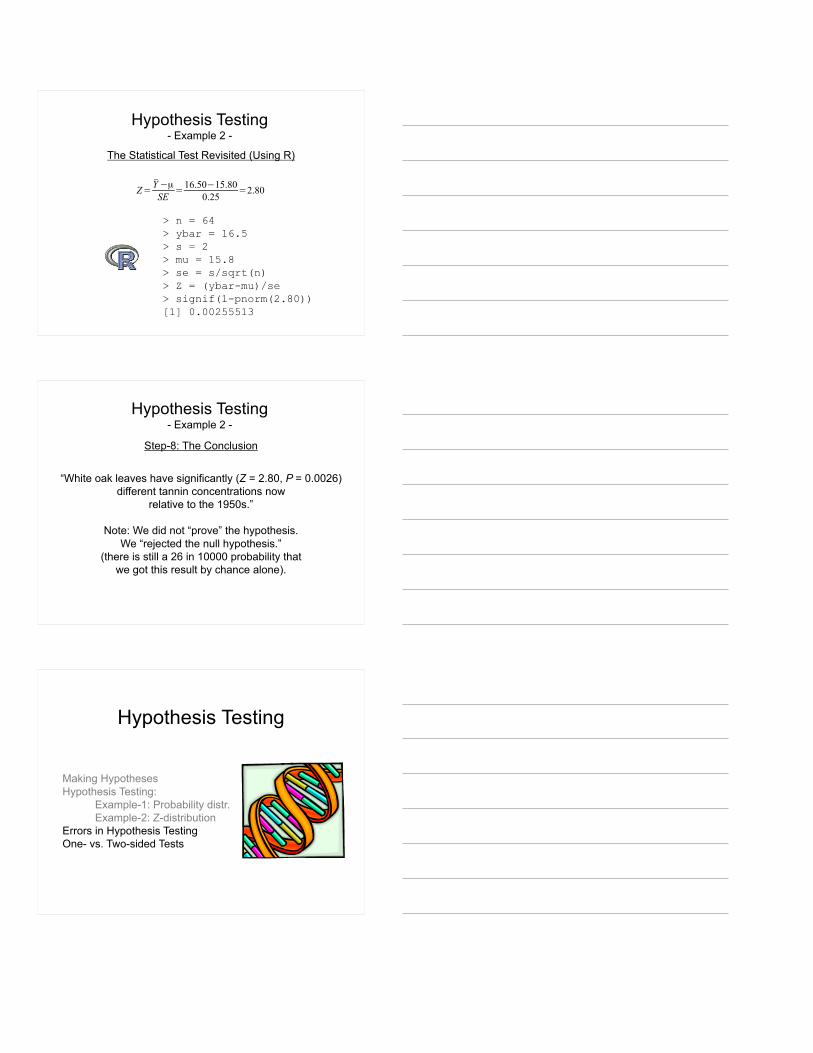
The Statistical Test Revisited (Using R)
> n = 64> ybar = 16.5> s = 2> mu = 15.8> se = s/sqrt(n)> Z = (ybar-mu)/se> signif(1-pnorm(2.80))[1] 0.00255513
Hypothesis Testing- Example 2 -
Z= Y−µSE
=16.50−15.800.25
=2.80
“White oak leaves have significantly (Z = 2.80, P = 0.0026)different tannin concentrations now
relative to the 1950s.”
Note: We did not “prove” the hypothesis.We “rejected the null hypothesis.”
(there is still a 26 in 10000 probability thatwe got this result by chance alone).
Step-8: The Conclusion
Hypothesis Testing- Example 2 -
Hypothesis Testing
Making HypothesesHypothesis Testing:
Example-1: Probability distr.Example-2: Z-distribution
Errors in Hypothesis TestingOne- vs. Two-sided Tests
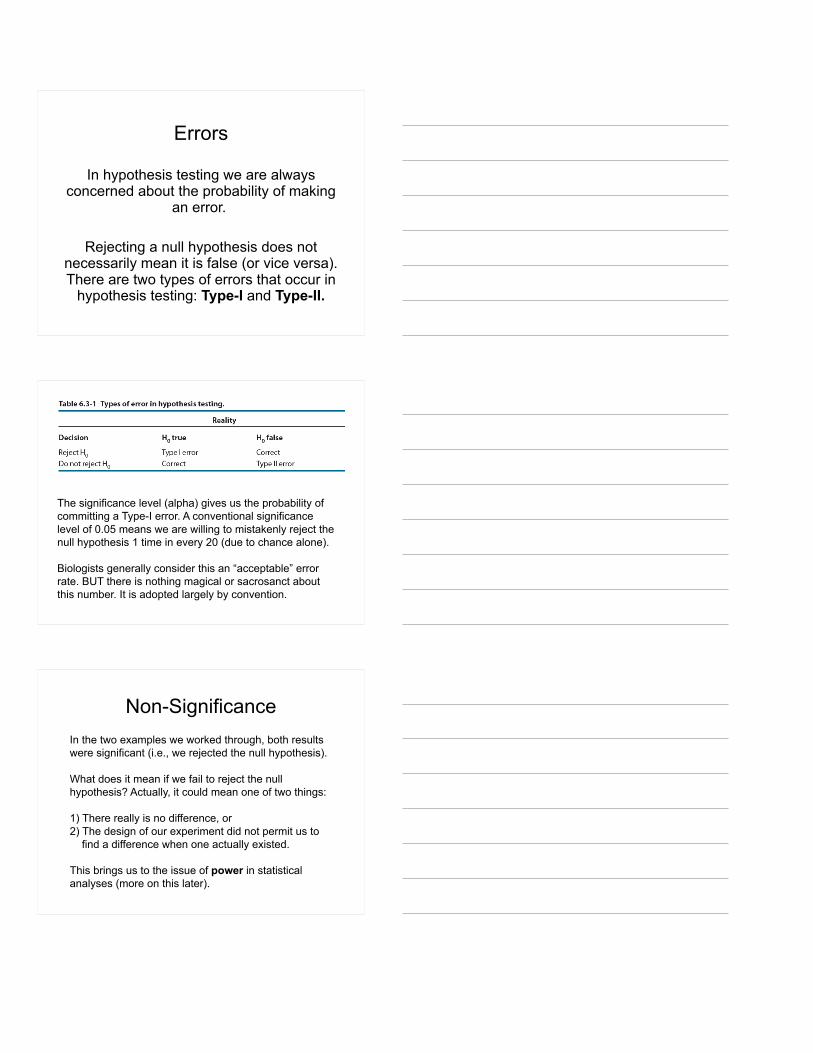
Errors
In hypothesis testing we are always concerned about the probability of making
an error.
Rejecting a null hypothesis does not necessarily mean it is false (or vice versa). There are two types of errors that occur in
hypothesis testing: Type-I and Type-II.
The significance level (alpha) gives us the probability of committing a Type-I error. A conventional significance level of 0.05 means we are willing to mistakenly reject the null hypothesis 1 time in every 20 (due to chance alone).
Biologists generally consider this an “acceptable” error rate. BUT there is nothing magical or sacrosanct about this number. It is adopted largely by convention.
Non-SignificanceIn the two examples we worked through, both results were significant (i.e., we rejected the null hypothesis).
What does it mean if we fail to reject the null hypothesis? Actually, it could mean one of two things:
1) There really is no difference, or2) The design of our experiment did not permit us to find a difference when one actually existed.
This brings us to the issue of power in statistical analyses (more on this later).
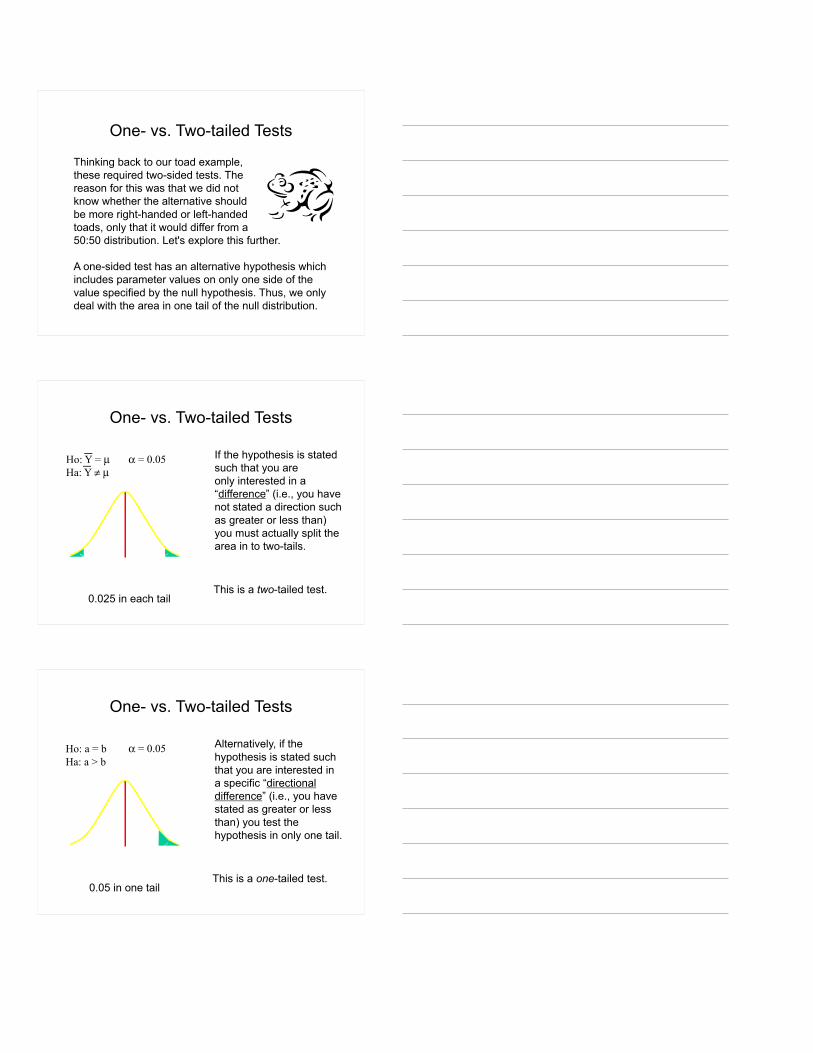
One- vs. Two-tailed Tests
Thinking back to our toad example, these required two-sided tests. The reason for this was that we did not know whether the alternative should be more right-handed or left-handed toads, only that it would differ from a 50:50 distribution. Let's explore this further.
A one-sided test has an alternative hypothesis which includes parameter values on only one side of the value specified by the null hypothesis. Thus, we only deal with the area in one tail of the null distribution.
Ho: Y = µHa: Y ≠ µ
One- vs. Two-tailed Tests
If the hypothesis is stated such that you areonly interested in a “difference” (i.e., you have not stated a direction such as greater or less than) you must actually split the area in to two-tails.
0.025 in each tailThis is a two-tailed test.
α = 0.05
0.05 in one tail
One- vs. Two-tailed Tests
Ho: a = bHa: a > b
α = 0.05 Alternatively, if the hypothesis is stated such that you are interested in a specific “directional difference” (i.e., you have stated as greater or less than) you test the hypothesis in only one tail.
This is a one-tailed test.

One- vs. Two-tailed TestsReally?
Rejection of Ho at the 0.05 level for a two-tailed test requires Zcalc > Ztable of 1.96.
Rejection of Ho at the 0.05 level for a one-tailed test requires Zcalc > Ztable of 1.64.
Q. Is it not more difficult then to reject a two-tailed test at an alpha = 0.05?A. Theoretically, no (despite appearances). We have two routes of rejection.