Embed Size (px)
Citation preview
I would like to present FUJIFILM Holdings’ financial results for the third
1
quarter of the fiscal year ending March 2020.
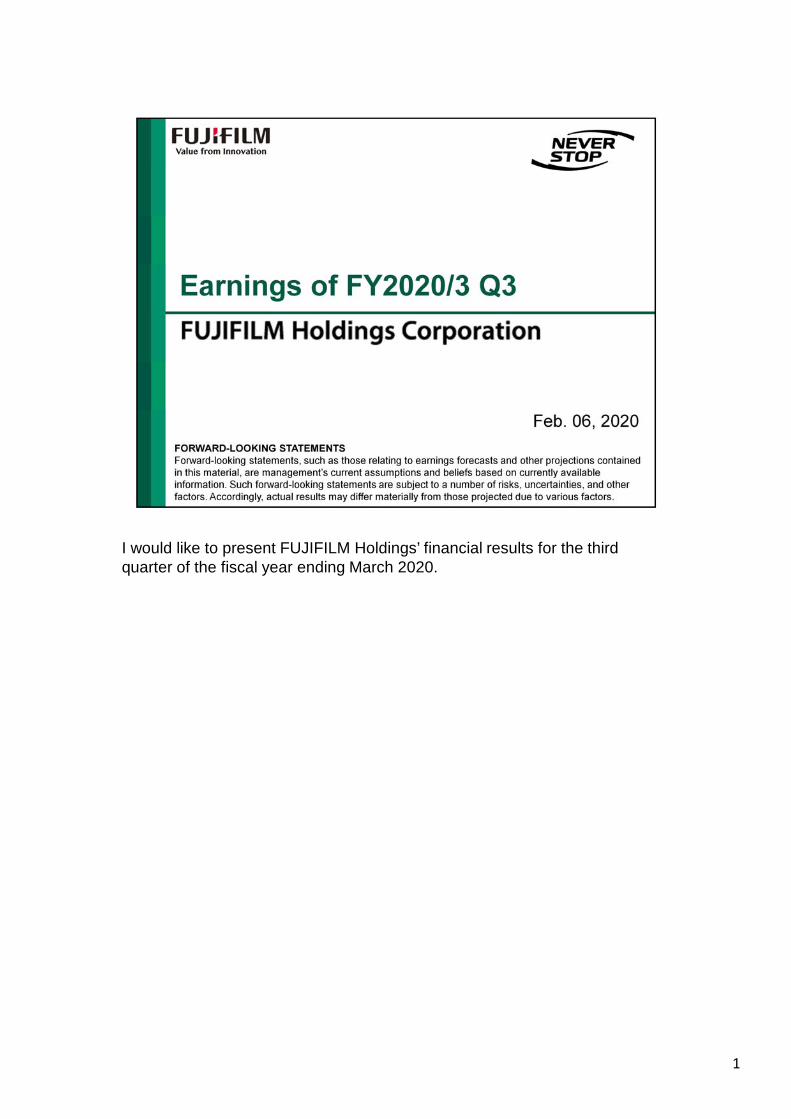
Let me explain the main points of the third quarter of the fiscal year ending March 2020.
2
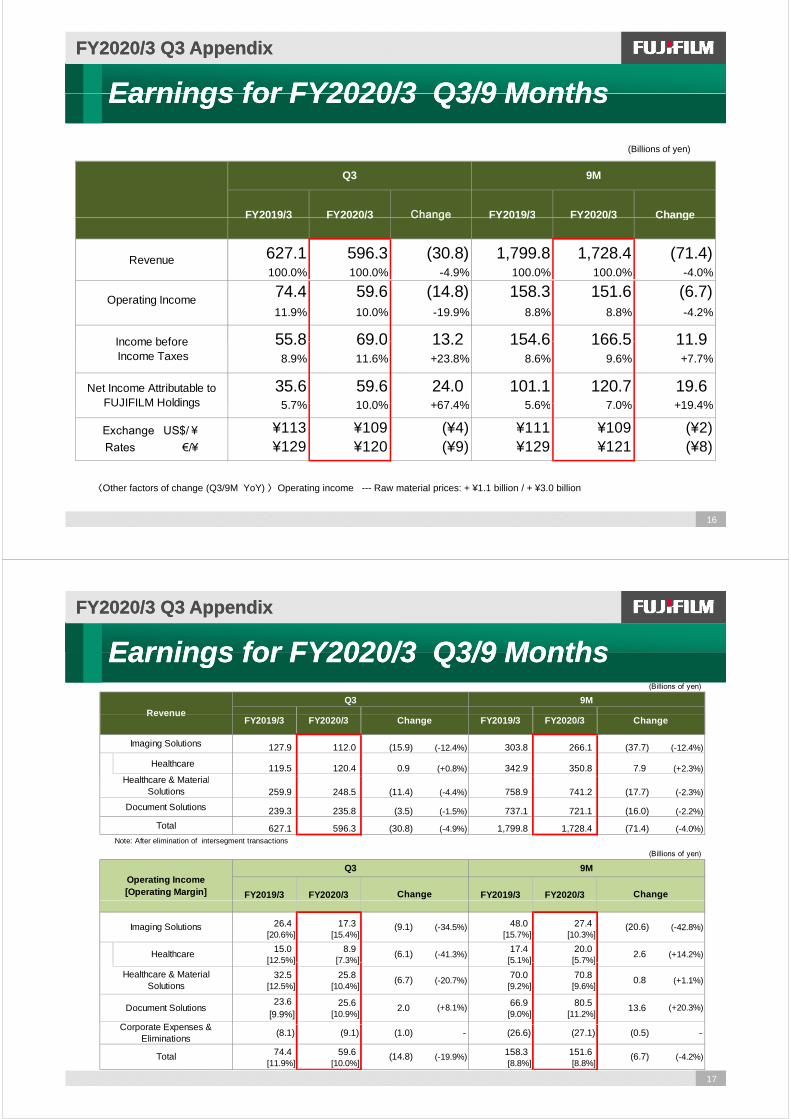
In the third quarter of the fiscal year ending March 2020, operating income decreased year-on-year by 4.2%. On a constant-currency basis, it increased by 2.9%.Net income attributable to FUJIFILM Holdings increased by 19.4% year-on-year, proceeding as planned for achieving the full-year ROE target of 8%.
The total revenue decreased due to a negative impact from the strong yen, the economic slowdown in China, and a decrease in demand after the consumption tax increase.While sales declined in the imaging and document business, healthcare expanded sales, driven by the medical systems, bio CDMO and regenerative medicine business.The operating income increased in healthcare and in document with improvements in profitability and a positive impact from structural reforms, though it decreased in the Imaging and Materials.
As a special note, last December, we announced the acquisition of the Hitachi’s Diagnostic Imaging-related Business. The completion of the acquisition is planned in July, subject to customary closing conditions and regulatory approvals.In January this year, we also announced that Fuji Xerox would change its corporate name to FUJIFILM Business Innovation Corp. on Apr. 1, 2021.As for the share buyback as of up to 50 billion yen, 18.8 billion yen was bought back as of the end of January.
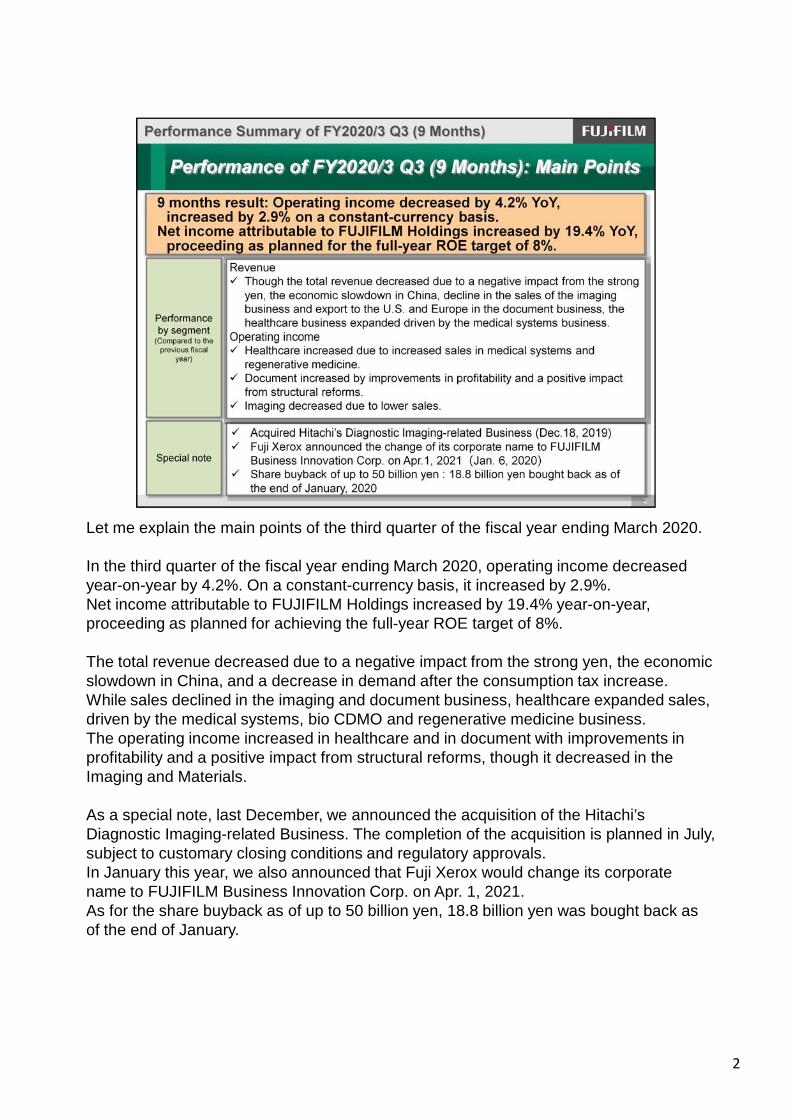
Let’s move on to detailed performance information for the third quarter of the fiscal year ending March 2020.
3
Consolidated revenue totaled ¥1,728.4 billion, down 4.0% from the previous fiscal year.
Operating income totaled ¥151.6 billion, down 4.2% from the previous fiscal year .
Income before income taxes came to ¥166.5 billion, up 7.7% from the previous fiscal year due to such factors as the large gains on equity securities.
Net income attributable to FUJIFILM Holdings totaled ¥120.7 billion, up 19.4% from the previous fiscal year.
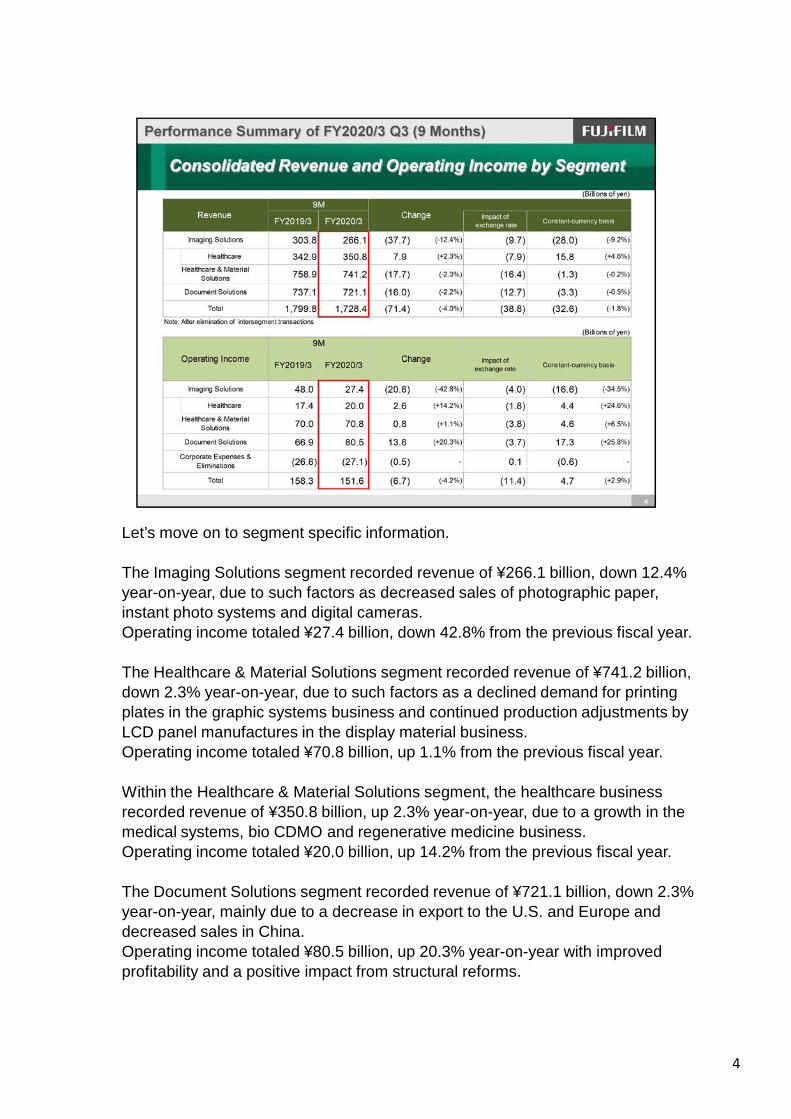
Let’s move on to segment specific information.
4
The Imaging Solutions segment recorded revenue of ¥266.1 billion, down 12.4% year-on-year, due to such factors as decreased sales of photographic paper, instant photo systems and digital cameras.Operating income totaled ¥27.4 billion, down 42.8% from the previous fiscal year.
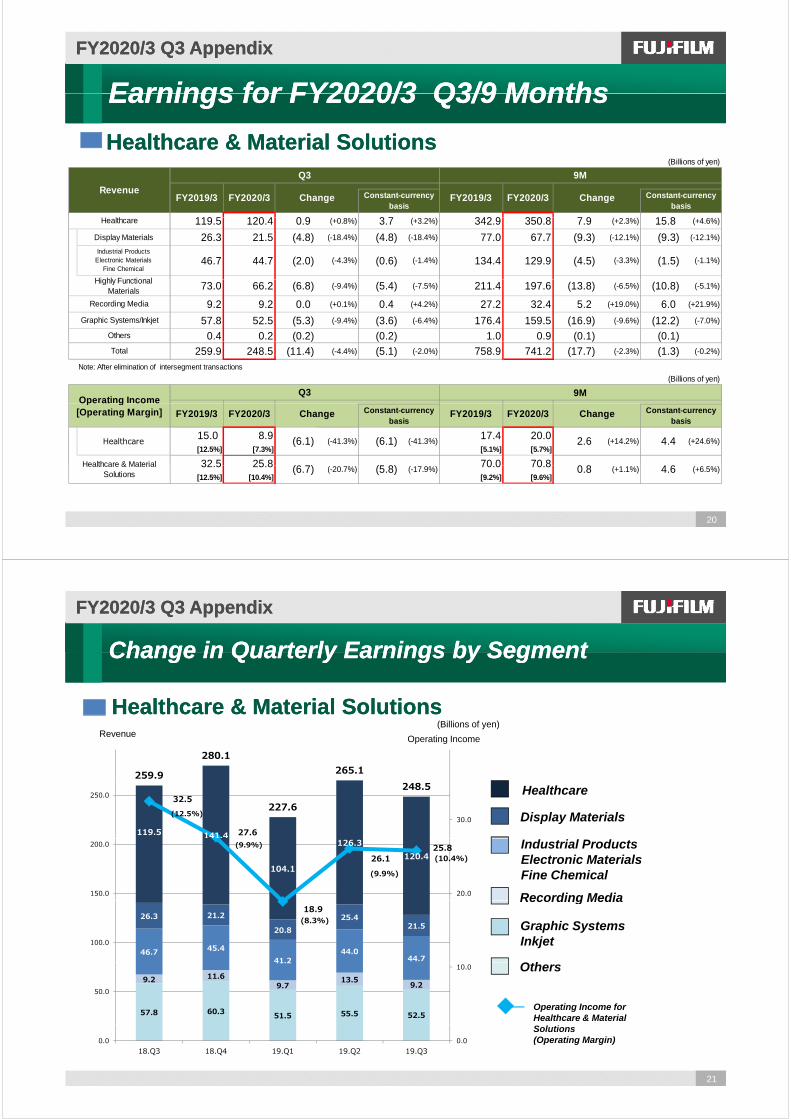
The Healthcare & Material Solutions segment recorded revenue of ¥741.2 billion, down 2.3% year-on-year, due to such factors as a declined demand for printing plates in the graphic systems business and continued production adjustments by LCD panel manufactures in the display material business.Operating income totaled ¥70.8 billion, up 1.1% from the previous fiscal year.
Within the Healthcare & Material Solutions segment, the healthcare business recorded revenue of ¥350.8 billion, up 2.3% year-on-year, due to a growth in the medical systems, bio CDMO and regenerative medicine business.Operating income totaled ¥20.0 billion, up 14.2% from the previous fiscal year.
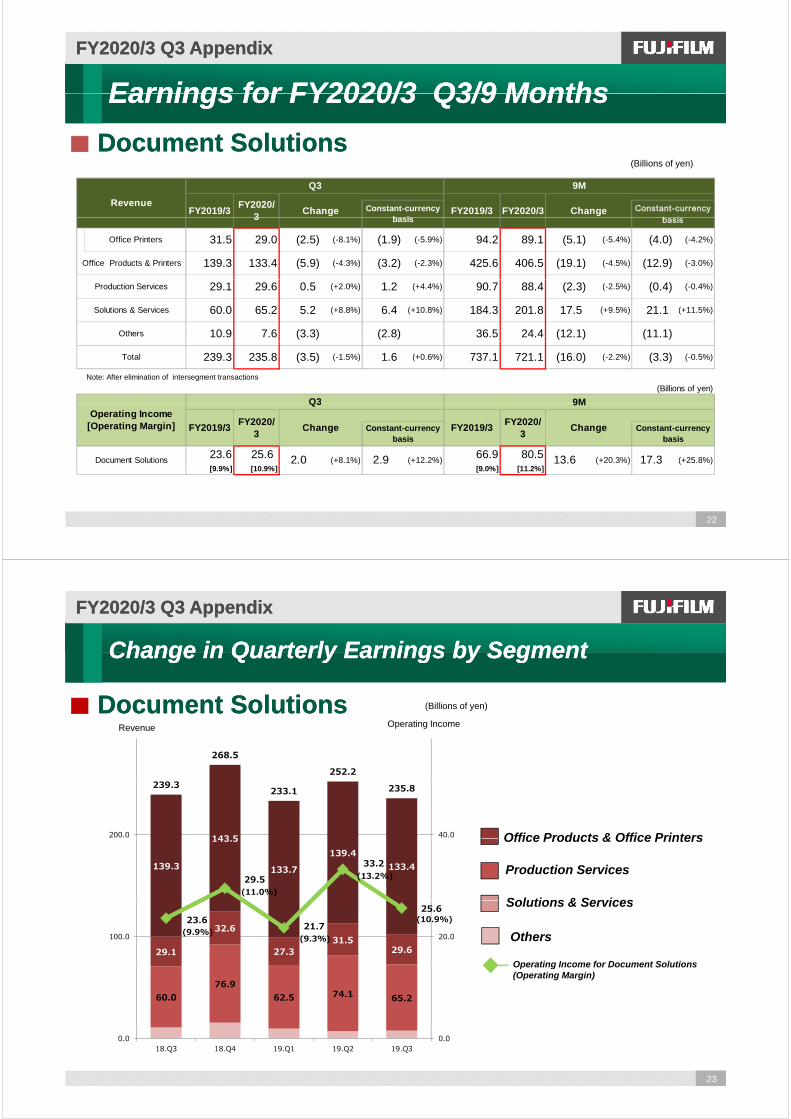
The Document Solutions segment recorded revenue of ¥721.1 billion, down 2.3% year-on-year, mainly due to a decrease in export to the U.S. and Europe and decreased sales in China. Operating income totaled ¥80.5 billion, up 20.3% year-on-year with improved profitability and a positive impact from structural reforms.
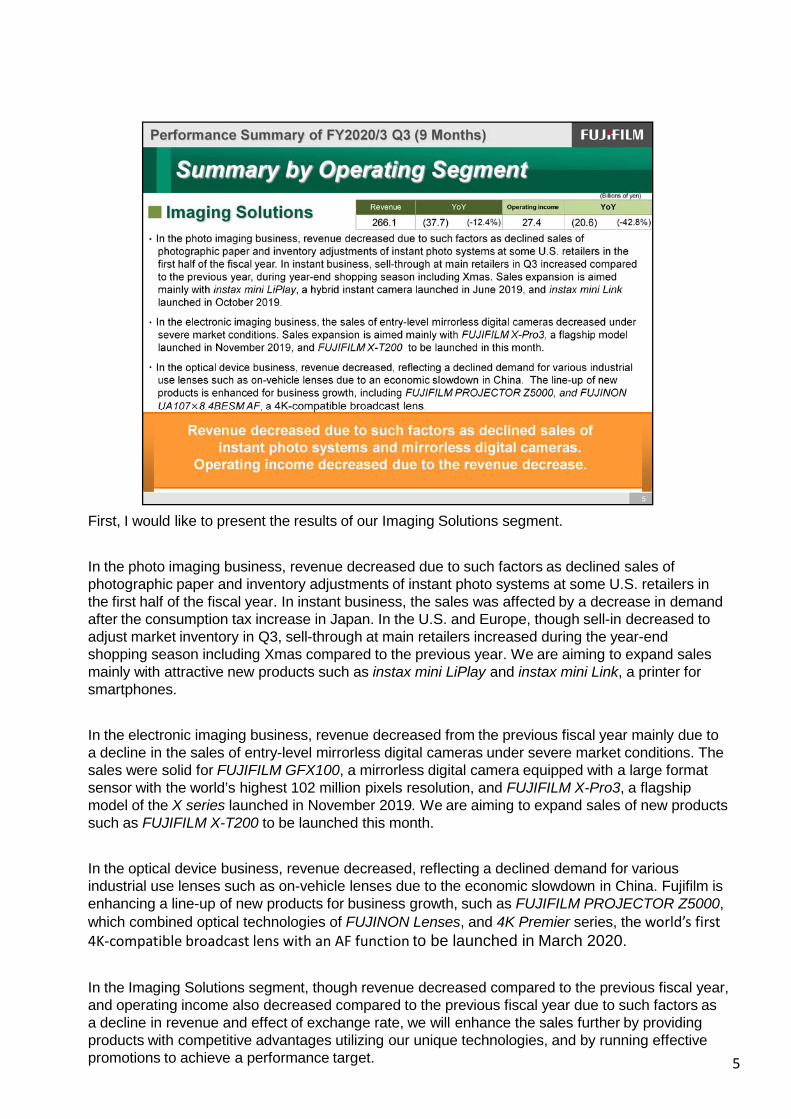
First, I would like to present the results of our Imaging Solutions segment.
5
In the photo imaging business, revenue decreased due to such factors as declined sales of photographic paper and inventory adjustments of instant photo systems at some U.S. retailers in the first half of the fiscal year. In instant business, the sales was affected by a decrease in demand after the consumption tax increase in Japan. In the U.S. and Europe, though sell-in decreased to adjust market inventory in Q3, sell-through at main retailers increased during the year-end shopping season including Xmas compared to the previous year. We are aiming to expand sales mainly with attractive new products such as instax mini LiPlay and instax mini Link, a printer for smartphones.
In the electronic imaging business, revenue decreased from the previous fiscal year mainly due to a decline in the sales of entry-level mirrorless digital cameras under severe market conditions. The sales were solid for FUJIFILM GFX100, a mirrorless digital camera equipped with a large format sensor with the world’s highest 102 million pixels resolution, and FUJIFILM X-Pro3, a flagship model of the X series launched in November 2019. We are aiming to expand sales of new products such as FUJIFILM X-T200 to be launched this month.
In the optical device business, revenue decreased, reflecting a declined demand for various industrial use lenses such as on-vehicle lenses due to the economic slowdown in China. Fujifilm is enhancing a line-up of new products for business growth, such as FUJIFILM PROJECTOR Z5000, which combined optical technologies of FUJINON Lenses, and 4K Premier series, the world’s first 4K‐compatible broadcast lens with an AF function to be launched in March 2020.
In the Imaging Solutions segment, though revenue decreased compared to the previous fiscal year, and operating income also decreased compared to the previous fiscal year due to such factors as a decline in revenue and effect of exchange rate, we will enhance the sales further by providing products with competitive advantages utilizing our unique technologies, and by running effective promotions to achieve a performance target.
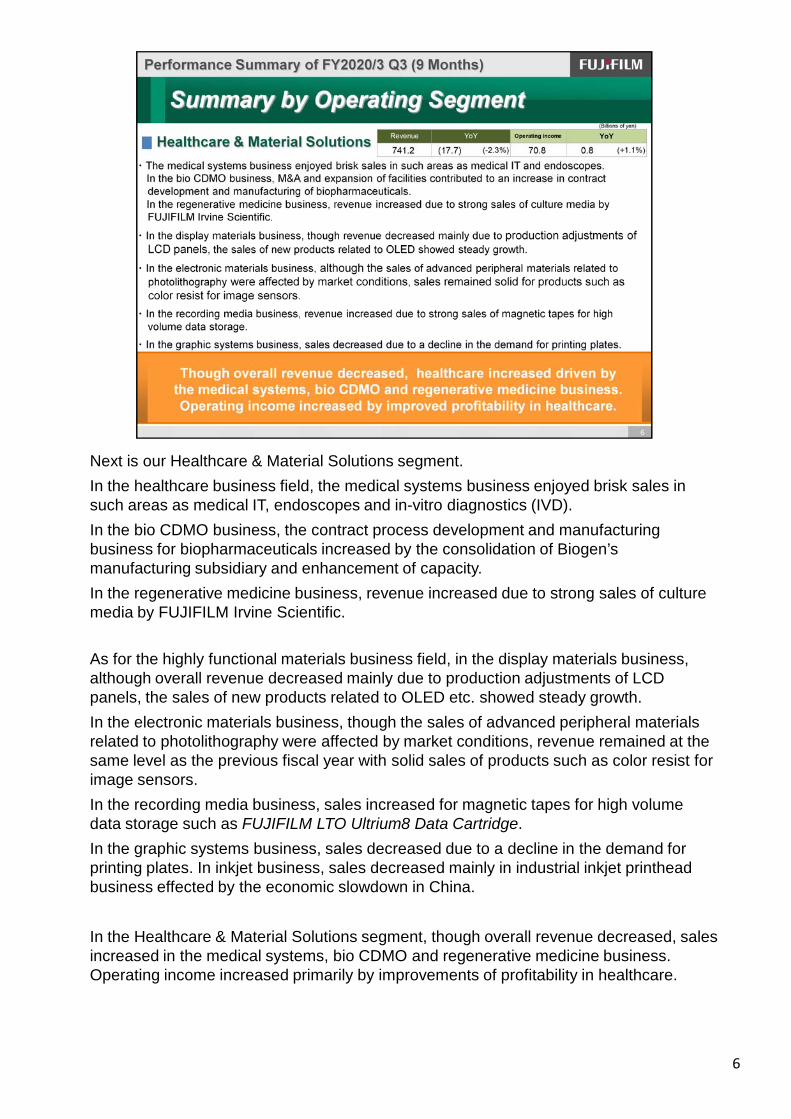
Next is our Healthcare & Material Solutions segment.
In the healthcare business field, the medical systems business enjoyed brisk sales in such areas as medical IT, endoscopes and in-vitro diagnostics (IVD).
In the bio CDMO business, the contract process development and manufacturing business for biopharmaceuticals increased by the consolidation of Biogen’s
6
manufacturing subsidiary and enhancement of capacity.
In the regenerative medicine business, revenue increased due to strong sales of culture media by FUJIFILM Irvine Scientific.
As for the highly functional materials business field, in the display materials business, although overall revenue decreased mainly due to production adjustments of LCD panels, the sales of new products related to OLED etc. showed steady growth.
In the electronic materials business, though the sales of advanced peripheral materials related to photolithography were affected by market conditions, revenue remained at the same level as the previous fiscal year with solid sales of products such as color resist for image sensors.
In the recording media business, sales increased for magnetic tapes for high volume data storage such as FUJIFILM LTO Ultrium8 Data Cartridge.
In the graphic systems business, sales decreased due to a decline in the demand for printing plates. In inkjet business, sales decreased mainly in industrial inkjet printheadbusiness effected by the economic slowdown in China.
In the Healthcare & Material Solutions segment, though overall revenue decreased, sales increased in the medical systems, bio CDMO and regenerative medicine business. Operating income increased primarily by improvements of profitability in healthcare.
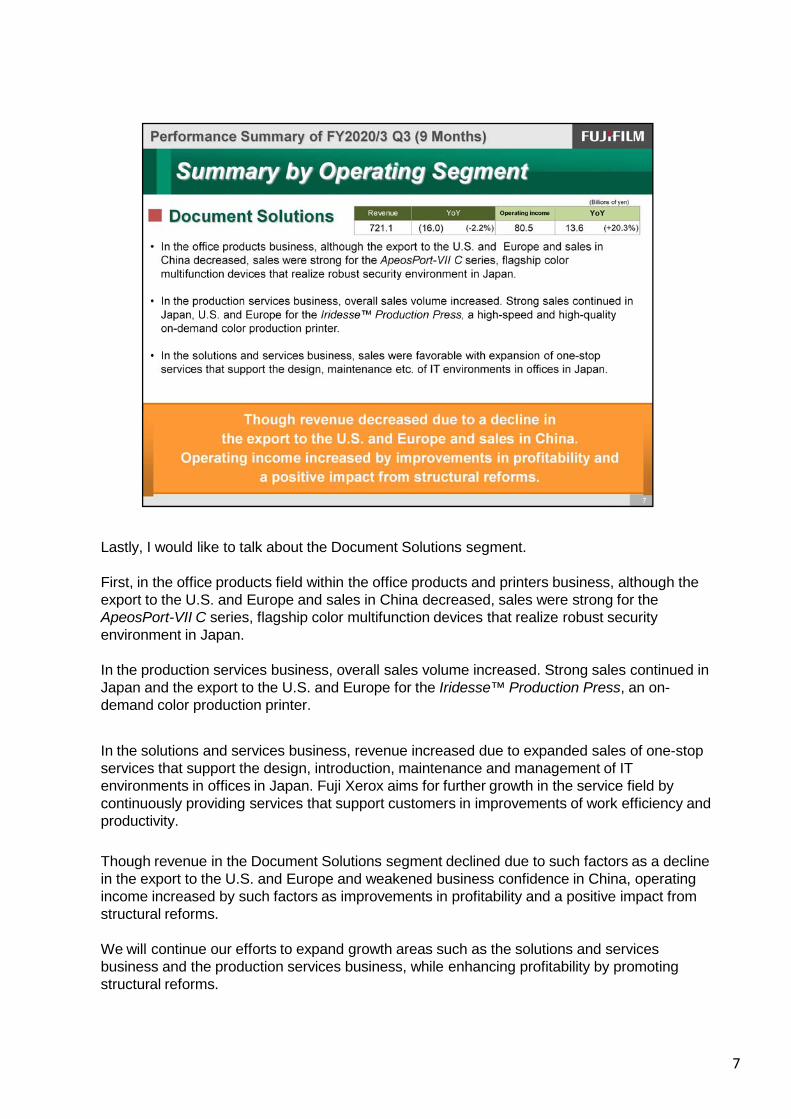
Lastly, I would like to talk about the Document Solutions segment.
7
First, in the office products field within the office products and printers business, although the export to the U.S. and Europe and sales in China decreased, sales were strong for theApeosPort-VII C series, flagship color multifunction devices that realize robust security environment in Japan.
In the production services business, overall sales volume increased. Strong sales continued in Japan and the export to the U.S. and Europe for the Iridesse™ Production Press, an on-demand color production printer.
In the solutions and services business, revenue increased due to expanded sales of one-stop services that support the design, introduction, maintenance and management of IT environments in offices in Japan. Fuji Xerox aims for further growth in the service field by continuously providing services that support customers in improvements of work efficiency and productivity.
Though revenue in the Document Solutions segment declined due to such factors as a decline in the export to the U.S. and Europe and weakened business confidence in China, operating income increased by such factors as improvements in profitability and a positive impact from structural reforms.
We will continue our efforts to expand growth areas such as the solutions and services business and the production services business, while enhancing profitability by promoting structural reforms.
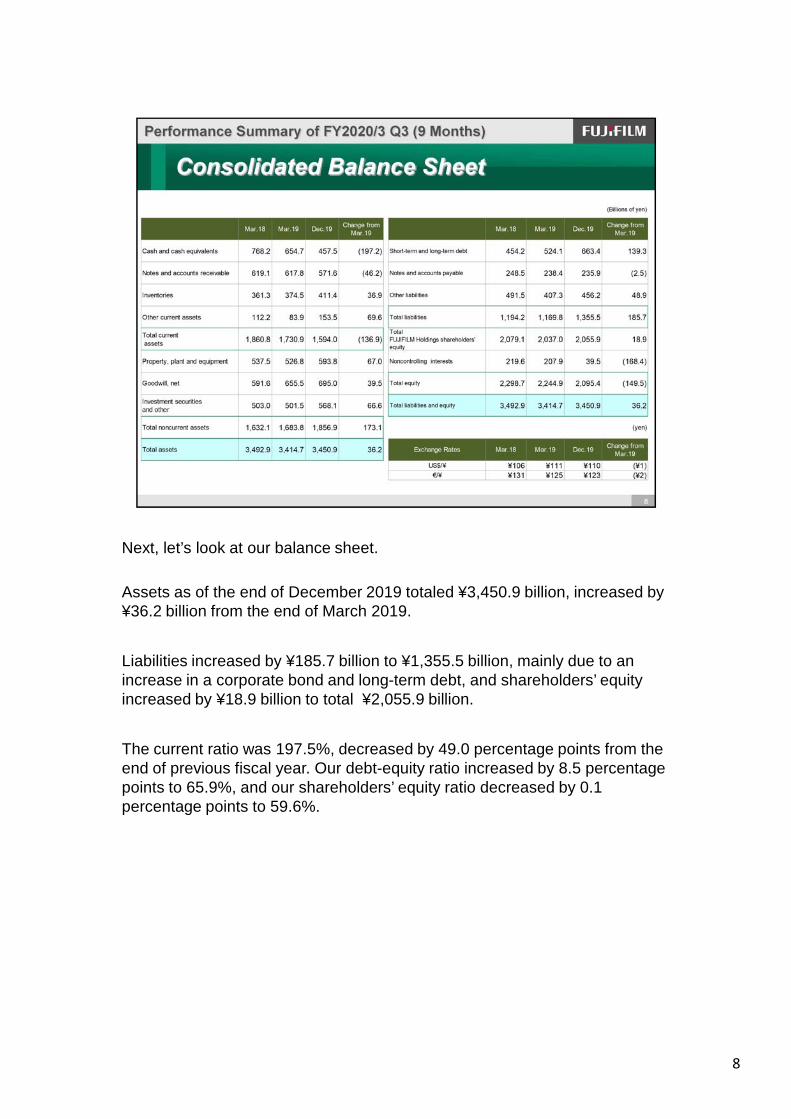
Next, let’s look at our balance sheet.
8
Assets as of the end of December 2019 totaled ¥3,450.9 billion, increased by ¥36.2 billion from the end of March 2019.
Liabilities increased by ¥185.7 billion to ¥1,355.5 billion, mainly due to an increase in a corporate bond and long-term debt, and shareholders’ equity increased by ¥18.9 billion to total ¥2,055.9 billion.
The current ratio was 197.5%, decreased by 49.0 percentage points from the end of previous fiscal year. Our debt-equity ratio increased by 8.5 percentage points to 65.9%, and our shareholders’ equity ratio decreased by 0.1 percentage points to 59.6%.
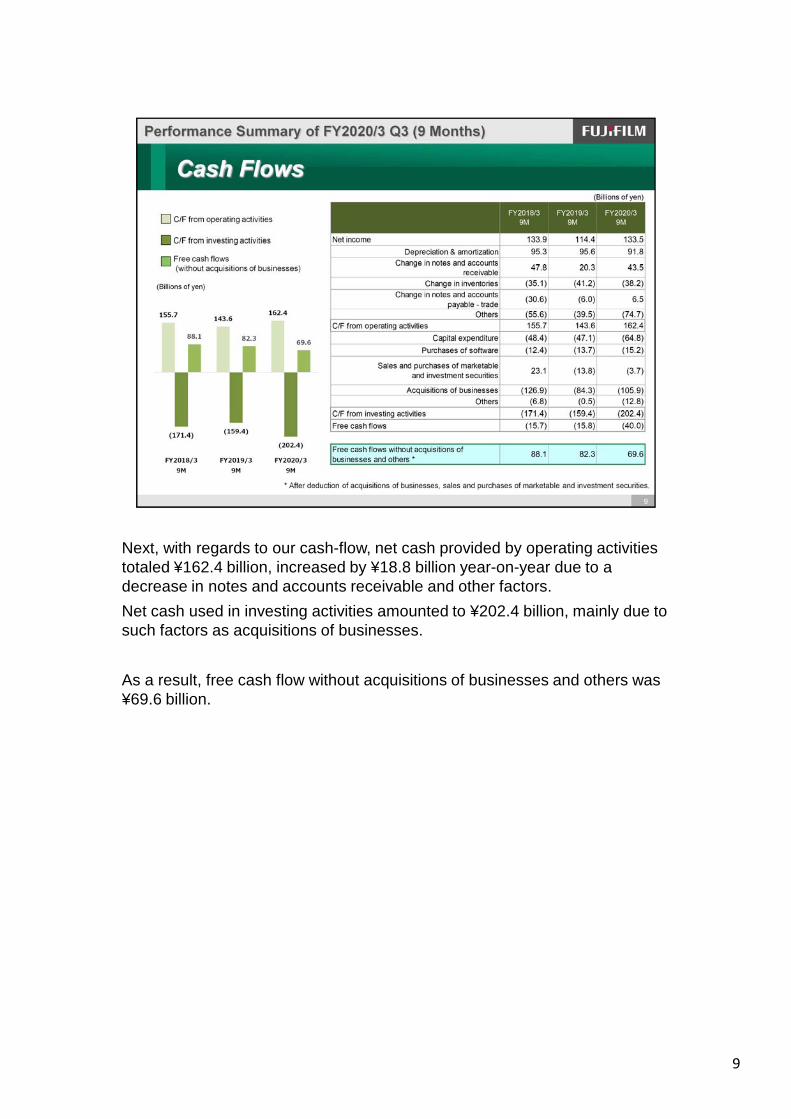
Next, with regards to our cash-flow, net cash provided by operating activities
9
totaled ¥162.4 billion, increased by ¥18.8 billion year-on-year due to adecrease in notes and accounts receivable and other factors.
Net cash used in investing activities amounted to ¥202.4 billion, mainly due to such factors as acquisitions of businesses.
As a result, free cash flow without acquisitions of businesses and others was ¥69.6 billion.
Let me talk about the progress in structural reforms at Fuji Xerox.
10
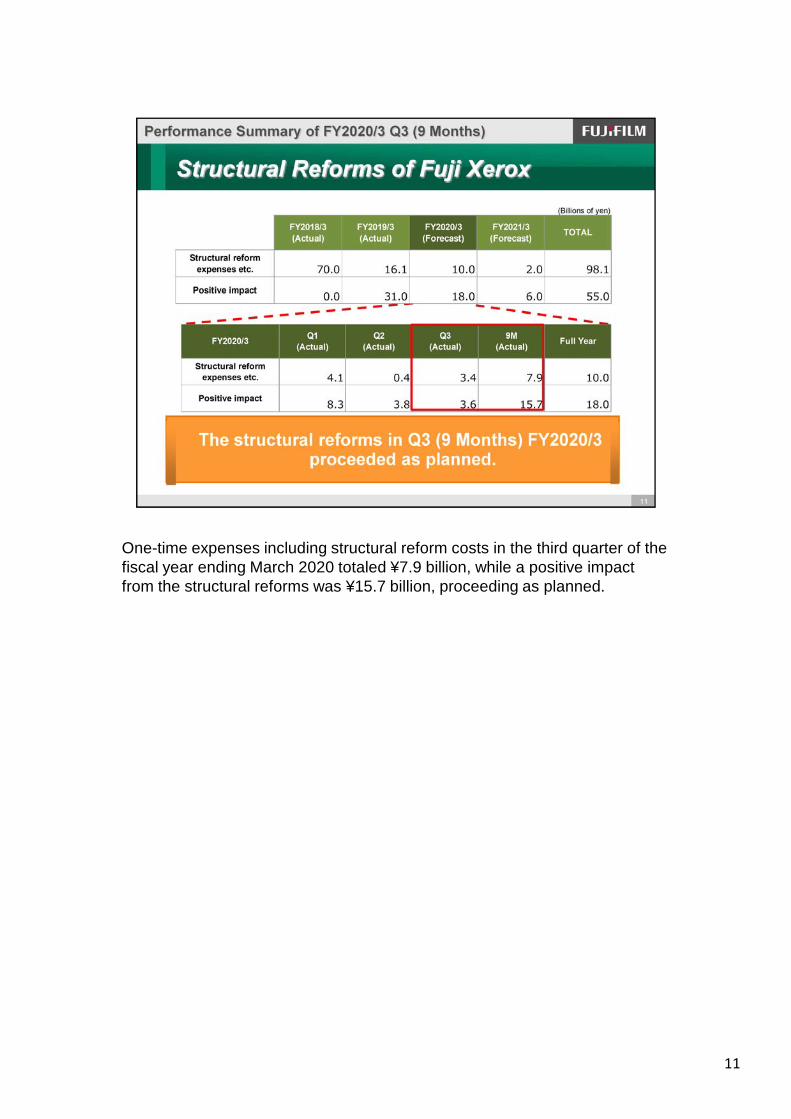
One-time expenses including structural reform costs in the third quarter of the
11
fiscal year ending March 2020 totaled ¥7.9 billion, while a positive impactfrom the structural reforms was ¥15.7 billion, proceeding as planned.

12
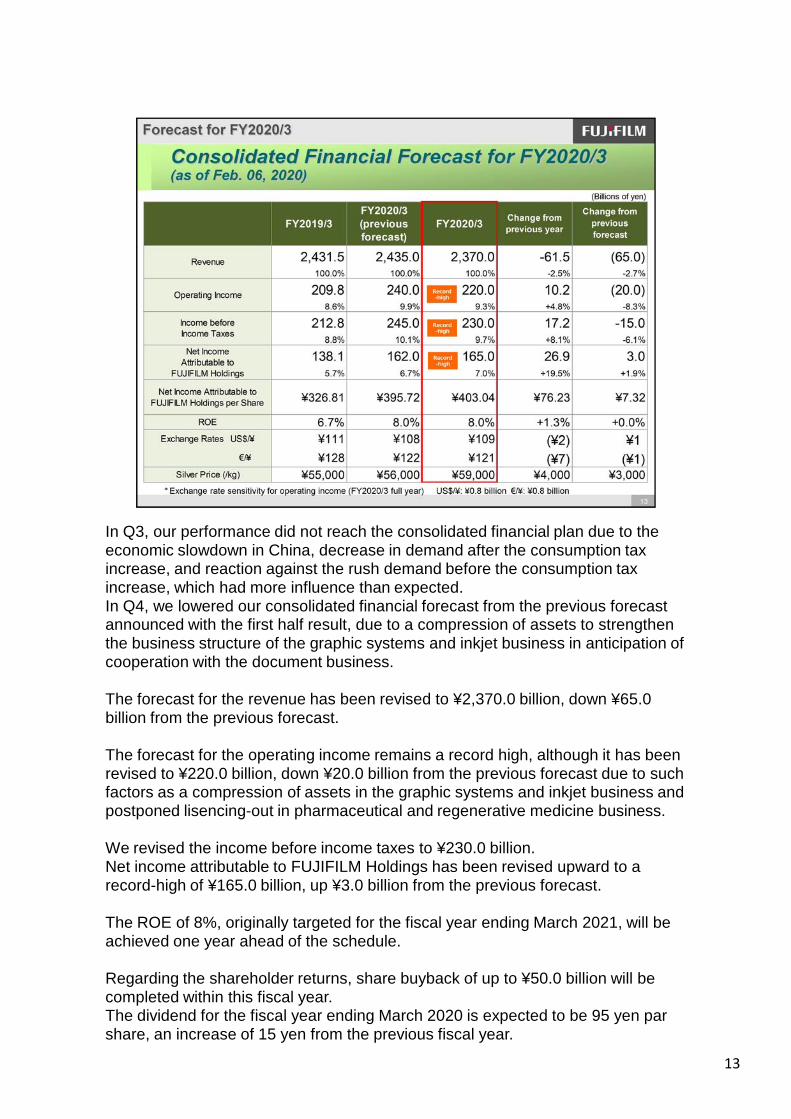
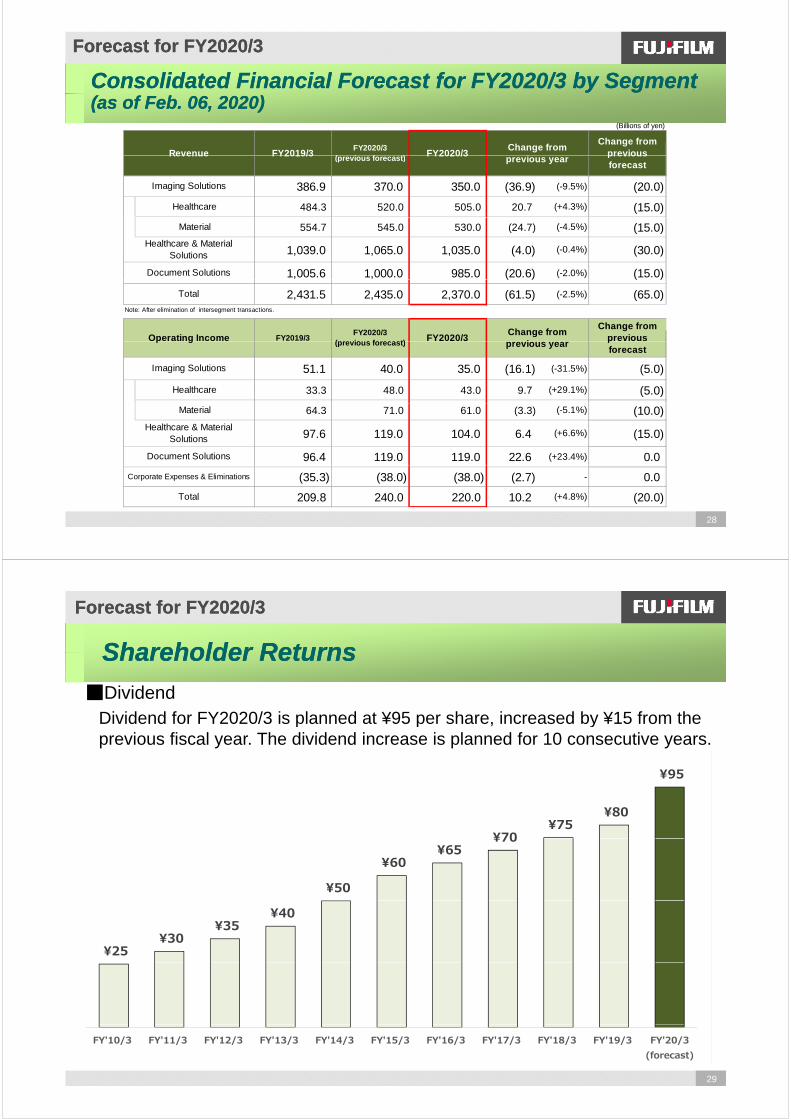
In Q3, our performance did not reach the consolidated financial plan due to the economic slowdown in China, decrease in demand after the consumption tax
13
increase, and reaction against the rush demand before the consumption tax increase, which had more influence than expected. In Q4, we lowered our consolidated financial forecast from the previous forecast announced with the first half result, due to a compression of assets to strengthen the business structure of the graphic systems and inkjet business in anticipation of cooperation with the document business.
The forecast for the revenue has been revised to ¥2,370.0 billion, down ¥65.0 billion from the previous forecast.
The forecast for the operating income remains a record high, although it has been revised to ¥220.0 billion, down ¥20.0 billion from the previous forecast due to such factors as a compression of assets in the graphic systems and inkjet business and postponed lisencing-out in pharmaceutical and regenerative medicine business.
We revised the income before income taxes to ¥230.0 billion.Net income attributable to FUJIFILM Holdings has been revised upward to a record-high of ¥165.0 billion, up ¥3.0 billion from the previous forecast.
The ROE of 8%, originally targeted for the fiscal year ending March 2021, will be achieved one year ahead of the schedule.
Regarding the shareholder returns, share buyback of up to ¥50.0 billion will be completed within this fiscal year.The dividend for the fiscal year ending March 2020 is expected to be 95 yen par share, an increase of 15 yen from the previous fiscal year.
Earnings for FY2020/3 Q3
AppendixAppendix
14
FY2020/3 Q3 AppendixFY2020/3 Q3 Appendix
Analysis of Operating Income ChangeAnalysis of Operating Income Change
170.0
(Against FY2019/3 Q3(Against FY2019/3 Q3 9Months) 9Months)
(Billions of yen)
+0.5160.0
-16.6
+15.1-11.4
+3.0-0.6
150.0
158.3
+1.6+1.7
140.0
151.6
130.0
120.0FY2019/3 Imaging Healthcare Document Structural Difference of FX Raw Others FY2020/3
0
Actual & Material
reformpositive
impact in Document
structuralreform
expenses inDocument
materialprice
Actual
15
FY2020/3 Q3 AppendixFY2020/3 Q3 Appendix
Earnings forEarnings for FY2020/3 Q3/9 MonthsFY2020/3 Q3/9 MonthsEarnings for Earnings for FY2020/3 Q3/9 MonthsFY2020/3 Q3/9 Months
(Billions of yen)
FY2019/3 FY2020/3 Change FY2019/3 FY2020/3 Change
Q3 9M
FY2019/3 FY2020/3 Change FY2019/3 FY2020/3 Change
627.1 596.3 (30.8) 1,799.8 1,728.4 (71.4)100.0% 100.0% -4.9% 100.0% 100.0% -4.0%
Revenue
74.4 59.6 (14.8) 158.3 151.6 (6.7)11.9% 10.0% -19.9% 8.8% 8.8% -4.2%
55 8 69 0 13 2 154 6 166 5 11 9Income before
Operating Income
55.8 69.0 13.2 154.6 166.5 11.98.9% 11.6% +23.8% 8.6% 9.6% +7.7%
35.6 59.6 24.0 101.1 120.7 19.65 7% 10 0% +67 4% 5 6% 7 0% +19 4%
Income before Income Taxes
Net Income Attributable toFUJIFILM Holdings 5.7% 10.0% +67.4% 5.6% 7.0% +19.4%
¥113 ¥109 (¥4) ¥111 ¥109 (¥2)¥129 ¥120 (¥9) ¥129 ¥121 (¥8)
Exchange US$/¥Rates €/¥
FUJIFILM Holdings
16
〈Other factors of change (Q3/9M YoY) 〉 Operating income --- Raw material prices: + ¥1.1 billion / + ¥3.0 billion
FY2020/3 Q3 AppendixFY2020/3 Q3 Appendix
Earnings forEarnings for FY2020/3 Q3/9 MonthsFY2020/3 Q3/9 MonthsEarnings for Earnings for FY2020/3 Q3/9 MonthsFY2020/3 Q3/9 Months(Billions of yen)
RevenueQ3 9M
FY2019/3 FY2020/3 FY2019/3 FY2020/3
127.9 112.0 (15.9) (-12.4%) 303.8 266.1 (37.7) (-12.4%)
Healthcare 119.5 120.4 0.9 (+0.8%) 342.9 350.8 7.9 (+2.3%)
Revenue
Imaging Solutions
H lth & M t i l
Change Change
259.9 248.5 (11.4) (-4.4%) 758.9 741.2 (17.7) (-2.3%)
239.3 235.8 (3.5) (-1.5%) 737.1 721.1 (16.0) (-2.2%)
627.1 596.3 (30.8) (-4.9%) 1,799.8 1,728.4 (71.4) (-4.0%)
Document Solutions
Total
Healthcare & MaterialSolutions
N t Aft li i ti f i t t t ti
(Billions of yen)
FY2019/3 FY2020/3 FY2019/3 FY2020/3
Q3
Note: After elimination of intersegment transactions
Operating Income[Operating Margin] ChangeChange
9M
26.4 17.3 48.0 27.4[20.6%] [15.4%] [15.7%] [10.3%]
15.0 8.9 17.4 20.0[12.5%] [7.3%] [5.1%] [5.7%]
Healthcare
Imaging Solutions (-34.5%)
2.6(-41.3%) (+14.2%)
(-42.8%)(9.1) (20.6)
(6.1)[12.5%] [7.3%] [5.1%] [5.7%]
32.5 25.8 70.0 70.8[12.5%] [10.4%] [9.2%] [9.6%]
23.6 25.6 66.9 80.5[9.9%] [10.9%] [9.0%] [11.2%]
(6.7)
C t E &
Document Solutions 2.0
Healthcare & MaterialSolutions
(+1.1%)(-20.7%) 0.8
13.6(+8.1%) (+20.3%)
17
(8.1) (9.1) (1.0) - (26.6) (27.1) (0.5) -
74.4 59.6 158.3 151.6[11.9%] [10.0%] [8.8%] [8.8%]
(14.8) (-19.9%)
Corporate Expenses &Eliminations
Total (6.7) (-4.2%)
FY2020/3 Q3 AppendixFY2020/3 Q3 Appendix
Earnings forEarnings for FY2020/3 Q3/9 MonthsFY2020/3 Q3/9 Months
Imaging SolutionsImaging Solutions
Earnings for Earnings for FY2020/3 Q3/9 MonthsFY2020/3 Q3/9 Months
g gg g(Billions of yen)
9MQ3
FY2020/3 ChangeChange FY2019/3Revenue
FY2019/3 FY2020/3
Photo Imaging 90.8 83.0 (7.8) (-8.7%) (4.6) (-5.2%) 203.7 183.5 (20.2) (-10.0%) (13.8) (-6.8%)
Electronic Imaging 26.6 20.7 (5.9) (-21.7%) (5.0) (-18.4%) 70.7 57.7 (13.0) (-18.3%) (10.4) (-14.6%)
Constant-currency basis
FY2020/3 ChangeConstant-
currency basis
Change FY2019/3FY2019/3 FY2020/3
Optical Devices 10.5 8.3 (2.2) (-20.2%) (1.9) (-17.3%) 29.4 24.9 -4.5 (-15.2%) (3.8) (-12.8%)
Optical Device &Electronic Imaging
Products37.1 29.0 (8.1) (-21.3%) (6.9) (-18.1%) 100.1 82.6 (17.5) (-17.4%) (14.2) (-14.1%)
127.9 112.0 (15.9) (-12.4%) (11.5) (-8.9%) 303.8 266.1 (37.7) (-12.4%) (28.0) (-9.2%)
Note: After elimination of intersegment transactions
(Billions of yen)
9MQ3
Total
Operating Income
26.4 17.3 48.0 27.4
Change Constant-currency basis
(7.6) (-29.0%)
Change
(-34.5%)(9.1)Imaging Solutions
Operating Income[Operating
Margin] FY2019/3 FY2020/3 Constant-currency basis
FY2019/3 FY2020/3
(16.6) (-34.5%)(20.6) (-42.8%)
18
[20.6%] [15.4%] [15.7%] [10.3%]( ) ( )( )( )g g ( ) ( )( ) ( )
Change in Quarterly Earnings byChange in Quarterly Earnings by SegmentSegment
FY2020/3 Q3 AppendixFY2020/3 Q3 Appendix
Change in Quarterly Earnings by Change in Quarterly Earnings by Segment Segment
Imaging SolutionsImaging Solutions (Billions of yen)Imaging SolutionsImaging Solutions (Billions of yen)
Revenue Operating Income
127.9
125.0
Photo Imaging90.8
112.0
26 4
30.0100.0
g g
ElectronicImaging Optical Device &
Electronic Imaging 83 0
83.1
74.679.5
26.4
20.075.0
(20.6%)
Operating Income for Imaging Solutions(O ti M i )
Optical Devices
Products53.8
46.9 53.6
83.0 17.3
10 0
50.0(15.4%)
(Operating Margin)
26.619.9 19.6
17.420.7
3.1
4.5 5.6
10.0
25.0
(3 7%)
(6.0%) (7.1%)
19
10.5 9.4 8.1 8.5 8.30.00.0
18.Q3 18.Q4 19.Q1 19.Q2 19.Q3
(3.7%)
FY2020/3 Q3 AppendixFY2020/3 Q3 Appendix
Earnings forEarnings for FY2020/3 Q3/9 MonthsFY2020/3 Q3/9 Months
Healthcare & Material SolutionsHealthcare & Material Solutions
Earnings for Earnings for FY2020/3 Q3/9 MonthsFY2020/3 Q3/9 Months
(Billions of yen)
119 5 120 4 0 9 3 7 342 9 350 8 7 9 15 8
9M
RevenueFY2019/3 Change
H l h
Q3
Change Constant-currencybasis
Constant-currencybasis
FY2020/3FY2020/3 FY2019/3
119.5 120.4 0.9 (+0.8%) 3.7 (+3.2%) 342.9 350.8 7.9 (+2.3%) 15.8 (+4.6%)
Display Materials 26.3 21.5 (4.8) (-18.4%) (4.8) (-18.4%) 77.0 67.7 (9.3) (-12.1%) (9.3) (-12.1%)
Industrial ProductsElectronic Materials
Fine Chemical46.7 44.7 (2.0) (-4.3%) (0.6) (-1.4%) 134.4 129.9 (4.5) (-3.3%) (1.5) (-1.1%)
Highly Functional
Healthcare
Highly FunctionalMaterials 73.0 66.2 (6.8) (-9.4%) (5.4) (-7.5%) 211.4 197.6 (13.8) (-6.5%) (10.8) (-5.1%)
9.2 9.2 0.0 (+0.1%) 0.4 (+4.2%) 27.2 32.4 5.2 (+19.0%) 6.0 (+21.9%)
57.8 52.5 (5.3) (-9.4%) (3.6) (-6.4%) 176.4 159.5 (16.9) (-9.6%) (12.2) (-7.0%)
0.4 0.2 (0.2) (0.2) 1.0 0.9 (0.1) (0.1)
Recording Media
Others
Graphic Systems/Inkjet
( ) ( ) ( ) ( )
259.9 248.5 (11.4) (-4.4%) (5.1) (-2.0%) 758.9 741.2 (17.7) (-2.3%) (1.3) (-0.2%)
Note: After elimination of intersegment transactions
(Billions of yen)
9MOperating Income
Total
Q3
15.0 8.9 17.4 20.0[12.5%] [7.3%] [5.1%] [5.7%]
32 5 25 8 70 0 70 8Healthcare & Material (6 7)
(6.1)
Ope at g co e[Operating Margin] FY2019/3
Healthcare
Constant-currencybasis
(-41.3%) (6.1) (-41.3%)
FY2020/3 Change
(5 8)
Change
(+14.2%)
Constant-currencybasis
4.4 (+24.6%)
FY2019/3 FY2020/3
2.6
0 8 4 6
20
32.5 25.8 70.0 70.8[12.5%] [10.4%] [9.2%] [9.6%]
Healthcare & MaterialSolutions (6.7) (-20.7%) (5.8) (-17.9%) 0.8 (+1.1%) 4.6 (+6.5%)
Change in Quarterly Earnings byChange in Quarterly Earnings by SegmentSegment
FY2020/3 Q3 AppendixFY2020/3 Q3 Appendix
Healthcare & Material SolutionsHealthcare & Material Solutions
Change in Quarterly Earnings by Change in Quarterly Earnings by Segment Segment
(Billions of yen)Revenue
Operating Income
259 9
280.1265.1
Display Materials
Healthcare
119.5 141.4
259.9
227.6
248.532.5
27.630.0
250.0
(12.5%)
Recording Media
Industrial ProductsElectronic MaterialsFine Chemical
104.1
126.3120.426.1
25.8
20.0150.0
200.0 (9.9%)
(9.9%)
(10.4%)
Graphic SystemsInkjet
Recording Media
Oth46.7 45.4
41.244.0
44.7
26.3 21.2
20.825.4
21.5
18.9
100.0
(8.3%)
Operating Income for Healthcare & Material
Others
57.8 60.3 51.5 55.5 52.5
9.2 11.69.7
13.5 9.2
41.210.0
50.0
21
Solutions(Operating Margin)0.00.0
18.Q3 18.Q4 19.Q1 19.Q2 19.Q3
FY2020/3 Q3 AppendixFY2020/3 Q3 Appendix
Earnings forEarnings for FY2020/3 Q3/9 MonthsFY2020/3 Q3/9 Months
Document SolutionsDocument Solutions
Earnings for Earnings for FY2020/3 Q3/9 MonthsFY2020/3 Q3/9 Months
(Billions of yen)
Revenue
9MQ3
Constant-currencyb i
Change Constant-currencyb i
FY2019/3 FY2020/3 ChangeFY2019/3FY2020/
3
Office Printers 31.5 29.0 (2.5) (-8.1%) (1.9) (-5.9%) 94.2 89.1 (5.1) (-5.4%) (4.0) (-4.2%)
139.3 133.4 (5.9) (-4.3%) (3.2) (-2.3%) 425.6 406.5 (19.1) (-4.5%) (12.9) (-3.0%)Office Products & Printers
basisbasis3
29.1 29.6 0.5 (+2.0%) 1.2 (+4.4%) 90.7 88.4 (2.3) (-2.5%) (0.4) (-0.4%)
60.0 65.2 5.2 (+8.8%) 6.4 (+10.8%) 184.3 201.8 17.5 (+9.5%) 21.1 (+11.5%)
10.9 7.6 (3.3) (2.8) 36.5 24.4 (12.1) (11.1)
Production Services
Solutions & Services
Others
239.3 235.8 (3.5) (-1.5%) 1.6 (+0.6%) 737.1 721.1 (16.0) (-2.2%) (3.3) (-0.5%)
Note: After elimination of intersegment transactions
(Billions of yen)
9M
Total
Q3 9M
23.6 25.6 66.9 80.5
Constant-currencybasis
ChangeFY2019/3FY2020/
3
17.3 (+25.8%)13.6 (+20.3%)
Operating Income[Operating Margin]
Document Solutions 2.9 (+12.2%)(+8.1%)2.0
FY2019/3FY2020/
3Change
Q3
Constant-currencybasis
22
[9.9%] [10.9%] [9.0%] [11.2%]
Change in Quarterly Earnings byChange in Quarterly Earnings by SegmentSegment
FY2020/3 Q3 AppendixFY2020/3 Q3 Appendix
Document SolutionsDocument Solutions (Billions of yen)
Change in Quarterly Earnings by Change in Quarterly Earnings by Segment Segment
268.5
252.2
Revenue Operating Income
143 5
239.3 233.1 235.8
40.0200.0 Office Products & Office Printers
139.3
143.5
133.7
139.4133.4
29.533.2
(11.0%)
(13.2%)
Office Products & Office Printers
Production Services
Solutions & Services
29.1
32.6
27.331.5
29.6
23.6 21.7
25.6
20.0100.0 (9.9%)(9.3%)
(10.9%)
Solutions & Services
Operating Income for Doc ment Sol tions
Others
60.076.9
62.5 74.1 65.2
Operating Income for Document Solutions(Operating Margin)
0.00.018.Q3 18.Q4 19.Q1 19.Q2 19.Q3
23
RevenueRevenue by Destinationby Destination
FY2020/3 Q3 AppendixFY2020/3 Q3 Appendix
Revenue Revenue by Destinationby Destination
(Billions of yen)
Ratio (%) Ratio (%)
FY2020/3 9MChange
FY2019/3 9M
40.3% 724.7 42.3% 730.5 5.8 (+0.8%)
19 6% 353 7 18 6% 322 9 (30 8) (-8 7%)
Japan
The Americas 19.6% 353.7 18.6% 322.9 (30.8) ( 8.7%)
13.2% 237.1 13.1% 225.9 (11.2) (-4.7%)Europe
The Americas
China 12.6% 226.0 12.1% 209.5 (16.5) (-7.3%)
Asia and others 26.9% 484.3 26.0% 449.1 (35.2) (-7.3%)
Overseas 59.7% 1,075.1 57.7% 997.9 (77.2) (-7.2%)
100 0% 1 799 8 100 0% 1 728 4 (71 4) ( 4 0%)C lid t d t t l
24
100.0% 1,799.8 100.0% 1,728.4 (71.4) (-4.0%)Consolidated total
CapitalCapital ExpenditureExpenditure Depreciation & AmortizationDepreciation & Amortization
FY2020/3 Q3 AppendixFY2020/3 Q3 Appendix
58.7
Capital Capital Expenditure, Expenditure, Depreciation & AmortizationDepreciation & AmortizationCapital Expenditure (9M) (Billions of yen)
Q3 Full year9 months
6.2 6.7
8.7
46.3 46.5 FY2018/3
FY2019/3
FY2020/3
FY2018/3
FY2019/3
FY2020/3
FY2018/3
FY2019/3
FY2020/3(forecast)
Imaging 2.4 1.6 2.9 6.2 6.7 8.7 9.4 10.6Healthcare & Material 10 2 11 2 14 6 27 3 30 0 41 2 42 7 50 5
11 9 7 9
27.3 30.041.2
Healthcare & Material 10.2 11.2 14.6 27.3 30.0 41.2 42.7 50.5Document 3.7 3.2 3.1 11.9 7.9 7.7 13.8 11.7Corporate 0.4 1.5 0.3 0.9 1.9 1.1 1.6 2.6
Capex * 16.7 17.5 20.9 46.3 46.5 58.7 67.5 75.4 90.0
95.3 95.691 8
11.9 7.9 7.7
FY2018/3
FY2019/3
FY2020/3
Depreciation & Amortization (9M)
Imaging 3.3 3.6 3.8 9.8 10.6 10.8 13.3 14.1Healthcare & Material 14.6 15.9 16.9 42.8 45.6 47.4 57.5 63.1Document 15.3 12.2 10.0 40.9 37.7 31.8 54.7 50.1Corporate 0.5 0.7 0.6 1.8 1.7 1.8 2.1 2.6
42.8 45.647.4
9.8 10.610.8
91.8 p 0.5 0.7 0.6 1.8 1.7 1.8 2.1 2.6
33.7 32.4 31.3 95.3 95.6 91.8 127.6 129.9 128.0
16.6 17.5 17.8 49.4 50.9 51.2 66.5 70.9 Depreciation *
Depreciation& Amortization
40.9 37.7 31.8
*Note : Figures do not include amounts for rental equipmenthandled by the Document Solutions segment and others.
Imaging
DocumentCorporate
Healthcare & Material
N t
FY2018/3
FY2019/3
FY2020/3
25
p
R&D Expenses SG&A ExpensesR&D Expenses SG&A Expenses
FY2020/3 Q3 AppendixFY2020/3 Q3 Appendix
R&D Expenses, SG&A ExpensesR&D Expenses, SG&A Expenses
(Billi f )
R&D Expenses (9M)
(Billions of yen)
FY2019/3 FY2020/3 FY2019/3 FY2020/3 FY2019/3FY2020/3(forecast)
Q3 9 months Full Year
115.8 118.0
Imaging 2.3 2.4 7.2 7.9 9.9
Healthcare &Material
15.9 16.6 50.9 51.4 69.850.9 51.4
7.2 7.9
Document 12.0 12.6 39.2 38.4 51.2
Corporate 6.1 6.7 18.5 20.3 25.2
R&D Expenses 36.3 38.3 115.8 118.0 156.1 155.039 2 38 4
50 9
5.8% 6.4% 6.4% 6.8% 6.4% 6.5%
156.8 151.6 480.3 453.5 631.6
<ratio to revenue>
SG&A Expenses18.5 20.3
39.2 38.4
ImagingHealthcare & Material
25.0% 25.4% 26.7% 26.2% 26.0% <ratio to revenue>FY2019/3 FY2020/3
26
DocumentCorporate
ExchangeExchange RatesRates Raw Material Prices and Number of EmployeesRaw Material Prices and Number of Employees
FY2020/3 Q3 AppendixFY2020/3 Q3 Appendix
Exchange Exchange Rates, Rates, Raw Material Prices, and Number of EmployeesRaw Material Prices, and Number of Employees
Exchange Rates (yen)Exchange Rates (yen)
Q1 Q2 Q3 9M Q4 Full year Q1 Q2 Q3 9M Full year(forecast)
US$/¥ 109 111 113 111 110 111 110 107 109 109 109
FY2020/3FY2019/3
US$/¥ 109 111 113 111 110 111 110 107 109 109 109
€/¥ 130 130 129 129 125 128 123 119 120 121 121
Raw Material Prices (Average) (¥1,000/kg)
Q1 Q2 Q3 9M Q4 Full year Q1 Q2 Q3 9M Full year(forecast)
FY2020/3FY2019/3
Silver 58 54 53 55 55 55 53 57 60 57 59
Number of EmployeesNumber of Employees2018.Dec 2019.Mar 2019.Jun 2019.Sep 2019.Dec
74,425 72,332 72,358 72,842 73,092Consolidated Total
27
Forecast for Forecast for FY2020/3FY2020/3
Consolidated Financial Forecast for Consolidated Financial Forecast for FY2020/3 FY2020/3 by by Segment Segment (as of (as of Feb. 06, 2020)Feb. 06, 2020)
(Billions of yen)
Revenue FY2019/3 FY2020/3Change from
previousFY2020/3
( i f t)Change from
i
386.9 370.0 350.0 (36.9) (-9.5%) (20.0)
Healthcare 484.3 520.0 505.0 20.7 (+4.3%) (15.0)
Revenue FY2019/3 FY2020/3
Imaging Solutions
previousforecast
(previous forecast) previous year
Material 554.7 545.0 530.0 (24.7) (-4.5%) (15.0)
1,039.0 1,065.0 1,035.0 (4.0) (-0.4%) (30.0)
1,005.6 1,000.0 985.0 (20.6) (-2.0%) (15.0)
Healthcare & MaterialSolutions
Document Solutions ( ) ( )
2,431.5 2,435.0 2,370.0 (61.5) (-2.5%) (65.0)Note: After elimination of intersegment transactions.
Total
Operating Income FY2019/3 FY2020/3Change from
previousFY2020/3
(pre io s forecast)Change from
i
51.1 40.0 35.0 (16.1) (-31.5%) (5.0)
Healthcare 33.3 48.0 43.0 9.7 (+29.1%) (5.0)
Imaging Solutions
p g pforecast
(previous forecast) previous year
Material 64.3 71.0 61.0 (3.3) (-5.1%) (10.0)
97.6 119.0 104.0 6.4 (+6.6%) (15.0)
96.4 119.0 119.0 22.6 (+23.4%) 0.0
Healthcare & MaterialSolutions
Document Solutions
28
(35.3) (38.0) (38.0) (2.7) - 0.0
209.8 240.0 220.0 10.2 (+4.8%) (20.0)Total
Corporate Expenses & Eliminations
Shareholder ReturnsShareholder Returns
Forecast for FY2020/3Forecast for FY2020/3
■DividendDividend for FY2020/3 is planned at ¥95 per share increased by ¥15 from the
Shareholder ReturnsShareholder Returns
¥95
Dividend for FY2020/3 is planned at ¥95 per share, increased by ¥15 from the previous fiscal year. The dividend increase is planned for 10 consecutive years.
¥70¥75
¥80
¥95
¥50
¥60 ¥65
¥70
¥25 ¥30
¥35 ¥40
FY'10/3 FY'11/3 FY'12/3 FY'13/3 FY'14/3 FY'15/3 FY'16/3 FY'17/3 FY'18/3 FY'19/3 FY'20/3(forecast)
29
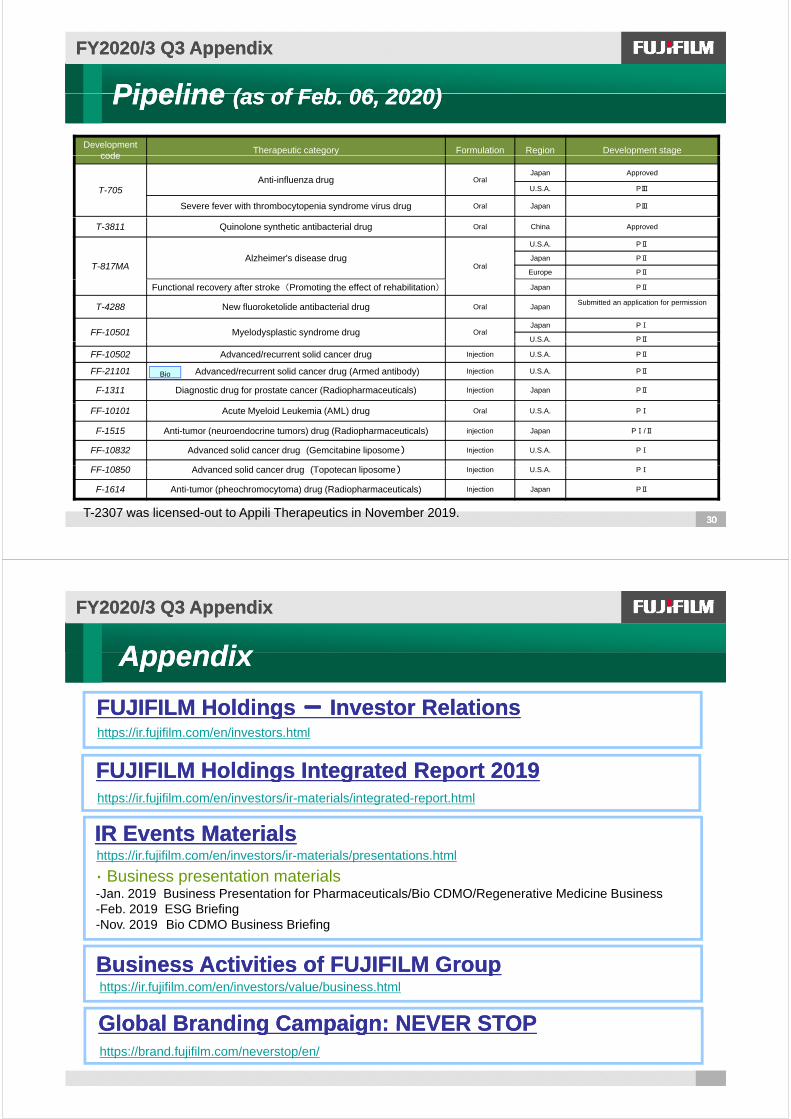
PipelinePipeline (as of Feb 06 2020)(as of Feb 06 2020)
FY2020/3 Q3 AppendixFY2020/3 Q3 Appendix
Pipeline Pipeline (as of Feb. 06, 2020)(as of Feb. 06, 2020)
Development code
Therapeutic category Formulation Region Development stagecode
T-705Anti-influenza drug Oral
Japan Approved
U.S.A. PⅢ
Severe fever with thrombocytopenia syndrome virus drug Oral Japan PⅢ
T-3811 Quinolone synthetic antibacterial drug Oral China Approved
T-817MAAlzheimer's disease drug
Oral
U.S.A. PⅡ
Japan PⅡ
Europe PⅡ
Functional recovery after stroke (Promoting the effect of rehabilitation) Japan PⅡ
T-4288 New fluoroketolide antibacterial drug Oral JapanSubmitted an application for permission
FF-10501 Myelodysplastic syndrome drug OralJapan PⅠ
U.S.A. PⅡU.S.A. PⅡ
FF-10502 Advanced/recurrent solid cancer drug Injection U.S.A. PⅡ
FF-21101 Advanced/recurrent solid cancer drug (Armed antibody) Injection U.S.A. PⅡ
F-1311 Diagnostic drug for prostate cancer (Radiopharmaceuticals) Injection Japan PⅡ
Bio
FF-10101 Acute Myeloid Leukemia (AML) drug Oral U.S.A. PⅠ
F-1515 Anti-tumor (neuroendocrine tumors) drug (Radiopharmaceuticals) injection Japan PⅠ/Ⅱ
FF-10832 Advanced solid cancer drug (Gemcitabine liposome) Injection U.S.A. PⅠ
30303030
FF-10850 Advanced solid cancer drug (Topotecan liposome) Injection U.S.A. PⅠ
F-1614 Anti-tumor (pheochromocytoma) drug (Radiopharmaceuticals) Injection Japan PⅡ
T-2307 was licensed-out to Appili Therapeutics in November 2019.
AppendixAppendix
FY2020/3 Q3 AppendixFY2020/3 Q3 Appendix
AppendixAppendix
FUJIFILM HoldingsFUJIFILM Holdings -- Investor RelationsInvestor RelationsFUJIFILM Holdings FUJIFILM Holdings Investor RelationsInvestor Relationshttps://ir.fujifilm.com/en/investors.html
FUJIFILM HoldingsFUJIFILM Holdings IntegratedIntegrated ReportReport 20192019
IR Events MaterialsIR Events Materials
FUJIFILM Holdings FUJIFILM Holdings Integrated Integrated Report Report 20192019https://ir.fujifilm.com/en/investors/ir-materials/integrated-report.html
IR Events MaterialsIR Events Materialshttps://ir.fujifilm.com/en/investors/ir-materials/presentations.html
・ Business presentation materials-Jan. 2019 Business Presentation for Pharmaceuticals/Bio CDMO/Regenerative Medicine Business
Business Activities of FUJIFILM GroupBusiness Activities of FUJIFILM Group
-Feb. 2019 ESG Briefing-Nov. 2019 Bio CDMO Business Briefing
31
Business Activities of FUJIFILM GroupBusiness Activities of FUJIFILM Group
Global Branding Campaign: NEVER STOPGlobal Branding Campaign: NEVER STOP
https://ir.fujifilm.com/en/investors/value/business.html
Global Branding Campaign: NEVER STOPGlobal Branding Campaign: NEVER STOPhttps://brand.fujifilm.com/neverstop/en/
At F jifil ti l i ti tiAt Fujifilm, we are continuously innovating — creatingnew technologies, products and services that inspire
and excite people everywhere.Our goal is to empower the potential and expand
the horizons of tomorrow’s businesses and lifestyles.
Corporate Communication Office, Corporate Planning Div.
https://holdings.fujifilm.com/en