Embed Size (px)
Citation preview
IBM COGNOS SALES QUOTA ALLOCATIONPERFORMANCE BLUEPRINT
A WEB-BASED
PERFORMANCE
MANAGEMENT
APPLICATION
Business Value Guide

2
2
INTRODUCTION
Pharmaceutical companies are widely recognized for having outstanding sales forces. Many pharmaceuticals have
hundreds of sales people – and thousands, in the case of the largest companies – that bring the latest in prescription
drugs to our doctors. These sales people often have hundreds of drugs that they must be able to understand and
position in the market. And when the sales person from one company leaves an office, one from a competitor
takes the next turn.
Complex is an understatement.
The management of such of sales force is no less complex. How does a pharmaceutical company manage its sales
force to maximize revenue? How does it provide the right incentives to sales representatives? How does it ensure
that the company is selling the highest value prescription drugs? How does it account for insurance plans? How
does it assist the dozens or hundreds of sales managers with the management of the sales teams?
Most pharmaceutical companies have struggled with a manual process in which hundreds of sales managers
assign quotas using a spreadsheet, then submit those spreadsheets up the line for consolidation. These distributed
managers often assign quotas in very different ways – one may assign quota based on market volume, another
may be influenced by market growth rates, and yet another may simply use a market share target. Worse, some
managers may change quotas without leaving an audit trail – leaving a wake of confusion. The recipient of all
these disparate spreadsheets has the thankless task of tracking which managers have submitted quotas and
consolidating the data. Finally, the incentive analyst has to try to make sense of all of the different methods used
to assign quotas across the company, so that he or she can attempt to optimize sales.
3
With the IBM Cognos Sales Quota Allocation Performance Blueprint, there is a better way. A much better
way.
The IBM Cognos Sales Quota Allocation Performance Blueprint leverages IBM Cognos 8 Planning and IBM
Cognos 8 Business Intelligence to enable incentive compensation analysts and sales managers to determine the
proper sales quota for each territory, addressing changing market conditions while meeting corporate revenue
objectives.
The Blueprint provides three major pieces of functionality:
• A dashboard that allows the incentive analyst and sales management to visualize historical and
projected sales quota attainment
• A forecasting and modeling capability through which the incentive analyst can determine the optimal
weighting of key sales quota drivers, and through which sales management can customize quota plans
based on local market conditions (with an audit trail, of course!)
• Workflow management that eliminates the use of distributed spreadsheets, removing the manual
reconciliation function and greatly simplifying process management.
The use of the IBM Cognos Sales Quota Allocation Performance Blueprint significantly reduces the time,
overhead, and cost associated with quota management; enables pharmaceutical companies to move ever
closer to optimizing revenue through quota allocation; and ultimately drives increased revenue and prof-
itability.
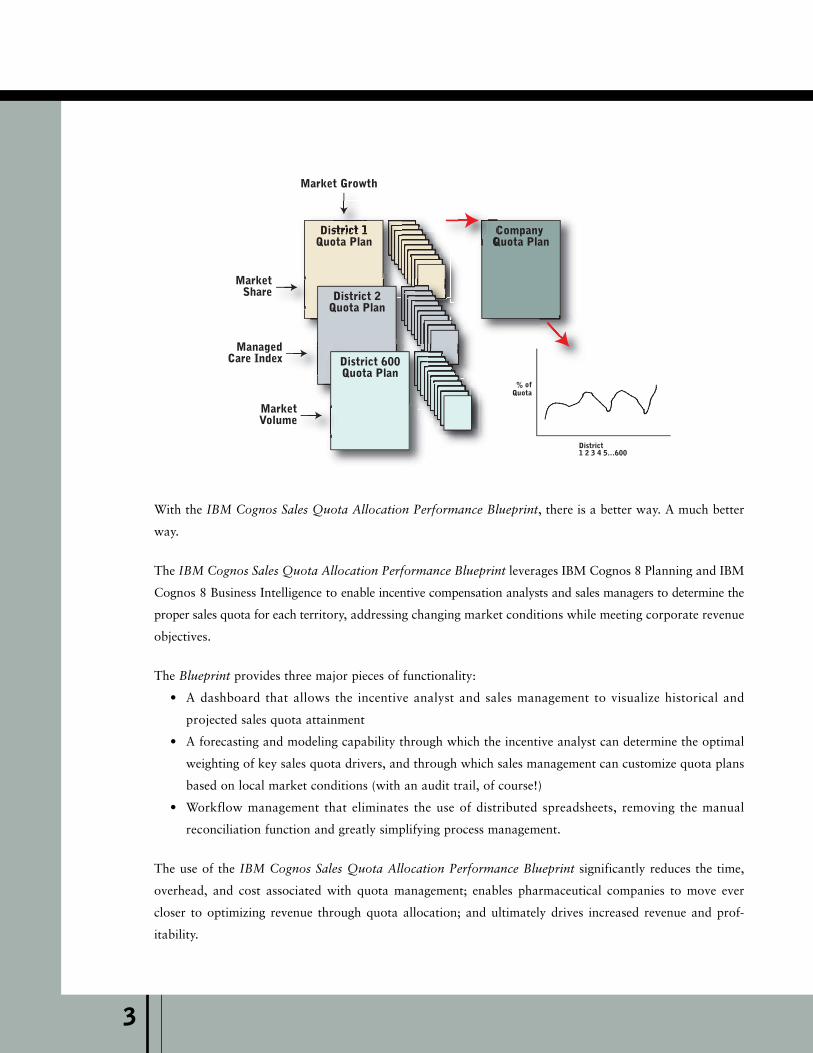
District 1Quota Plan
Company Quota Plan
District 2Quota Plan
District 600Quota Plan
MarketVolume
ManagedCare Index
MarketShare
Market Growth
% ofQuota
District1 2 3 4 5…600
4
IBM COGNOS SALES QUOTA ALLOCATION PERFORMANCE BLUEPRINT IN ACTION
Analysis, Dashboards, and Scorecards
The IBM Cognos Sales Quota Allocation Performance Blueprint provides a hierarchy of dashboards and
reporting designed to guide the user through a clearer understanding of the allocation outcomes.
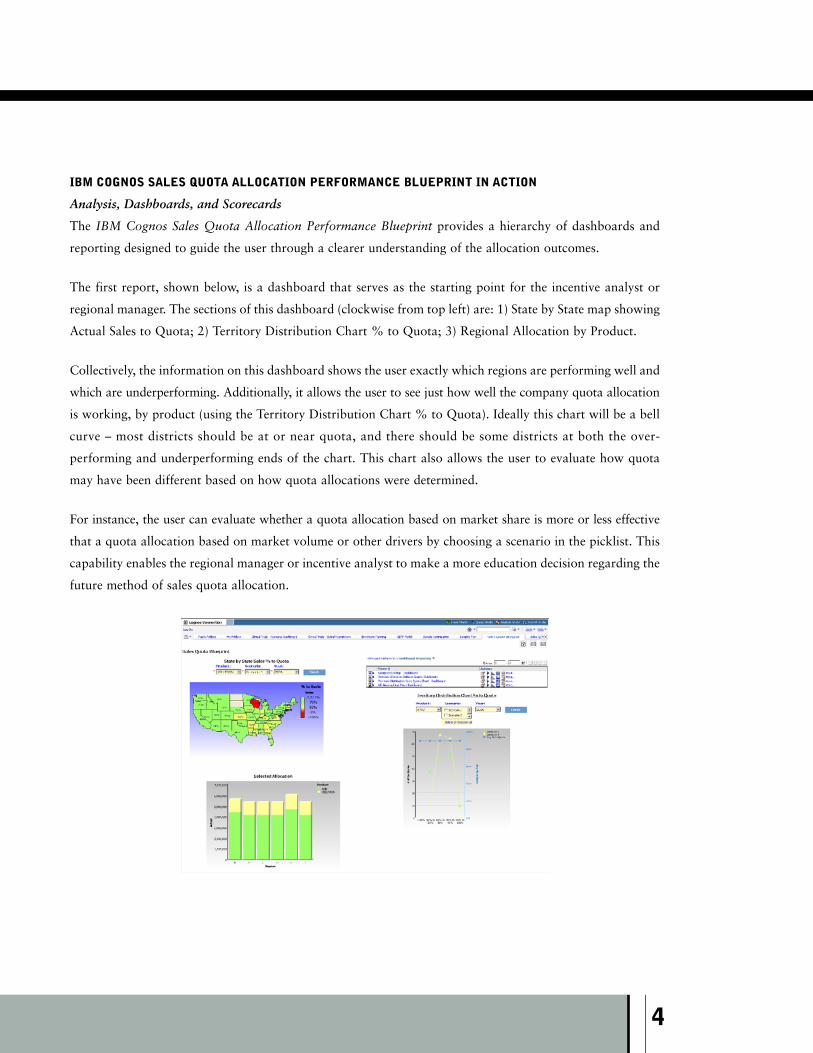
The first report, shown below, is a dashboard that serves as the starting point for the incentive analyst or
regional manager. The sections of this dashboard (clockwise from top left) are: 1) State by State map showing
Actual Sales to Quota; 2) Territory Distribution Chart % to Quota; 3) Regional Allocation by Product.
Collectively, the information on this dashboard shows the user exactly which regions are performing well and
which are underperforming. Additionally, it allows the user to see just how well the company quota allocation
is working, by product (using the Territory Distribution Chart % to Quota). Ideally this chart will be a bell
curve – most districts should be at or near quota, and there should be some districts at both the over-
performing and underperforming ends of the chart. This chart also allows the user to evaluate how quota
may have been different based on how quota allocations were determined.
For instance, the user can evaluate whether a quota allocation based on market share is more or less effective
that a quota allocation based on market volume or other drivers by choosing a scenario in the picklist. This
capability enables the regional manager or incentive analyst to make a more education decision regarding the
future method of sales quota allocation.
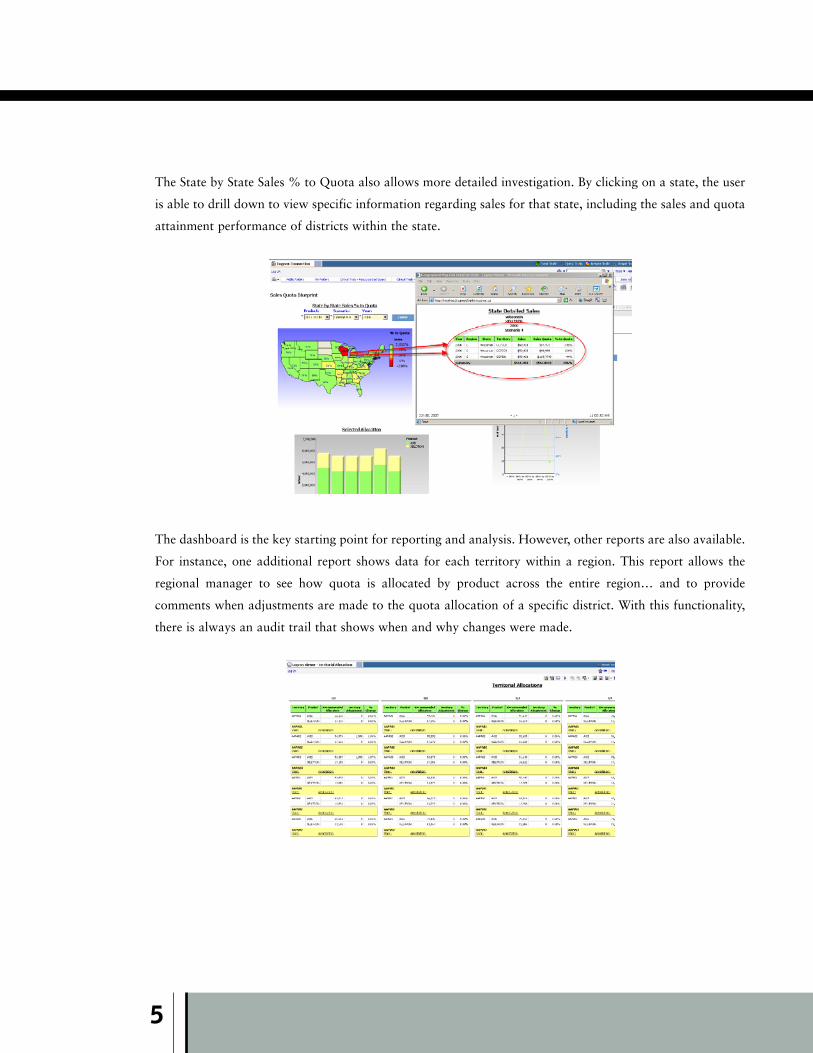
The State by State Sales % to Quota also allows more detailed investigation. By clicking on a state, the user
is able to drill down to view specific information regarding sales for that state, including the sales and quota
attainment performance of districts within the state.
The dashboard is the key starting point for reporting and analysis. However, other reports are also available.
For instance, one additional report shows data for each territory within a region. This report allows the
regional manager to see how quota is allocated by product across the entire region… and to provide
comments when adjustments are made to the quota allocation of a specific district. With this functionality,
there is always an audit trail that shows when and why changes were made.
5
6
SALES QUOTA ALLOCATION: FORECASTING AND PLANNING
Performance management systems allow management to articulate goals and provide a measurement process
so that performance against the goals can be tracked and feedback provided. At a corporate level, managers
focus on the overall sales forecast. At the regional level, managers make decisions to optimize distribution
among the territories to meet regional sales quota. Collaboration must occur on a forward-looking basis so
that decisions are aligned with corporate expectations, and so that variances can be evaluated.
Regional managers need clear targets and goals, and an understanding of how they are defined. Managers
must be able to forecast sales, and have continuous feedback on their performance against corporate targets
and sales forecasts. The IBM Cognos Sales Quota Allocation Performance Blueprint can meet these needs.
The Blueprint incorporates a driver-based algorithm to distribute the company-wide brand sales forecast to
territories. While the following drivers are used in the Blueprint, the number and types of drivers can be
modified to meet specific conditions:
• Market Volume
• Product Market Share
• Managed Care Index
• Market Growth %
The intended flow of this model assumes that the incentive analyst will prepare the initial allocation to all
territories based on the drivers indicated above. The data necessary to determine this allocation resides only
in the incentive analyst’s Web view; therefore, this view is quite different from that of the regional manager’s.
The task of the analyst is to evaluate the various scenario outcomes in order to determine the best allocation
of the sales quota to the territories. This recommended allocation will be pushed to the regions using the
Blueprint’s workflow functionality.
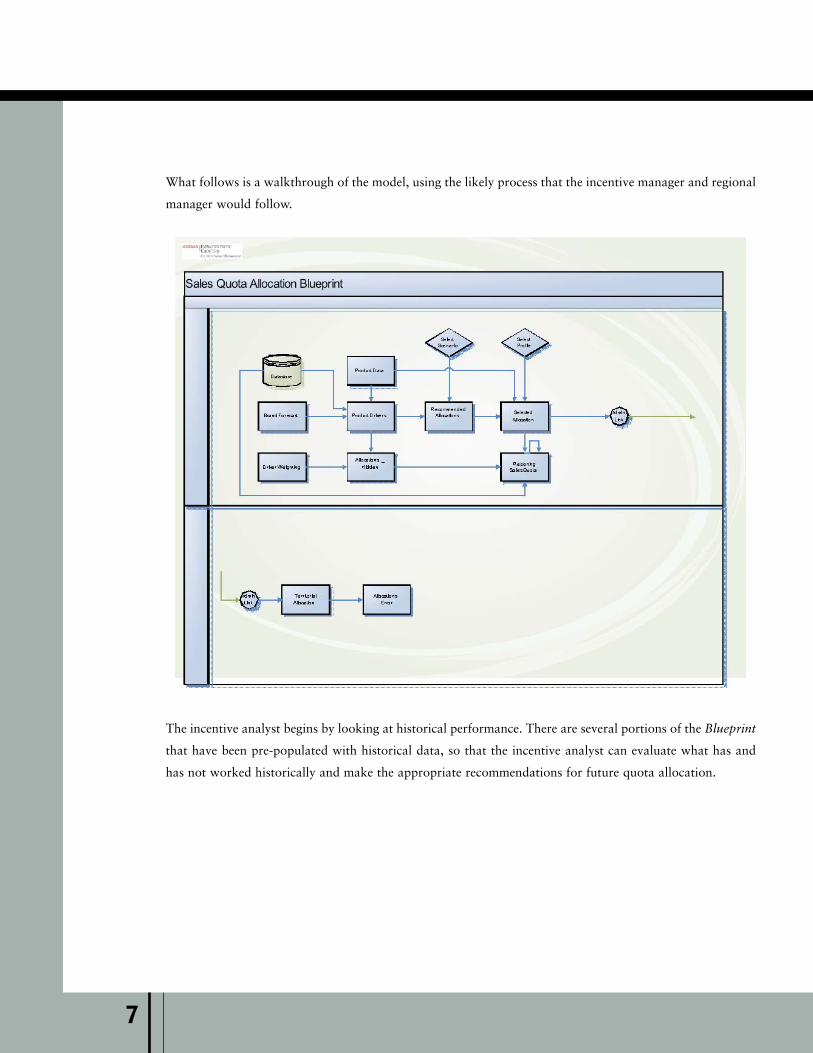
What follows is a walkthrough of the model, using the likely process that the incentive manager and regional
manager would follow.
The incentive analyst begins by looking at historical performance. There are several portions of the Blueprint
that have been pre-populated with historical data, so that the incentive analyst can evaluate what has and
has not worked historically and make the appropriate recommendations for future quota allocation.
7
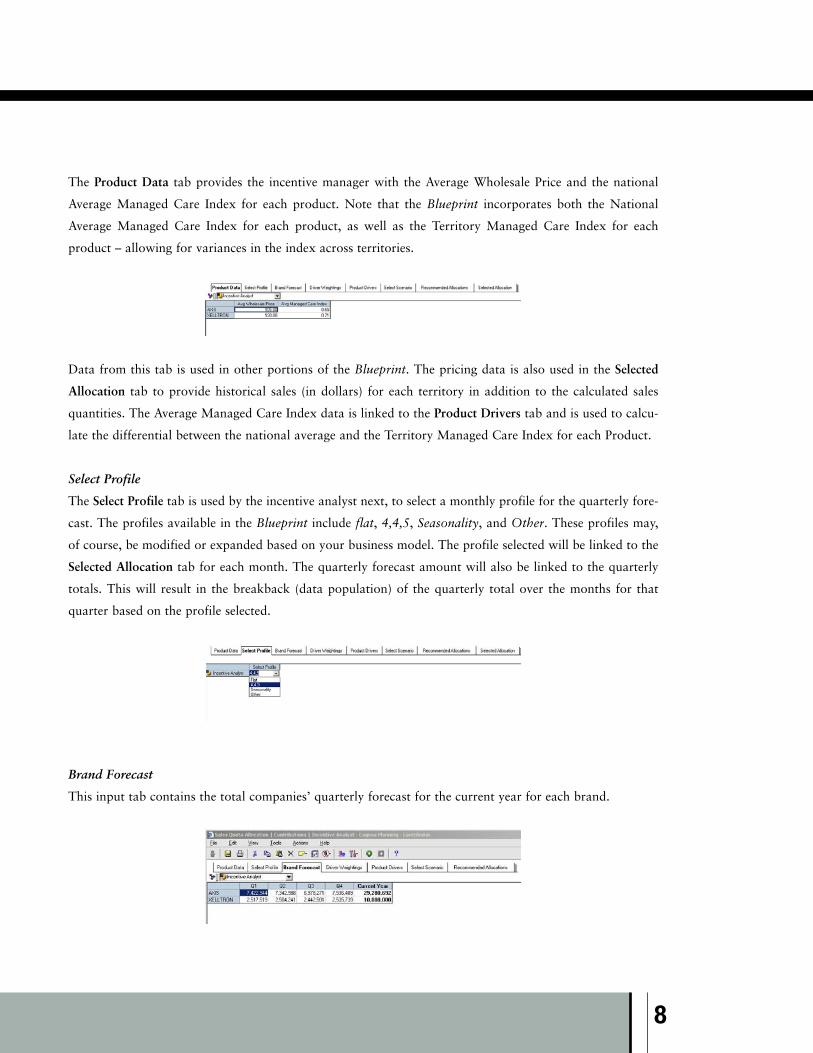
The Product Data tab provides the incentive manager with the Average Wholesale Price and the national
Average Managed Care Index for each product. Note that the Blueprint incorporates both the National
Average Managed Care Index for each product, as well as the Territory Managed Care Index for each
product – allowing for variances in the index across territories.
Data from this tab is used in other portions of the Blueprint. The pricing data is also used in the Selected
Allocation tab to provide historical sales (in dollars) for each territory in addition to the calculated sales
quantities. The Average Managed Care Index data is linked to the Product Drivers tab and is used to calcu-
late the differential between the national average and the Territory Managed Care Index for each Product.
Select Profile
The Select Profile tab is used by the incentive analyst next, to select a monthly profile for the quarterly fore-
cast. The profiles available in the Blueprint include flat, 4,4,5, Seasonality, and Other. These profiles may,
of course, be modified or expanded based on your business model. The profile selected will be linked to the
Selected Allocation tab for each month. The quarterly forecast amount will also be linked to the quarterly
totals. This will result in the breakback (data population) of the quarterly total over the months for that
quarter based on the profile selected.
Brand Forecast
This input tab contains the total companies’ quarterly forecast for the current year for each brand.
8
9
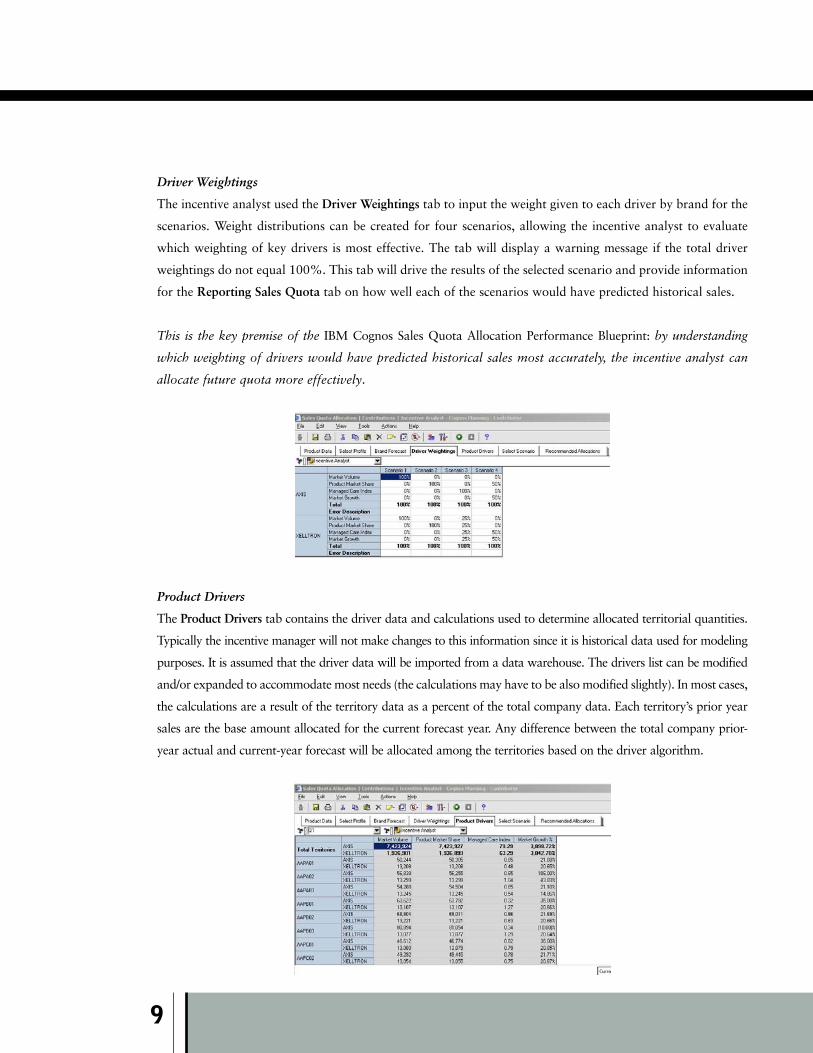
Driver Weightings
The incentive analyst used the Driver Weightings tab to input the weight given to each driver by brand for the
scenarios. Weight distributions can be created for four scenarios, allowing the incentive analyst to evaluate
which weighting of key drivers is most effective. The tab will display a warning message if the total driver
weightings do not equal 100%. This tab will drive the results of the selected scenario and provide information
for the Reporting Sales Quota tab on how well each of the scenarios would have predicted historical sales.
This is the key premise of the IBM Cognos Sales Quota Allocation Performance Blueprint: by understanding
which weighting of drivers would have predicted historical sales most accurately, the incentive analyst can
allocate future quota more effectively.
Product Drivers
The Product Drivers tab contains the driver data and calculations used to determine allocated territorial quantities.
Typically the incentive manager will not make changes to this information since it is historical data used for modeling
purposes. It is assumed that the driver data will be imported from a data warehouse. The drivers list can be modified
and/or expanded to accommodate most needs (the calculations may have to be also modified slightly). In most cases,
the calculations are a result of the territory data as a percent of the total company data. Each territory’s prior year
sales are the base amount allocated for the current forecast year. Any difference between the total company prior-
year actual and current-year forecast will be allocated among the territories based on the driver algorithm.
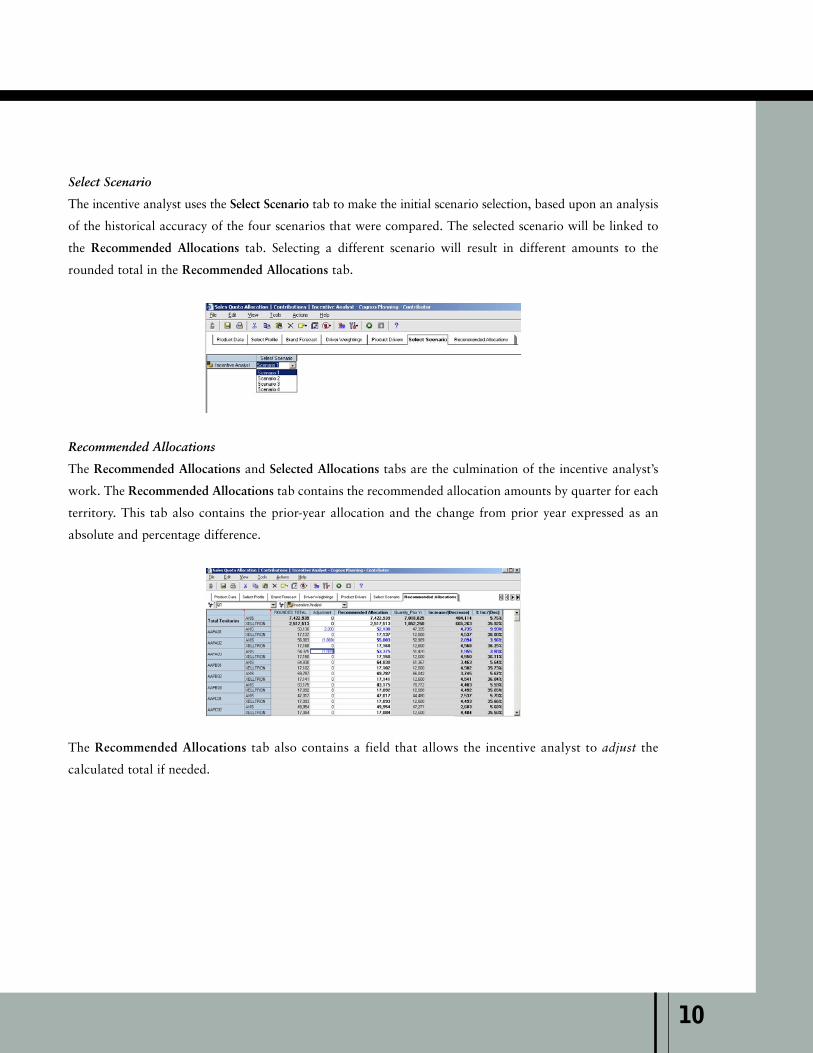
Select Scenario
The incentive analyst uses the Select Scenario tab to make the initial scenario selection, based upon an analysis
of the historical accuracy of the four scenarios that were compared. The selected scenario will be linked to
the Recommended Allocations tab. Selecting a different scenario will result in different amounts to the
rounded total in the Recommended Allocations tab.
Recommended Allocations
The Recommended Allocations and Selected Allocations tabs are the culmination of the incentive analyst’s
work. The Recommended Allocations tab contains the recommended allocation amounts by quarter for each
territory. This tab also contains the prior-year allocation and the change from prior year expressed as an
absolute and percentage difference.
The Recommended Allocations tab also contains a field that allows the incentive analyst to adjust the
calculated total if needed.
10
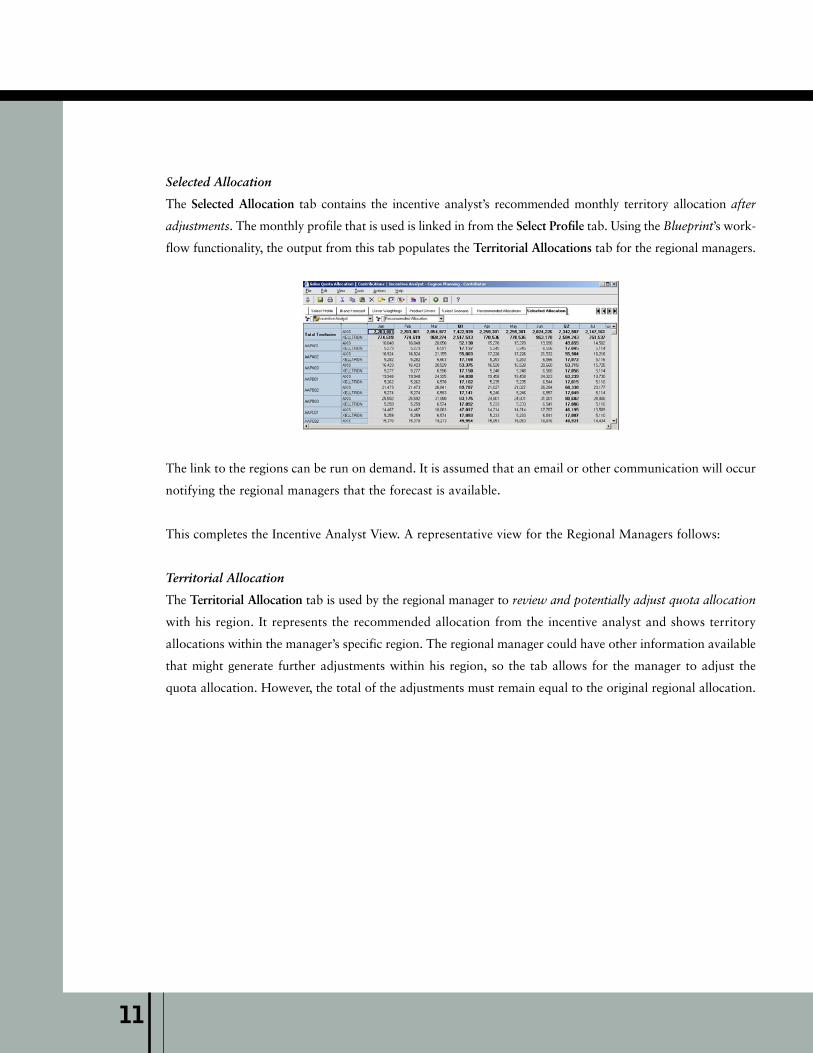
Selected Allocation
The Selected Allocation tab contains the incentive analyst’s recommended monthly territory allocation after
adjustments. The monthly profile that is used is linked in from the Select Profile tab. Using the Blueprint’s work-
flow functionality, the output from this tab populates the Territorial Allocations tab for the regional managers.
The link to the regions can be run on demand. It is assumed that an email or other communication will occur
notifying the regional managers that the forecast is available.
This completes the Incentive Analyst View. A representative view for the Regional Managers follows:
Territorial Allocation
The Territorial Allocation tab is used by the regional manager to review and potentially adjust quota allocation
with his region. It represents the recommended allocation from the incentive analyst and shows territory
allocations within the manager’s specific region. The regional manager could have other information available
that might generate further adjustments within his region, so the tab allows for the manager to adjust the
quota allocation. However, the total of the adjustments must remain equal to the original regional allocation.
11
CONCLUSION
The IBM Cognos Sales Quota Allocation Performance Blueprint allows incentive analysts and regional man-
agers to set future sales quota based on the most historically accurate weightings of business drivers. This
Blueprint is yet another example of how Cognos, an IBM company, delivers market-leading expertise in the
pharmaceutical industry, in addition to other pharmaceutical Blueprints including:
• IBM Cognos Clinical Trials Performance Blueprint
• IBM Cognos Clinical Trial Enrollment Forecasting Performance Blueprint
• IBM Cognos Sample Optimization Performance Blueprint.
As a result of these Blueprints, other Cognos solutions, and industry expertise, 24 of the top 30 pharmaceutical
firms and a broad range of companies across life sciences and health care choose Cognos performance
management software.
12
ABOUT COGNOS, AN IBM COMPANY
Cognos, an IBM company, is the world leader in business intelligence and performance management solu-
tions. It provides world-class enterprise planning and BI software and services to help companies plan, under-
stand and manage financial and operational performance. Cognos was acquired by IBM in February 2008.
For more information, visit http://www.cognos.com.
Pharmaceutical organizations worldwide choose Cognos for our unsurpassed expertise in delivering the
information and insight they need to reduce costs, streamline processes, and increase profitability. Cognos
has delivered solutions to 25 of the top 30 pharmaceutical firms, along with many leading life sciences and
biotech companies.
FOR MORE INFORMATIONFor more information on Cognos solutions for pharmaceutical and life sciences companies, please visitwww.cognos.com/lifesciences or email [email protected].
REQUEST A CALLTo request a call or ask a question, go to www.cognos.com/contactme A Cognos representative willrespond to your enquiry within two business days.
ABOUT THE COGNOS INNOVATION CENTERFOR PERFORMANCE MANAGEMENT
The Cognos Innovation Center was established in North America and
Europe to advance the understanding of proven planning and perform-
ance management techniques, technologies, and practices. The
Innovation Center is dedicated to transforming routine performance
management practices into “next practices” that help cut costs, stream-
line processes, boost productivity, enable rapid response to opportunity,
and increase management visibility.
Staffed globally by experts in planning, technology, and performance
and strategy management, the Innovation Center partners with more
than 600 Cognos customers, academics, industry leaders, and others
seeking to accelerate adoption, reduce risk, and maximize the impact of
technology-enabled performance management practices.
(02/08)