Embed Size (px)
Citation preview
ICES WGCRAN REPORT 2016 SCICOM STEERING GROUP ON ECOSYSTEM PROCESSES AND DYNAMICS
ICES CM 2016/SSGEPD:07
REF. SCICOM
Interim Report of the Working Group on Crangon Fisheries and Life History (WGCRAN)
23-25 May 2016
Oostende, Belgium
International Council for the Exploration of the Sea Conseil International pour l’Exploration de la Mer
H. C. Andersens Boulevard 44–46 DK-1553 Copenhagen V Denmark Telephone (+45) 33 38 67 00 Telefax (+45) 33 93 42 15 www.ices.dk [email protected]
Recommended format for purposes of citation:
ICES. 2016. Interim Report of the Working Group on Crangon Fisheries and Life His-tory (WGCRAN), 23–25 May 2016, Oostende, Belgium. ICES CM 2016/SSGEPD:07. 33 pp.
For permission to reproduce material from this publication, please apply to the Gen-eral Secretary.
The document is a report of an Expert Group under the auspices of the International Council for the Exploration of the Sea and does not necessarily represent the views of the Council.
© 2016 International Council for the Exploration of the Sea
ICES WGCRAN REPORT 2016 | i
Contents
Executive summary ................................................................................................................ 2
1 Administrative details .................................................................................................. 3
2 Terms of Reference a) – z) ............................................................................................ 3
3 Summary of Work plan ................................................................................................ 4
4 List of Outcomes and Achievements of the WG in this delivery period ............ 4
5 Progress report on ToRs and workplan ..................................................................... 6
6 Revisions to the work plan and justification ......................................................... 16
7 Next meetings ............................................................................................................... 16
Annex 1: List of participants............................................................................................... 17
Annex 2: Recommendations ............................................................................................... 18
Annex 3: Figures…………………………………………………………………………….19
2 | ICES WGCRAN REPORT 2016
Executive summary
The Working Group on Crangon Fisheries and Life History (WGCRAN) 2016 meeting was held at ILVO in Oostende, Belgium, May 2016. The meeting was chaired by Josien Steenbergen (Netherlands). There were 10 participants representing 3 countries.
The members of WGCRAN see the priority of this expert group in understanding the interactions between: i) the brown shrimp population (structure and abundance) and human activities (mainly fishing effort); ii) the shrimps and the environment (tempera-ture, currents); and iii) the role of brown shrimps in the ecosystem (trophic interactions). Stock status indicators like biomass estimates, interannual and seasonal changes in land-ings per unit effort, total mortality and shares of large shrimp in the surveys were dis-cussed. During this years’ meeting an insight was provided into the state of the art of research on Crangon and Crangon fisheries in Belgium. On invitation of the chair, a guest speaker provided an update on the current MSC process of the Dutch, German and Dan-ish industry.
Available stock parameters indicated a slight decrease in fishing effort in comparison to the previous two years. However effort was still 12 million horse-power hours at sea in comparison to about 10 million before 2013. Landings went down to a level comparable to 2012, while effort is larger in 2015 compared to 2012. This indicates that CPUE went down compared to 2012. Total annual landings amounted to 31 375 t where the German fleet contributed 11 902 t, the Dutch 16 448 t, the Danish 2104 t, the Belgian 531 t, the UK 316 t and the French 75 t (area 4/ 7d), respectively. Total mortality of shrimps >50 mm was slightly higher in 2015 (5.8 a-1) compared to 2014 (5.3 a-1). The share of shrimps > 60 mm in autumn decreased from 16 (2014) to 13% (2015). Both factors are influenced by both natural variability and fishing pressure. Average annual biomass of shrimps > 50 mm based on a swept-area estimate, was 4176 t resulting in a total annual production of 83 000 t (using P = B∙Z and Z = 5.8 a-1).
ICES WGCRAN REPORT 2016 | 3
1 Administrative details
Working Group name
Working Group on Crangon Fisheries and Life History (WGCRAN)
Year of Appointment within the current cycle
2016
Reporting year within the current cycle (1, 2 or 3)
1
Chair(s)
Josien Steenbergen, the Netherlands
Meeting venue
Oostende, Belgium
Meeting dates
23–25 May 2016
2 Terms of Reference a) – z)
a ) Report and evaluate population status indicators like recent landings and ef-fort trends in the brown shrimp fisheries or length based mortality estimates from Dutch and German scientific surveys. Generate a standardized lpue time-series of higher accuracy for the Netherlands with horse power days calculated based on hours at sea. Investigate methods to gain a better understanding of the recruitment processes and density dependence. (Lead persons: all group members)
b ) Combine VMS, landings and effort data to gain a population distribution indi-cator and to monitor regional distribution and regional shifts in fishing effort. Evaluate the variability of the results by comparing different VMS data inter-polation methods. (Lead persons: Katharina Schulte, Torsten Schulze)
c ) Develop brown shrimp specific management decision support tools to evalu-ate strategies on how to sustainable and efficiently harvest the brown shrimp stock. (Lead persons: Marc Hufnagl, Tobias van Kooten, Karen van de Wolfshaar)
d ) Analyse and enumerate the effects of new gears (e.g. pulsetrawl, combined pulse-trawl and standard gears, large or new mesh types, pump system, let-terbox etc.) and their implications on the Crangon stock, the bycatch, the catch efficiency and the possible lpue based management strategies. (Lead persons: Bart Verschueren, Josien Steenbergen)
4 | ICES WGCRAN REPORT 2016
e ) Analyse and evaluate possible methods to assess and manage the brown shrimp fisheries in the ICES region. Gather, compile and evaluate information on the onboard and ashore sieving fractions and processes and new national bycatch/discards data from e.g. DCF. (Lead persons: Josien Steenbergen, Axel Temming)
f ) Analysing infection levels with bacilliform viruses and/or the occurrence of other diseases and determining the potential effects they might have on the population. (Lead persons: Benigna van Eynde)
g ) Determining the potential on using brown shrimp as a species for use in aqua-culture system. Improvement on how to rear and grow shrimps in the lab and to obtain “in-situ”, real field growth rates for comparison. (Benigna van Eynde, Marc Hufnagl, Axel Temming)
h ) Optimize and harmonize German and Dutch surveys to improve comparabil-ity, to analyse spatio-temporal trends of stock indicators (biomass, distribu-tion, mortality, etc.) and to ground-truth VMS derived lpue estimates. (Lead persons: Holger Haslob, Ingrid Tulp)
i ) Exchange of information on national legislation, laws (e.g. concerning Natura 2000) and developments (MSC process) concerning the brown shrimp fisheries in the whole North Sea for an improved cooperation and coordination of re-search and advice efforts. Presentations on developments and ongoing brown shrimp research in the ICES area. (Lead persons: all members)
3 Summary of Work plan
Work plan of three year cycle according to WGCRAN report 2015:
Year 1 (2016)
Stock status indicators (ToR a) shall be udated and harmonized between countries. Data for Manuscripts related to ToR b-d and f-g shall be available. New hauls to be included in the analysis under ToR h shall be available. New information from ToR I shall be reported.
4 List of Outcomes and Achievements of the WG in this delivery period
a) Stock status indicators I. Indicators updated (see section 5)
II. paper published: Ingrid Tulp, Chen Chun, Holger Haslob, Katharina Schulte, Volker Siegel, Josien Steenbergen, Axel Temming & Marc Hufnagl (2016). Annual brown shrimp Crangon crangon biomass produc-tion in NW Europe contrasted to annual landings. ICES journal doi:10.1093/icesjms/fsw141.
ICES WGCRAN REPORT 2016 | 5
b) VMS , landings and Effort data I. Manuscript submitted: Not Easy To Catch: New insights into factors affect-
ing catch rates of partly pelagic brown shrimps (Crangon crangon L.). Schulte, K.F., Temming, A., Hufnagl, M., Dänhardt A., Siegel, V., Neudecker, T., Wosniok, W.
II. Manuscript for submission: Interchangeability of different approaches for es-timating effort and catch from VMS- and commercial data. Schulte, K.F., Wosniok, W., Temming, A.
c) Brown shrimp specific management decision support tools I. Project report: “management options of brown shrimp (Crangon crangon)
fisheries in the North Sea” available on: http://edepot.wur.nl/366175 II. Update presentation: Effect of mesh size regulation and the effect on popula-
tion of shrimp, update from a model study within the German CRANNET project by Marc Hufnagl. Project report (in German) available on: http://literatur.thuenen.de/digbib_extern/dn056016.pdf
d) Effects of new gears I. Update presentation & demo: on state of play pulse gear innovation by Bart
Verschueren. II. Project report (in Dutch): on the development and use of shrimp pulse gear
combined with traditional pulse gear (COMBI puls 2) on board of the TH10; a comparative study. http://www.th10.nl/documents/verschuerenth10.pdf
III. PhD thesis: Electrofishing: exploring the safety range of electric pulses for marine species and its potential for further innovation. / Soetaert, Maarten. Gent, 2015. 287p.
IV. Paper published: Desender, M., Chiers, K., Polet, H., Verschueren, B., Saun-ders, J., Ampe, B., Mortensen, A., Puvanendran, V. and Decostere, A. 2016. Short-term effect of pulsed direct current on various species of adult fish and its implication in pulse trawling for brown shrimp in the North Sea. Fisheries Research. 179: 90-97.
V. Manuscript submitted: Desender et al. (In press). Pulse trawling: evaluating its impact on prey detection by small-spotted catshark (Scyliorhinus canicu-la). Journal of Experimental Biology and Ecology.
VI. Manuscript for submission: Desender et al. (In prep). Impact of pulsed direct current on embryonated eggs, larvae and young juveniles of Atlantic cod (Gadus morhua L.) and its implication in electrotrawling for Brown shrimp.
VII. Manuscript for submission: Desender et al. (In prep). Electrotrawling: The impact of pulsed direct current on early life stages of Sole (Solea solea). North American Journal of Fisheries Management.
VIII. Update presentation: new developments in the Netherlands regarding pro-cessing the (by)catch on board by Bart Verschueren.
6 | ICES WGCRAN REPORT 2016
IX. Project reports (in Dutch) on new developments on processing (by)catch: Theunynck, R. & Verschueren, B. (2015). Slimmer verwerken, bijvangst beperken. ILVO rapport. & Verschueren, B., Lenoir, H. & Theunynck, R. (2016). Ontwikkelen en stimuleren van duurzame methoden en technieken. ILVO mededeling nr. 207. D/2016/10.970/20.
e) Possible methods to assess and manage the brown shrimp fisheries I. Presentation & demo: Smart shrimp length measurement software and Bel-
gian long-term survey data by Lies Vansteenbrugge & Bart Vanelslander. f) Infection levels with bacilliform viruses and/or the occurrence of other diseases
I. Update presentation: Cultivation of Grey shrimp (Crangon crangon) and the study of Crangon crangon bacilliform virus by Benigna Van Eynde
II. Manuscript for submission: Prevalence study of the Crangon crangon bacilli-form virus in the European brown shrimp Crangon crangon from the Belgian Coast. Van Eynde, B., Christiaens, O., Delbare, D., Cooreman, K., Bateman, K., Stentiford, G., Dullemans, A., van Oers, M., Smagghe, G.
g) Potential on using brown shrimp as a species for use in aquaculture system I. Update presentation: Cultivation of Grey shrimp (Crangon crangon) and the
study of Crangon crangon bacilliform virus by Benigna Van Eynde II. Update presentation: of bachelor thesis under supervision of Marc Hufnagl:
“Different Proxies to identify brown shrimp conditions”. h) Optimize and harmonize German and Dutch surveys
I. No new update: in 2015 there were no overlapping hauls between the sur-veys. Holger Haslob is however still planning to analyse the overlapping hauls in former surveys. To be discussed next year.
i) Exchange of information I. Update presentation: of the MSC process by invited guest Phillip Oberdorfer.
5 Progress report on ToRs and workplan
a) Stock status indicators
Updated stock status indicator figures are available in Annex 3.
Landing statistics
In each county the landings of North Sea shrimp in 2015 have dropped (Figures 1–6). The Dutch and German Fisheries are together responsible for 89% of all landings, with re-spectively 52% (Netherlands) and 37% (Germany). The share of the German landings have increased in 2015 from 33–37% (Figure 1). Total North Sea shrimp landings were 31 375 tonnes in 2015, lowest since 2003 when landings were below 30 000 tonnes. After 2003 landings have been constantly higher than 30 000 tonnes, with a peak in 2005 with 38 613 tonnes (Figure 7). A strong seasonal pattern in the landings, with a peak in au-
ICES WGCRAN REPORT 2016 | 7
tumn (as described the WGCRAN report 2015), was observed in 2015 for the German, Dutch, UK and Belgian fisheries (Figure 8).
Effort has now been largely standardized for all fleets. Besides for the Dutch fleet all fig-ures, effort and lpue values are based on hours at sea divided by 24 (for details see WGCRAN report 2015). Efforts in days at sea (Figure 10; only available for German, Dutch and UK fisheries) and horse power days at sea (hp-das, Figure 11) for German and Dutch fisheries were in 2015 comparable to 2014 in the first 4 months, but lower from May onwards. For both countries effort in October was higher than the year before. In general the effort was higher than the long term mean for Germany and the Netherlands. In Denmark the effort was higher than the other years in the winter period (December, January, and February) and lower in other months. In France and Belgium the effort was lower than the long term mean.
Landing per Unit of Effort (LPUE) in t/days at sea (Figure 12 for Germany, Netherlands and UK only) and in kg /hp days at sea (Figure 13) was in the first half of 2015 generally higher for German, Dutch and Danish fisheries than in the year before. However the LPUE’s in the second half of 2015 where generally lower than the LPUE’s in that same period in 2014. The overall lpue was 2.55 kg/hp hour, which is lower than the long term average (the long term average from 2002–2015 was 3.20 kg/hp hour).
Fraction of large shrimps
The fraction of shrimps > 60 caught in the DYF and DFS surveys conducted during au-tumn decreased over time. Although between 2003 and 2008 the share of >60 mm shrimps increased from 15 to 20% it decreased thereafter to less than 15% in 2015 (Figure 19).
The fraction of shrimps > 70 mm caught in the DYF and DF surveys conducted during autumn decreased since the beginning of the survey to now less than 2% (Figure 19).
Mortality
The mean annual mortality increased in 2015 from 5.3 to 5.8 (Figure 20; methods see Hufnagl et al. 2010).
Biomass production
The following paper has been published:
Ingrid Tulp, Chun Chen, Holger Haslob, Katharina Schulte, Volker Siegel, Josien Steenbergen, Axel Temming, and Marc Hufnagl, 2016. Annual brown shrimp (Crangon crangon) biomass produc-tion in Northwestern Europe contrasted to annual landings. ICES J. Mar. Sci. 2016: fsw141v1-fsw141.
The autumn swept-area biomass estimate based on the Demersal Fish and the Demersal Young Fish Survey (methods see WGCRAN report 2012) has been updated. Average annual biomass of shrimps > 50 mm and based on a swept-area estimate, was 4176 t re-sulting in a total annual production of 83 000 t.
8 | ICES WGCRAN REPORT 2016
Cooperation with other EGs
Cooperation with WGBEAM on improving survey designs to match with the require-ments of the brown shrimp swept area biomass estimate and to derive correction factors for the use of different gears.
Cooperation with Advisory structures
Crangon Advice, WKCCM, ADCRAN
Science Highlights
Although total effort was again higher than the long term average, the overall lpue was lower than the long term average which indicates a high fishing pressure. Low LPUE’s in autumn in most of the areas indicate weak year class of the 2015 cohort. At the same time effort did increase to a long term maximum in October in Germany as well as in the Netherlands, increasing the risk of growth overfishing.
b) VMS , landings and Effort data
New manuscripts are submitted and are currently under review (see section 4).
Changes/ Edits/ Additions to ToR
The ToR was not further discussed in 2015 due to absence of key members for VMS-work. VMS will be on the agenda again next year.
Cooperation with other EGs
No cooperation
Cooperation with Advisory structures
No cooperation.
Science Highlights
VMS data in combination with landings can be standardized and then used for analysing population dynamics and populations shifts.
The variability of the results can be evaluated by comparing different VMS data interpo-lation methods.
c) Brown shrimp specific management decision support tools
A mechanistic model of the dynamics of Brown shrimp and its fishery was built in 2015 at IMARES; Summary Steenbergen et al., (2015):
“The model describes the shrimp population and fleet dynamics in the eastern coastal zone of the North Sea from the south of the Netherlands up to the Danish west coast. The model was run for all fleet sizes between 200 and 800 vessels, and landings, discards, effort and landings per unit effort were evaluated.
ICES WGCRAN REPORT 2016 | 9
As the second part of the project, a model of the dynamics of brown shrimp and its fish-ery was constructed and analysed. The aim was to provide a scientifically sound ecologi-cal knowledge base for the exploration of management options for the North Sea brown shrimp fishery. A mechanistic approach was used for the model; the model for brown shrimp is a dynamic energy budget (DEB) model. The population dynamics are modelled using the physiologically structured population dynamics framework, and the fleet dy-namics model uses an agent-based modelling approach. The mechanistic approach re-sulted in a model that is based on the processes which lead to observed patterns, rather than on the patterns themselves. The parameterization of the model has been derived independently, without any complex fitting or calibration to the system we aim to de-scribe.
The model describes the shrimp population and fleet dynamics in the eastern coastal zone of the North Sea from the south of the Netherlands up to the Danish west coast. The zone is divided into nine areas, based on the spatial distribution of the shrimp fleet, esti-mated on the basis of VMS data. In the model, individual vessels follow a harvesting strategy based on catch results and movement costs. A combination of data analysis (VMS, Vessel Monitoring System) and consultation of representatives of the Dutch brown shrimp fishery was conducted to get a better understanding of the behaviour of fisher-men.
Based on this consultation, the fleet has been divided into ‘local’ vessels, consisting of fishermen which are predominantly active in a single area and more mobile vessels that may fish in all the areas. Each vessel is assumed to start fishing on Monday, but has an opportunity to stop fishing for the remainder of the week if the catches fall below a threshold Landings per Unit of Effort (LPUE) value. Furthermore, of the entire local and mobile fleet, half of the vessels do not fish for shrimp between December and February.
The strongly mechanistic basis of the model and the independently established parame-terization, coupled with good correspondence of the dynamics exhibited by the model to that observed, make that the model can be reliably used to estimate the effects of various management scenarios.”
Effect of mesh size regulation and the effect on population of shrimp, update from a model study within the German CRANNET project by Marc Hufnagl. Selectivity charac-teristics of cod-ends with mesh openings from 18 to 34 mm were included into a complex yield-per-recruit life-cycle model for brown shrimp (Temming & Hufnagl 2014) and the results indicate that any increase in mesh opening from the currently used mean of the fleet (20 mm) will lead to a larger yield, population biomass and egg production after a short-term decrease (e.g. 3 month for 26 mm).
Changes/ Edits/ Additions to ToR
None.
Cooperation with other EGs
No cooperation.
Cooperation with Advisory structures
Crangon Advice, WKCCM, ADCRAN
10 | ICES WGCRAN REPORT 2016
Science Highlights
Brown shrimp specific management decision support tools can be used to evaluate strat-egies on how to sustainable and efficiently harvest the brown shrimp stock.
d) Effects of new gears
Comparative fishing with a conventional beam trawl and a pulse trawl:
A series of comparative experiments was conducted on the Dutch eurocutter TH 10. Dur-ing 3 commercial trips on the Southern Dutch North Sea coast, a normal shrimp beam trawl, fitted with conventional ground gear with 37 bobbins, was directly compared with a lightweight pulse trawl. The pulse trawl was a combination of a classic beam with trawl shoes and a new ‘square’ net design. In order to stimulate the shrimp to leave the sedi-ment, an electrical pulse field (12 electrodes) was combined with a reduced, straight bob-bin rope (12 bobbins alternated with 10 rubber discs). The catch comparisons showed that during the three sampled voyages in September and October each time more consump-tion shrimp were caught in the pulse gear. Over the 3 voyages together a catch increase of 30.8% in the average marketable shrimp volume was observed. For a good interpreta-tion of this difference: A hypothetical difference of 100% would mean that the pulse gear doubles the catches of the traditional gear.
Also the amount of by-catch of undersized shrimp was much higher with the pulse gear relative to the traditional gear. For each litre of consumption shrimp on average 0.85 litre of small, undersized shrimp was caught with the pulse gear, compared to 0.68 litre with traditional gear. Earlier research has shown that the survival of discarded shrimp is high and ranges from 75 to 85%.
The difference in the quantity of fish and invertebrates by-catch (excluding shrimp) be-tween the pulse and traditional gear was in general less distinct. Per litre of marketable shrimp on average 1.73 litre of by-catch (fish and invertebrates) was caught with the pulse gear and 2.03 litre with the traditional gear. Some commercial fish species that are omnipresent in shrimp catches, might shortly fall under the EU discard ban. In this re-gard, the significant reduction in the by-catch of plaice (-25.9%), dab (-30.6%) and floun-der (-71.4%) with the tested pulse gear on TH 10 is encouraging. These differences were especially observed in the smallest length classes. This illustrates once again that the pulse technique is ideal in compensating the limitations of the sieve net.
The results in this study are very strongly linked with the gear design of the pulse trawl present on the TH 10. The results of these field trials cannot simply be generalized to other pulse gears available on other vessels. This highlights the importance of gear de-sign in achieving the objectives: by-catch reduction and minimal seafloor contact.
New developments in catch handling and processing:
A new catch processing system was tested and evaluated on the shrimp cutter GRE 5. The idea was to shorten the sorting process on board, by constantly pumping the catch from the codend on deck. This is in contrast with the conventional catch sorting and pro-cessing, which is based on peak processing of bulk catches, brought on deck every 1.5 hours. As a consequence unwanted by-catch is only shortly exposed to the trawl and the processing equipment. The premise is that the short turnaround time contributes to a
ICES WGCRAN REPORT 2016 | 11
better discard survival. Based on this preliminary study it cannot be confirmed whether this is the case.
The field tests showed that the fish pump might work for the shrimp fishery in the Wad-den Sea. However, reliability during testing was not always guaranteed as technical fail-ures, occasional damage or blockage of the suction hose, hampered the tests. It is very likely that these children's diseases can be solved in the future. Currently it is unclear how efficient and reliable the pump will be in deeper water and during bad weather conditions.
Apart from the pump, also a completely new catch sorting mechanism was tested. Herein a camera detection system replaces the conventional rotating sieve. The results were ra-ther poor. First of all, the system had difficulty in making a clear distinction between shrimp and other animals. On top of that, correct sorting of shrimp in different size clas-ses turned out very difficult. Currently it is hard to predict whether system modifications and further developments will lead to better results in future testing.
Changes/ Edits/ Additions to ToR
None.
Cooperation with other EGs
No cooperation.
Cooperation with Advisory structures
No cooperation
Science Highlights
Analyze and enumerate the effects of new gears (e.g. pulsetrawl, combined pulsetrawl and standard gears, large or new mesh types, pump system, letterbox etc.) and their im-plications on the Crangon stock, the bycatch, the catch efficiency and the possible lpue based management strategies.
e) Possible methods to assess and manage the brown shrimp fisheries
In the Netherlands and Germany information on discards is collected within the yearly DCF programme. Results will be published in a report that is due to be finished by the end of 2016. No new information on the onboard sieving fractions and processes was available as of now.
Currently a cooperation project involving the University of Hamburg, MSC GbR, the Coöperatieve Visserij Organisatie and the Danske Fiskeres PO has been started to scien-tificly guide the MSC process and to identify methods for an easy and effective self-monitoring of the fleet. The main aim is to monitor the effectiveness of the mesh size increase and to identify potential changes in stock indicators.
Changes/ Edits/ Additions to ToR
None.
12 | ICES WGCRAN REPORT 2016
Cooperation with other EGs
No cooperation.
Cooperation with Advisory structures
No cooperation.
Science Highlights
Possible methods to assess and manage the brown shrimp fisheries in the ICES region are analysed and assessed. Information on the onboard and ashore sieving fractions and processes and new national bycatch/discards data from e.g. DCF is gathered and com-piled.
f) Infection levels with bacilliform viruses and/or the occurrence of other diseases
Benigna Van Eynde presented the progress of her PhD. One part of het PhD project fo-cusses on the presence of a Crangon crangon bacilliform virus. This virus was discovered by Stentiford et al. in 2004 and from preliminary data it seemed that this virus occurs with a prevalence of nearly 70–90 % along the Britisch Coast.
Therefore a detection method based on PCR was designed to screen for this virus in wild Crangon crangon caught along the Belgian Coast and other places in Europe, like the Baltic Sea, the Mediterranean Sea, the Black Sea, etc. During the Belgian DYFS survey in 2015 wild shrimp were caught along the Belgian Coast and with the new detection method a prevalence between 80 and 95 % was found. Interesting to notice is that although this virus is very prevalent, it does not seem to affect the wild stocks. Therefore more research is needed to evaluate the effect of the virus on wild and reared Crangon crangon.
In this part of the project also the pathogenesis of the virus and the transmission will be studied. As well as the potential to use RNA interference as a vaccine against the virus. This is still under investigation.
Changes/ Edits/ Additions to ToR
None.
Cooperation with other WG
No cooperation.
Cooperation with Advisory structures
No cooperation.
Science Highlights
Analyzing infection levels with bacilliform viruses and/or the occurrence of other diseas-es and determining the potential effects they might have on the population.
ICES WGCRAN REPORT 2016 | 13
g) Potential on using brown shrimp as a species for use in aquaculture system
The cultivation of Crangon crangon could form a promising alternative for the Belgian shrimp fishery, but from first experiments it seems that the cultivation of this species is still very difficult and optimization is needed. One of the biggest problems here is canni-balism and the lack of an artificial diet.
Therefore this project focusses on both the development of an artificial diet and the opti-mization of the rearing conditions (temperature, density, salinity, etc.). Both parts will contribute to the closing of the lifecycle of the grey shrimp in captivity.
For the design of the diet, the focus is on the attractiveness, the texture and the nutrition-al composition. The shrimp can be attracted with several amino acids to the feed, but if the texture is not right, they do not eat it. This is still a big problem with the artificial feed and long term experiments failed because of low food intake. Therefore new feed will be developed with other textures and nutritional compositions in order to ensure good pal-atability.
In this part also the rearing of eggs and larvae will be studied. Here different feeds, hous-ing systems and environmental conditions will be tested. This part is still under investi-gation.
Bachelor thesis under supervision of Marc Hufnagl: “Different Proxies to identify brown shrimp conditions”.
Changes/ Edits/ Additions to ToR
No changes.
Cooperation with other EGs
No cooperation.
Cooperation with Advisory structures
No cooperation.
Science Highlights
Determining the potential on using brown shrimp as a species for use in aquaculture system. Improvement on how to rear and grow shrimps in the lab and to obtain “insitu”, real field growth rates for comparison.
h) Optimize and harmonize German and Dutch surveys
We were informed by the chair of WGBEAM that the Netherlands and Germany couldn't carry out any overlapping hauls in 2015. This was mainly because of time constraints for the German survey in 2015. However we aim to analyse the overlapping hauls of the past. There are some data on overlapping hauls from a study 2006 (U. Damm). These data are available at the TI and were already analysed by Katharina Schulte. In addition we have some more parallel hauls from RV Isis and RV Clupea from 2014. These addi-tional hauls can be involved in the analyses.
14 | ICES WGCRAN REPORT 2016
It could be possible to do more parallel hauls with RV Isis and Clupea in the future but it is difficult because it can only be done when there is enough time to meet besides the regular survey grid of both surveys.
Changes/ Edits/ Additions to ToR
None.
Cooperation with other EGs
WGBEAM
Cooperation with Advisory structures
No cooperation
Science Highlights
Optimize and harmonize German and Dutch surveys to improve comparability, to ana-lyze spatio-temporal trends of stock indicators (biomass, distribution, mortality, etc.) and to ground-truth VMS derived lpue estimates.
i) Exchange of information
Update MSC
Invited guest Phillip Oberdorfer provided an update about the MSC process. Dutch, German and Danish fisheries entered a full assessment in January 2016. As part of the MSC process a management plan is developed and in place since 1 January 2016.
The management plan can be found with the following link: http://www.nsrac.org/wp-content/uploads/2015/11/Paper-5.1a-Brown-Shrimp-Mgmt-Plan1.pdf.
Some of the key elements in the Management plan were (partly) initiated and advised by WGCRAN. These elements will also be of interest for the WGCRAN in the future. WGCRAN foresees an important role for itself in providing the scientific advice to enable and evaluate of whether the management plan is delivering on its objectives, including (but not necessarily limited to):
• Reaching the target of high long-term sustainable yields, • Avoiding recruitment overfishing, • Minimizing unwanted by-catch.
Elements of the management plan directly feeding into the objectives above are:
C3. Sorting of the catch: rules on sorting of the catch are intended to minimize the amount and maximize the survival of unwanted bycatch in the fishery (undersized shrimps as well as other marine organisms), they include: use of a sievenet (max 70 mm) or grid (max 20 mm between the bars), barspacing of the sorting machine on board is adjusted to the size of marketable shrimp and have a constant waterflow, rules for siev-ing on land and maximum sievage amounts. Relevant Tor: ToR d.
ICES WGCRAN REPORT 2016 | 15
C4. High long-term sustainable yield: involving a stepwise increase in mesh size start-ing from May 2016 with 22 mm in steps of 2 mm to a maximum of 26 mm in 2020. Model results have indicated that indicate that one way to achieve high long-term sustainable yields would be to increase the standard mesh-size to 26 mm. In between steps the model will be validated with field data, and based on the outcome advice will be provided re-garding the implementation of the rule. Relevant ToR: ToR c and e.
C5. Avoiding recruitment overfishing: Harvest Control Rule based on LPUE and effort reductions as was advised by this Working Group to be the best management practice at this moment. Relevant ToR: ToR c.
ILVO science update
ILVO developed an electronic method as an alternative for the time consuming manual measuring of shrimp lengths: “SmartShrimp”. Length measurements of shrimp are a time-consuming manual task and therefore error prone. Moreover, personal habits of the measurer could bias the data. Additionally, at ILVO (Belgium) the original data flow consisted of 1) writing the measurements on paper, 2) enter the data into excel and 3) incorporate the excel into an Access database. To ensure a higher efficiency and data quality, there was a need for a more automised system to avoid errors.
ILVO developed (in-house) the SmartShrimp application. This application is run on a computer, which is connected to a camera. The camera is mounted above a glass plate and headlight where the shrimps are positioned on in an organised manner. Using a specific algoritm, the contour of the shrimp is recognised and the shortest line from an-tenna basis to telson is identified and used to generate measurement data. For each pic-ture taken, measurements from all shrimp on the glass plate are directly registered into the database, which benefits the efficiency. Additionally, the quality of the measurements improves as the accuracy is better. This SmartShrimp application has also been used to measure Macoma baltica shells.
ILVO presented the long term dataset of their DYFS survey which is ongoing since 1973 and covers 32 fixed sampling stations along the Belgian coast. In addition, stomach data were collected in the years 1970 and 1998-2001.
Changes/ Edits/ Additions to ToR
Stomach data of the Belgian DYFS survey will be made available, and provide new in-sights in Crangon (natural) mortality under ToR a.
Belgian data of DYFS will be added to the Swept area estimate under ToR a.
Cooperation with other EGs
N/A
Cooperation with Advisory structures
N/A
16 | ICES WGCRAN REPORT 2016
Science Highlights
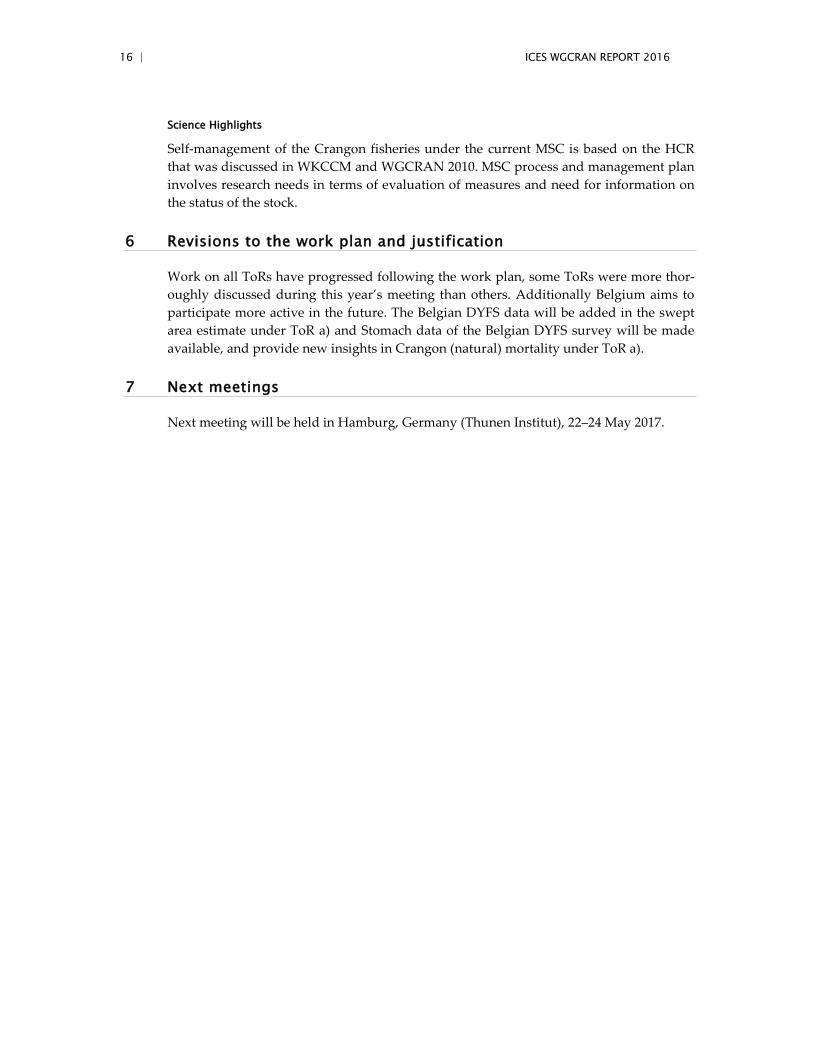
Self-management of the Crangon fisheries under the current MSC is based on the HCR that was discussed in WKCCM and WGCRAN 2010. MSC process and management plan involves research needs in terms of evaluation of measures and need for information on the status of the stock.
6 Revisions to the work plan and justification
Work on all ToRs have progressed following the work plan, some ToRs were more thor-oughly discussed during this year’s meeting than others. Additionally Belgium aims to participate more active in the future. The Belgian DYFS data will be added in the swept area estimate under ToR a) and Stomach data of the Belgian DYFS survey will be made available, and provide new insights in Crangon (natural) mortality under ToR a).
7 Next meetings
Next meeting will be held in Hamburg, Germany (Thunen Institut), 22–24 May 2017.
ICES WGCRAN REPORT 2016 | 17
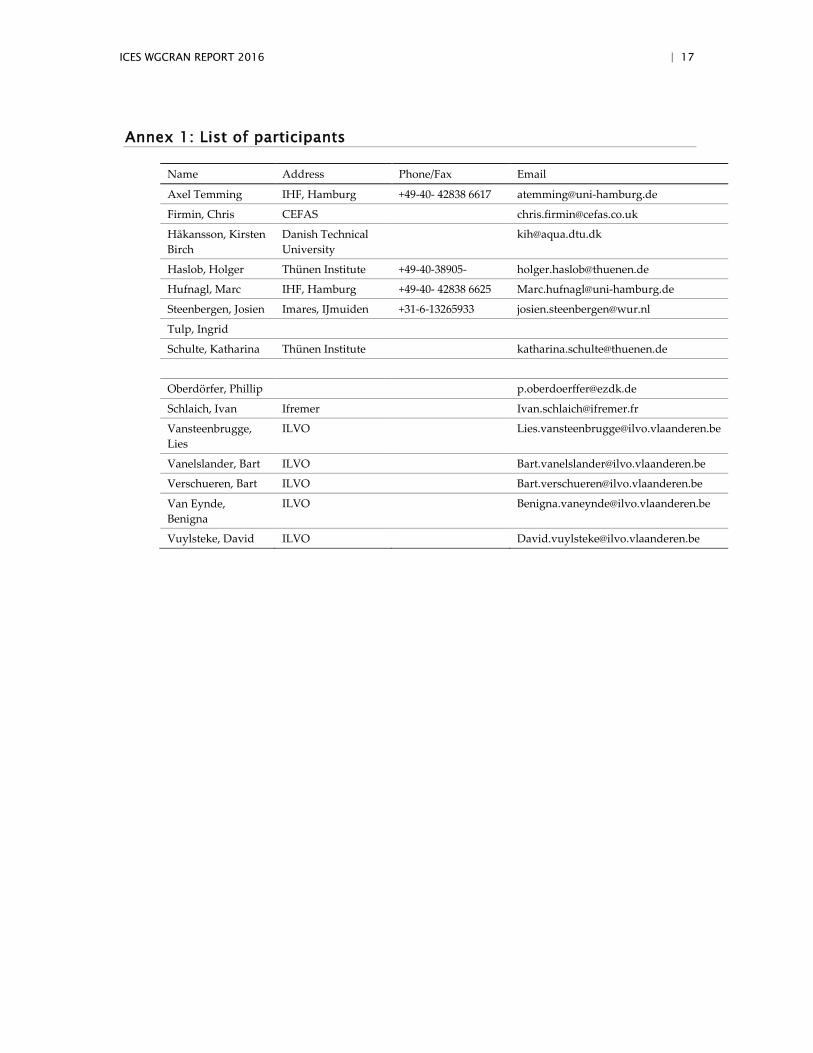
Annex 1: List of participants
Name Address Phone/Fax Email
Axel Temming IHF, Hamburg +49-40- 42838 6617 [email protected]
Firmin, Chris CEFAS [email protected]
Håkansson, Kirsten Birch
Danish Technical University
Haslob, Holger Thünen Institute +49-40-38905- [email protected]
Hufnagl, Marc IHF, Hamburg +49-40- 42838 6625 [email protected]
Steenbergen, Josien Imares, IJmuiden +31-6-13265933 [email protected]
Tulp, Ingrid
Schulte, Katharina Thünen Institute [email protected]
Oberdörfer, Phillip [email protected]
Schlaich, Ivan Ifremer [email protected]
Vansteenbrugge, Lies
ILVO [email protected]
Vanelslander, Bart ILVO [email protected]
Verschueren, Bart ILVO [email protected]
Van Eynde, Benigna
ILVO [email protected]
Vuylsteke, David ILVO [email protected]
18 | ICES WGCRAN REPORT 2016
Annex 2: Recommendations
None.
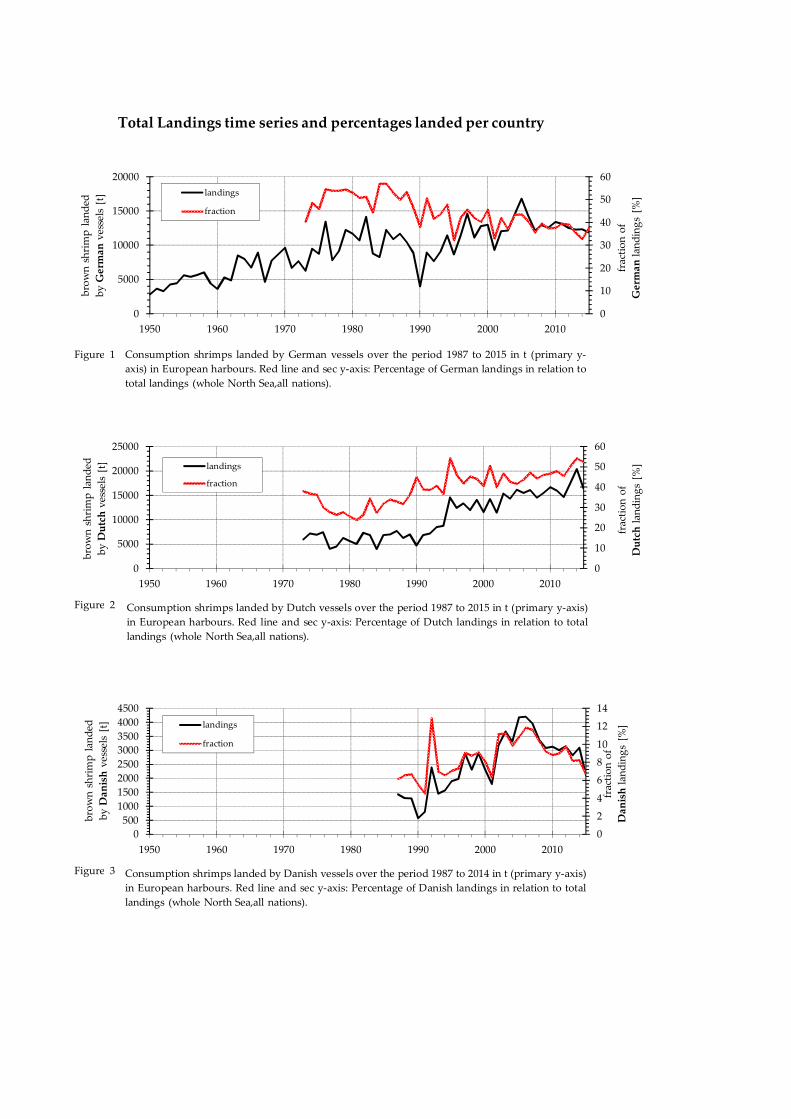
Figure 1
Figure 2
Figure 3
0
2
4
6
8
10
12
14
0
500
1000
1500
2000
2500
3000
3500
4000
4500
1950 1960 1970 1980 1990 2000 2010
fraction of
Danishlandings [%
]
brown shrimp landed
by Danishvessels [t] landings
fraction
0
10
20
30
40
50
60
0
5000
10000
15000
20000
25000
1950 1960 1970 1980 1990 2000 2010
fraction of
Dutchlandings [%
]
brown shrimp landed
by Dutchvessels [t] landings
fraction
0
10
20
30
40
50
60
0
5000
10000
15000
20000
1950 1960 1970 1980 1990 2000 2010
fraction of
Germanlandings [%
]
brown shrimp landed
by Germanvessels [t]
landings
fraction
Consumption shrimps landed by German vessels over the period 1987 to 2015 in t (primary y‐
axis) in European harbours. Red line and sec y‐axis: Percentage of German landings in relation to
total landings (whole North Sea,all nations).
Consumption shrimps landed by Dutch vessels over the period 1987 to 2015 in t (primary y‐axis)
in European harbours. Red line and sec y‐axis: Percentage of Dutch landings in relation to total
landings (whole North Sea,all nations).
Consumption shrimps landed by Danish vessels over the period 1987 to 2014 in t (primary y‐axis)
in European harbours. Red line and sec y‐axis: Percentage of Danish landings in relation to total
landings (whole North Sea,all nations).
Total Landings time series and percentages landed per country
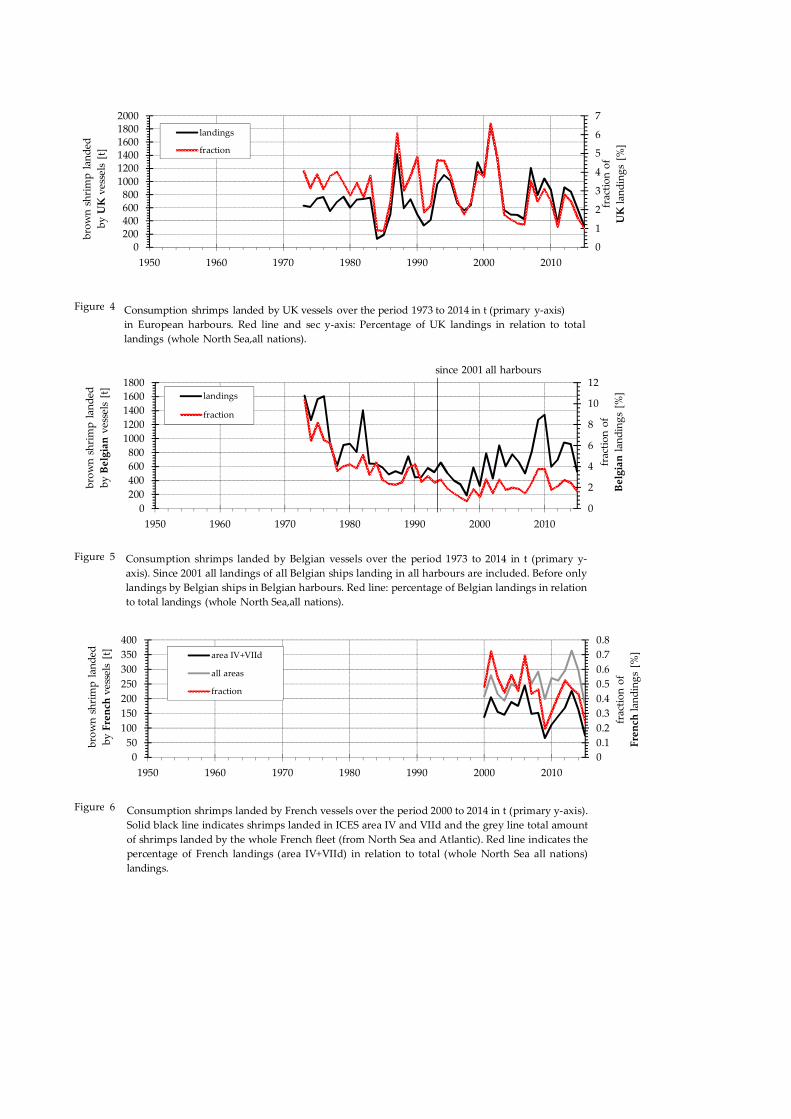
Figure 4
Figure 5
Figure 6
0
0.1
0.2
0.3
0.4
0.5
0.6
0.7
0.8
0
50
100
150
200
250
300
350
400
1950 1960 1970 1980 1990 2000 2010
fraction of
French
landings [%
]
brown shrimp landed
by French
vessels [t] area IV+VIId
all areas
fraction
0
2
4
6
8
10
12
0
200
400
600
800
1000
1200
1400
1600
1800
1950 1960 1970 1980 1990 2000 2010
fraction of
Belgianlandings [%
]
brown shrimp landed
by Belgianvessels [t] landings
fraction
since 2001 all harbours
0
1
2
3
4
5
6
7
02004006008001000
12001400160018002000
1950 1960 1970 1980 1990 2000 2010
fraction of
UKlandings [%
]
brown shrimp landed
by UKvessels [t]
landings
fraction
Consumption shrimps landed by UK vessels over the period 1973 to 2014 in t (primary y‐axis)
in European harbours. Red line and sec y‐axis: Percentage of UK landings in relation to total
landings (whole North Sea,all nations).
Consumption shrimps landed by French vessels over the period 2000 to 2014 in t (primary y‐axis).
Solid black line indicates shrimps landed in ICES area IV and VIId and the grey line total amount
of shrimps landed by the whole French fleet (from North Sea and Atlantic). Red line indicates the
percentage of French landings (area IV+VIId) in relation to total (whole North Sea all nations)
landings.
Consumption shrimps landed by Belgian vessels over the period 1973 to 2014 in t (primary y‐
axis). Since 2001 all landings of all Belgian ships landing in all harbours are included. Before only
landings by Belgian ships in Belgian harbours. Red line: percentage of Belgian landings in relation
to total landings (whole North Sea,all nations).
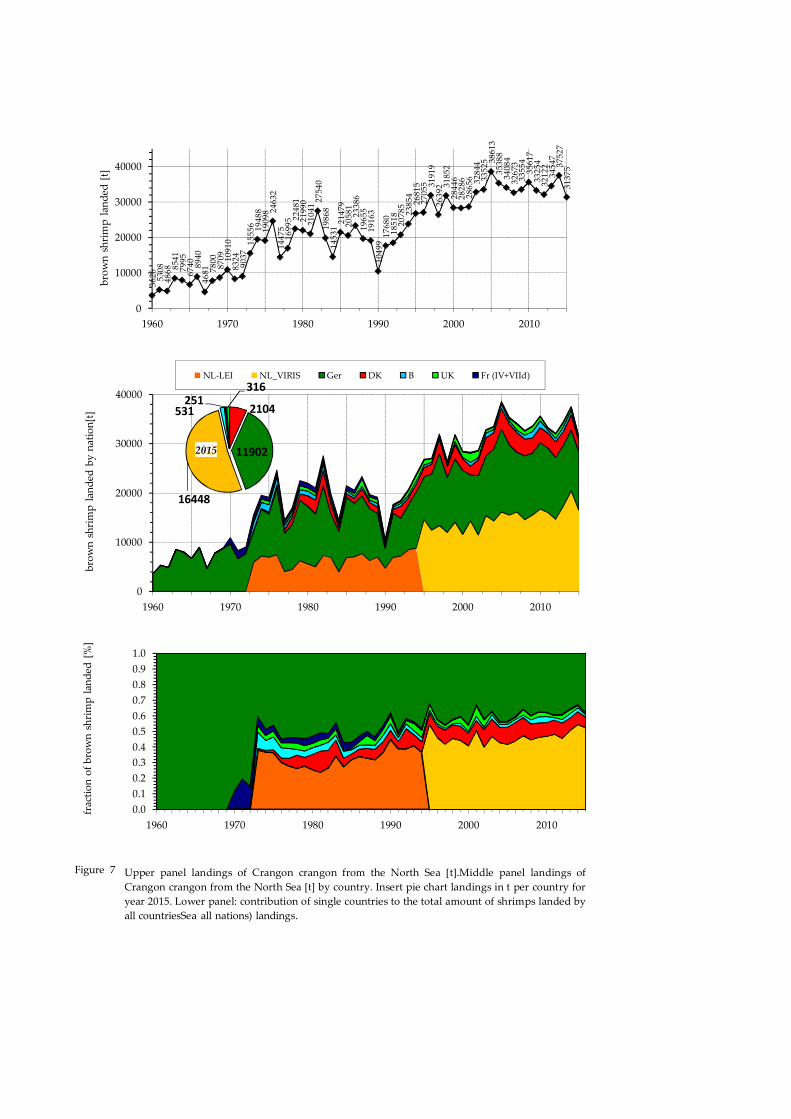
Figure 7
0
10000
20000
30000
40000
1960 1970 1980 1990 2000 2010
brown shrimp landed by nation[t]
NL‐LEI NL_VIRIS Ger DK B UK Fr (IV+VIId)
3626
5308
4868 8541
7995
6740
8940
4681 7800
8709
10910
8324
9037
15556 19488
19098 24632
14475
16995 22481
21990
2104127540
19868
1453121479
20581
23386
19655
19163
1049917680
18518
20785
23854
26815
27055 31919
26392 31852
28446
28286
28656 32844
33525 38613
35388
34084
32673
33554
35617
33254
32122
34547
37527
31375
0
10000
20000
30000
40000
1960 1970 1980 1990 2000 2010
brown shrimp landed [t]
2104
11902
16448
531251
316
2015
0.0
0.1
0.2
0.3
0.4
0.5
0.6
0.7
0.8
0.9
1.0
1960 1970 1980 1990 2000 2010
fraction of brown shrimp landed [%]
Upper panel landings of Crangon crangon from the North Sea [t].Middle panel landings of
Crangon crangon from the North Sea [t] by country. Insert pie chart landings in t per country for
year 2015. Lower panel: contribution of single countries to the total amount of shrimps landed by
all countriesSea all nations) landings.
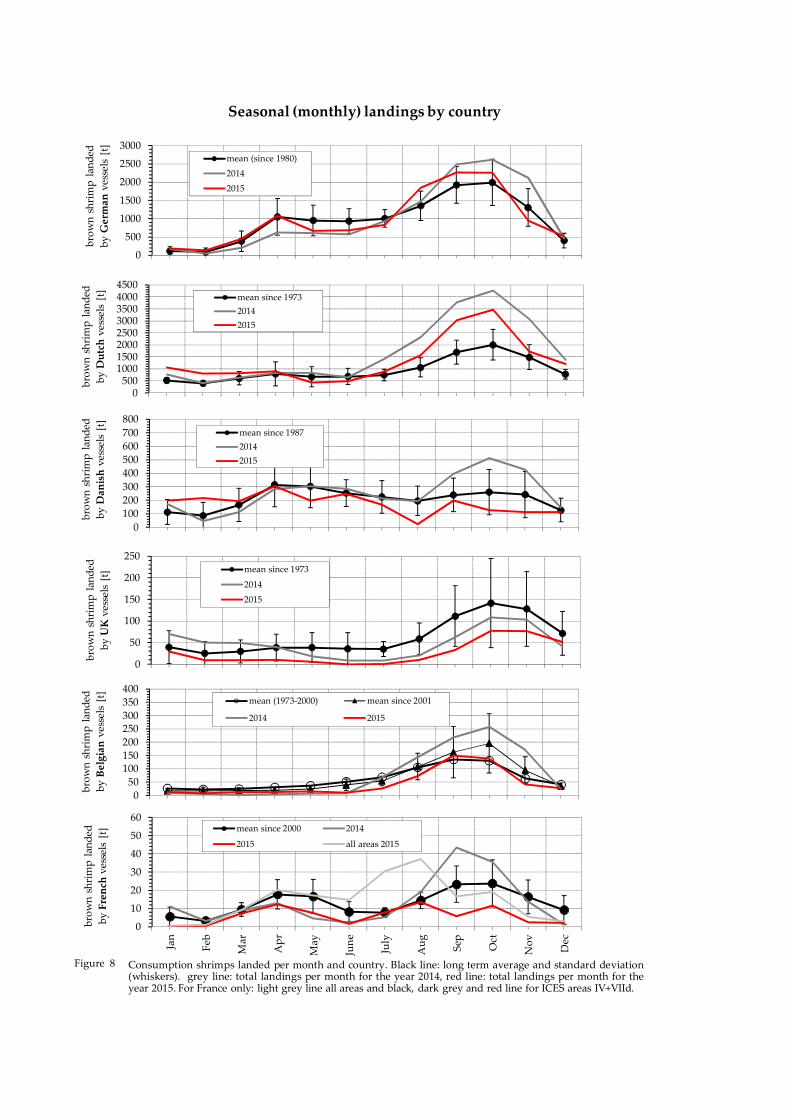
Figure 8
0
10
20
30
40
50
60
Jan
Feb
Mar
Apr
May
June
July
Aug
Sep Oct
Nov
Dec
brown shrimp landed
by French
vessels [t] mean since 2000 2014
2015 all areas 2015
0
50
100150
200
250300
350
400
brown shrimp landed
by Belgianvessels [t]
mean (1973‐2000) mean since 2001
2014 2015
0
50
100
150
200
250
brown shrimp landed
by UKvessels [t]
mean since 1973
2014
2015
0
100
200
300
400
500
600
700
800
brown shrimp landed
by Danishvessels [t]
mean since 1987
2014
2015
050010001500200025003000350040004500
brown shrimp landed
by Dutchvessels [t] mean since 1973
2014
2015
0
500
1000
1500
2000
2500
3000
brown shrimp landed
by Germanvessels [t]
mean (since 1980)
2014
2015
Seasonal (monthly) landings by country
Consumption shrimps landed per month and country. Black line: long term average and standard deviation(whiskers). grey line: total landings per month for the year 2014, red line: total landings per month for theyear 2015. For France only: light grey line all areas and black, dark grey and red line for ICES areas IV+VIId.
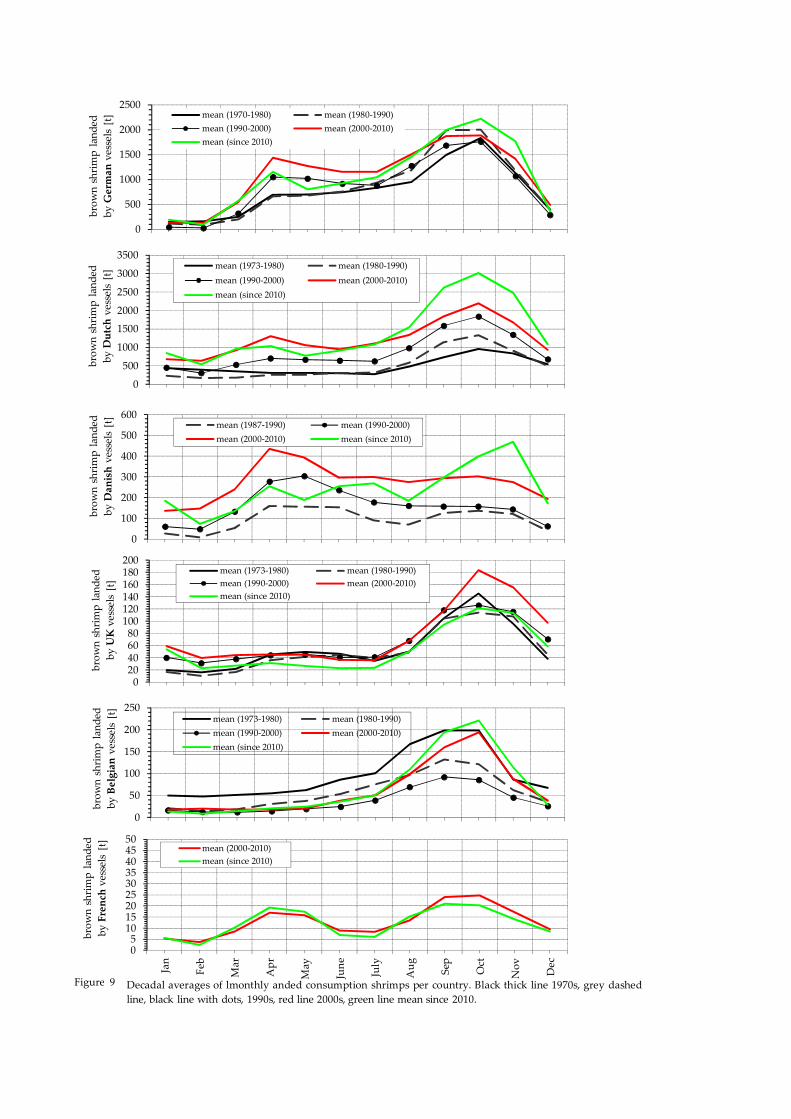
Figure 9
05101520253035404550
Jan
Feb
Mar
Apr
May
June
July
Aug
Sep
Oct
Nov
Dec
brown shrimp landed
by French
vessels [t] mean (2000‐2010)
mean (since 2010)
0
50
100
150
200
250
brown shrimp landed
by Belgianvessels [t]
mean (1973‐1980) mean (1980‐1990)
mean (1990‐2000) mean (2000‐2010)
mean (since 2010)
020406080100120140160180200
brown shrimp landed
by UKvessels [t]
mean (1973‐1980) mean (1980‐1990)
mean (1990‐2000) mean (2000‐2010)
mean (since 2010)
0
100
200
300
400
500
600
brown shrimp landed
by Danishvessels [t] mean (1987‐1990) mean (1990‐2000)
mean (2000‐2010) mean (since 2010)
0
500
1000
1500
2000
2500
3000
3500
brown shrimp landed
by Dutchvessels [t]
mean (1973‐1980) mean (1980‐1990)
mean (1990‐2000) mean (2000‐2010)
mean (since 2010)
0
500
1000
1500
2000
2500brown shrimp landed
by Germanvessels [t] mean (1970‐1980) mean (1980‐1990)
mean (1990‐2000) mean (2000‐2010)
mean (since 2010)
Decadal averages of lmonthly anded consumption shrimps per country. Black thick line 1970s, grey dashed
line, black line with dots, 1990s, red line 2000s, green line mean since 2010.
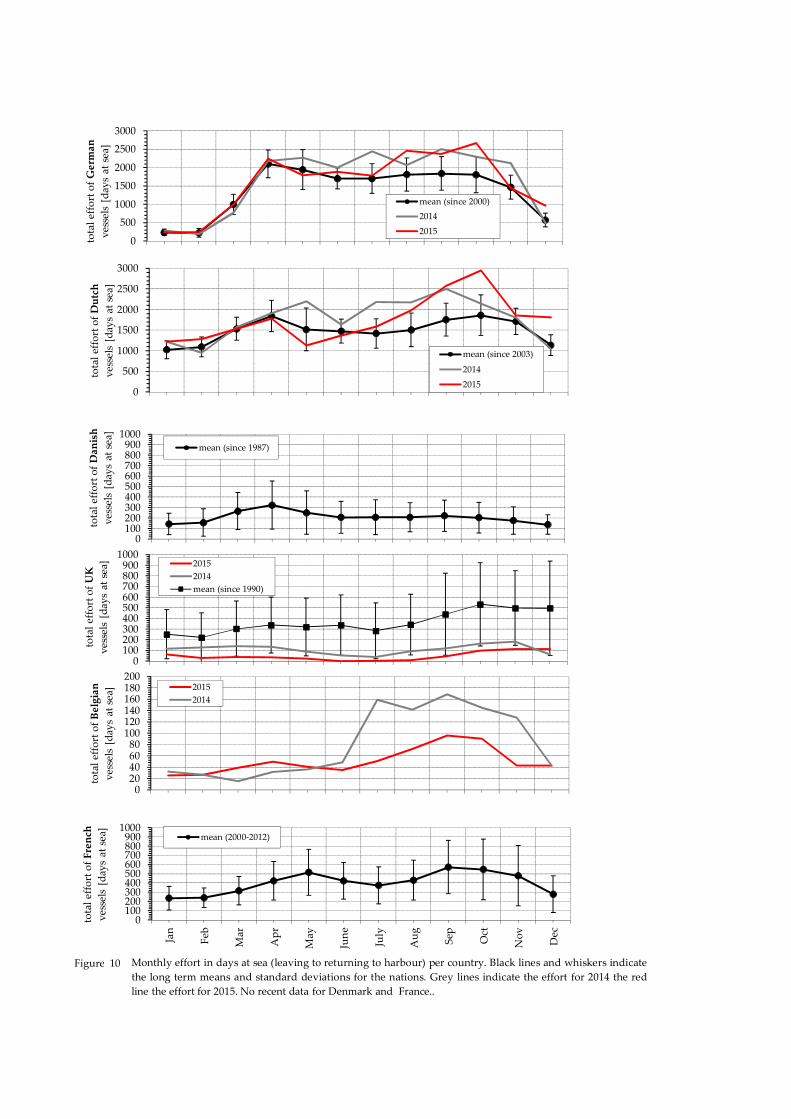
Figure 10
01002003004005006007008009001000
Jan
Feb
Mar
Apr
May
June
July
Aug
Sep Oct
Nov
Dec
total effort of French
vessels [days at sea]
mean (2000‐2012)
020406080100120140160180200
total effort of Belgian
vessels [days at sea] 2015
2014
01002003004005006007008009001000
total effort of UK
vessels [days at sea] 2015
2014
mean (since 1990)
01002003004005006007008009001000
total effort of Danish
vessels [days at sea]
mean (since 1987)
0
500
1000
1500
2000
2500
3000
total effort of Dutch
vessels [days at sea]
mean (since 2003)
2014
2015
0
500
1000
1500
2000
2500
3000
total effort of German
vessels [days at sea]
mean (since 2000)
2014
2015
Monthly effort in days at sea (leaving to returning to harbour) per country. Black lines and whiskers indicate
the long term means and standard deviations for the nations. Grey lines indicate the effort for 2014 the red
line the effort for 2015. No recent data for Denmark and France..
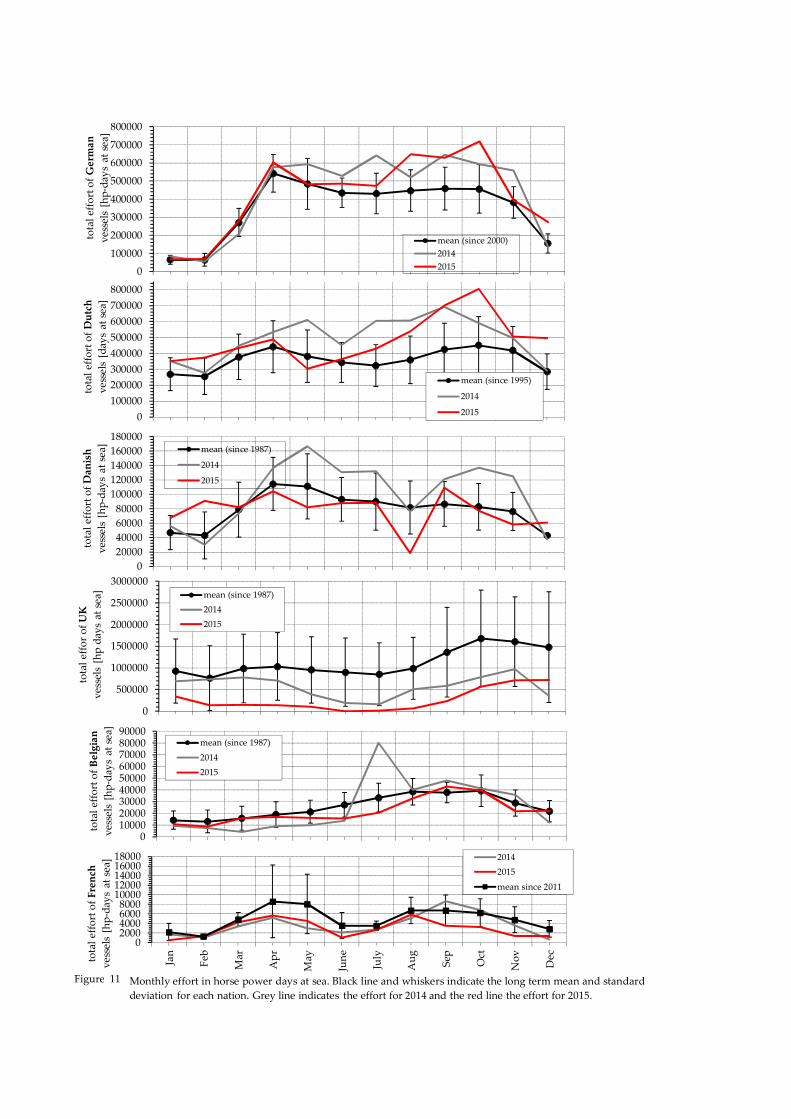
Figure 11
020004000600080001000012000140001600018000
Jan
Feb
Mar
Apr
May
June
July
Aug
Sep Oct
Nov
Dectotal effort of French
vessels [hp‐days at sea] 2014
2015
mean since 2011
0100002000030000400005000060000700008000090000
total effort of Belgian
vessels [hp‐days at sea]
mean (since 1987)
2014
2015
0
500000
1000000
1500000
2000000
2500000
3000000
total effor of UK
vessels [hp days at sea] mean (since 1987)
2014
2015
0
20000
40000
60000
80000
100000
120000
140000
160000
180000
total effort of Danish
vessels [hp‐days at sea]
mean (since 1987)
2014
2015
0
100000
200000
300000
400000
500000
600000
700000
800000
total effort of Dutch
vessels [days at sea]
mean (since 1995)
2014
2015
0
100000
200000
300000
400000
500000
600000
700000
800000
total effort of German
vessels [hp‐days at sea]
mean (since 2000)
2014
2015
Monthly effort in horse power days at sea. Black line and whiskers indicate the long term mean and standard
deviation for each nation. Grey line indicates the effort for 2014 and the red line the effort for 2015.
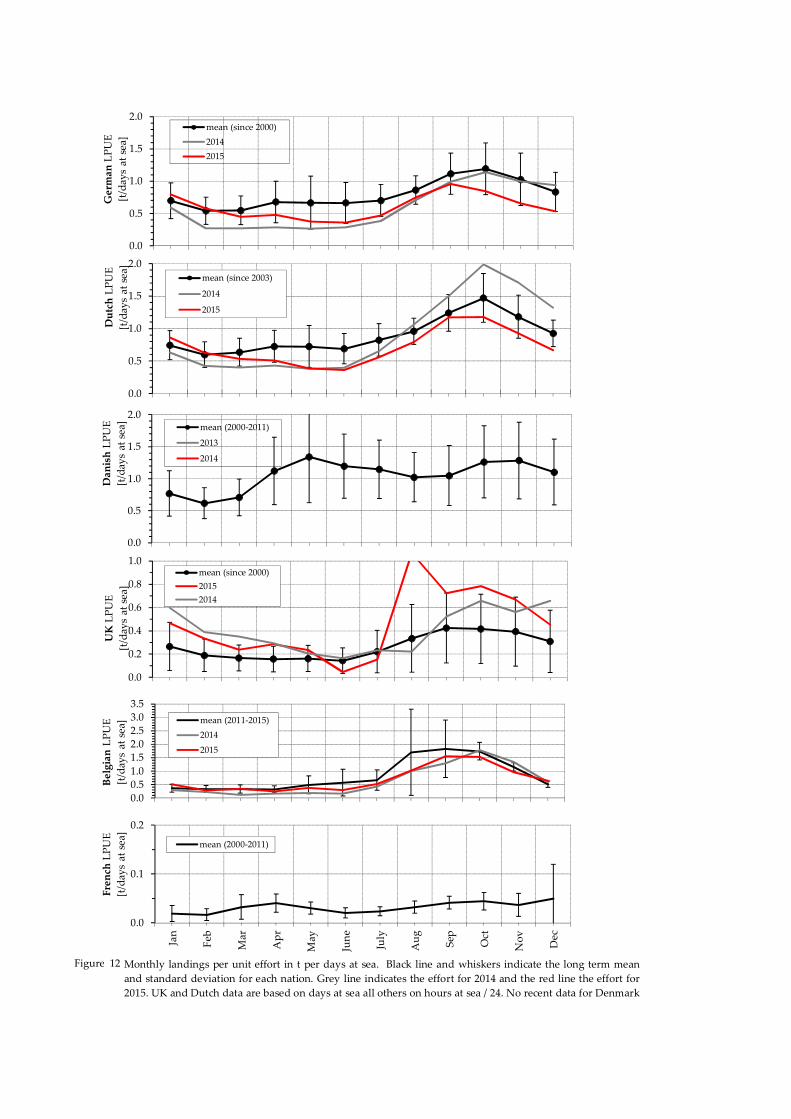
Figure 12
0.0
0.1
0.2
Jan
Feb
Mar
Apr
May
June
July
Aug
Sep
Oct
Nov
Dec
French
LPUE
[t/days at sea]
mean (2000‐2011)
0.0
0.5
1.0
1.5
2.0
2.5
3.0
3.5
BelgianLPUE
[t/days at sea] mean (2011‐2015)
2014
2015
0.0
0.2
0.4
0.6
0.8
1.0
UKLPUE
[t/days at sea]
mean (since 2000)
2015
2014
0.0
0.5
1.0
1.5
2.0
DanishLPUE
[t/days at sea]
mean (2000‐2011)
2013
2014
0.0
0.5
1.0
1.5
2.0
DutchLPUE
[t/days at sea]
mean (since 2003)
2014
2015
0.0
0.5
1.0
1.5
2.0GermanLPUE
[t/days at sea]
mean (since 2000)
2014
2015
Monthly landings per unit effort in t per days at sea. Black line and whiskers indicate the long term mean
and standard deviation for each nation. Grey line indicates the effort for 2014 and the red line the effort for
2015. UK and Dutch data are based on days at sea all others on hours at sea / 24. No recent data for Denmark
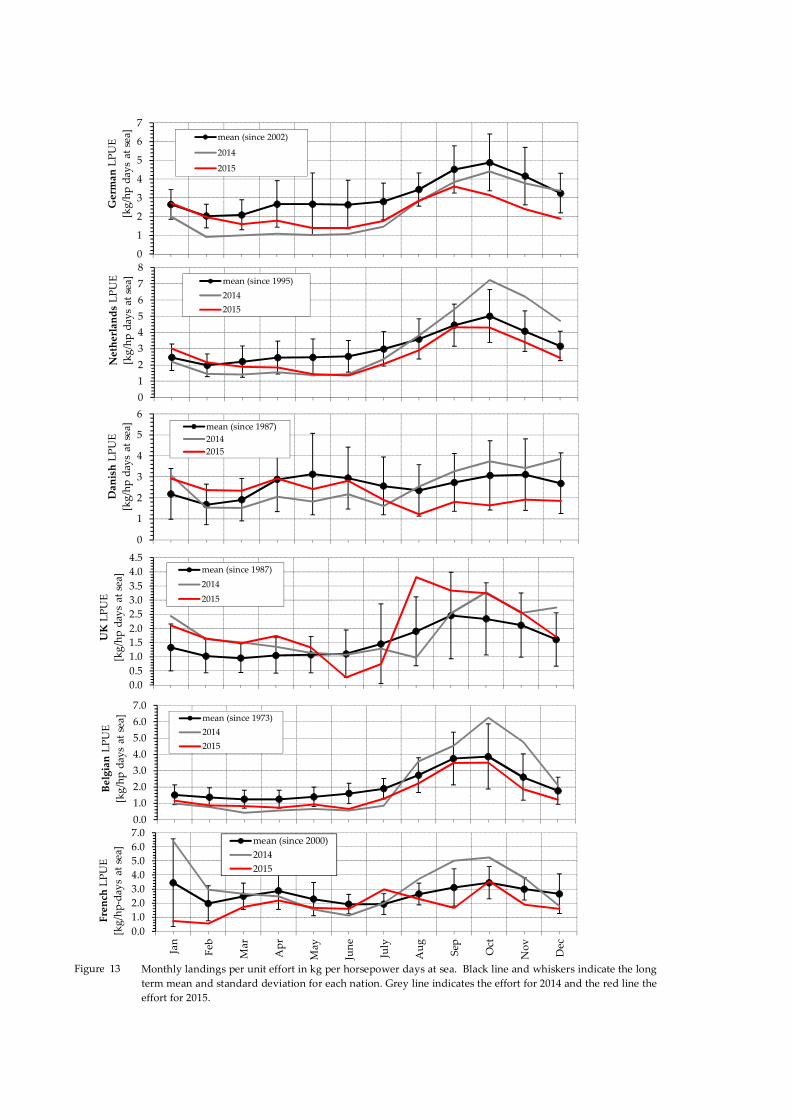
Figure 13
0.0
1.0
2.0
3.0
4.0
5.0
6.0
7.0
BelgianLPUE
[kg/hp days at sea] mean (since 1973)
2014
2015
0.0
1.0
2.0
3.0
4.0
5.0
6.0
7.0
Jan
Feb
Mar
Apr
May
June
July
Aug
Sep Oct
Nov
Dec
French
LPUE
[kg/hp‐days at sea]
mean (since 2000)
2014
2015
0.0
0.5
1.0
1.5
2.0
2.5
3.0
3.5
4.0
4.5
UKLPUE
[kg/hp days at sea] mean (since 1987)
2014
2015
0
1
2
3
4
5
6
DanishLPUE
[kg/hp days at sea] mean (since 1987)
2014
2015
0
1
2
3
4
5
6
7
8
NetherlandsLPUE
[kg/hp days at sea] mean (since 1995)
2014
2015
0
1
2
3
4
5
6
7GermanLPUE
[kg/hp days at sea]
mean (since 2002)
2014
2015
Monthly landings per unit effort in kg per horsepower days at sea. Black line and whiskers indicate the long
term mean and standard deviation for each nation. Grey line indicates the effort for 2014 and the red line the
effort for 2015.
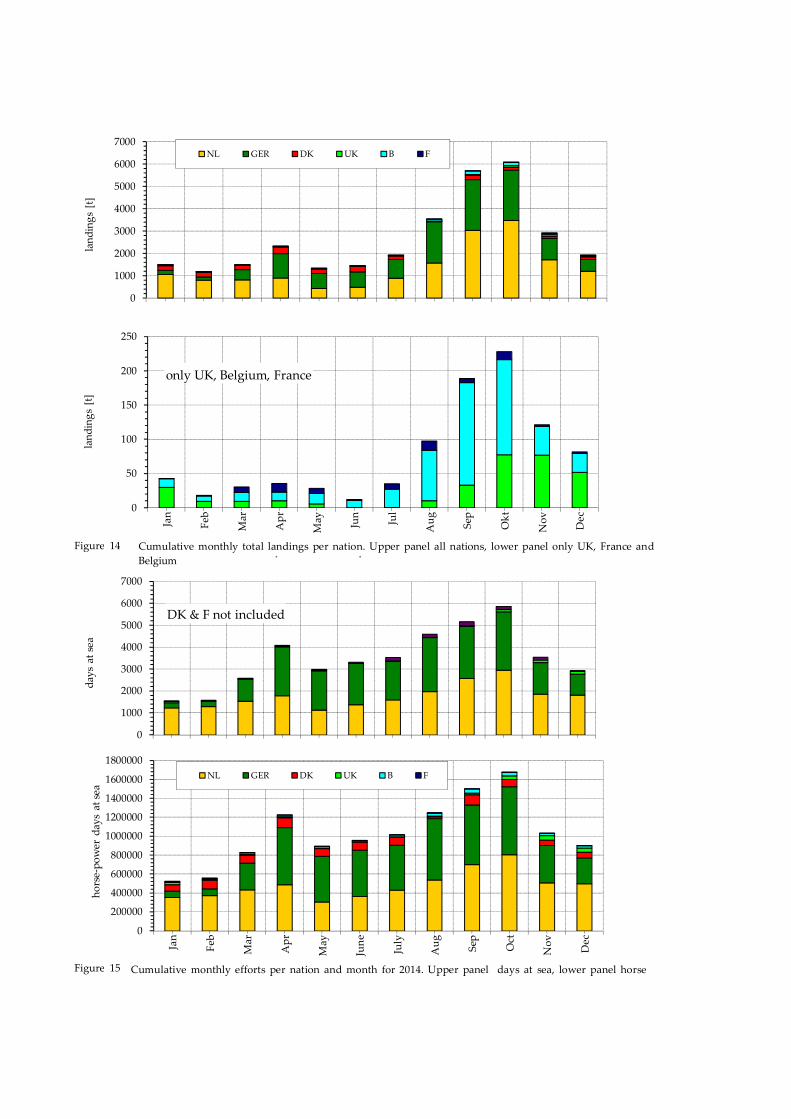
Figure 14
Figure 15
0
1000
2000
3000
4000
5000
6000
7000
days at sea
**
0
200000
400000
600000
800000
1000000
1200000
1400000
1600000
1800000
Jan
Feb
Mar
Apr
May
June
July
Aug
Sep Oct
Nov
Dec
horse‐power days at sea
NL GER DK UK B F
0
50
100
150
200
250
Jan
Feb
Mar
Apr
May Jun
Jul
Aug
Sep
Okt
Nov
Dec
landings [t]
0
1000
2000
3000
4000
5000
6000
7000
landings [t]
NL GER DK UK B F
Cumulative monthly total landings per nation. Upper panel all nations, lower panel only UK, France and
Belgium
Cumulative monthly efforts per nation and month for 2014. Upper panel days at sea, lower panel horse
DK & F not included
only UK, Belgium, France
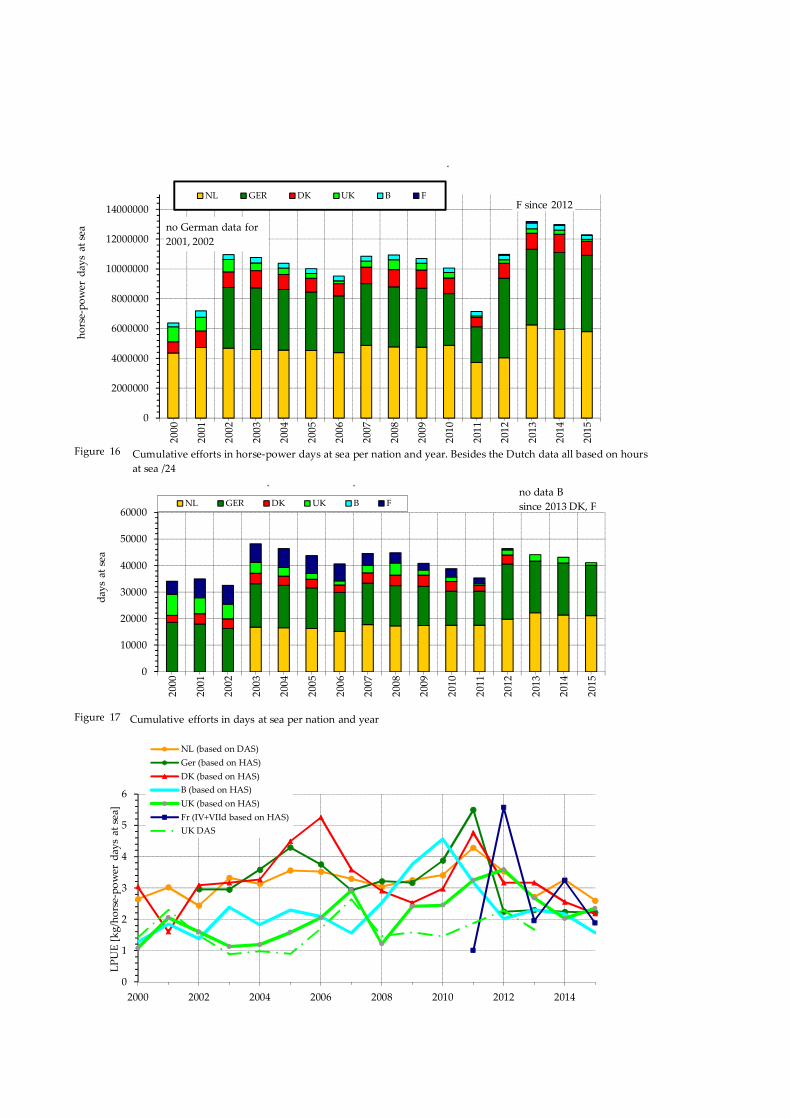
Figure 16
Figure 17
0
10000
20000
30000
40000
50000
60000
2000
2001
2002
2003
2004
2005
2006
2007
2008
2009
2010
2011
2012
2013
2014
2015
days at sea
NL GER DK UK B F
**
no data B
since 2013 DK, F
0
1
2
3
4
5
6
2000 2002 2004 2006 2008 2010 2012 2014
LPUE [kg/horse‐power days at sea]
NL (based on DAS)
Ger (based on HAS)
DK (based on HAS)
B (based on HAS)
UK (based on HAS)
Fr (IV+VIId based on HAS)
UK DAS
0
2000000
4000000
6000000
8000000
10000000
12000000
14000000
2000
2001
2002
2003
2004
2005
2006
2007
2008
2009
2010
2011
2012
2013
2014
2015
horse‐power days at sea
NL GER DK UK B F
*
no German data for
2001, 2002
F since 2012
Cumulative efforts in horse‐power days at sea per nation and year. Besides the Dutch data all based on hours
at sea /24
Cumulative efforts in days at sea per nation and year
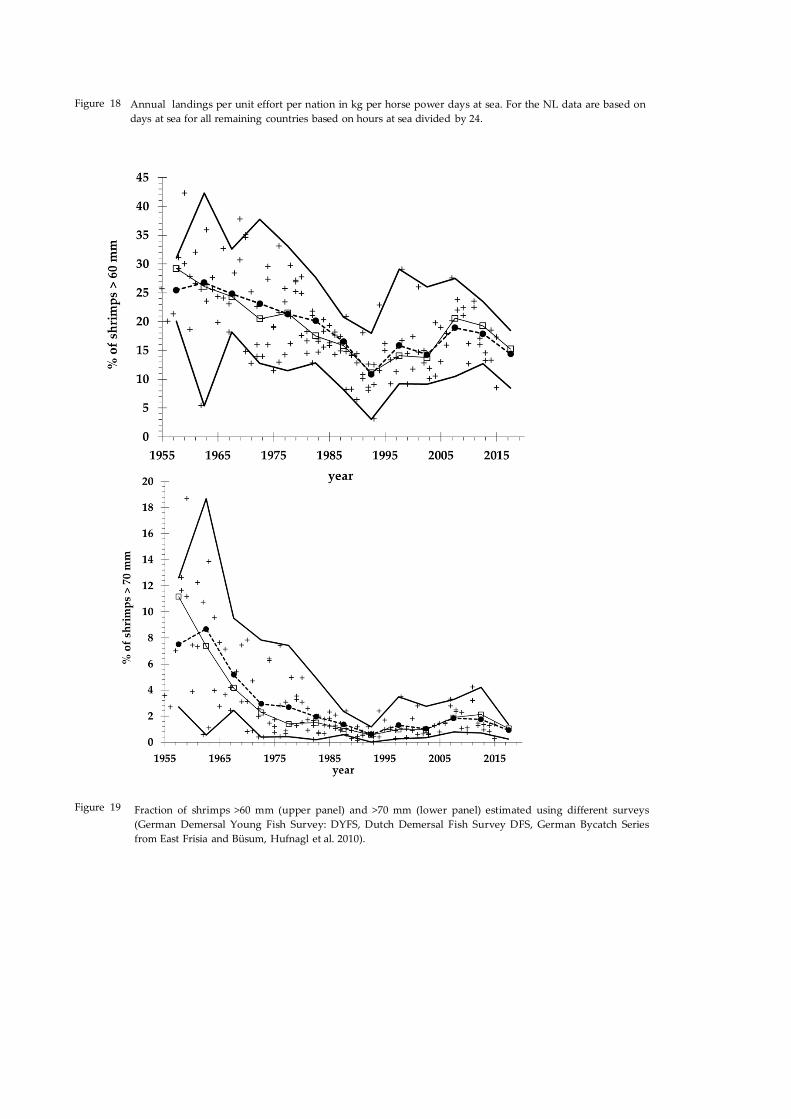
Figure 18
Figure 19
Annual landings per unit effort per nation in kg per horse power days at sea. For the NL data are based on
days at sea for all remaining countries based on hours at sea divided by 24.
Fraction of shrimps >60 mm (upper panel) and >70 mm (lower panel) estimated using different surveys
(German Demersal Young Fish Survey: DYFS, Dutch Demersal Fish Survey DFS, German Bycatch Series
from East Frisia and Büsum, Hufnagl et al. 2010).
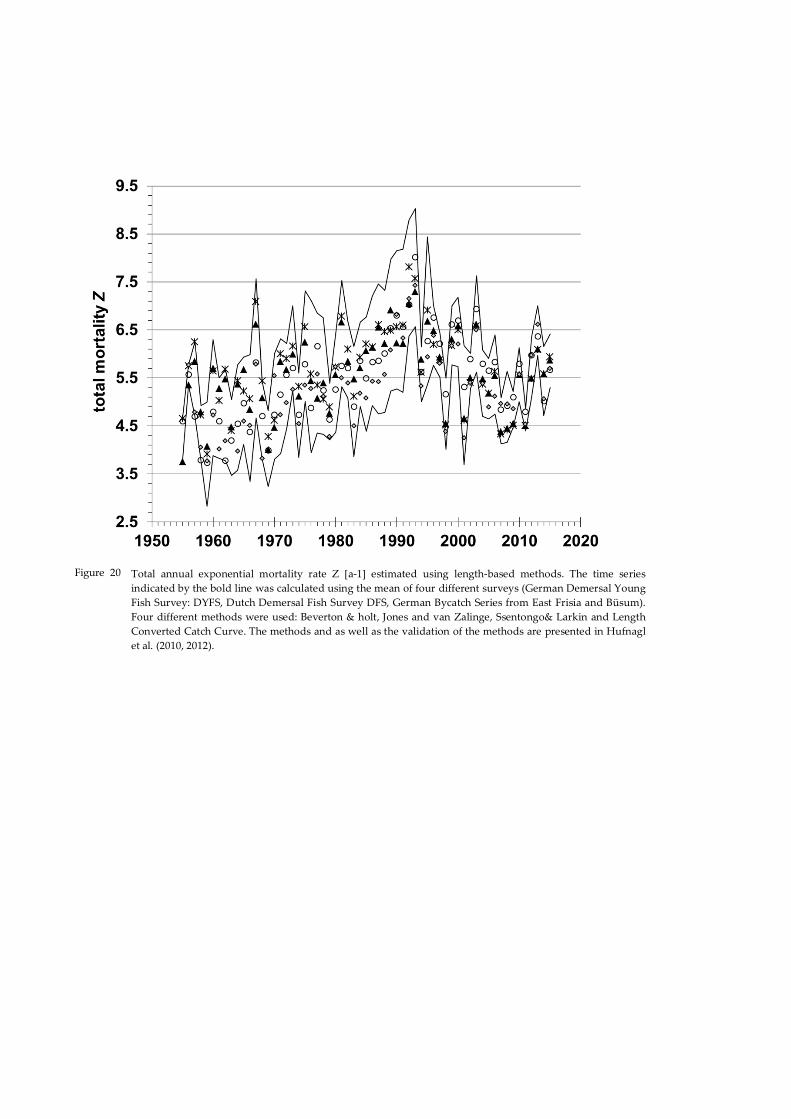
Figure 20 Total annual exponential mortality rate Z [a‐1] estimated using length‐based methods. The time series
indicated by the bold line was calculated using the mean of four different surveys (German Demersal Young
Fish Survey: DYFS, Dutch Demersal Fish Survey DFS, German Bycatch Series from East Frisia and Büsum).
Four different methods were used: Beverton & holt, Jones and van Zalinge, Ssentongo& Larkin and Length
Converted Catch Curve. The methods and as well as the validation of the methods are presented in Hufnagl
et al. (2010, 2012).
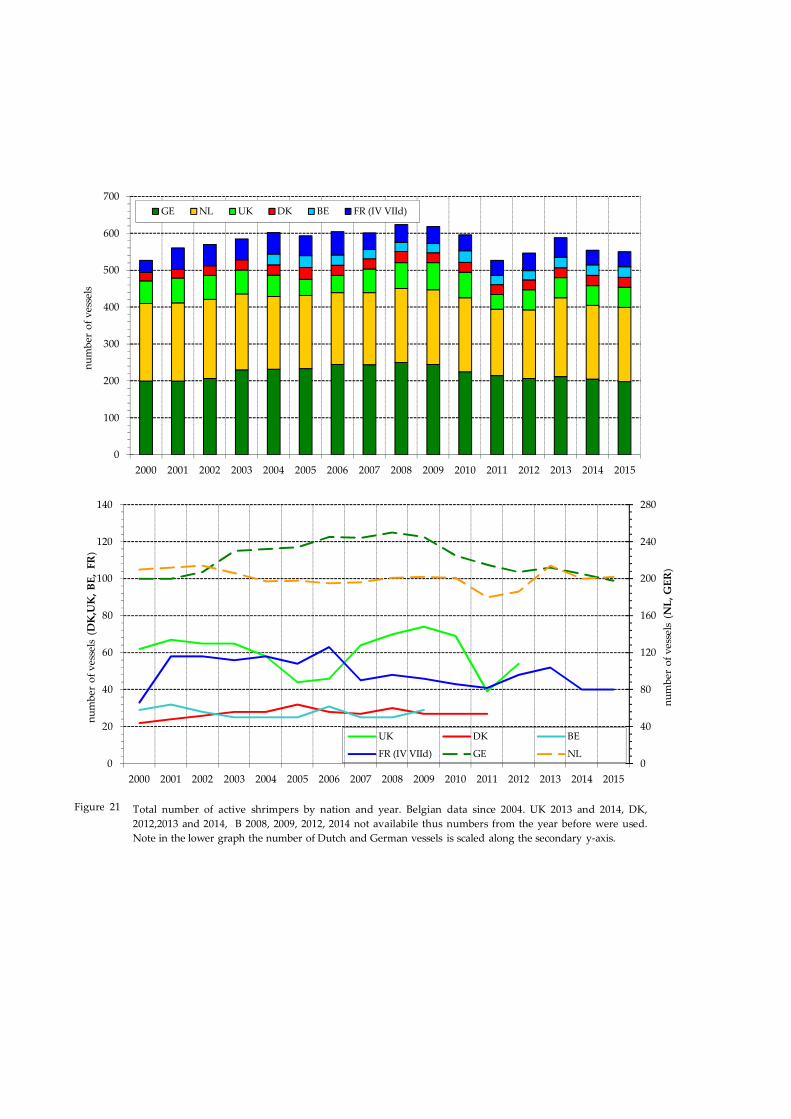
Figure 21 Total number of active shrimpers by nation and year. Belgian data since 2004. UK 2013 and 2014, DK,
2012,2013 and 2014, B 2008, 2009, 2012, 2014 not availabile thus numbers from the year before were used.
Note in the lower graph the number of Dutch and German vessels is scaled along the secondary y‐axis.
0
100
200
300
400
500
600
700
2000 2001 2002 2003 2004 2005 2006 2007 2008 2009 2010 2011 2012 2013 2014 2015
number of vessels
GE NL UK DK BE FR (IV VIId)
0
40
80
120
160
200
240
280
0
20
40
60
80
100
120
140
2000 2001 2002 2003 2004 2005 2006 2007 2008 2009 2010 2011 2012 2013 2014 2015
number of vessels (NL, GER)
number of vessels (DK,UK, BE, FR)
UK DK BE
FR (IV VIId) GE NL
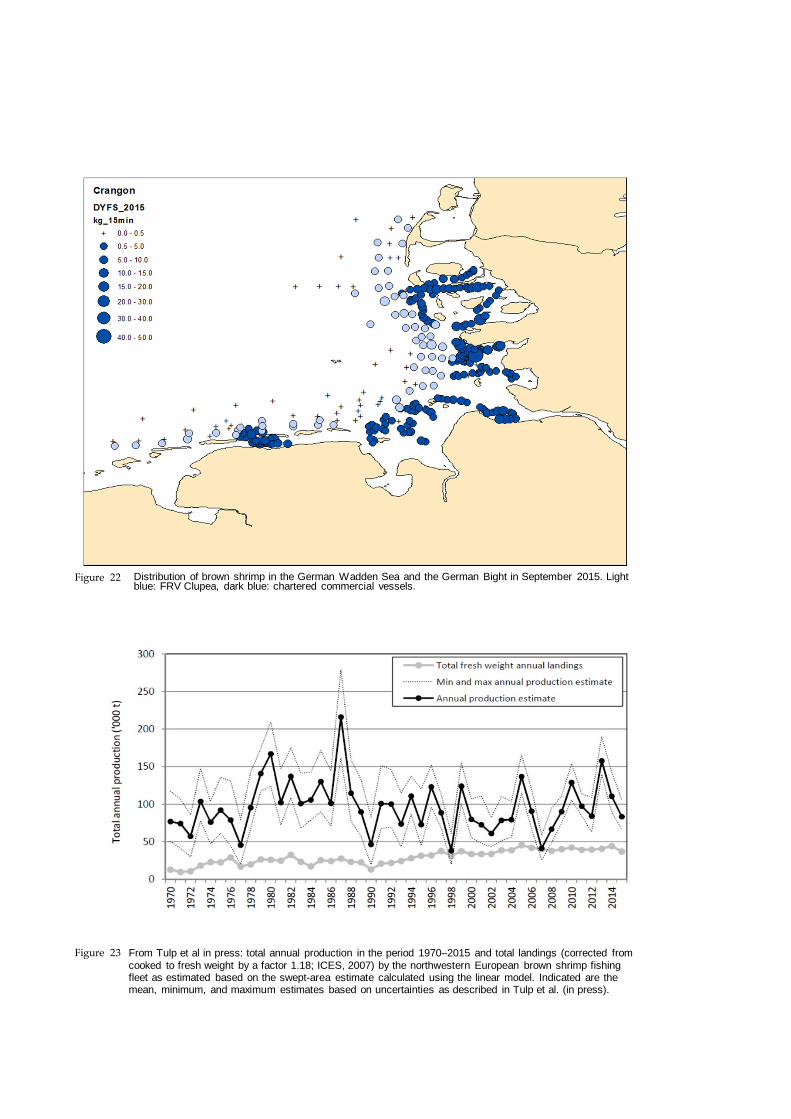
Figure 22
Figure 23
Distribution of brown shrimp in the German Wadden Sea and the German Bight in September 2015. Light blue: FRV Clupea, dark blue: chartered commercial vessels.
From Tulp et al in press: total annual production in the period 1970–2015 and total landings (corrected from cooked to fresh weight by a factor 1.18; ICES, 2007) by the northwestern European brown shrimp fishing fleet as estimated based on the swept-area estimate calculated using the linear model. Indicated are the mean, minimum, and maximum estimates based on uncertainties as described in Tulp et al. (in press).