Embed Size (px)
Citation preview
1
With additional support from: Perkin-Elmer, Jobin-Yvon, Leeman Labs
…something to get
excited about
ICP Analysis:TOFROM
Be
Mg
Ca
Sr
Ba
Ra
2
Disclaimer
Any reference to product or company names does not constitute endorsement by any of the following:
• Wisconsin State Laboratory of Hygiene,
• University of Wisconsin, • WI Dept. of Natural Resources
T/F ICP/AES can quantitate Fe+3 and Fe+2 separately
T/F Approved EPA methods require calibration with more than a blankand a single level standard
T/F A “Radial” torch requires the torch to be oriented vertically
T/F Using default 75-125% matrix spike control limits is acceptable
T/F Interference Check Samples do not need to contain target analytes (in addition to interferent elements).
T/F Interference checks must be run at the beginning AND end of each analytical sequence
T/F Approved methods require analysis of a solution containing 10 ppmeach of As, Pb, Se and Tl each day.
Warm-up
3
T/F The ICP torch burns hotter than an F-16 exhaust in 8th stage afterburner
T/F Samples that are not digested must be matrix (acid) matched or use an internal standard
T/F Interference Correction Factors can be either positive or negative
T/F Interelement Correction Factors are mandatory
Warm-up
Only establishing IECs for limited # of analytes• Interelement correction (IEC) factors have only been established for the
four major cations (aluminum, iron, calcium, and magnesium).
Why ICP Training? - Common DeficienciesNOT establishing IECs• The laboratory has not determined the extent of spectral interferences;
interelement correction factors are not employed.• Although the laboratory analyzes only drinking water samples,
interelement correction factors have not been established and spectral interference check solutions are not analyzed to support the absence of correction factors.
• Correction factors on the ICP are only established when the apparent signal of an analyte resulting from an interfering element is at or above the limit of quantitation (LOQ) of the analyte.
ICS data shows inadequate IECs• Current interelement correction factors do not provide acceptable
correction for ….
4
Why ICP Training? - Common DeficienciesNOT analyzing ICSs• Interference check samples (ICS) are not analyzed• The laboratory does not check the validity of the ICP interelement
correction factors using appropriate interference check standards.• Although interference check samples are analyzed with each batch of
samples, analysts do not evaluate the results of these determinations.• Interference check samples are not properly evaluated.
NOT establishing LDR• The linear dynamic range for each element has not been established. • The linear dynamic range is not performed every six months for those
analytes that approach the upper limit.
Other• The laboratory evaluates all matrix spikes against acceptance criteria of
70-130%.
Session Goals
Simplify the technology
Share the knowledge
Increase understanding
Provide explanations supported by data
Offer logical/defensible solutions
Generate new thinking
5
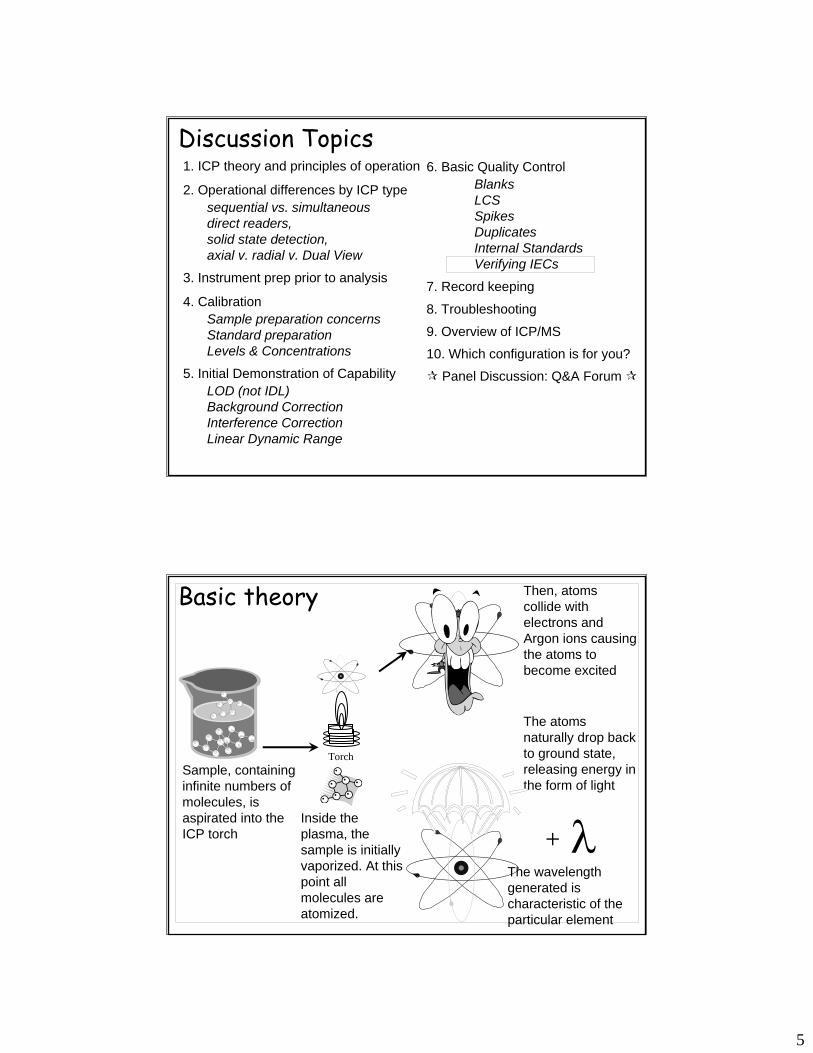
1. ICP theory and principles of operation
2. Operational differences by ICP type sequential vs. simultaneousdirect readers,solid state detection, axial v. radial v. Dual View
3. Instrument prep prior to analysis
4. CalibrationSample preparation concernsStandard preparation Levels & Concentrations
5. Initial Demonstration of CapabilityLOD (not IDL)Background CorrectionInterference CorrectionLinear Dynamic Range
6. Basic Quality ControlBlanksLCSSpikesDuplicatesInternal StandardsVerifying IECs
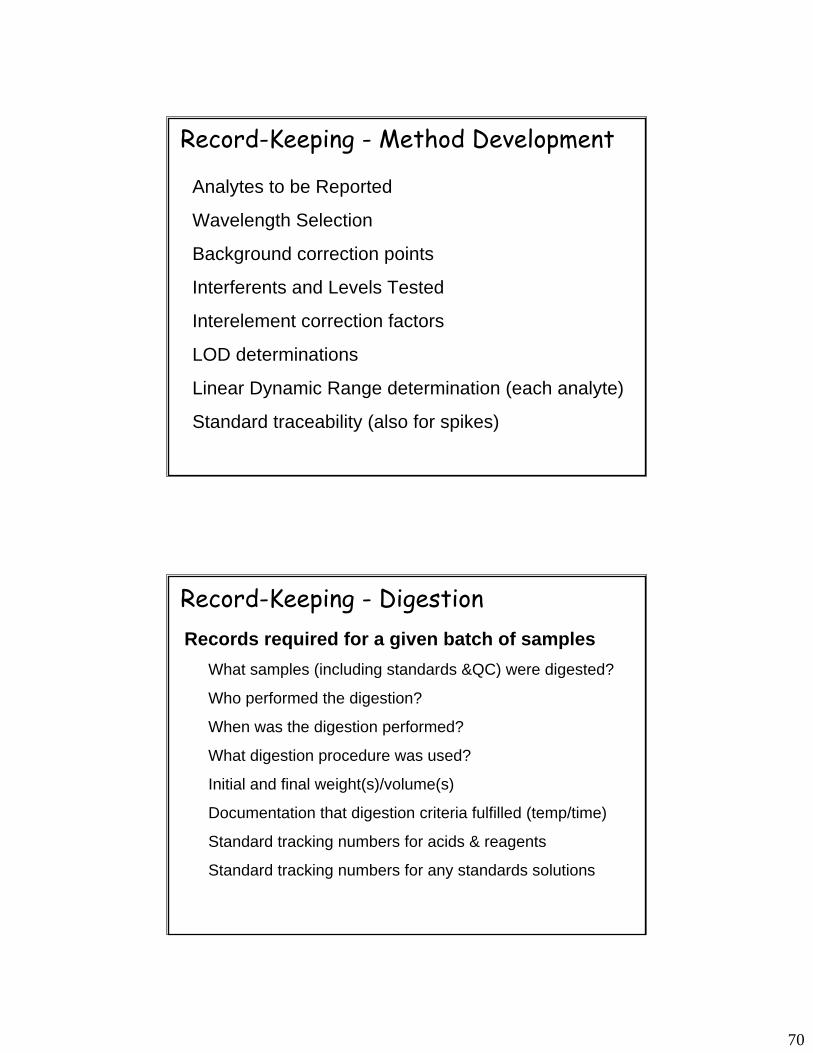
7. Record keeping
8. Troubleshooting
9. Overview of ICP/MS
10. Which configuration is for you?
Panel Discussion: Q&A Forum
Discussion Topics
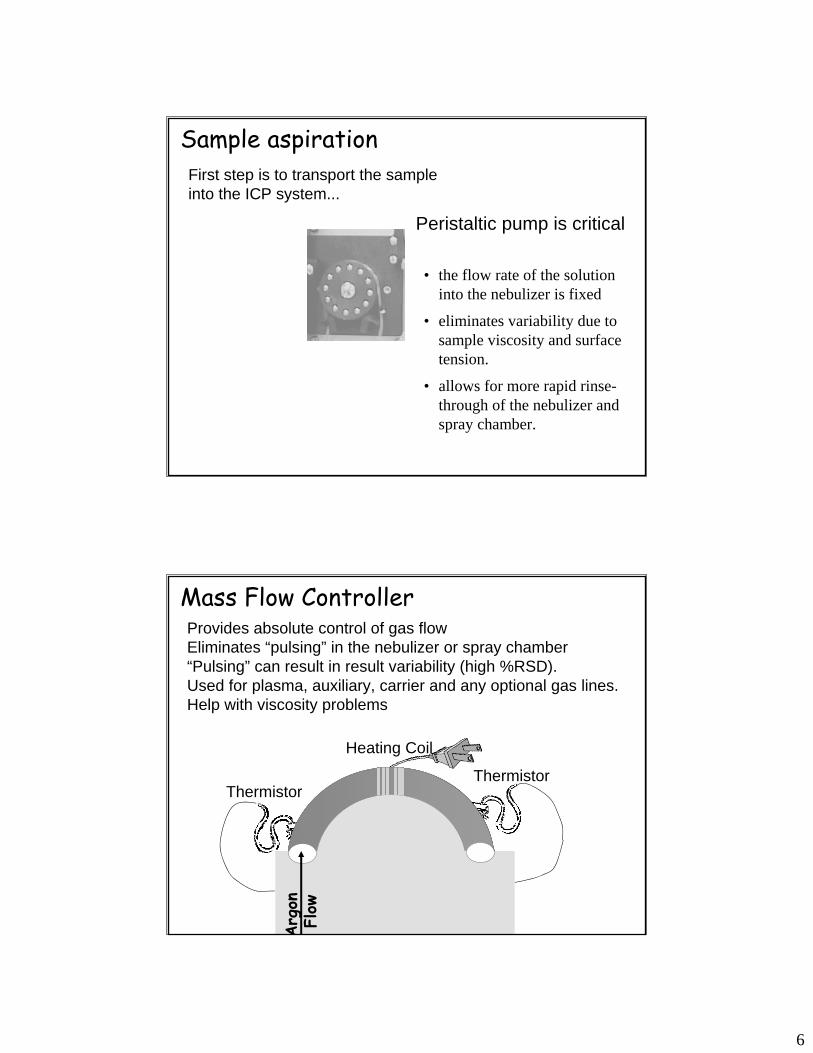
λ+
TorchSample, containing infinite numbers of molecules, is aspirated into the ICP torch
Inside the plasma, the sample is initially vaporized. At this point all molecules are atomized.
Then, atoms collide with electrons and Argon ions causing the atoms to become excited
The atoms naturally drop back to ground state, releasing energy in the form of light
The wavelength generated is characteristic of the particular element
Basic theory
6
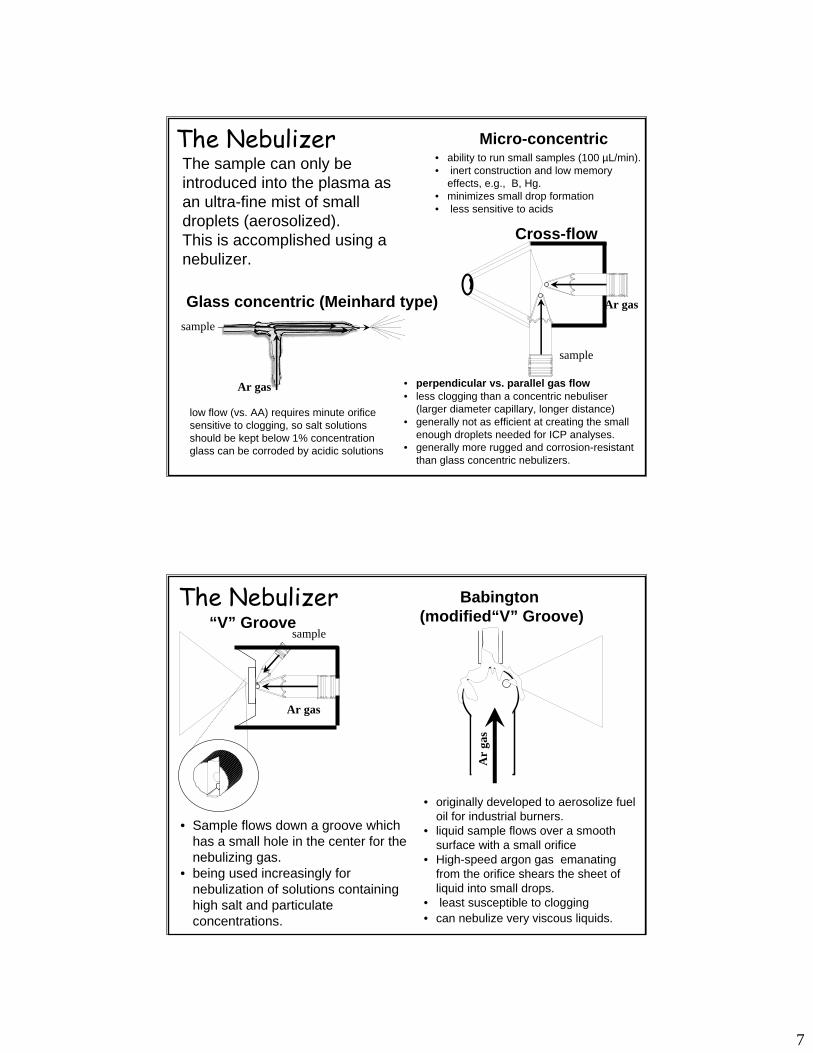
• the flow rate of the solution into the nebulizer is fixed
• eliminates variability due to sample viscosity and surface tension.
• allows for more rapid rinse-through of the nebulizer and spray chamber.
First step is to transport the sample into the ICP system...
Peristaltic pump is critical
Sample aspiration
Provides absolute control of gas flowEliminates “pulsing” in the nebulizer or spray chamber “Pulsing” can result in result variability (high %RSD).Used for plasma, auxiliary, carrier and any optional gas lines. Help with viscosity problems
Mass Flow Controller
Arg
on
Flow
ThermistorThermistor
Heating Coil
Arg
onFl
ow
7
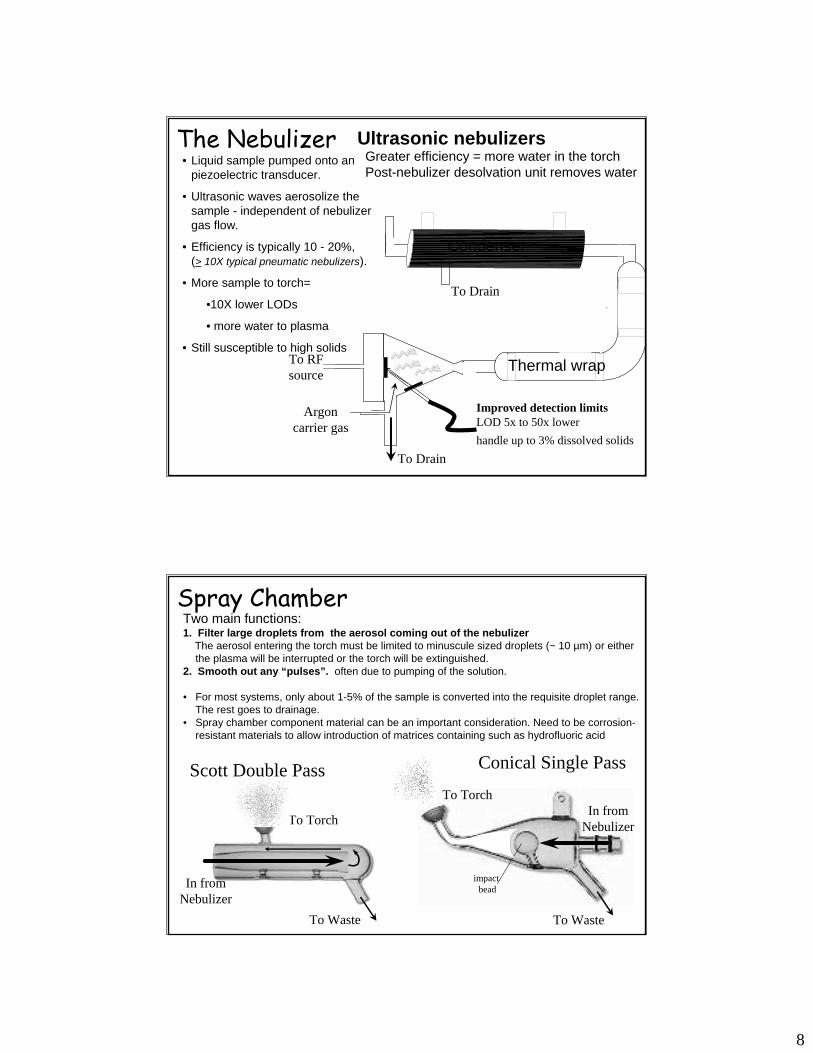
• perpendicular vs. parallel gas flow • less clogging than a concentric nebuliser
(larger diameter capillary, longer distance)• generally not as efficient at creating the small
enough droplets needed for ICP analyses. • generally more rugged and corrosion-resistant
than glass concentric nebulizers.
The sample can only be introduced into the plasma as an ultra-fine mist of small droplets (aerosolized). This is accomplished using a nebulizer.
Glass concentric (Meinhard type)sample
Ar gas
low flow (vs. AA) requires minute orifice sensitive to clogging, so salt solutions should be kept below 1% concentration glass can be corroded by acidic solutions
• ability to run small samples (100 µL/min). • inert construction and low memory
effects, e.g., B, Hg. • minimizes small drop formation • less sensitive to acids
Micro-concentric
Cross-flow
sample
Ar gas
The Nebulizer
• originally developed to aerosolize fuel oil for industrial burners.
• liquid sample flows over a smooth surface with a small orifice
• High-speed argon gas emanating from the orifice shears the sheet of liquid into small drops.
• least susceptible to clogging• can nebulize very viscous liquids.
“V” GrooveBabington
(modified“V” Groove)sample
Ar gas
• Sample flows down a groove which has a small hole in the center for the nebulizing gas.
• being used increasingly for nebulization of solutions containing high salt and particulate concentrations.
Ar
gas
The Nebulizer
8
Improved detection limitsLOD 5x to 50x lower handle up to 3% dissolved solids
To Drain
• Liquid sample pumped onto an piezoelectric transducer.
• Ultrasonic waves aerosolize the sample - independent of nebulizer gas flow.
• Efficiency is typically 10 - 20%, (> 10X typical pneumatic nebulizers).
• More sample to torch=
•10X lower LODs
• more water to plasma
• Still susceptible to high solids
Greater efficiency = more water in the torchPost-nebulizer desolvation unit removes water
Ultrasonic nebulizersThe Nebulizer
Argon carrier gas
To RF source Thermal wrap
Condenser
To Drain
Conical Single Pass
To Waste
In from Nebulizer
To Torch
impact bead
Scott Double Pass
To Waste
In from Nebulizer
To Torch
Two main functions:1. Filter large droplets from the aerosol coming out of the nebulizer
The aerosol entering the torch must be limited to minuscule sized droplets (~ 10 µm) or either the plasma will be interrupted or the torch will be extinguished.
2. Smooth out any “pulses”. often due to pumping of the solution.
• For most systems, only about 1-5% of the sample is converted into the requisite droplet range. The rest goes to drainage.
• Spray chamber component material can be an important consideration. Need to be corrosion-resistant materials to allow introduction of matrices containing such as hydrofluoric acid
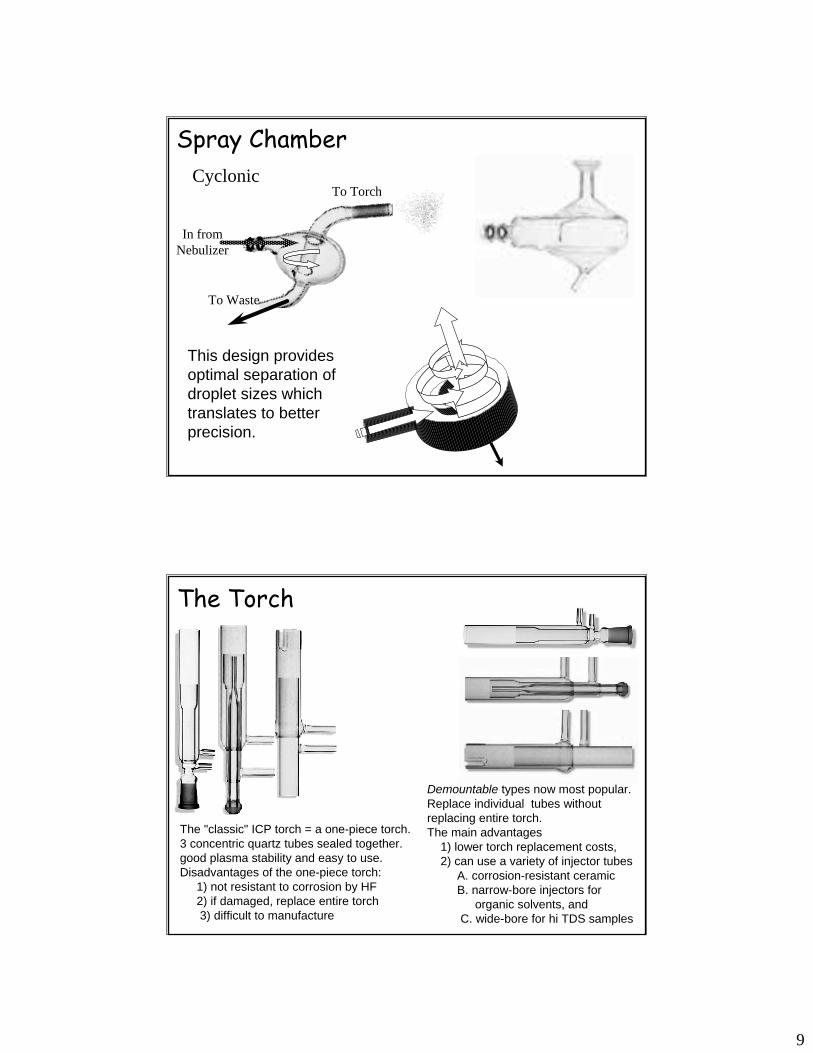
Spray Chamber
9
Cyclonic
To Waste
In from Nebulizer
To Torch
Spray Chamber
This design provides optimal separation of droplet sizes which translates to better precision.
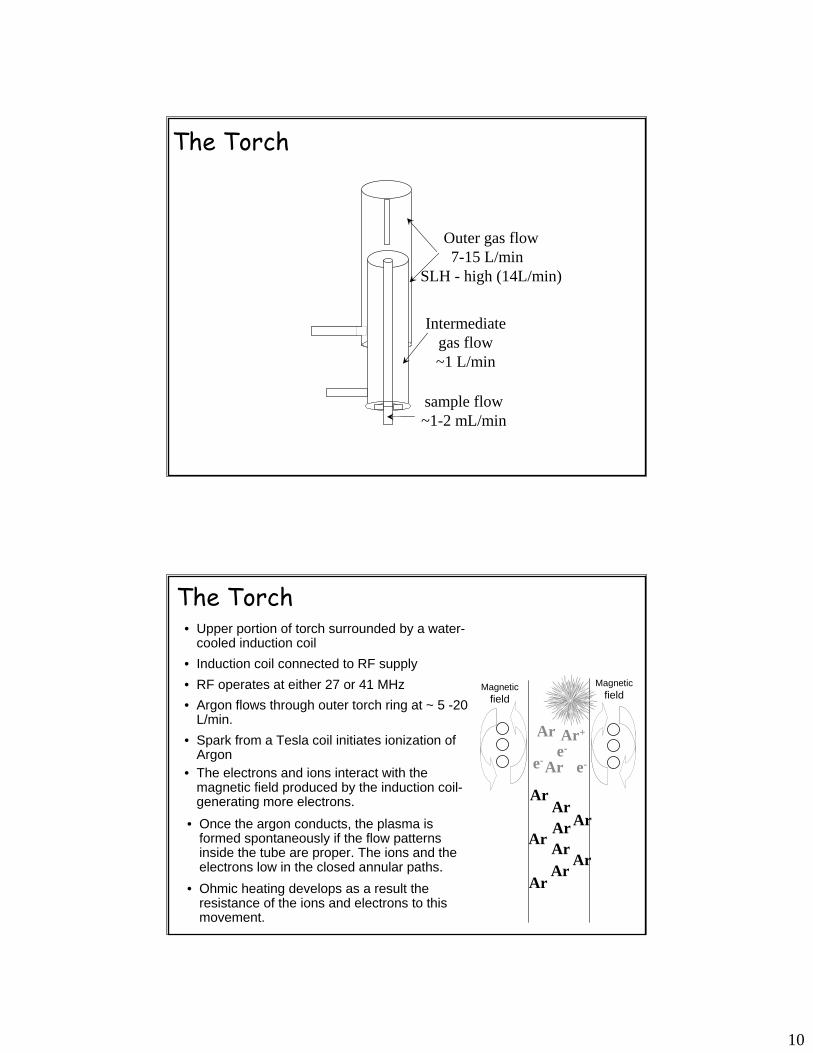
The "classic" ICP torch = a one-piece torch. 3 concentric quartz tubes sealed together. good plasma stability and easy to use. Disadvantages of the one-piece torch:
1) not resistant to corrosion by HF2) if damaged, replace entire torch3) difficult to manufacture
Demountable types now most popular. Replace individual tubes without replacing entire torch. The main advantages
1) lower torch replacement costs, 2) can use a variety of injector tubes
A. corrosion-resistant ceramicB. narrow-bore injectors for
organic solvents, and C. wide-bore for hi TDS samples
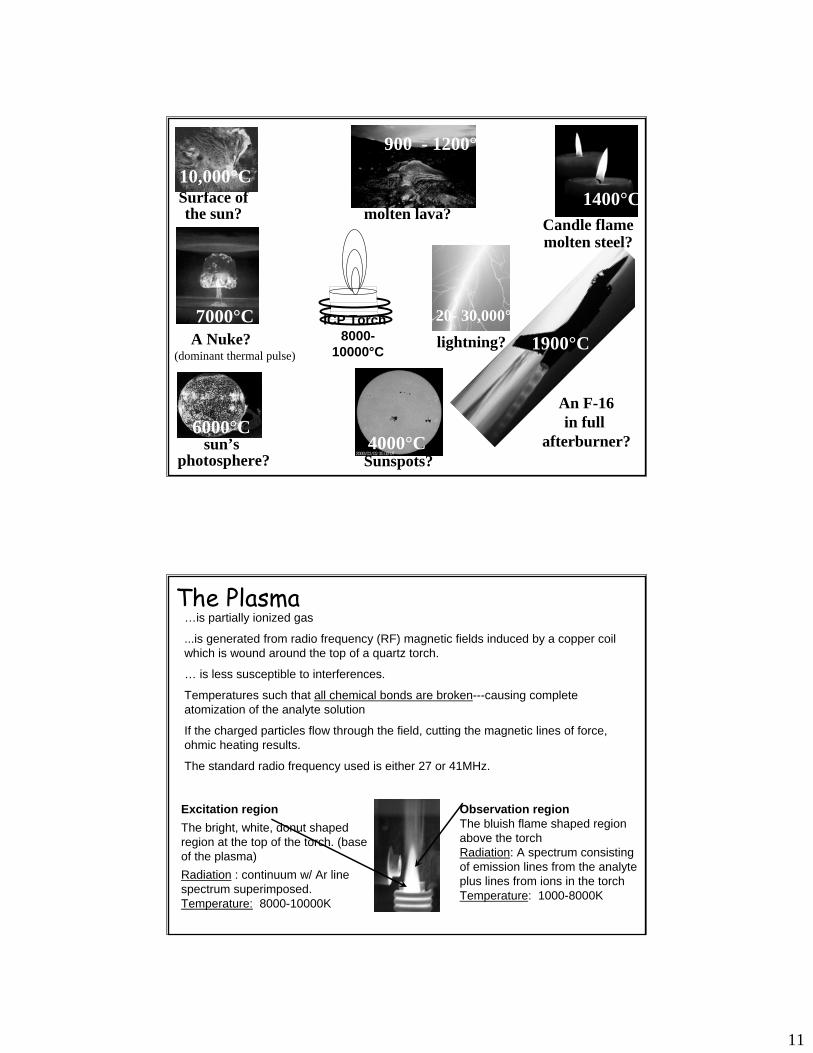
The Torch
10
Outer gas flow7-15 L/min
SLH - high (14L/min)
Intermediategas flow~1 L/min
The Torch
sample flow~1-2 mL/min
• Upper portion of torch surrounded by a water-cooled induction coil
• Induction coil connected to RF supply• RF operates at either 27 or 41 MHz
ArAr
ArAr Ar
The Torch
Ar ArAr
Ar
Ar+
e-Ar
e- e-Ar
Magneticfield
Magneticfield
• Ohmic heating develops as a result the resistance of the ions and electrons to this movement.
• Argon flows through outer torch ring at ~ 5 -20 L/min.
• Spark from a Tesla coil initiates ionization of Argon
• The electrons and ions interact with the magnetic field produced by the induction coil-generating more electrons.
• Once the argon conducts, the plasma is formed spontaneously if the flow patterns inside the tube are proper. The ions and the electrons low in the closed annular paths.
11
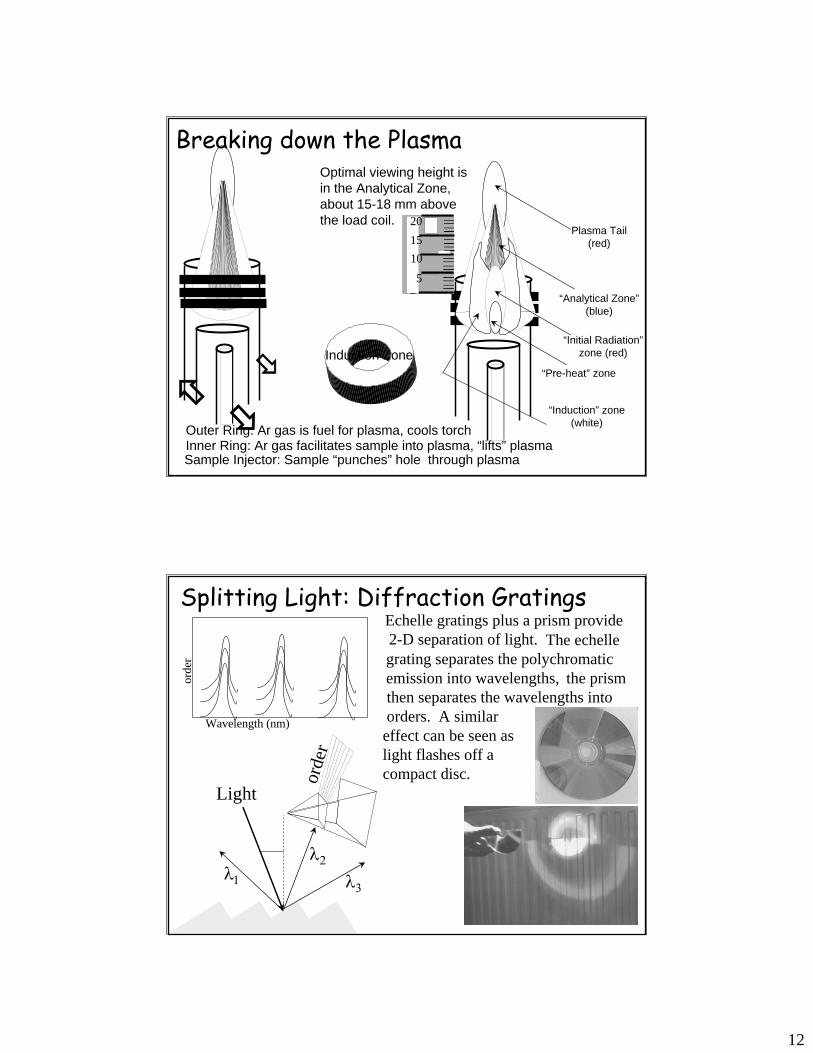
Sunspots?
molten lava?
sun’s photosphere?
A Nuke? (dominant thermal pulse)
Surface ofthe sun?
An F-16in full
afterburner?
Candle flamemolten steel?
ICP Torch8000-
10000°C lightning?
900 - 1200°C
1400°C
4000°C
20- 30,000°C
6000°C
7000°C1900°C
10,000°C
…is partially ionized gas
...is generated from radio frequency (RF) magnetic fields induced by a copper coil which is wound around the top of a quartz torch.
… is less susceptible to interferences.
Temperatures such that all chemical bonds are broken---causing complete atomization of the analyte solution
If the charged particles flow through the field, cutting the magnetic lines of force, ohmic heating results.
The standard radio frequency used is either 27 or 41MHz.
The Plasma
Observation regionThe bluish flame shaped region above the torchRadiation: A spectrum consisting of emission lines from the analyte plus lines from ions in the torchTemperature: 1000-8000K
Excitation regionThe bright, white, donut shaped region at the top of the torch. (base of the plasma)Radiation : continuum w/ Ar line spectrum superimposed.Temperature: 8000-10000K
12
Induction Zone
Breaking down the Plasma
Outer Ring: Ar gas is fuel for plasma, cools torchInner Ring: Ar gas facilitates sample into plasma, “lifts” plasmaSample Injector: Sample “punches” hole through plasma
201510
5
Optimal viewing height is in the Analytical Zone, about 15-18 mm above the load coil.
“Induction” zone(white)
“Pre-heat” zone
“Initial Radiation”zone (red)
“Analytical Zone”(blue)
Plasma Tail(red)
Light
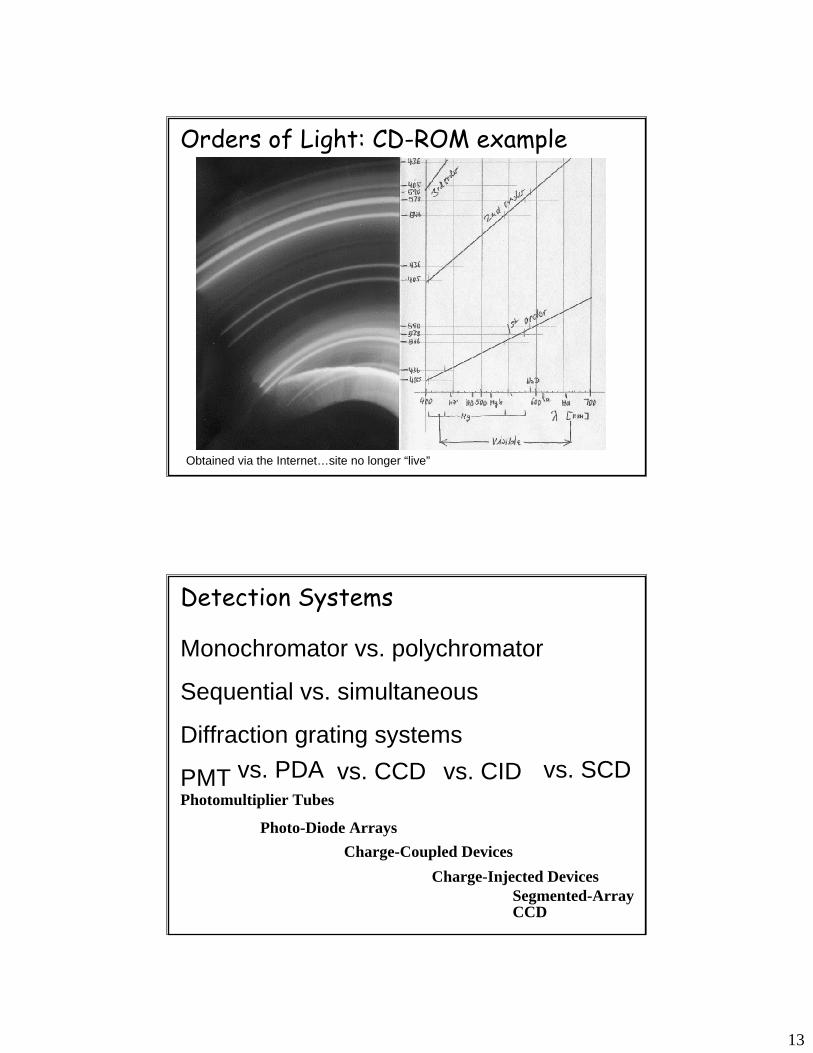
orde
r
orde
r
Wavelength (nm)
Echelle gratings plus a prism provide2-D separation of light.
A similar effect can be seen as light flashes off a compact disc.
Splitting Light: Diffraction GratingsThe echelle
grating separates the polychromatic emission into wavelengths,
λ1
λ2
λ3
the prism then separates the wavelengths into orders.
13
Obtained via the Internet…site no longer “live”
Orders of Light: CD-ROM example
Monochromator vs. polychromator
Sequential vs. simultaneous
Diffraction grating systems
PMTPhotomultiplier Tubes
Photo-Diode ArraysCharge-Coupled Devices
Charge-Injected DevicesSegmented-Array CCD
Detection Systems
vs. PDA vs. CCD vs. CID vs. SCD
14
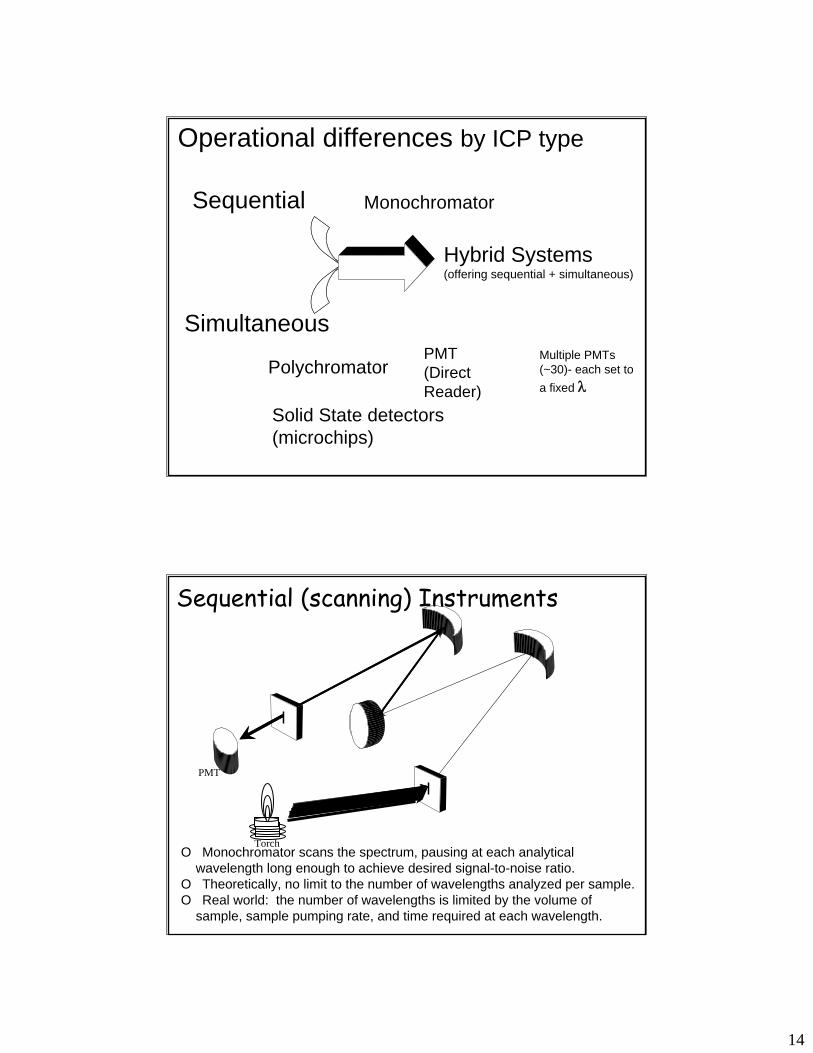
Sequential
Simultaneous
Monochromator
Solid State detectors (microchips)
Hybrid Systems(offering sequential + simultaneous)
PolychromatorPMT (Direct Reader)
Multiple PMTs(~30)- each set to a fixed λ
Operational differences by ICP type
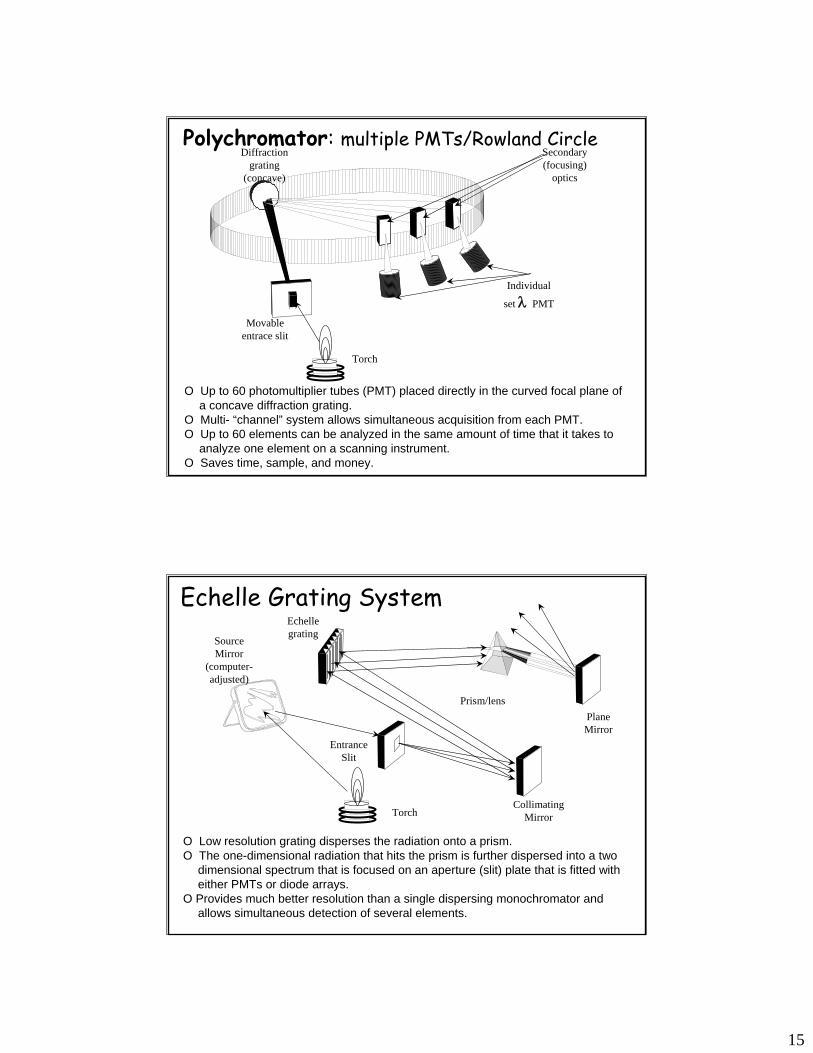
O Monochromator scans the spectrum, pausing at each analytical wavelength long enough to achieve desired signal-to-noise ratio.
O Theoretically, no limit to the number of wavelengths analyzed per sample.O Real world: the number of wavelengths is limited by the volume of
sample, sample pumping rate, and time required at each wavelength.
Torch
PMT
Sequential (scanning) Instruments
15
O Up to 60 photomultiplier tubes (PMT) placed directly in the curved focal plane of a concave diffraction grating.
O Multi- “channel” system allows simultaneous acquisition from each PMT.O Up to 60 elements can be analyzed in the same amount of time that it takes to
analyze one element on a scanning instrument.O Saves time, sample, and money.
Torch
Movable entrace slit
Diffraction grating
(concave)
Individual
set λ PMT
Secondary (focusing)
optics
Polychromator: multiple PMTs/Rowland Circle
O Low resolution grating disperses the radiation onto a prism.O The one-dimensional radiation that hits the prism is further dispersed into a two
dimensional spectrum that is focused on an aperture (slit) plate that is fitted with either PMTs or diode arrays.
O Provides much better resolution than a single dispersing monochromator and allows simultaneous detection of several elements.
Source Mirror
(computer-adjusted)
Entrance Slit
Collimating Mirror
Plane Mirror
Prism/lens
Echellegrating
Torch
Echelle Grating System
16
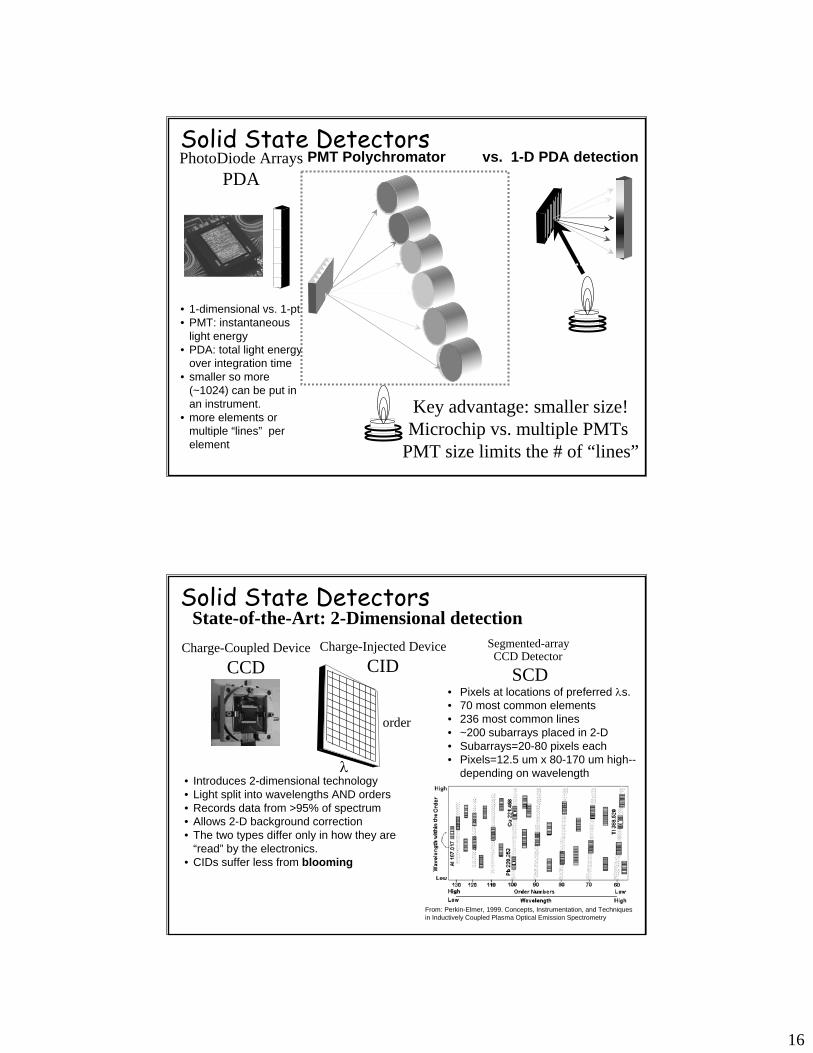
PhotoDiode ArraysPDA
• 1-dimensional vs. 1-pt• PMT: instantaneous
light energy• PDA: total light energy
over integration time• smaller so more
(~1024) can be put in an instrument.
• more elements or multiple “lines” per element
Key advantage: smaller size!Microchip vs. multiple PMTs
PMT size limits the # of “lines”
PMT Polychromator vs. 1-D PDA detectionSolid State Detectors
Charge-Coupled DeviceCCD
State-of-the-Art: 2-Dimensional detection
• Pixels at locations of preferred λs. • 70 most common elements• 236 most common lines• ~200 subarrays placed in 2-D• Subarrays=20-80 pixels each • Pixels=12.5 um x 80-170 um high--
depending on wavelength• Introduces 2-dimensional technology• Light split into wavelengths AND orders• Records data from >95% of spectrum• Allows 2-D background correction• The two types differ only in how they are
“read” by the electronics.• CIDs suffer less from blooming
λ
order
Charge-Injected DeviceCID
Solid State DetectorsSegmented-array CCD Detector
SCD
From: Perkin-Elmer, 1999. Concepts, Instrumentation, and Techniques in Inductively Coupled Plasma Optical Emission Spectrometry
17
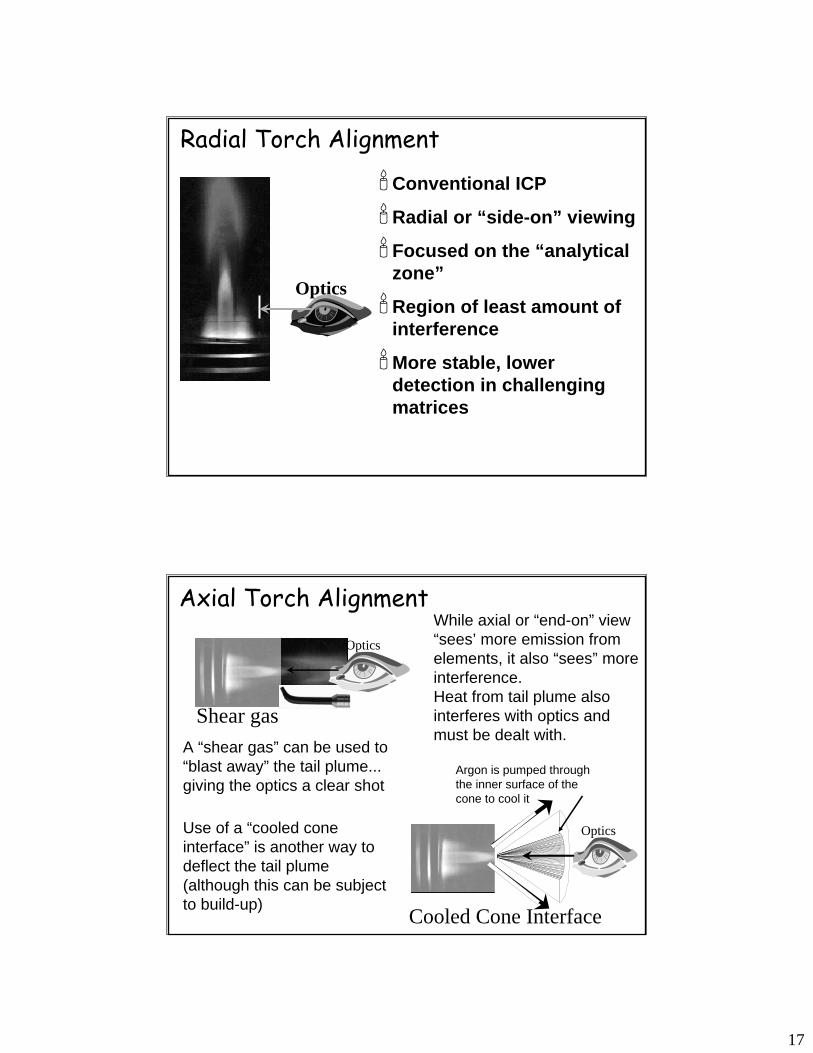
Optics
Conventional ICP
Radial or “side-on” viewing
Focused on the “analytical zone”
Region of least amount of interference
More stable, lower detection in challenging matrices
Radial Torch Alignment
Optics
Optics
Shear gas
Cooled Cone Interface
While axial or “end-on” view “sees’ more emission from elements, it also “sees” more interference.Heat from tail plume also interferes with optics and must be dealt with.
A “shear gas” can be used to “blast away” the tail plume... giving the optics a clear shot
Use of a “cooled cone interface” is another way to deflect the tail plume (although this can be subject to build-up)
Axial Torch Alignment
Argon is pumped through the inner surface of the cone to cool it
18
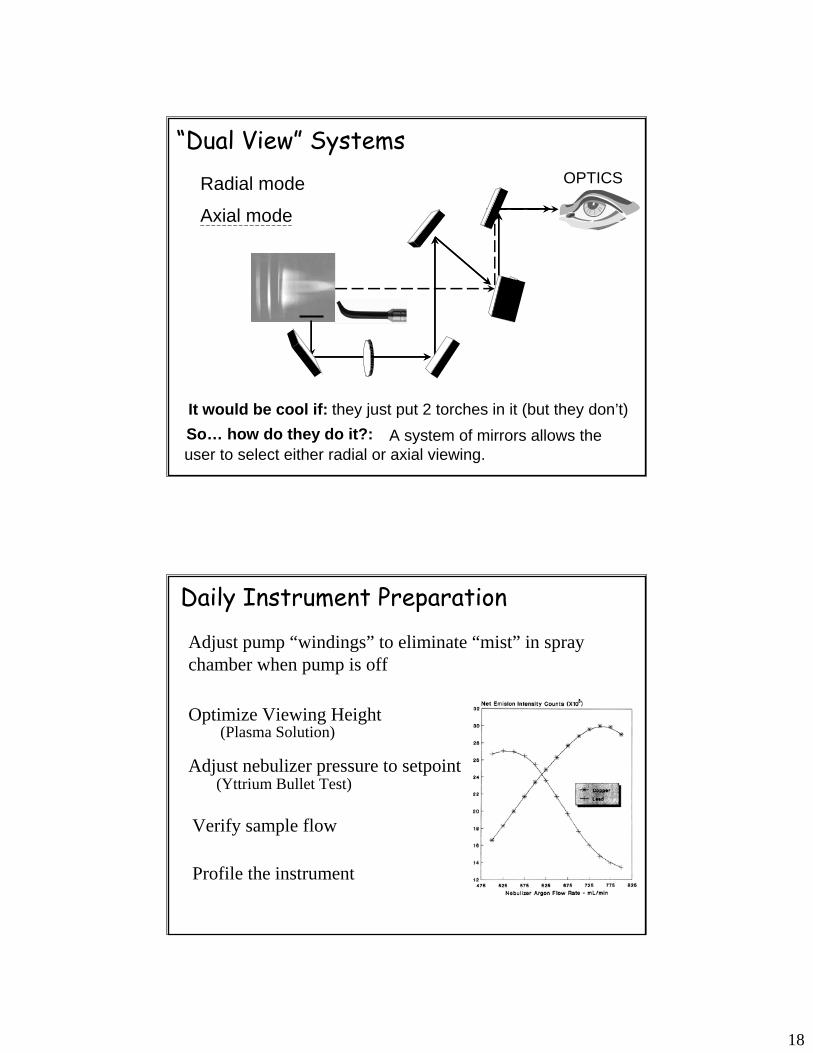
A system of mirrors allows the user to select either radial or axial viewing.So… how do they do it?:
“Dual View” SystemsRadial mode
Axial mode
It would be cool if: they just put 2 torches in it (but they don’t)
OPTICS
(Yttrium Bullet Test)Adjust nebulizer pressure to setpoint
Optimize Viewing Height
Profile the instrument
Adjust pump “windings” to eliminate “mist” in spray chamber when pump is off
(Plasma Solution)
Daily Instrument Preparation
Verify sample flow
19
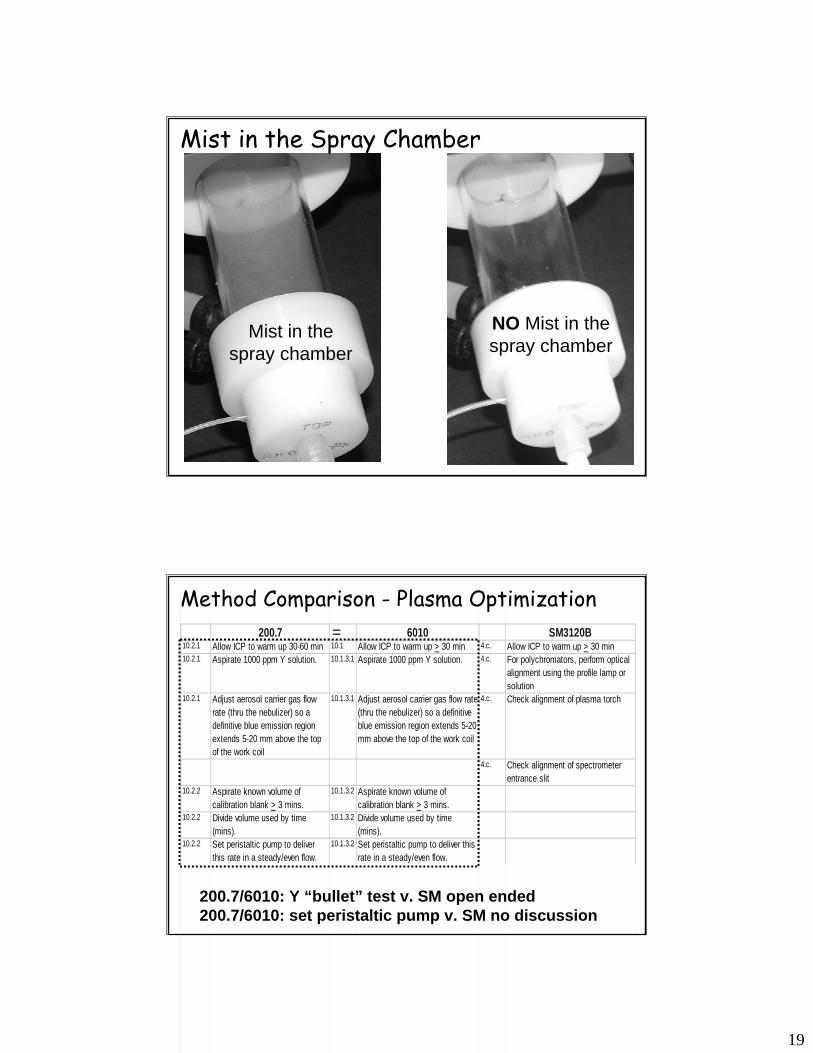
Mist in the spray chamber
NO Mist in the spray chamber
Mist in the Spray Chamber
200.7 6010 SM3120B10.2.1 Allow ICP to warm up 30-60 min 10.1 Allow ICP to warm up > 30 min 4.c. Allow ICP to warm up > 30 min10.2.1 Aspirate 1000 ppm Y solution. 10.1.3.1 Aspirate 1000 ppm Y solution. 4.c. For polychromators, perform optical
alignment using the profile lamp or solution
10.2.1 Adjust aerosol carrier gas flow rate (thru the nebulizer) so a definitive blue emission region extends 5-20 mm above the top of the work coil
10.1.3.1 Adjust aerosol carrier gas flow rate (thru the nebulizer) so a definitive blue emission region extends 5-20 mm above the top of the work coil
4.c. Check alignment of plasma torch
4.c. Check alignment of spectrometer entrance slit
10.2.2 Aspirate known volume of calibration blank > 3 mins.
10.1.3.2 Aspirate known volume of calibration blank > 3 mins.
10.2.2 Divide volume used by time (mins).
10.1.3.2 Divide volume used by time (mins).
10.2.2 Set peristaltic pump to deliver this rate in a steady/even flow.
10.1.3.2 Set peristaltic pump to deliver this rate in a steady/even flow.
200.7/6010: Y “bullet” test v. SM open ended200.7/6010: set peristaltic pump v. SM no discussion
Method Comparison - Plasma Optimization=
20
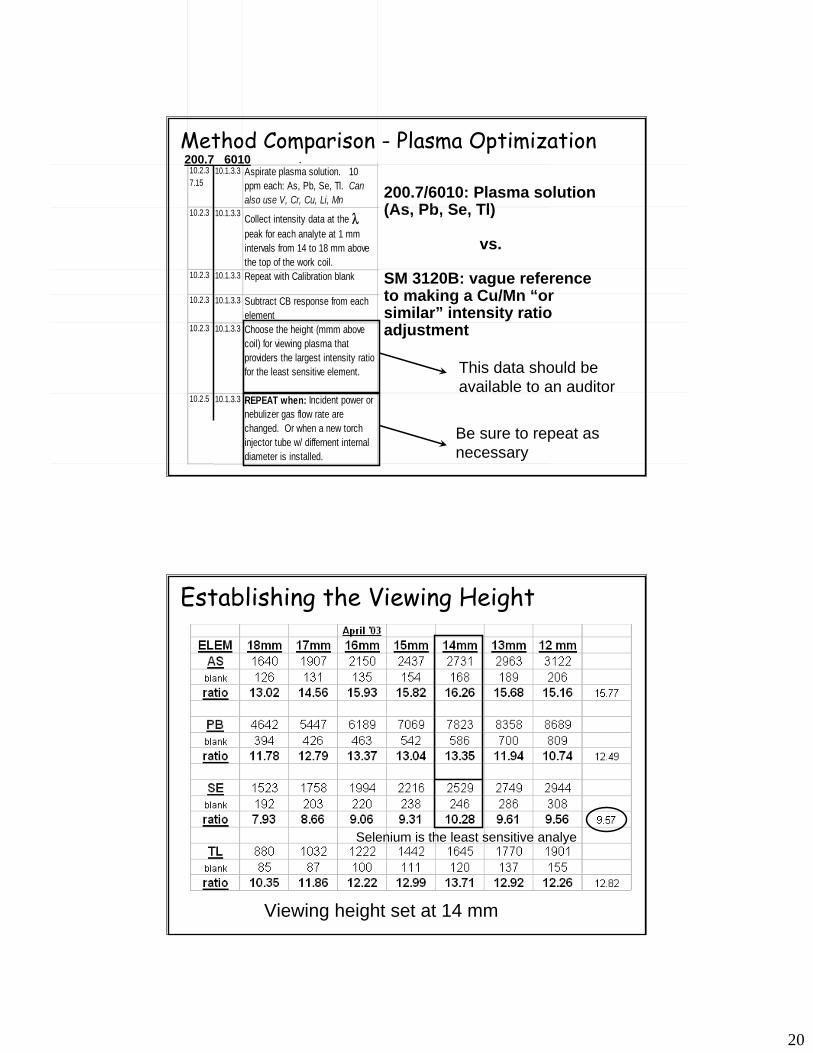
200.7/6010: Plasma solution (As, Pb, Se, Tl)
vs.
SM 3120B: vague reference to making a Cu/Mn “or similar” intensity ratio adjustment
Method Comparison - Plasma Optimization10.2.3 7.15
10.2.3
10.2.3
10.2.3
10.2.3
10.2.5
y10.1.3.3 Aspirate plasma solution. 10
ppm each: As, Pb, Se, Tl. Can also use V, Cr, Cu, Li, Mn
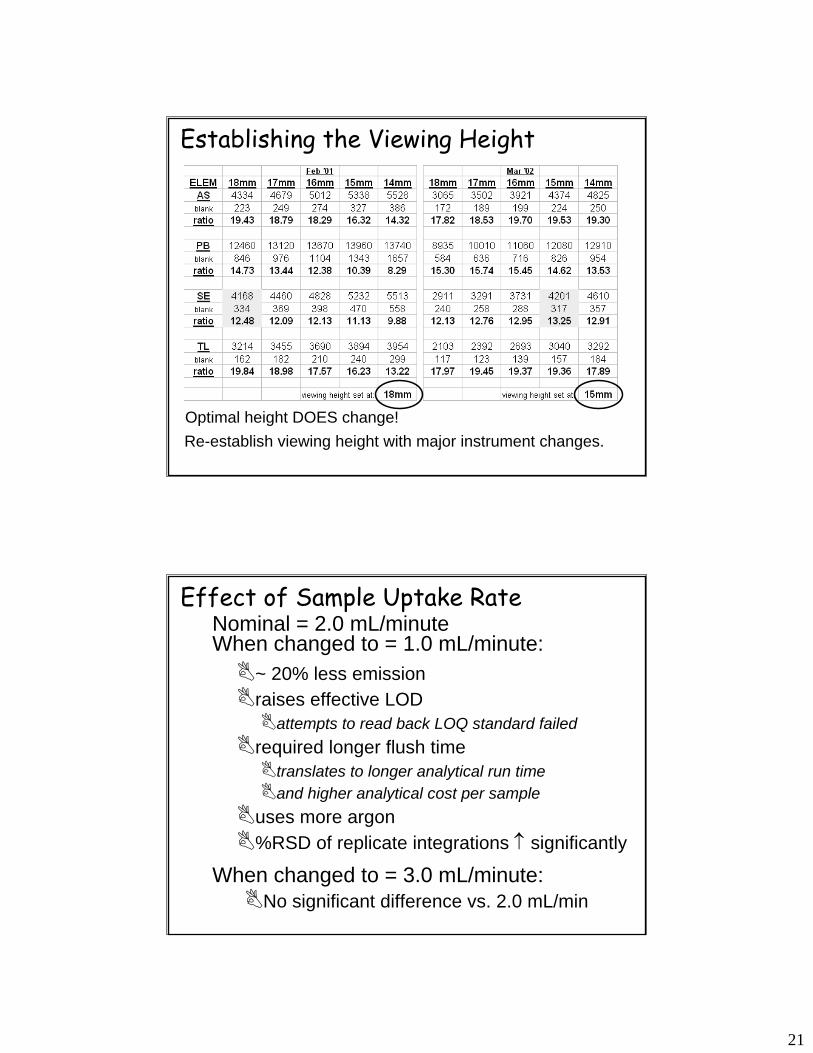
10.1.3.3 Collect intensity data at the λ peak for each analyte at 1 mm intervals from 14 to 18 mm above the top of the work coil.
10.1.3.3 Repeat with Calibration blank
10.1.3.3 Subtract CB response from each element
10.1.3.3 Choose the height (mmm above coil) for viewing plasma that providers the largest intensity ratio for the least sensitive element.
10.1.3.3 REPEAT when: Incident power or nebulizer gas flow rate are changed. Or when a new torch injector tube w/ differnent internal diameter is installed.
200.7 6010
This data should be available to an auditor
Be sure to repeat as necessary
Viewing height set at 14 mm
Establishing the Viewing Height
Selenium is the least sensitive analye
21
Re-establish viewing height with major instrument changes.Optimal height DOES change!
Establishing the Viewing Height
Effect of Sample Uptake RateNominal = 2.0 mL/minuteWhen changed to = 1.0 mL/minute:
~ 20% less emissionraises effective LOD
attempts to read back LOQ standard failedrequired longer flush time
translates to longer analytical run timeand higher analytical cost per sample
uses more argon%RSD of replicate integrations ↑ significantly
When changed to = 3.0 mL/minute:No significant difference vs. 2.0 mL/min
22
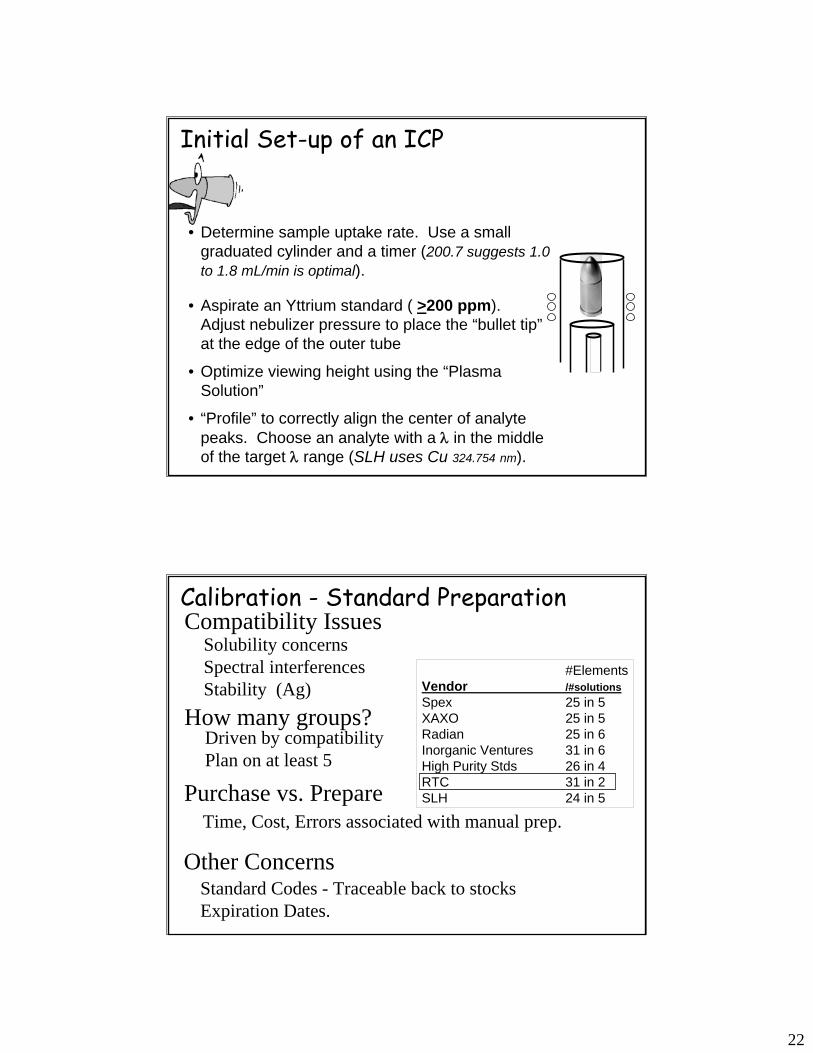
Initial Set-up of an ICP
• Determine sample uptake rate. Use a small graduated cylinder and a timer (200.7 suggests 1.0 to 1.8 mL/min is optimal).
• Aspirate an Yttrium standard ( >200 ppm). Adjust nebulizer pressure to place the “bullet tip”at the edge of the outer tube
• Optimize viewing height using the “Plasma Solution”
• “Profile” to correctly align the center of analyte peaks. Choose an analyte with a λ in the middle of the target λ range (SLH uses Cu 324.754 nm).
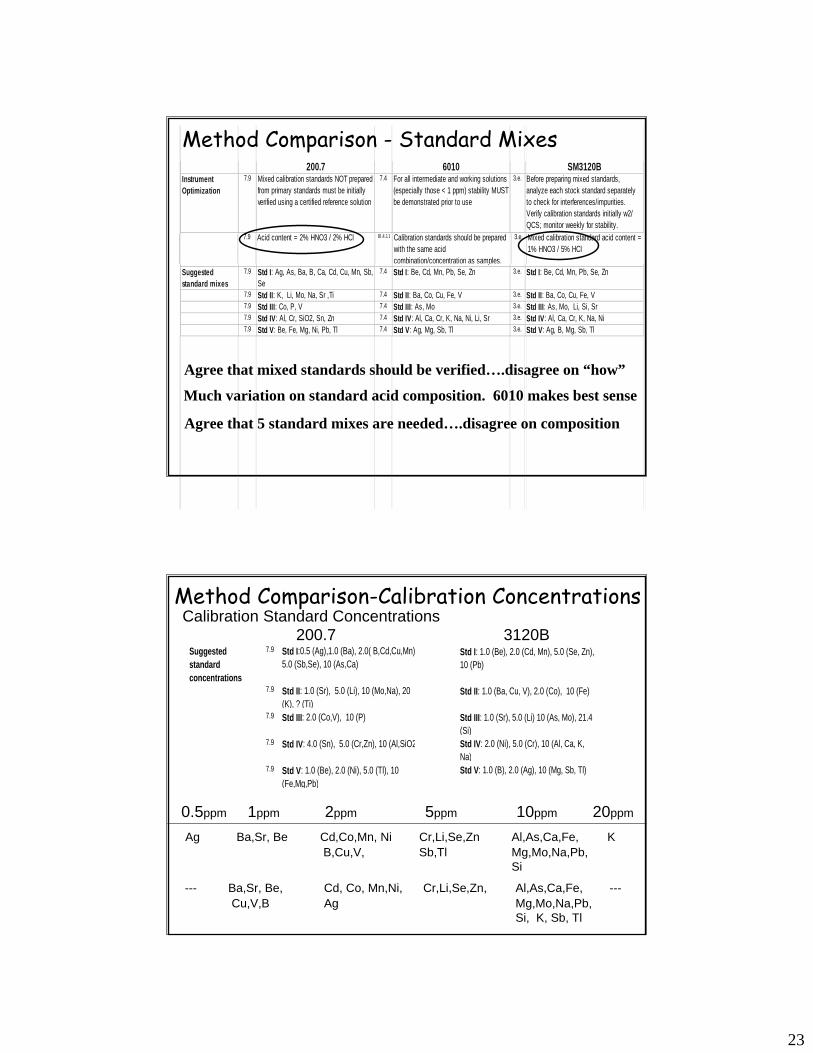
Driven by compatibilityPlan on at least 5
Solubility concernsSpectral interferencesStability (Ag)
#ElementsVendor /#solutionsSpex 25 in 5XAXO 25 in 5Radian 25 in 6Inorganic Ventures 31 in 6High Purity Stds 26 in 4RTC 31 in 2SLH 24 in 5
Calibration - Standard PreparationCompatibility Issues
How many groups?
Purchase vs. PrepareTime, Cost, Errors associated with manual prep.
Other ConcernsStandard Codes - Traceable back to stocksExpiration Dates.
23
200.7 6010 SM3120BInstrument Optimization
7.9 Mixed calibration standards NOT prepared from primary standards must be initially verified using a certified reference solution
7.4 For all intermediate and working solutions (especially those < 1 ppm) stability MUST be demonstrated prior to use
3.e. Before preparing mixed standards, analyze each stock standard separately to check for interferences/impurities. Verify calibration standards initially w2/ QCS; monitor weekly for stability.
7.9 Acid content = 2% HNO3 / 2% HCl 10.4.1.1 Calibration standards should be prepared with the same acid combination/concentration as samples.
3.e. Mixed calibration standard acid content = 1% HNO3 / 5% HCl
pSuggested standard mixes
7.9 Std I: Ag, As, Ba, B, Ca, Cd, Cu, Mn, Sb, Se
7.4 Std I: Be, Cd, Mn, Pb, Se, Zn 3.e. Std I: Be, Cd, Mn, Pb, Se, Zn
7.9 Std II: K, Li, Mo, Na, Sr ,Ti 7.4 Std II: Ba, Co, Cu, Fe, V 3.e. Std II: Ba, Co, Cu, Fe, V7.9 Std III: Co, P, V 7.4 Std III: As, Mo 3.e. Std III: As, Mo, Li, Si, Sr7.9 Std IV: Al, Cr, SiO2, Sn, Zn 7.4 Std IV: Al, Ca, Cr, K, Na, Ni, Li, Sr 3.e. Std IV: Al, Ca, Cr, K, Na, Ni7.9 Std V: Be, Fe, Mg, Ni, Pb, Tl 7.4 Std V: Ag, Mg, Sb, Tl 3.e. Std V: Ag, B, Mg, Sb, Tl
Agree that mixed standards should be verified….disagree on “how”
Much variation on standard acid composition. 6010 makes best sense
Agree that 5 standard mixes are needed….disagree on composition
Method Comparison - Standard Mixes
Suggested standard concentrations
7.9 Std I:0.5 (Ag),1.0 (Ba), 2.0( B,Cd,Cu,Mn), 5.0 (Sb,Se), 10 (As,Ca)
7.9 Std II: 1.0 (Sr), 5.0 (Li), 10 (Mo,Na), 20 (K), ? (Ti)
7.9 Std III: 2.0 (Co,V), 10 (P)
7.9 Std IV: 4.0 (Sn), 5.0 (Cr,Zn), 10 (Al,SiO2)
7.9 Std V: 1.0 (Be), 2.0 (Ni), 5.0 (Tl), 10 (Fe,Mg,Pb)
Method Comparison-Calibration Concentrations
Std I: 1.0 (Be), 2.0 (Cd, Mn), 5.0 (Se, Zn), 10 (Pb)
Std II: 1.0 (Ba, Cu, V), 2.0 (Co), 10 (Fe)
Std III: 1.0 (Sr), 5.0 (Li) 10 (As, Mo), 21.4 (Si)Std IV: 2.0 (Ni), 5.0 (Cr), 10 (Al, Ca, K, Na)Std V: 1.0 (B), 2.0 (Ag), 10 (Mg, Sb, Tl)
200.7 3120B
0.5ppm 1ppm 2ppm 5ppm 10ppm 20ppm
Ag Ba,Sr, Be Cd,Co,Mn, Ni Cr,Li,Se,Zn Al,As,Ca,Fe, KB,Cu,V, Sb,Tl Mg,Mo,Na,Pb,
Si
--- Ba,Sr, Be, Cd, Co, Mn,Ni, Cr,Li,Se,Zn, Al,As,Ca,Fe, ---Cu,V,B Ag Mg,Mo,Na,Pb,
Si, K, Sb, Tl
Calibration Standard Concentrations
24
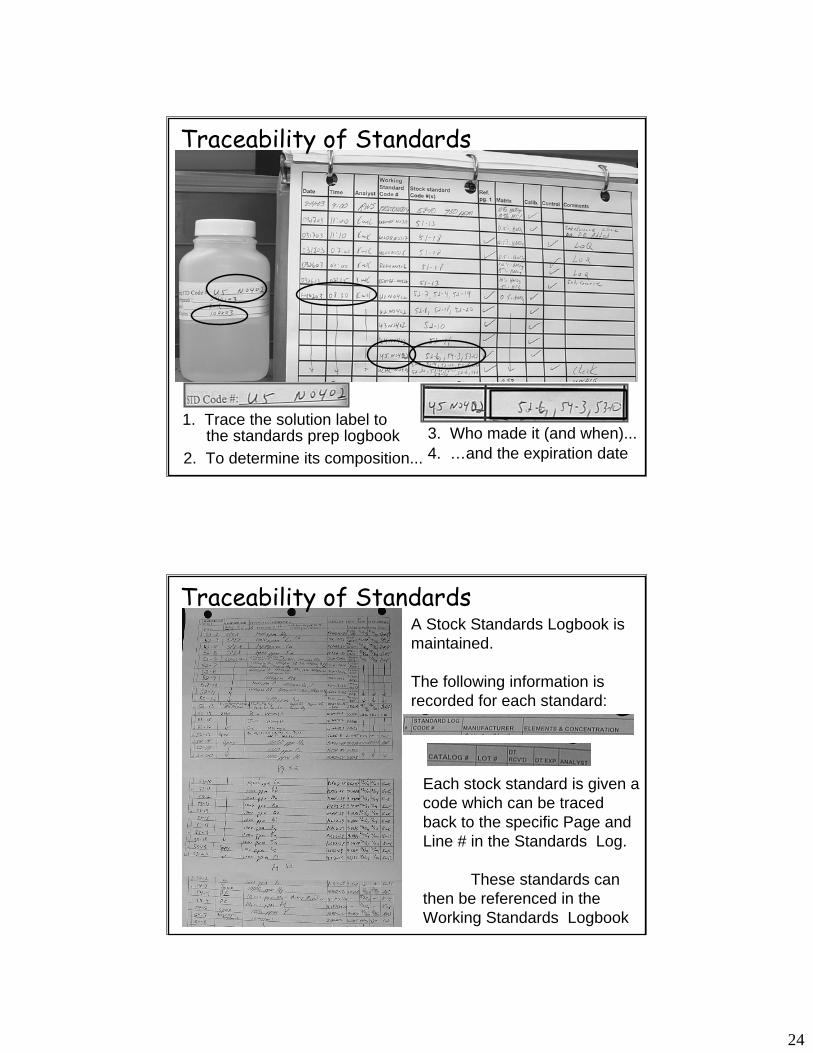
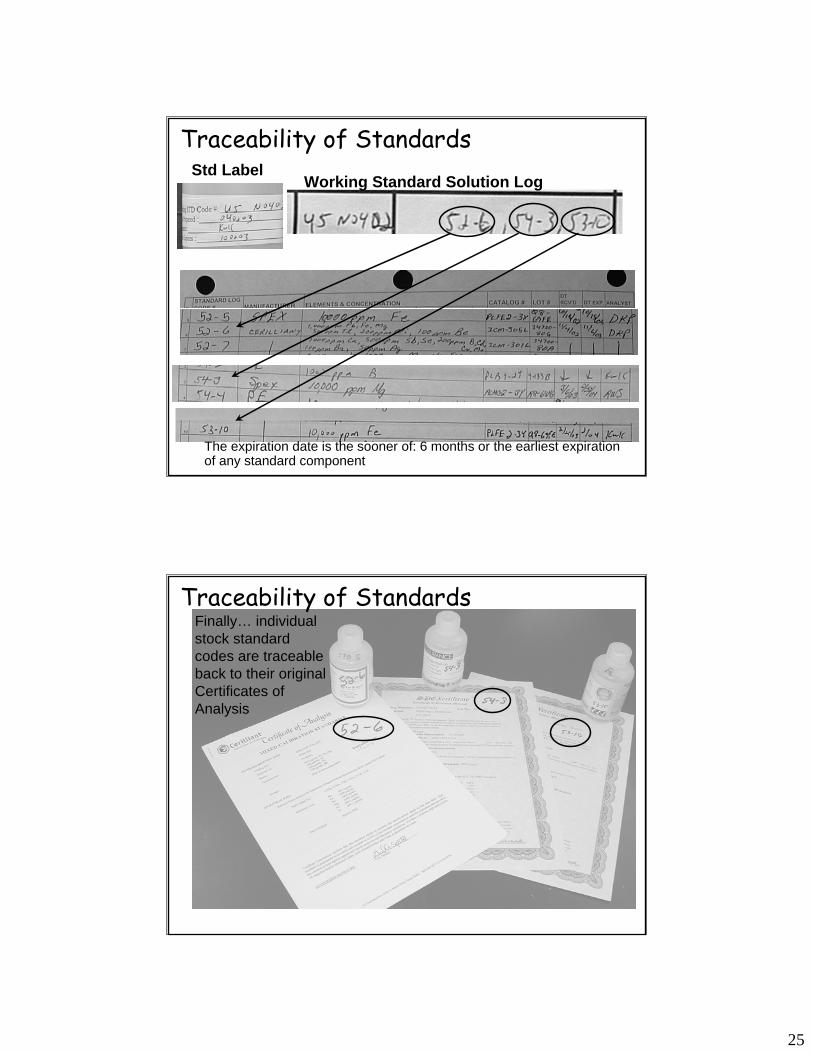
Traceability of Standards
1. Trace the solution label to the standards prep logbook
2. To determine its composition...3. Who made it (and when)...4. …and the expiration date
Traceability of StandardsA Stock Standards Logbook is maintained.
The following information is recorded for each standard:
Each stock standard is given a code which can be traced back to the specific Page and Line # in the Standards Log.
These standards can then be referenced in the Working Standards Logbook
25
Traceability of Standards
The expiration date is the sooner of: 6 months or the earliest expiration of any standard component
Std LabelWorking Standard Solution Log
Traceability of StandardsFinally… individual stock standard codes are traceable back to their original Certificates of Analysis
26
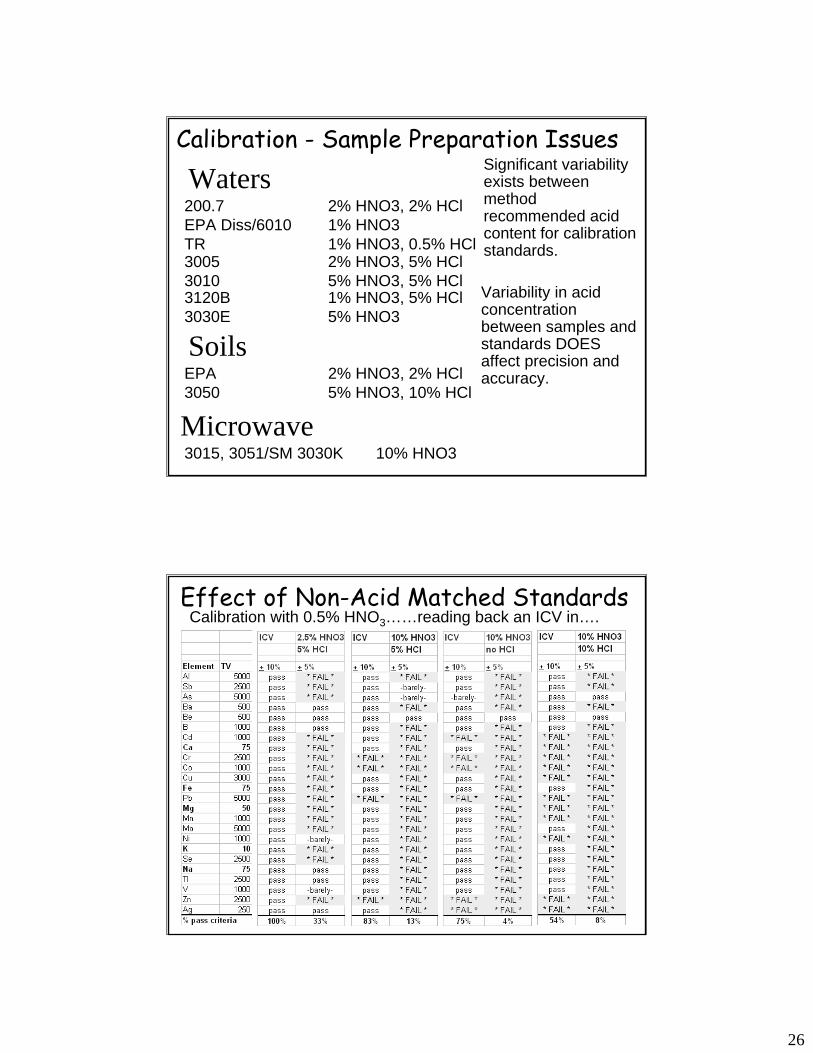
Waters
Soils
Microwave
200.7 2% HNO3, 2% HClEPA Diss/6010 1% HNO3TR 1% HNO3, 0.5% HCl
EPA 2% HNO3, 2% HCl3050 5% HNO3, 10% HCl
3015, 3051/SM 3030K 10% HNO3
3005 2% HNO3, 5% HCl3010 5% HNO3, 5% HCl3120B 1% HNO3, 5% HCl3030E 5% HNO3
Calibration - Sample Preparation IssuesSignificant variability exists between method recommended acid content for calibration standards.
Variability in acid concentration between samples and standards DOES affect precision and accuracy.
Calibration with 0.5% HNO3……reading back an ICV in….Effect of Non-Acid Matched Standards
27
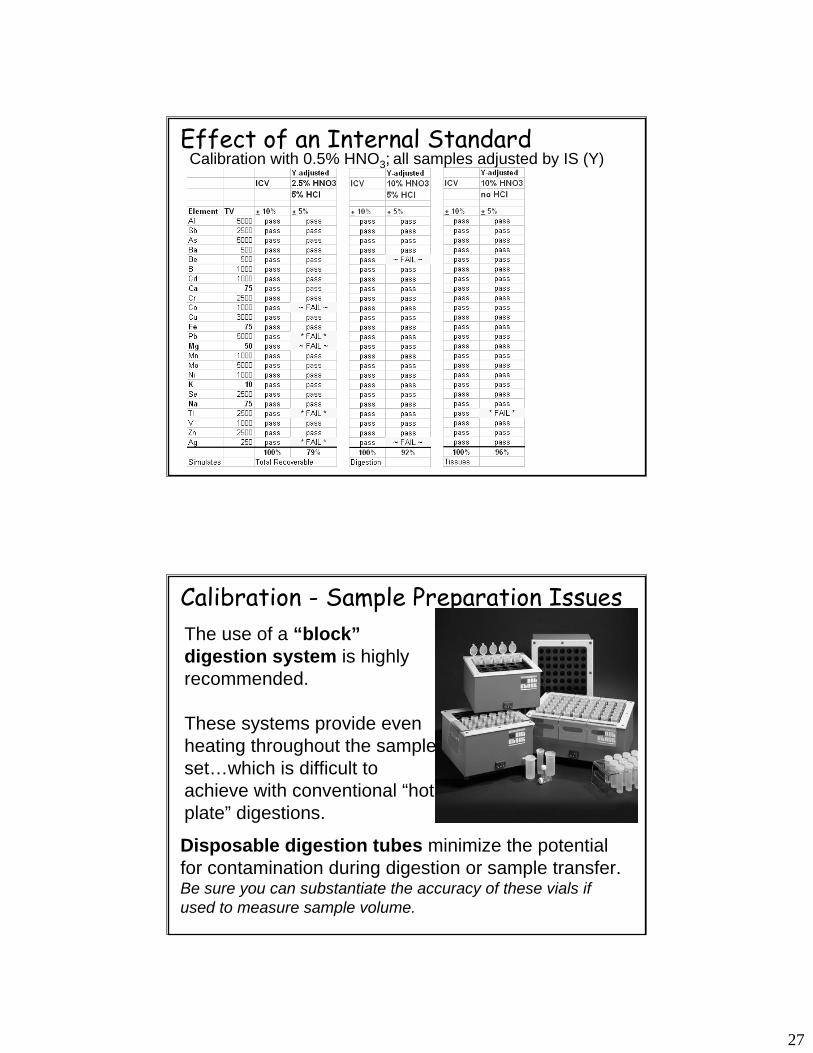
Effect of an Internal StandardCalibration with 0.5% HNO3; all samples adjusted by IS (Y)
Calibration - Sample Preparation IssuesThe use of a “block”digestion system is highly recommended.
These systems provide even heating throughout the sample set…which is difficult to achieve with conventional “hot plate” digestions.
Disposable digestion tubes minimize the potential for contamination during digestion or sample transfer.Be sure you can substantiate the accuracy of these vials if used to measure sample volume.
28
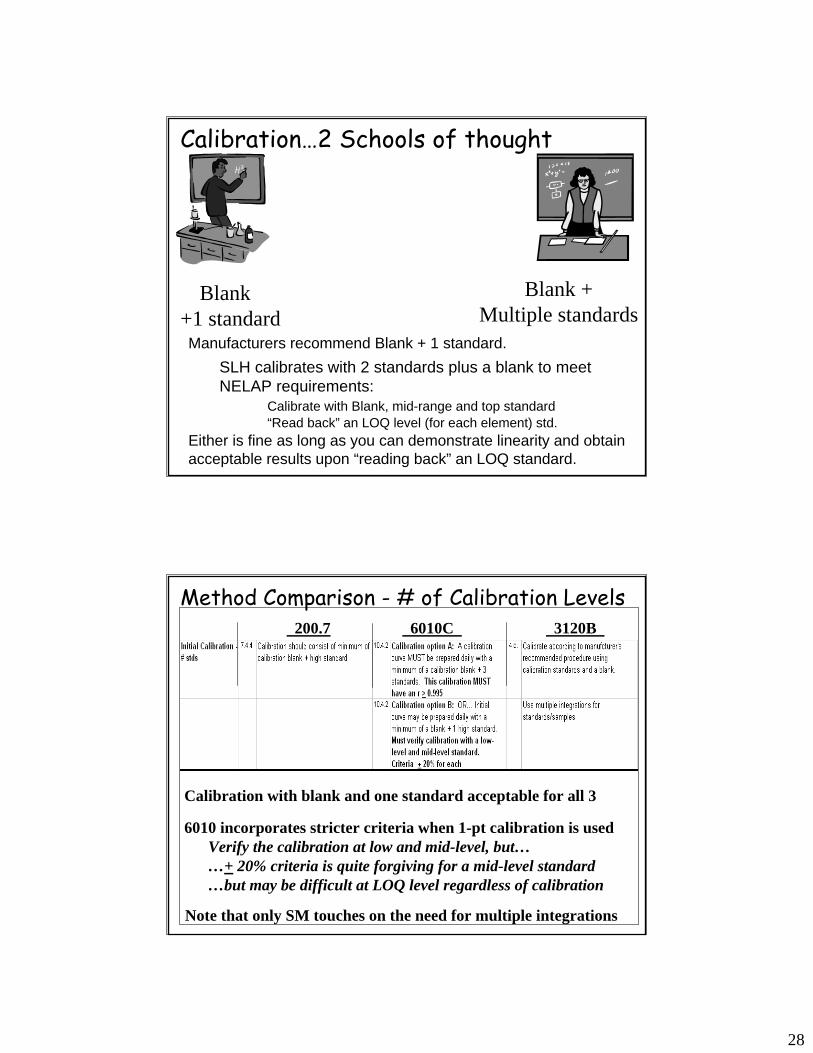
Calibration…2 Schools of thought
SLH calibrates with 2 standards plus a blank to meet NELAP requirements:
Calibrate with Blank, mid-range and top standard“Read back” an LOQ level (for each element) std.
Blank +1 standard
Blank +Multiple standards
Manufacturers recommend Blank + 1 standard.
Either is fine as long as you can demonstrate linearity and obtain acceptable results upon “reading back” an LOQ standard.
Calibration with blank and one standard acceptable for all 3
6010 incorporates stricter criteria when 1-pt calibration is usedVerify the calibration at low and mid-level, but……+ 20% criteria is quite forgiving for a mid-level standard…but may be difficult at LOQ level regardless of calibration
Note that only SM touches on the need for multiple integrations
Method Comparison - # of Calibration Levels200.7 6010C 3120B
29
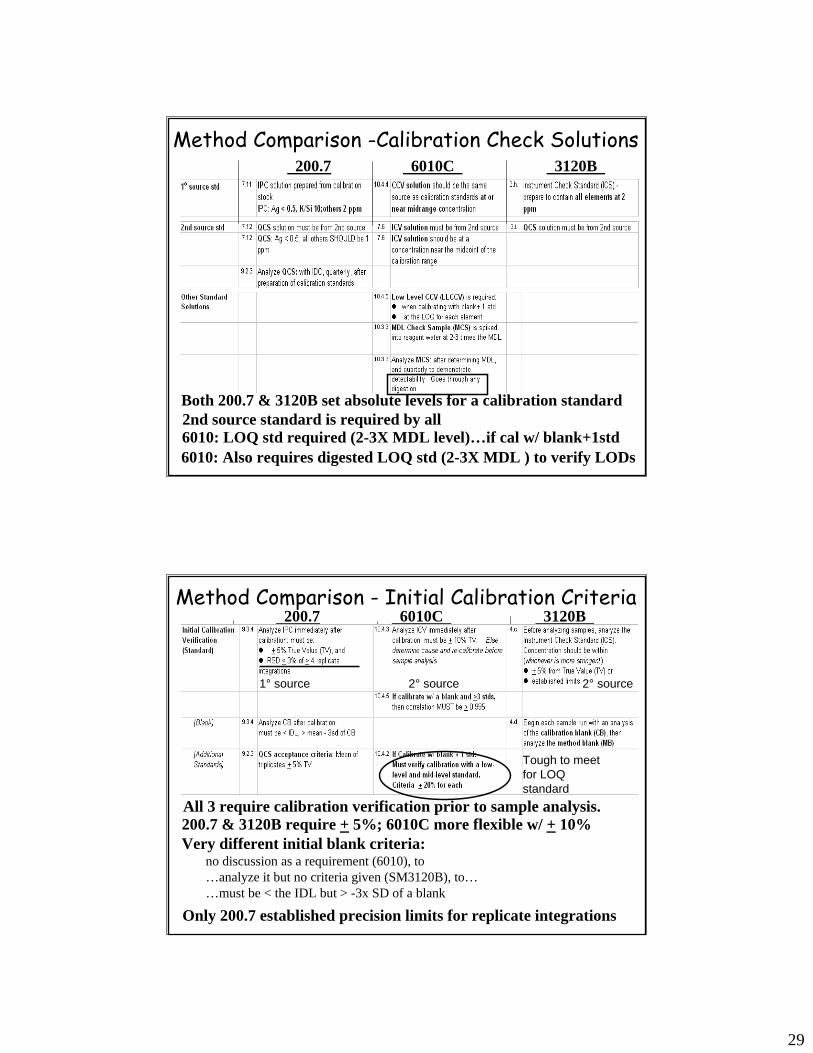
Both 200.7 & 3120B set absolute levels for a calibration standard2nd source standard is required by all6010: LOQ std required (2-3X MDL level)…if cal w/ blank+1std
Method Comparison -Calibration Check Solutions200.7 6010C 3120B
6010: Also requires digested LOQ std (2-3X MDL ) to verify LODs
All 3 require calibration verification prior to sample analysis.200.7 & 3120B require + 5%; 6010C more flexible w/ + 10%
Only 200.7 established precision limits for replicate integrations
Very different initial blank criteria: no discussion as a requirement (6010), to…analyze it but no criteria given (SM3120B), to……must be < the IDL but > -3x SD of a blank
Method Comparison - Initial Calibration Criteria200.7 6010C 3120B
Tough to meet for LOQ standard
1° source 2° source 2° source
30
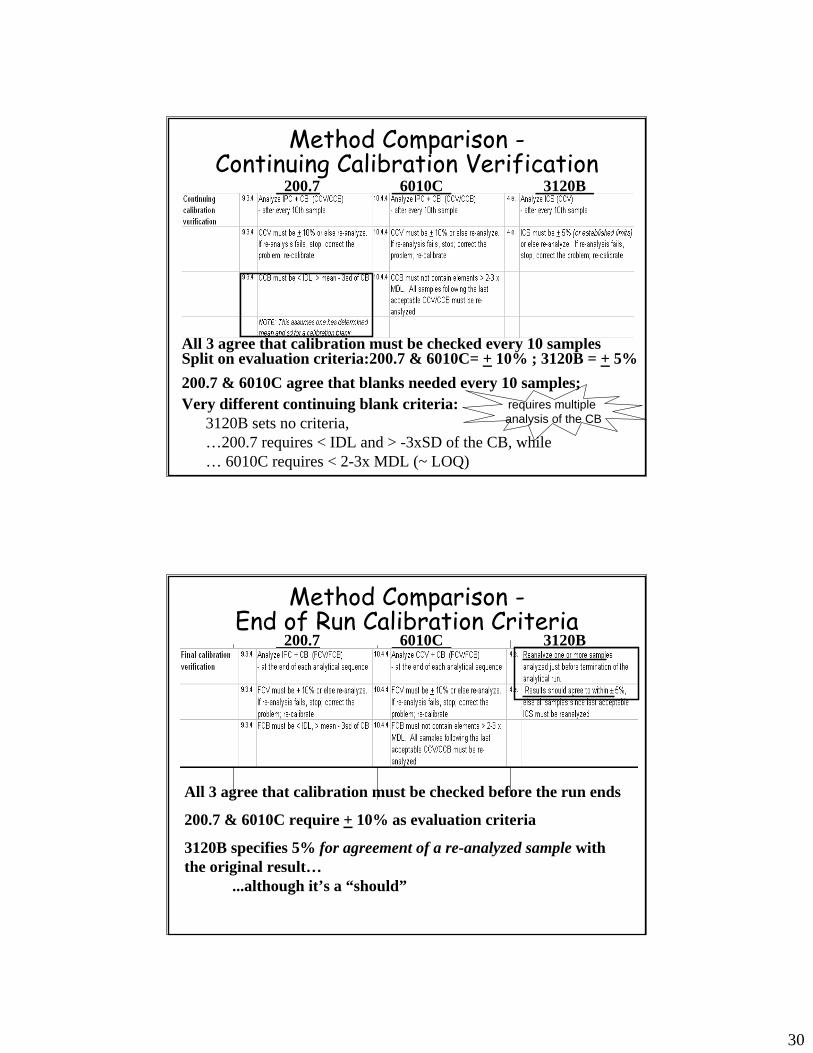
All 3 agree that calibration must be checked every 10 samplesSplit on evaluation criteria:200.7 & 6010C= + 10% ; 3120B = + 5%
Very different continuing blank criteria: 3120B sets no criteria,…200.7 requires < IDL and > -3xSD of the CB, while… 6010C requires < 2-3x MDL (~ LOQ)
200.7 & 6010C agree that blanks needed every 10 samples;requires multiple analysis of the CB
Method Comparison -Continuing Calibration Verification
200.7 6010C 3120B
200.7 6010C 3120B
All 3 agree that calibration must be checked before the run ends
200.7 & 6010C require + 10% as evaluation criteria
3120B specifies 5% for agreement of a re-analyzed sample with the original result…
...although it’s a “should”
Method Comparison -End of Run Calibration Criteria
31
BGC
LDR
LOD
IEC
?
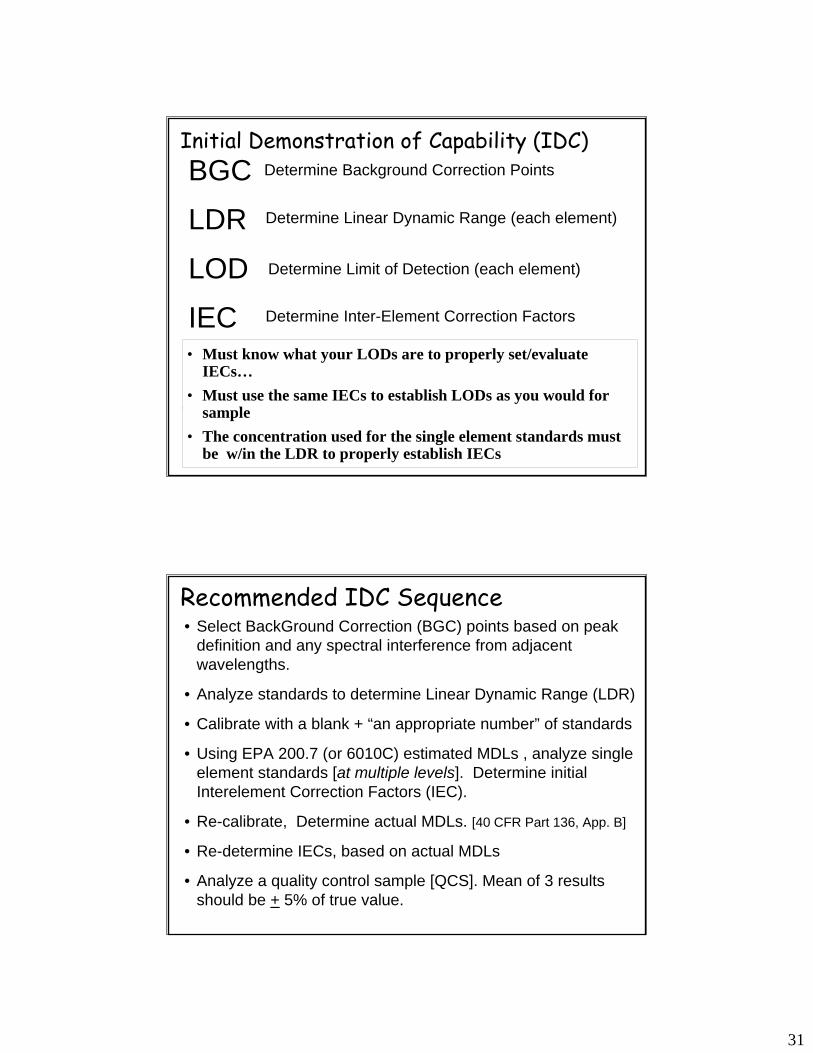
Which do you do first?????• Must know what your LODs are to properly set/evaluate IECs…
• Must use the same IECs to establish LODs as you would for sample
• The concentration used for the single element standards must be w/in the LDR to properly establish IECs
Initial Demonstration of Capability (IDC)
Determine Limit of Detection (each element)
Determine Background Correction Points
Determine Linear Dynamic Range (each element)
Determine Inter-Element Correction Factors
Recommended IDC Sequence• Select BackGround Correction (BGC) points based on peak
definition and any spectral interference from adjacent wavelengths.
• Analyze standards to determine Linear Dynamic Range (LDR)
• Calibrate with a blank + “an appropriate number” of standards
• Using EPA 200.7 (or 6010C) estimated MDLs , analyze single element standards [at multiple levels]. Determine initial Interelement Correction Factors (IEC).
• Re-calibrate, Determine actual MDLs. [40 CFR Part 136, App. B]
• Re-determine IECs, based on actual MDLs
• Analyze a quality control sample [QCS]. Mean of 3 results should be + 5% of true value.
32
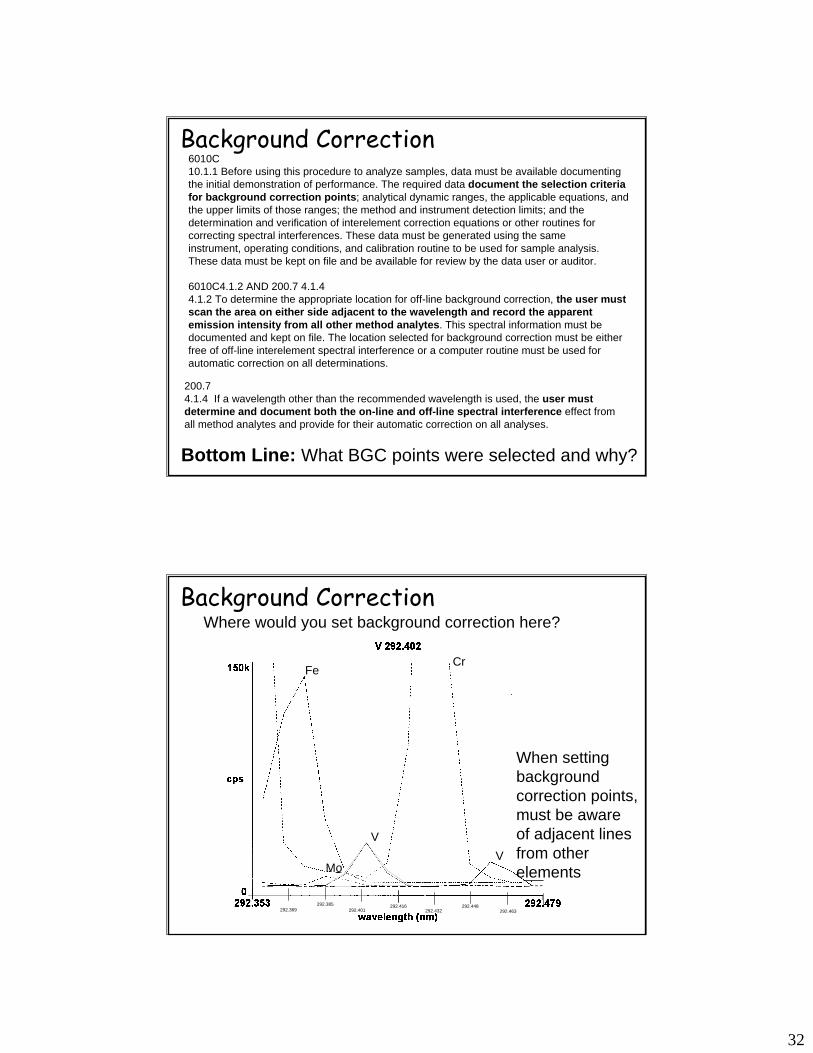
6010C10.1.1 Before using this procedure to analyze samples, data must be available documenting the initial demonstration of performance. The required data document the selection criteria for background correction points; analytical dynamic ranges, the applicable equations, and the upper limits of those ranges; the method and instrument detection limits; and the determination and verification of interelement correction equations or other routines for correcting spectral interferences. These data must be generated using the sameinstrument, operating conditions, and calibration routine to be used for sample analysis. These data must be kept on file and be available for review by the data user or auditor.
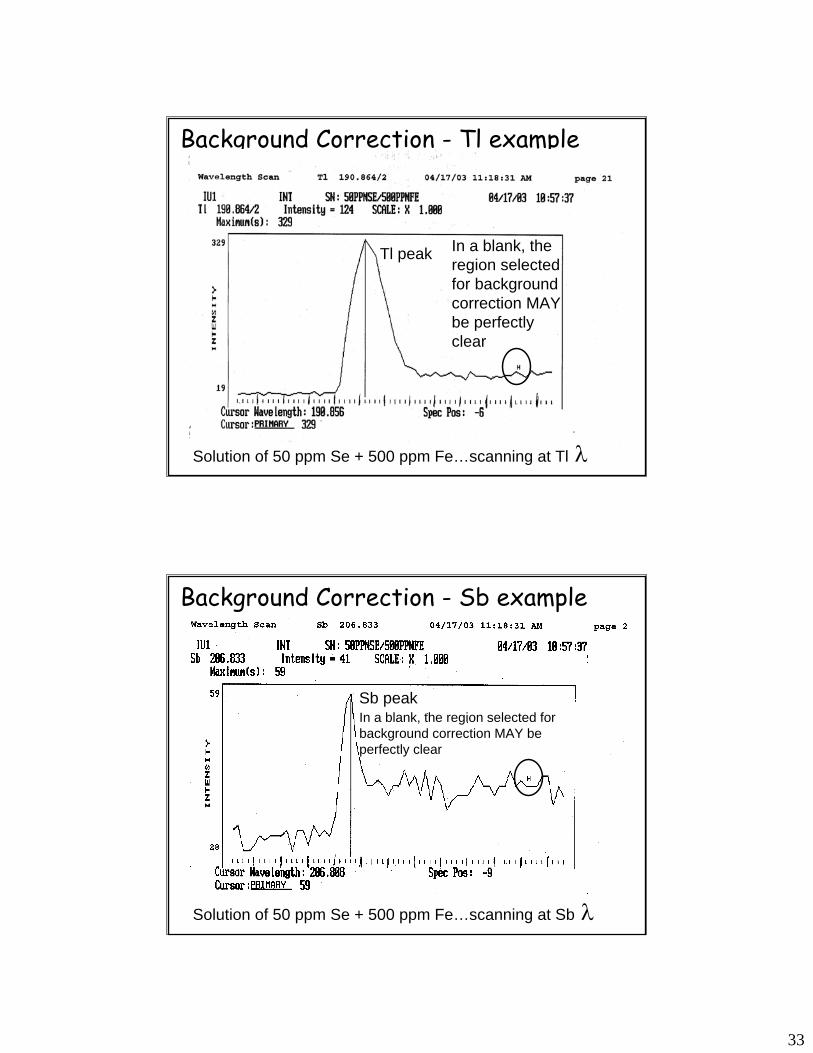
6010C4.1.2 AND 200.7 4.1.44.1.2 To determine the appropriate location for off-line background correction, the user must scan the area on either side adjacent to the wavelength and record the apparent emission intensity from all other method analytes. This spectral information must be documented and kept on file. The location selected for background correction must be either free of off-line interelement spectral interference or a computer routine must be used for automatic correction on all determinations.
200.74.1.4 If a wavelength other than the recommended wavelength is used, the user must determine and document both the on-line and off-line spectral interference effect from all method analytes and provide for their automatic correction on all analyses.
Background Correction
Bottom Line: What BGC points were selected and why?
V
292.416292.385292.369 292.401
292.448292.432 292.463
VVV
FeCr
Mo
292.416292.385292.369 292.401
292.448292.432 292.463
Background CorrectionWhere would you set background correction here?
When setting background correction points, must be aware of adjacent lines from other elements
33
Background Correction - Tl example
Tl peak
Solution of 50 ppm Se + 500 ppm Fe…scanning at Tl λ
In a blank, the region selected for background correction MAY be perfectly clear
Sb peak
Background Correction - Sb example
Solution of 50 ppm Se + 500 ppm Fe…scanning at Sb λ
In a blank, the region selected for background correction MAY be perfectly clear
34
Be313.042
Al308.215
500 ppm Al
Be313.042
Al308.215
250 ppm Al
Be313.042
Al308.215
100 ppm Al
Be313.042
Al308.215
50 ppm Al
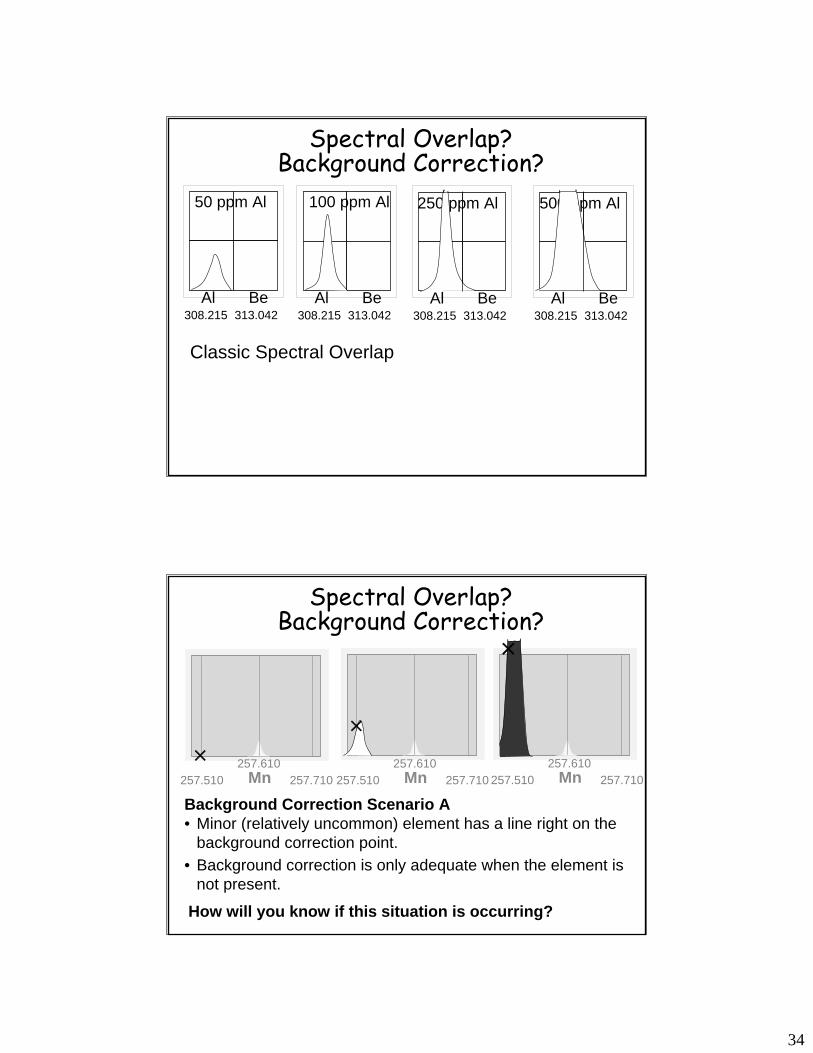
Spectral Overlap? Background Correction?
Classic Spectral Overlap
Spectral Overlap? Background Correction?
257.610Mn257.510 257.710
×257.610
Mn257.510 257.710
× 257.610Mn257.510 257.710
×
Background Correction Scenario A• Minor (relatively uncommon) element has a line right on the
background correction point.
How will you know if this situation is occurring?
• Background correction is only adequate when the element is not present.
35
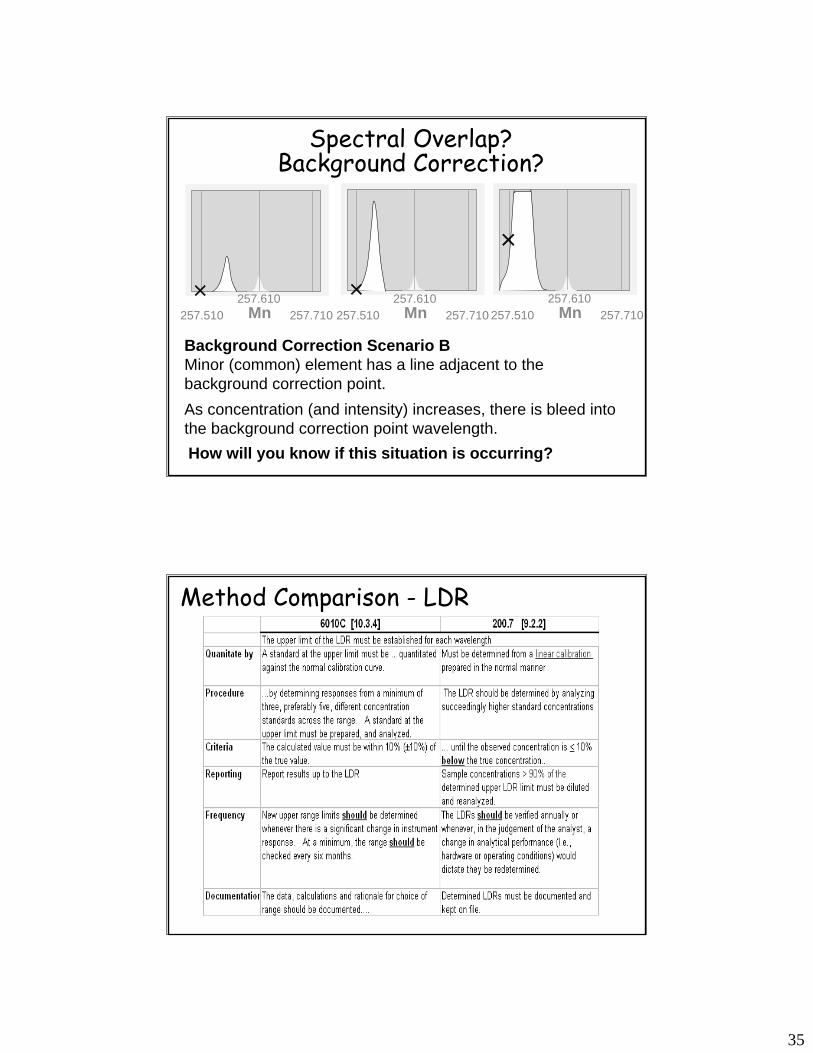
Spectral Overlap? Background Correction?
257.610Mn257.510 257.710
× 257.610Mn257.510 257.710
×
257.610Mn257.510 257.710
×
Background Correction Scenario BMinor (common) element has a line adjacent to the background correction point.
How will you know if this situation is occurring?
As concentration (and intensity) increases, there is bleed into the background correction point wavelength.
Method Comparison - LDR
36
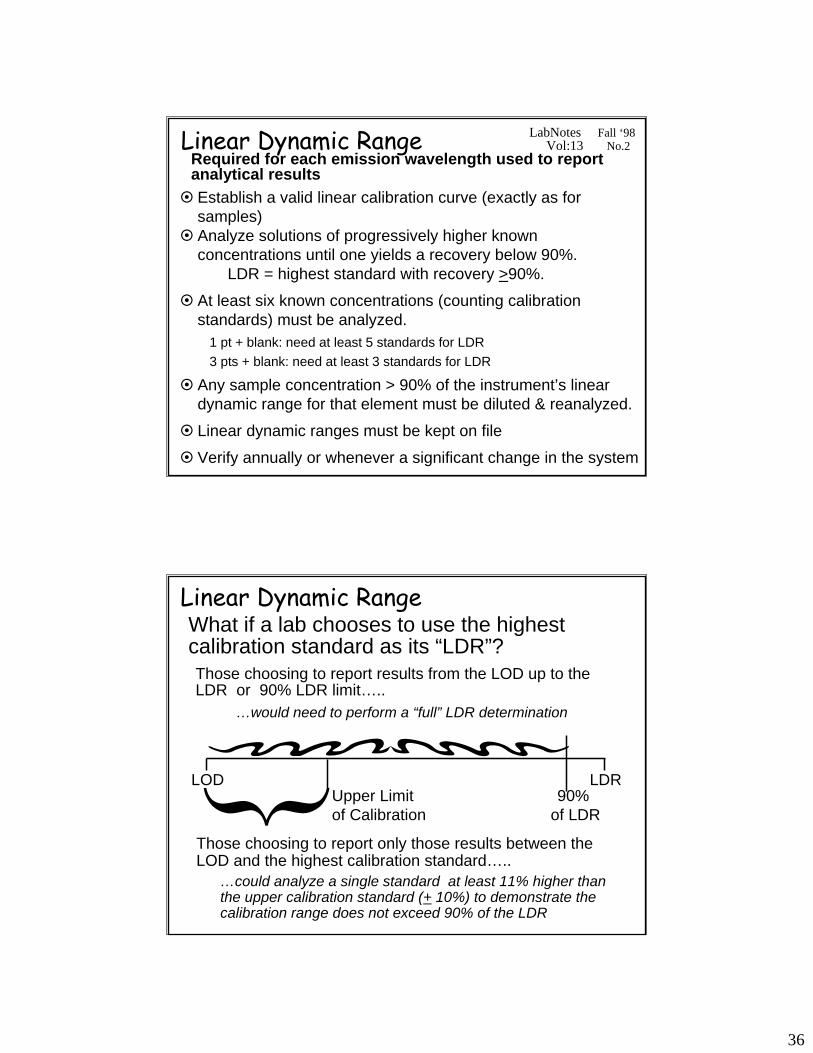
Establish a valid linear calibration curve (exactly as for samples)Analyze solutions of progressively higher known concentrations until one yields a recovery below 90%.
LDR = highest standard with recovery >90%.
At least six known concentrations (counting calibration standards) must be analyzed.
1 pt + blank: need at least 5 standards for LDR3 pts + blank: need at least 3 standards for LDR
Any sample concentration > 90% of the instrument’s linear dynamic range for that element must be diluted & reanalyzed.
Linear dynamic ranges must be kept on file
Verify annually or whenever a significant change in the system
Linear Dynamic Range LabNotes Fall ‘98Vol:13 No.2
Required for each emission wavelength used to report analytical results
Linear Dynamic RangeWhat if a lab chooses to use the highest calibration standard as its “LDR”?
{
Those choosing to report results from the LOD up to the LDR or 90% LDR limit…..
Those choosing to report only those results between the LOD and the highest calibration standard…..
…would need to perform a “full” LDR determination
…could analyze a single standard at least 11% higher than the upper calibration standard (+ 10%) to demonstrate the calibration range does not exceed 90% of the LDR
LOD LDRUpper Limit of Calibration
90% of LDR
37
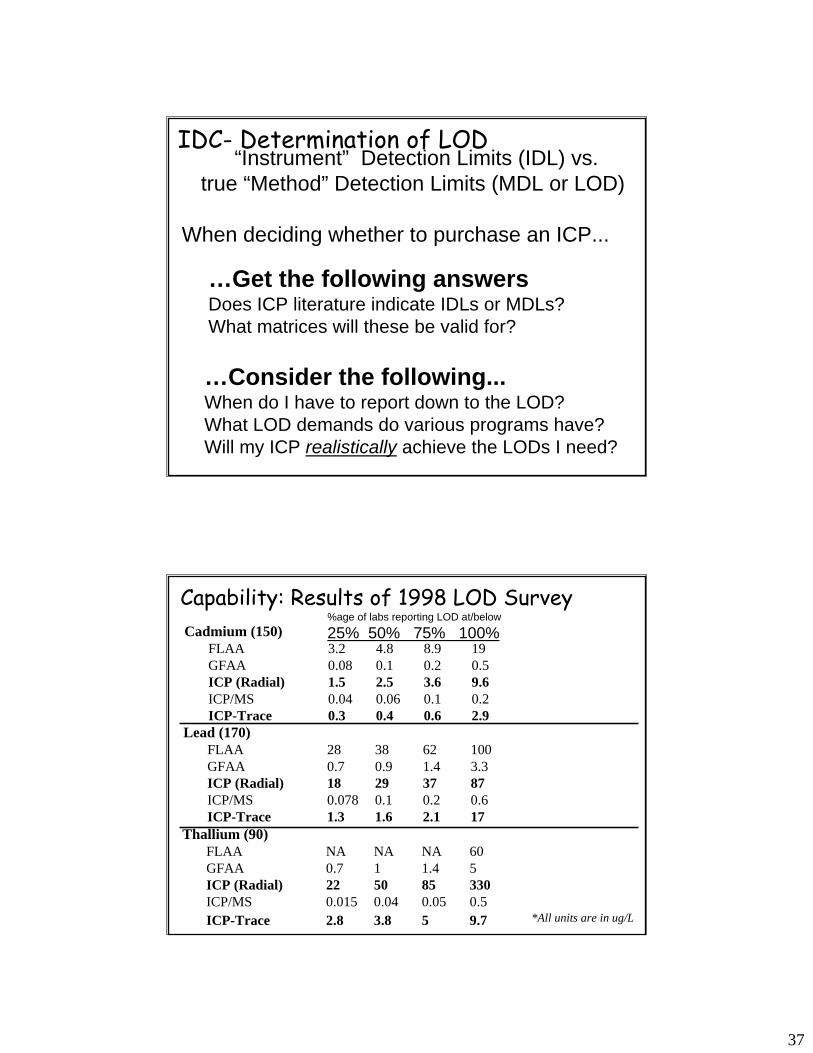
“Instrument” Detection Limits (IDL) vs. true “Method” Detection Limits (MDL or LOD)
When deciding whether to purchase an ICP...
…Get the following answersDoes ICP literature indicate IDLs or MDLs?What matrices will these be valid for?
IDC- Determination of LOD
…Consider the following...When do I have to report down to the LOD?What LOD demands do various programs have?Will my ICP realistically achieve the LODs I need?
Cadmium (150)FLAA 3.2 4.8 8.9 19GFAA 0.08 0.1 0.2 0.5ICP (Radial) 1.5 2.5 3.6 9.6ICP/MS 0.04 0.06 0.1 0.2ICP-Trace 0.3 0.4 0.6 2.9
Lead (170)FLAA 28 38 62 100GFAA 0.7 0.9 1.4 3.3ICP (Radial) 18 29 37 87ICP/MS 0.078 0.1 0.2 0.6ICP-Trace 1.3 1.6 2.1 17
Thallium (90)FLAA NA NA NA 60GFAA 0.7 1 1.4 5ICP (Radial) 22 50 85 330ICP/MS 0.015 0.04 0.05 0.5ICP-Trace 2.8 3.8 5 9.7
Capability: Results of 1998 LOD Survey
*All units are in ug/L
%age of labs reporting LOD at/below
25% 50% 75% 100%
38
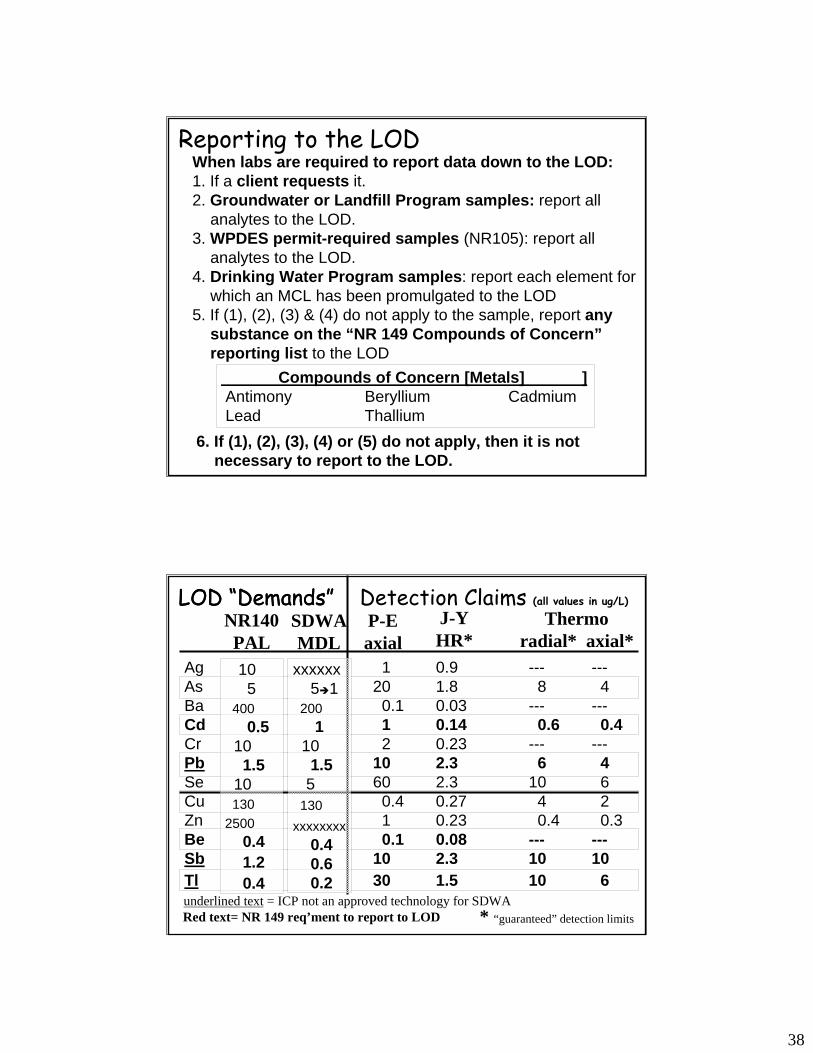
When labs are required to report data down to the LOD:1. If a client requests it.2. Groundwater or Landfill Program samples: report all
analytes to the LOD.3. WPDES permit-required samples (NR105): report all
analytes to the LOD.4. Drinking Water Program samples: report each element for
which an MCL has been promulgated to the LOD5. If (1), (2), (3) & (4) do not apply to the sample, report any
substance on the “NR 149 Compounds of Concern”reporting list to the LOD
Compounds of Concern [Metals] ]Antimony Beryllium CadmiumLead Thallium
Reporting to the LOD
6. If (1), (2), (3), (4) or (5) do not apply, then it is not necessary to report to the LOD.
Ag 1 0.9 --- ---As 20 1.8 8 4Ba 0.1 0.03 --- ---Cd 1 0.14 0.6 0.4Cr 2 0.23 --- ---Pb 10 2.3 6 4Se 60 2.3 10 6Cu 0.4 0.27 4 2Zn 1 0.23 0.4 0.3Be 0.1 0.08 --- ---Sb 10 2.3 10 10Tl 30 1.5 10 6
P-Eaxial
J-YHR*
Thermoradial* axial*
* “guaranteed” detection limits
LOD “Demands” Detection Claims (all values in ug/L)
Red text= NR 149 req’ment to report to LODunderlined text = ICP not an approved technology for SDWA
10 5
4000.5
10 1.5
10 130
25000.41.2 0.4
NR140PAL
xxxxxx5 1
2001
10 1.55
130 xxxxxxxx
0.40.6 0.2
SDWAMDL
LOD “Demands”
39
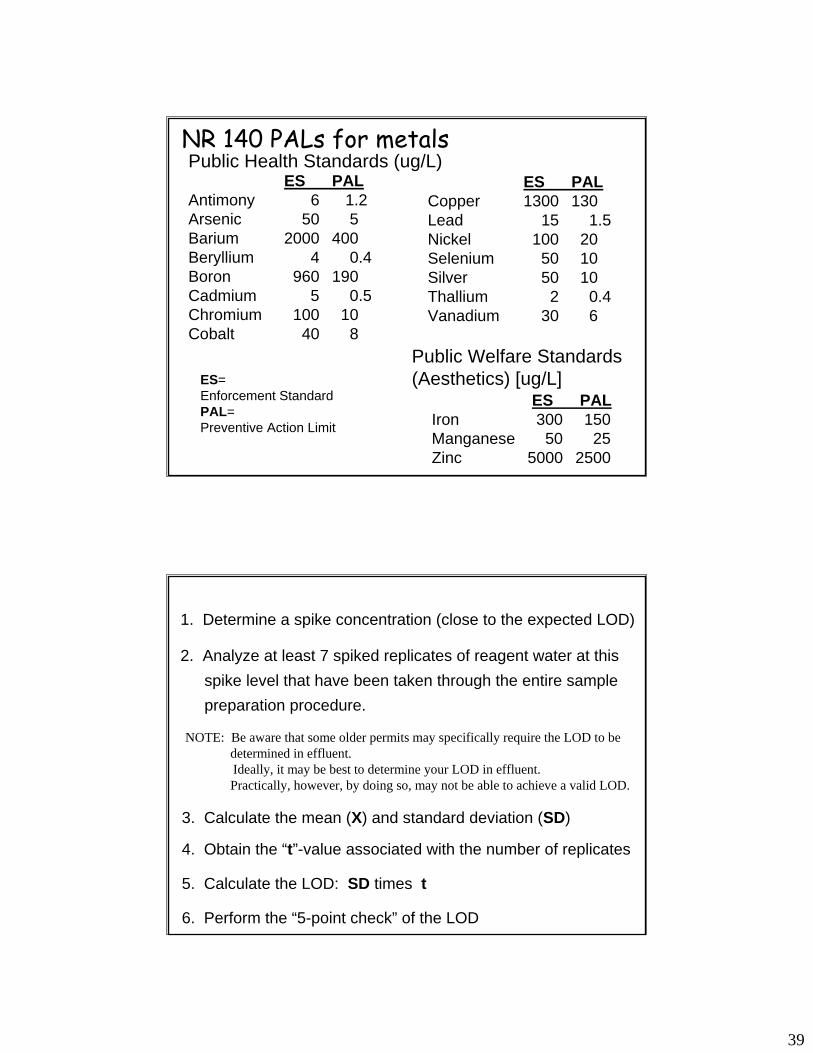
ES PALAntimony 6 1.2Arsenic 50 5Barium 2000 400Beryllium 4 0.4Boron 960 190Cadmium 5 0.5Chromium 100 10Cobalt 40 8
NR 140 PALs for metalsES PAL
Copper 1300 130Lead 15 1.5Nickel 100 20Selenium 50 10Silver 50 10Thallium 2 0.4Vanadium 30 6
ES PALIron 300 150Manganese 50 25Zinc 5000 2500
Public Welfare Standards (Aesthetics) [ug/L]
Public Health Standards (ug/L)
ES=Enforcement StandardPAL=Preventive Action Limit
1. Determine a spike concentration (close to the expected LOD)
2. Analyze at least 7 spiked replicates of reagent water at this spike level that have been taken through the entire sample preparation procedure.
The EPA procedure for determining LOD
3. Calculate the mean (X) and standard deviation (SD)
4. Obtain the “t”-value associated with the number of replicates
5. Calculate the LOD: SD times t
6. Perform the “5-point check” of the LOD
NOTE: Be aware that some older permits may specifically require the LOD to be determined in effluent. Ideally, it may be best to determine your LOD in effluent.Practically, however, by doing so, may not be able to achieve a valid LOD.
40
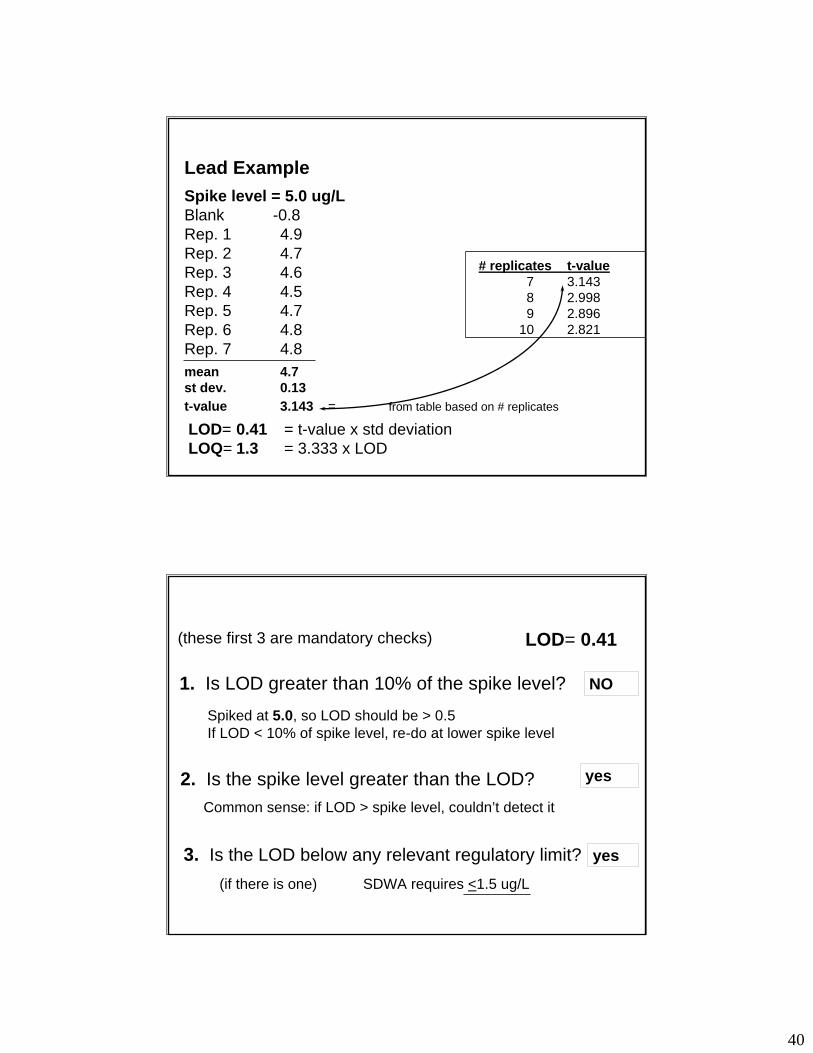
Lead ExampleSpike level = 5.0 ug/LBlank -0.8Rep. 1 4.9 Rep. 2 4.7 Rep. 3 4.6 Rep. 4 4.5 Rep. 5 4.7 Rep. 6 4.8 Rep. 7 4.8 mean 4.7 st dev. 0.13 t-value 3.143 = from table based on # replicates
# replicates t-value7 3.1438 2.998 9 2.896
10 2.821
LOD= 0.41 = t-value x std deviationLOQ= 1.3 = 3.333 x LOD
EPA’s LOD Procedure Example
(these first 3 are mandatory checks) LOD= 0.41
1. Is LOD greater than 10% of the spike level? NO
Spiked at 5.0, so LOD should be > 0.5If LOD < 10% of spike level, re-do at lower spike level
2. Is the spike level greater than the LOD? yes
Common sense: if LOD > spike level, couldn’t detect it
3. Is the LOD below any relevant regulatory limit? yes
(if there is one) SDWA requires <1.5 ug/L
LOD Evaluation: The 5-point check
41
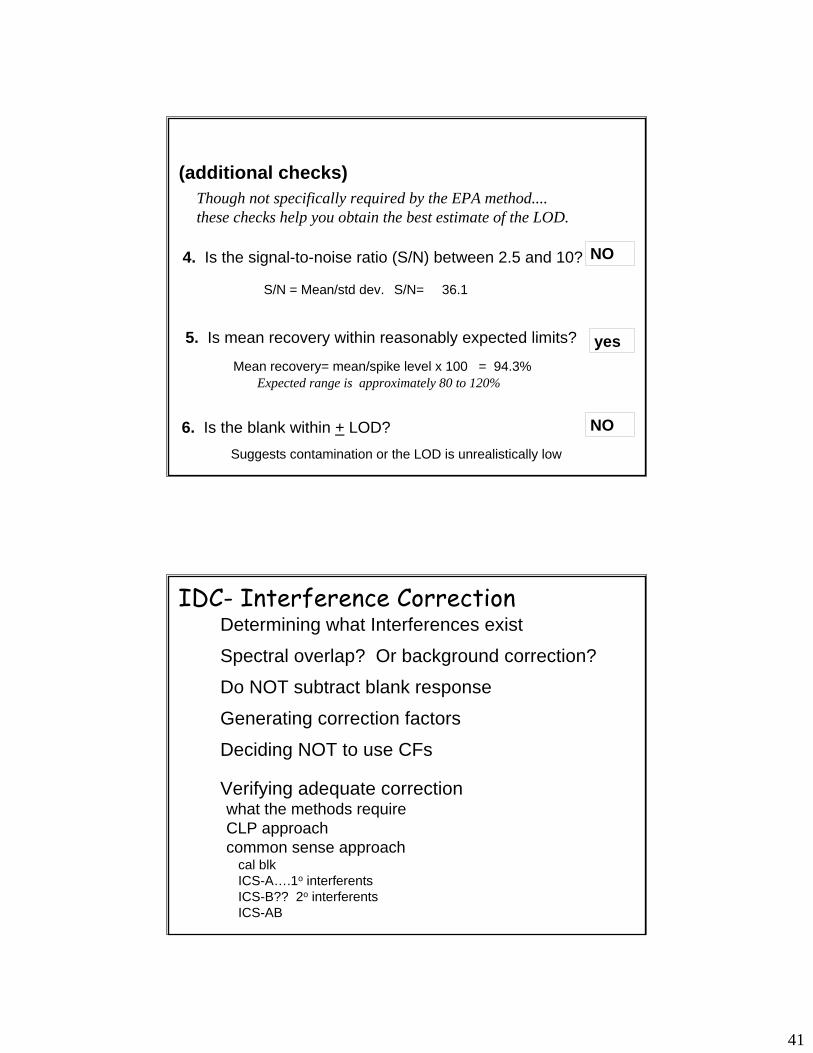
(additional checks)Though not specifically required by the EPA method....these checks help you obtain the best estimate of the LOD.
4. Is the signal-to-noise ratio (S/N) between 2.5 and 10? NO
S/N = Mean/std dev. S/N= 36.1
5. Is mean recovery within reasonably expected limits? yesMean recovery= mean/spike level x 100 = 94.3%
Expected range is approximately 80 to 120%
LOD Evaluation: The 5-point check
6. Is the blank within + LOD?Suggests contamination or the LOD is unrealistically low
NO
Determining what Interferences exist
Spectral overlap? Or background correction?
Do NOT subtract blank response
Generating correction factors
Deciding NOT to use CFs
Verifying adequate correctionwhat the methods requireCLP approachcommon sense approach
cal blkICS-A….1o interferentsICS-B?? 2o interferentsICS-AB
IDC- Interference Correction
42
2. Establishing IECs based on analysis of single-element solutions at a single concentrationA. assumes linear interference.
B. assumes that a lack of interference at the selected level means that there will not be an interference at higher concentrations.
3. Corrections made for interference due to an inappropriate background correction point may not provide adequate correction.
1. (older instruments) “Auto-correction” was based on measured concentration (rather than TRUE concentration) of the interferent. Is this acceptable?
Problems with Interelement Correction (IEC) Factors
4. Correction factors may not accurately represent synergistic effect of multiple interferents.
5. Interference correction MUST be “turned off” - for all elements-- before analyzing single element standards.
6. Corrections based on values very close to acceptable variation for a blank (LOD…vs. LOQ) may not be adequate.
7. Making corrections based on only ONE analysis may not be sufficient (doesn’t consider normal analyte “bounce”)
Problems with Interelement Correction (IEC) Factors
43
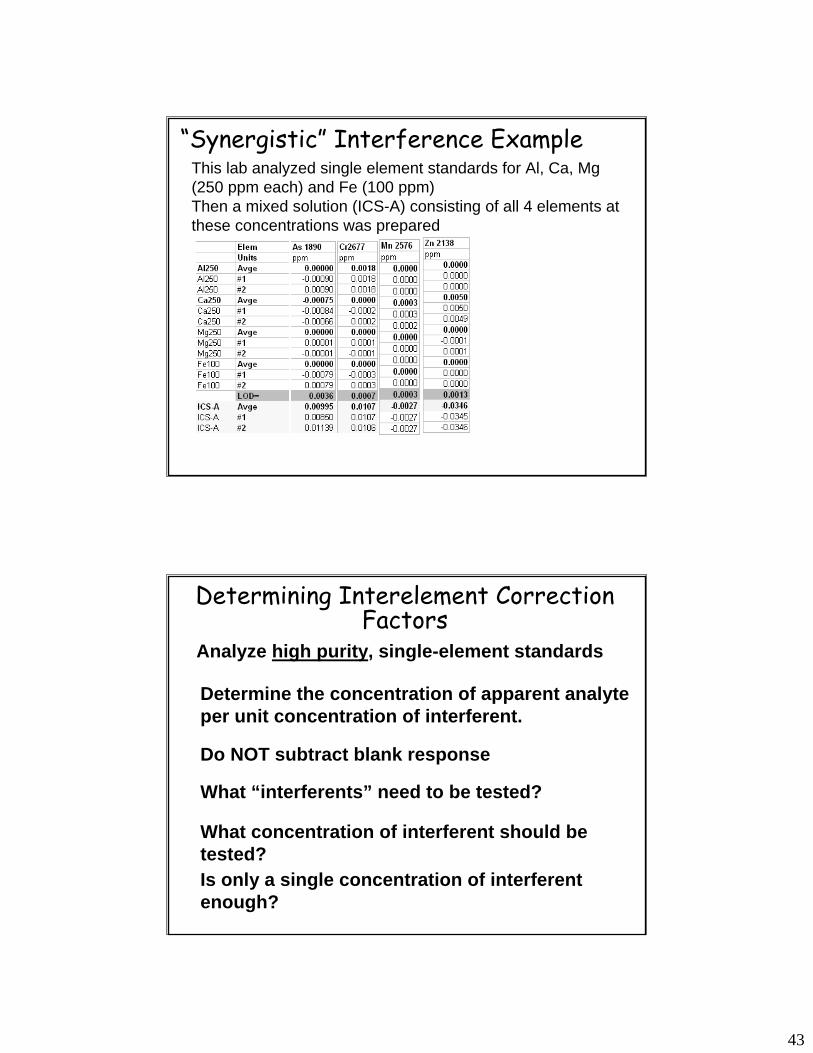
“Synergistic” Interference ExampleThis lab analyzed single element standards for Al, Ca, Mg (250 ppm each) and Fe (100 ppm)Then a mixed solution (ICS-A) consisting of all 4 elements at these concentrations was prepared
Determining Interelement Correction Factors
Analyze high purity, single-element standards
Determine the concentration of apparent analyte per unit concentration of interferent.
What concentration of interferent should be tested?Is only a single concentration of interferentenough?
What “interferents” need to be tested?
Do NOT subtract blank response
44
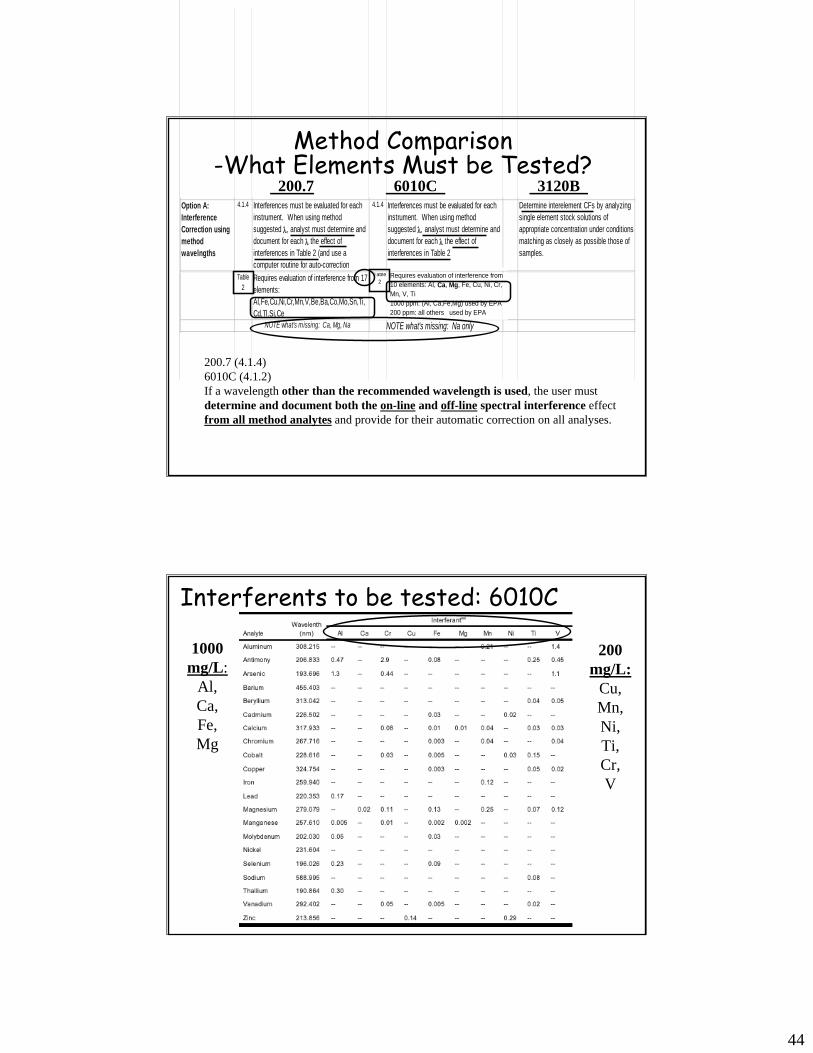
Option A: Interference Correction using method wavelngths
4.1.4 Interferences must be evaluated for each instrument. When using method suggested λ, analyst must determine and document for each λ the effect of interferences in Table 2 (and use a computer routine for auto-correction
4.1.4 Interferences must be evaluated for each instrument. When using method suggested λ, analyst must determine and document for each λ the effect of interferences in Table 2
Determine interelement CFs by analyzing single element stock solutions of appropriate concentration under conditions matching as closely as possible those of samples.
Table 2
Requires evaluation of interference from 17 elements: Al,Fe,Cu,Ni,Cr,Mn,V,Be,Ba,Co,Mo,Sn,Ti,Cd,Tl,Si,Ce NOTE what's missing: Ca, Mg, Na
Table 2
Requires evaluation of interference from 10 elements: Al, Ca, Mg, Fe, Cu, Ni, Cr, Mn, V, Ti 1000 ppm: (Al, Ca,Fe,Mg) used by EPA 200 ppm: all others used by EPA
NOTE what's missing: Na only
Method Comparison -What Elements Must be Tested?
Option A: Interference Correction using method wavelngths
4.1.4 Interferences must be evaluated for each instrument. When using method suggested λ, analyst must determine and document for each λ the effect of interferences in Table 2 (and use a computer routine for auto-correction
4.1.4 Interferences must be evaluated for each instrument. When using method suggested λ, analyst must determine and document for each λ the effect of interferences in Table 2
Determine interelement CFs by analyzing single element stock solutions of appropriate concentration under conditions matching as closely as possible those of samples.
200.7 (4.1.4)6010C (4.1.2)If a wavelength other than the recommended wavelength is used, the user must determine and document both the on-line and off-line spectral interference effect from all method analytes and provide for their automatic correction on all analyses.
200.7 6010C 3120B
1000 mg/L:
Al, Ca, Fe, Mg
200 mg/L:
Cu, Mn, Ni, Ti, Cr, V
Interferents to be tested: 6010C
45
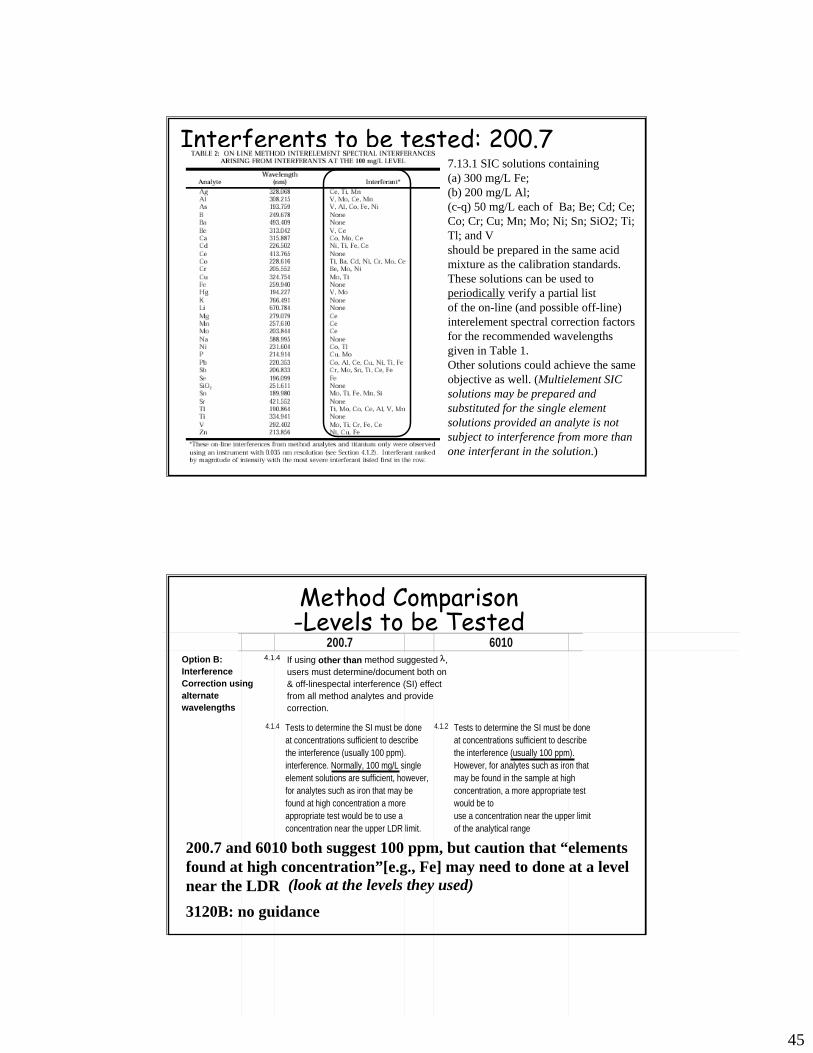
Interferents to be tested: 200.77.13.1 SIC solutions containing(a) 300 mg/L Fe; (b) 200 mg/L Al; (c-q) 50 mg/L each of Ba; Be; Cd; Ce; Co; Cr; Cu; Mn; Mo; Ni; Sn; SiO2; Ti; Tl; and Vshould be prepared in the same acid mixture as the calibration standards.These solutions can be used to periodically verify a partial listof the on-line (and possible off-line) interelement spectral correction factors for the recommended wavelengths given in Table 1. Other solutions could achieve the same objective as well. (Multielement SIC solutions may be prepared and substituted for the single element solutions provided an analyte is not subject to interference from more than one interferant in the solution.)
Option B: Interference Correction using alternate wavelengths
4.1.4 If using other than method suggested λ, users must determine/document both on & off-linespectal interference (SI) effect from all method analytes and provide correction.
200.7 and 6010 both suggest 100 ppm, but caution that “elements found at high concentration”[e.g., Fe] may need to done at a level near the LDR3120B: no guidance
Method Comparison -Levels to be Tested
4.1.4 Tests to determine the SI must be done at concentrations sufficient to describe the interference (usually 100 ppm). interference. Normally, 100 mg/L single element solutions are sufficient, however, for analytes such as iron that may be found at high concentration a more appropriate test would be to use a concentration near the upper LDR limit.
4.1.2 Tests to determine the SI must be done at concentrations sufficient to describe the interference (usually 100 ppm). However, for analytes such as iron that may be found in the sample at high concentration, a more appropriate test would be touse a concentration near the upper limit of the analytical range
200.7 6010
(look at the levels they used)
46
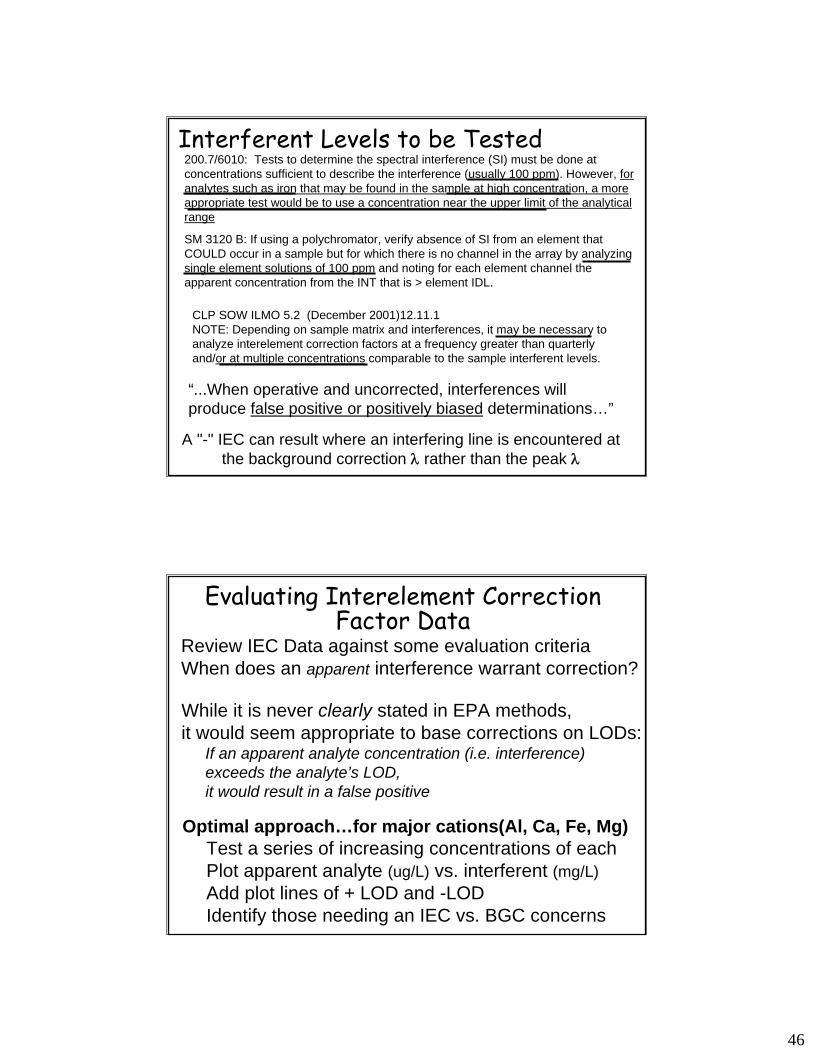
SM 3120 B: If using a polychromator, verify absence of SI from an element that COULD occur in a sample but for which there is no channel in the array by analyzing single element solutions of 100 ppm and noting for each element channel the apparent concentration from the INT that is > element IDL.
200.7/6010: Tests to determine the spectral interference (SI) must be done at concentrations sufficient to describe the interference (usually 100 ppm). However, for analytes such as iron that may be found in the sample at high concentration, a more appropriate test would be to use a concentration near the upper limit of the analytical range
“...When operative and uncorrected, interferences willproduce false positive or positively biased determinations…”
CLP SOW ILMO 5.2 (December 2001)12.11.1NOTE: Depending on sample matrix and interferences, it may be necessary to analyze interelement correction factors at a frequency greater than quarterly and/or at multiple concentrations comparable to the sample interferent levels.
Interferent Levels to be Tested
A "-" IEC can result where an interfering line is encountered at the background correction λ rather than the peak λ
Evaluating Interelement Correction Factor Data
Review IEC Data against some evaluation criteriaWhen does an apparent interference warrant correction?
While it is never clearly stated in EPA methods,it would seem appropriate to base corrections on LODs:
If an apparent analyte concentration (i.e. interference)exceeds the analyte’s LOD, it would result in a false positive
Optimal approach…for major cations(Al, Ca, Fe, Mg)Test a series of increasing concentrations of eachPlot apparent analyte (ug/L) vs. interferent (mg/L)Add plot lines of + LOD and -LODIdentify those needing an IEC vs. BGC concerns
47
App
aren
t Ana
lyte
ug/
L
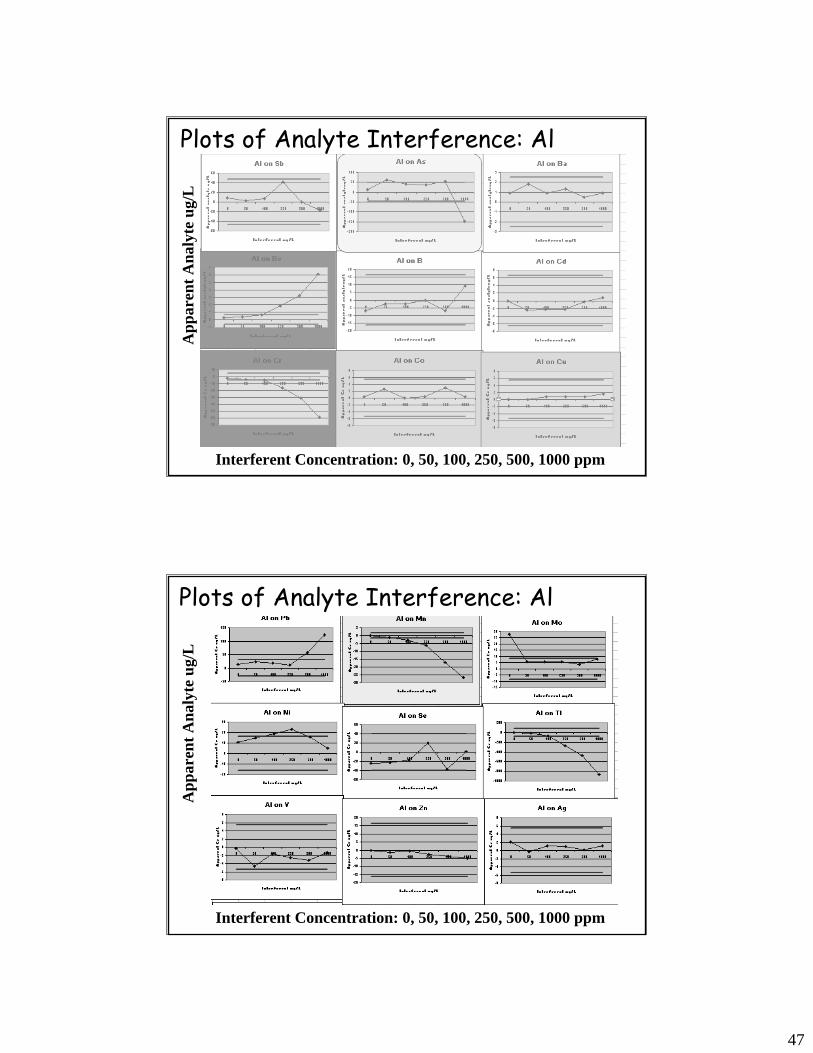
Interferent Concentration: 0, 50, 100, 250, 500, 1000 ppm
Plots of Analyte Interference: Al
App
aren
t Ana
lyte
ug/
L
Interferent Concentration: 0, 50, 100, 250, 500, 1000 ppm
Plots of Analyte Interference: Al
48
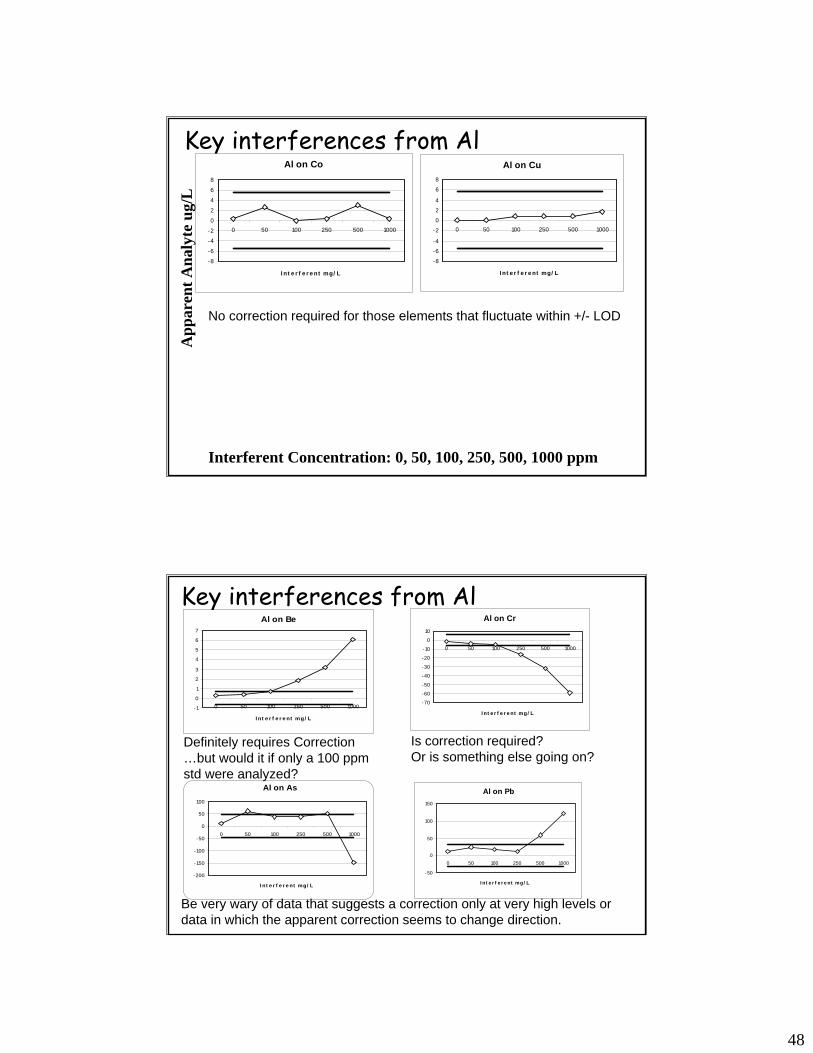
Key interferences from AlAl on Co
-8
-6
-4
-2
0
2
4
6
8
0 50 100 250 500 1000
I nt e r f e r e nt mg/ L
App
aren
t Ana
lyte
ug/
L
Interferent Concentration: 0, 50, 100, 250, 500, 1000 ppm
No correction required for those elements that fluctuate within +/- LOD
Al on Cu
-8
-6
-4
-2
0
2
4
6
8
0 50 100 250 500 1000
I nt e r f e r e nt mg/ L
Al on Pb
-50
0
50
100
150
0 50 100 250 500 1000
I nt e r f e r e nt mg/ L
Al on Cr
-70
-60
-50
-40
-30
-20
-10
0
10
0 50 100 250 500 1000
I nt e r f e r e nt mg/ L
Key interferences from AlAl on Be
-1
0
1
2
3
4
5
6
7
0 50 100 250 500 1000
I nt e r f e r e nt mg/ L
Al on As
-200
-150
-100
-50
0
50
100
0 50 100 250 500 1000
I nt e r f e r e nt mg/ L
Definitely requires Correction …but would it if only a 100 ppmstd were analyzed?
Is correction required?Or is something else going on?
Be very wary of data that suggests a correction only at very high levels or data in which the apparent correction seems to change direction.
49
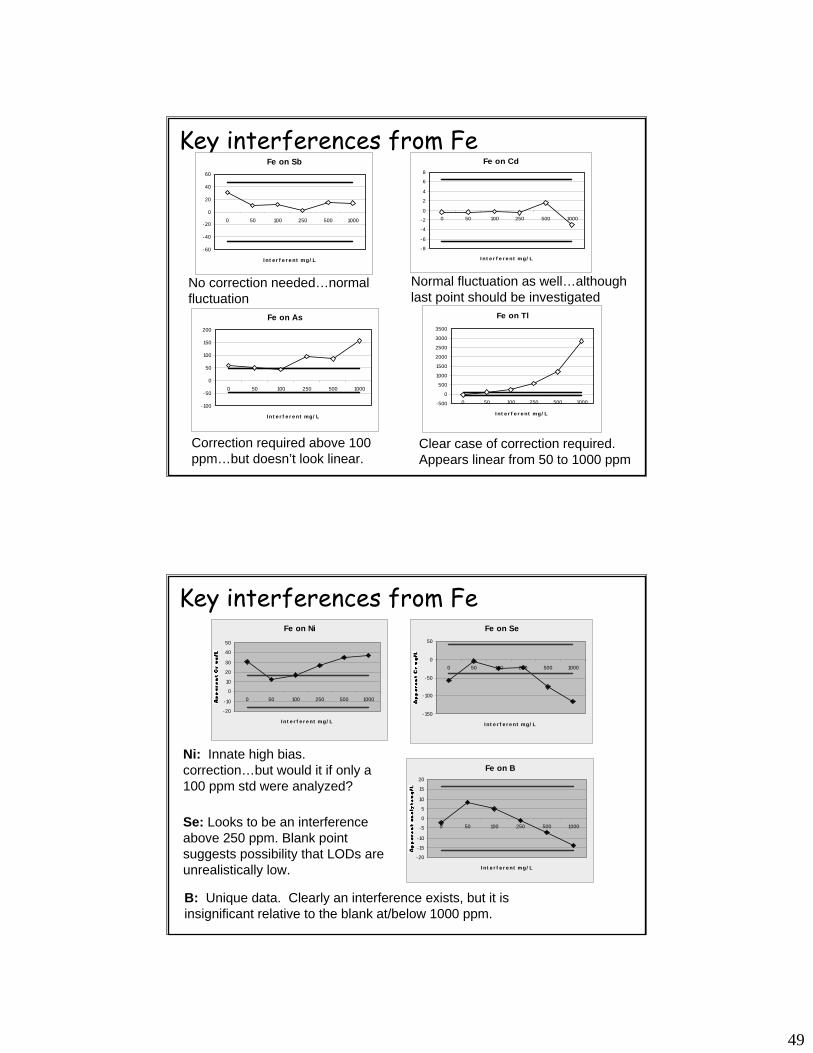
Key interferences from FeFe on Sb
-60
-40
-20
0
20
40
60
0 50 100 250 500 1000
I nt e r f e r e nt mg/ L
Fe on Cd
-8
-6
-4
-2
0
2
4
6
8
0 50 100 250 500 1000
I nt e r f e r e nt mg/ L
Fe on As
-100
-50
0
50
100
150
200
0 50 100 250 500 1000
I nt e r f e r e nt mg/ L
Fe on Tl
-500
0
500
1000
1500
2000
2500
3000
3500
0 50 100 250 500 1000
I nt e r f e r e nt mg/ L
No correction needed…normal fluctuation
Normal fluctuation as well…although last point should be investigated
Correction required above 100 ppm…but doesn’t look linear.
Clear case of correction required.Appears linear from 50 to 1000 ppm
Key interferences from FeFe on Ni
-20
-10
0
10
20
30
40
50
0 50 100 250 500 1000
I nt e r f e r e nt mg/ L
Fe on Se
-150
-100
-50
0
50
0 50 100 250 500 1000
I nt e r f e r e nt mg/ L
Fe on B
-20
-15
-10
-5
0
5
10
15
20
0 50 100 250 500 1000
I nt e r f e r e nt mg/ L
Ni: Innate high bias. correction…but would it if only a 100 ppm std were analyzed?
Se: Looks to be an interference above 250 ppm. Blank point suggests possibility that LODs are unrealistically low.
B: Unique data. Clearly an interference exists, but it is insignificant relative to the blank at/below 1000 ppm.
50
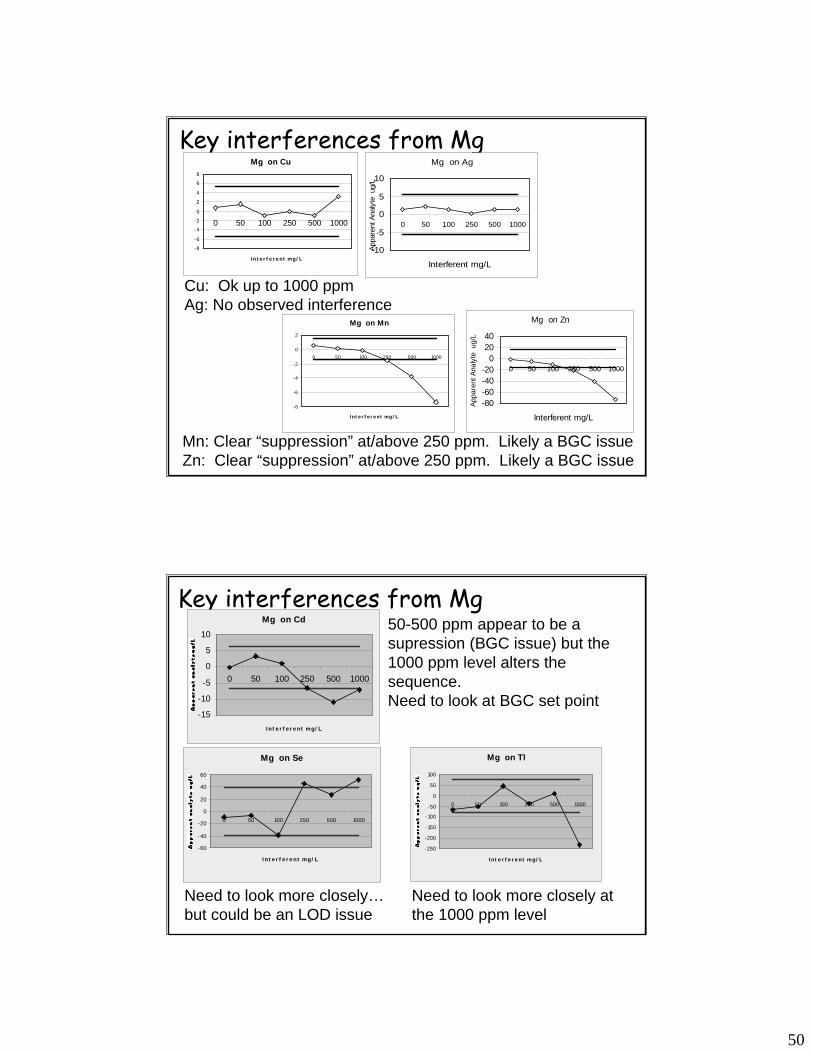
Key interferences from MgMg on Cu
-8
-6
-4
-2
0
2
4
6
8
0 50 100 250 500 1000
I nt e r f e r e nt mg/ L
Mg on Ag
-10
-5
0
5
10
0 50 100 250 500 1000
Interferent mg/L
Appa
rent
Ana
lyte
ug/
L
Mg on Mn
-8
-6
-4
-2
0
2
0 50 100 250 500 1000
I nt e r f e r e nt mg/ L
Mg on Zn
-80-60-40-20
02040
0 50 100 250 500 1000
Interferent mg/L
Appa
rent
Ana
lyte
ug/
L
Cu: Ok up to 1000 ppmAg: No observed interference
Mn: Clear “suppression” at/above 250 ppm. Likely a BGC issueZn: Clear “suppression” at/above 250 ppm. Likely a BGC issue
Key interferences from Mg
Mg on Tl
-250
-200
-150
-100
-50
0
50
100
0 50 100 250 500 1000
I nt e r f e r e nt mg/ L
Mg on Cd
-15
-10
-5
0
5
10
0 50 100 250 500 1000
I nt e r f e r e nt mg/ L
Mg on Se
-60
-40
-20
0
20
40
60
0 50 100 250 500 1000
I nt e r f e r e nt mg/ L
Need to look more closely…but could be an LOD issue
Need to look more closely at the 1000 ppm level
50-500 ppm appear to be a supression (BGC issue) but the 1000 ppm level alters the sequence.Need to look at BGC set point
51
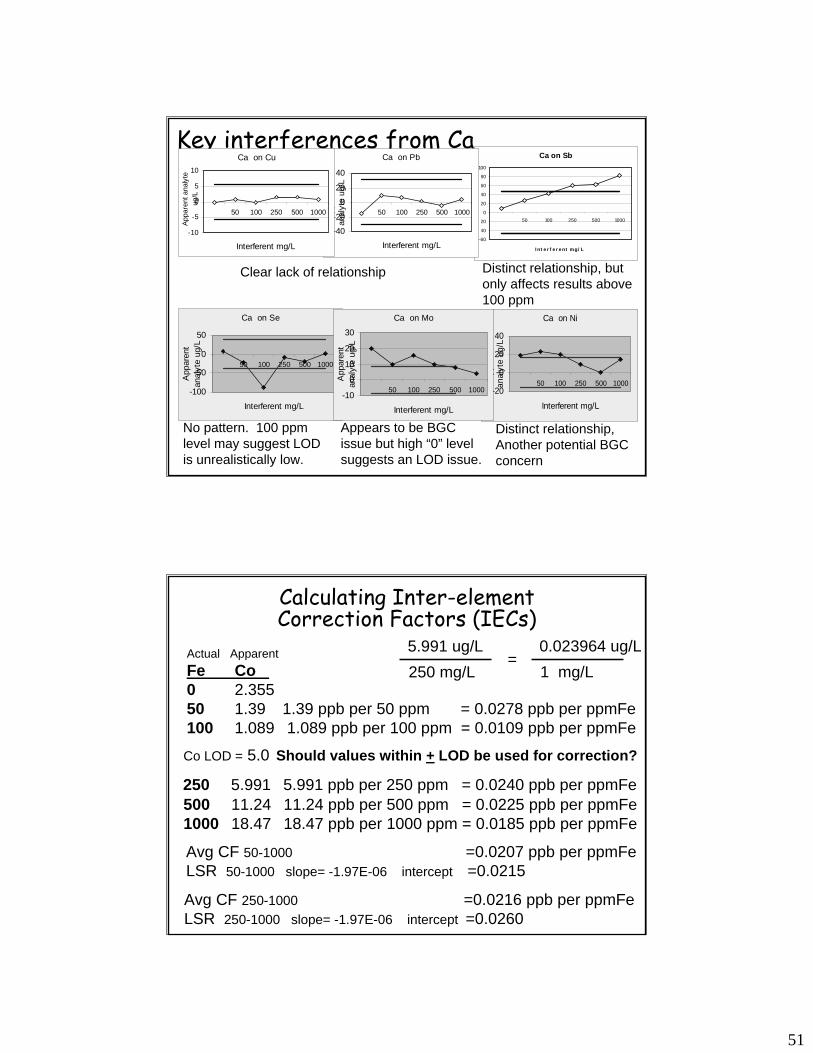
Ca on Ni
-20
0
20
40
50 100 250 500 1000
Interferent mg/L
App
aren
t an
alyt
e ug
/L
Ca on Sb
-60
-40
-20
0
20
40
60
80
100
50 100 250 500 1000
I nt e r f e r e nt mg/ L
Key interferences from CaCa on Pb
-40
-20
0
20
40
50 100 250 500 1000
Interferent mg/L
App
aren
t an
alyt
e ug
/L
Ca on Se
-100
-50
0
50
50 100 250 500 1000
Interferent mg/L
App
aren
t an
alyt
e ug
/L
Ca on Mo
-10
0
10
20
30
50 100 250 500 1000
Interferent mg/L
App
aren
t an
alyt
e ug
/L
Clear lack of relationship Distinct relationship, but only affects results above 100 ppm
No pattern. 100 ppmlevel may suggest LOD is unrealistically low.
Appears to be BGC issue but high “0” level suggests an LOD issue.
Distinct relationship, Another potential BGC concern
Ca on Cu
-10
-5
0
5
10
50 100 250 500 1000
Interferent mg/L
Appa
rent
ana
lyte
ug
/L
Calculating Inter-element Correction Factors (IECs)
Actual ApparentFe Co 0 2.35550 1.39 1.39 ppb per 50 ppm = 0.0278 ppb per ppmFe100 1.089 1.089 ppb per 100 ppm = 0.0109 ppb per ppmFe
Co LOD = 5.0
250 5.991 5.991 ppb per 250 ppm = 0.0240 ppb per ppmFe
Avg CF 50-1000 =0.0207 ppb per ppmFeLSR 50-1000 slope= -1.97E-06 intercept =0.0215
5.991 ug/L250 mg/L
=0.023964 ug/L1 mg/L
Should values within + LOD be used for correction?
Avg CF 250-1000 =0.0216 ppb per ppmFeLSR 250-1000 slope= -1.97E-06 intercept =0.0260
500 11.24 11.24 ppb per 500 ppm = 0.0225 ppb per ppmFe1000 18.47 18.47 ppb per 1000 ppm = 0.0185 ppb per ppmFe
52
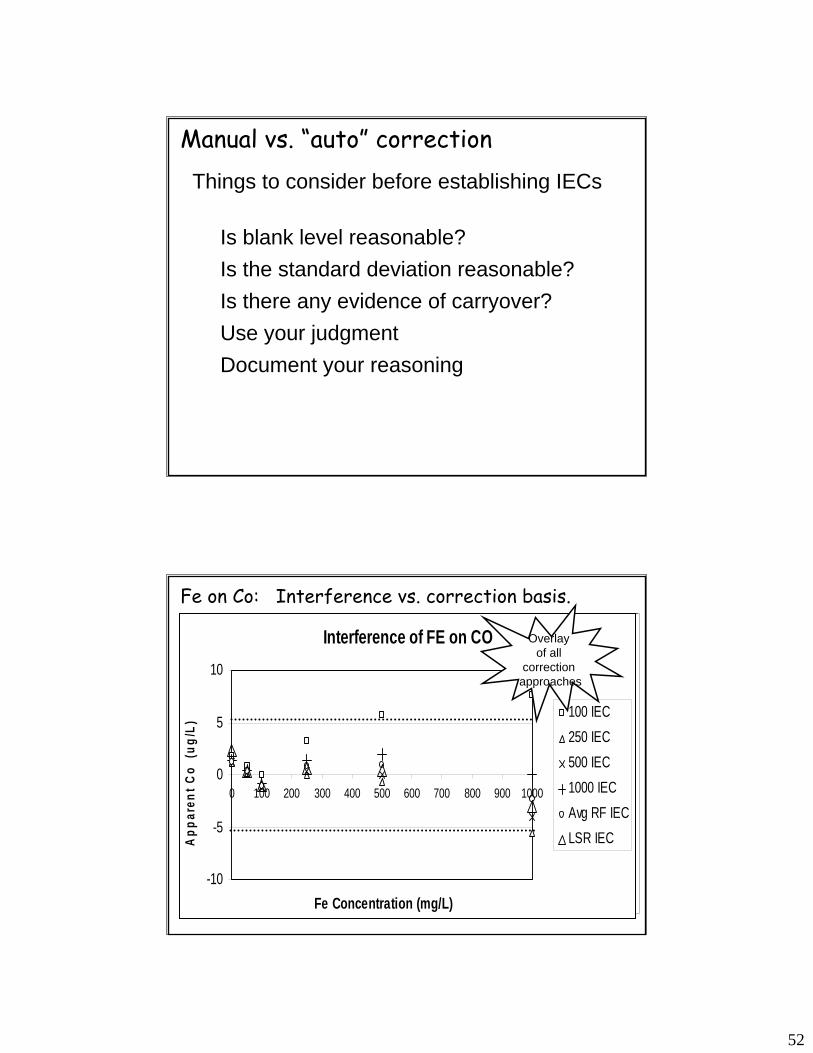
Manual vs. “auto” correction
Is blank level reasonable?Is the standard deviation reasonable?Is there any evidence of carryover?Use your judgmentDocument your reasoning
Things to consider before establishing IECs
Interference of FE on CO
-10
-5
0
5
10
15
20
0 100 200 300 400 500 600 700 800 900 1000
Fe Concentration (mg/L)
Appa
rent
Co
(ug/
L)
Interference of FE on CO
-10
-5
0
5
10
15
20
0 100 200 300 400 500 600 700 800 900 1000
Fe Concentration (mg/L)
App
aren
t Co
(ug/
L)
Correction based on 100 ppm Fe
Interference of FE on CO
-10
-5
0
5
10
15
20
0 100 200 300 400 500 600 700 800 900 1000
Fe Concentration (mg/L)
App
aren
t Co
(ug/
L)
Correction based on 250 ppm Fe
Interference of FE on CO
-10
-5
0
5
10
15
20
0 100 200 300 400 500 600 700 800 900 1000
Fe Concentration (mg/L)
App
aren
t Co
(ug/
L)
Correction based on 500 ppm Fe
Interference of FE on CO
-10
-5
0
5
10
15
20
0 100 200 300 400 500 600 700 800 900 1000
Fe Concentration (mg/L)
App
aren
t Co
(ug/
L)
Correction based on 1000 ppm Fe
Interference of FE on CO
-10
-5
0
5
10
15
20
0 100 200 300 400 500 600 700 800 900 1000
Fe Concentration (mg/L)
App
aren
t Co
(ug/
L)
Correction based on avg. CF (100-1000)
Interference of FE on CO
-10
-5
0
5
10
15
20
0 100 200 300 400 500 600 700 800 900 1000
Fe Concentration (mg/L)
App
aren
t Co
(ug/
L)
Correction based on Lin. Reg. 100-1000
Fe on Co: Interference vs. correction basis.
Interference of FE on CO
-10
-5
0
5
10
15
20
0 100 200 300 400 500 600 700 800 900 1000
Fe Concentration (mg/L)
App
aren
t Co
(ug/
L)
corrections based on AVERAGE CF from 250-1000 ppm Fe
Interference of FE on CO
-10
-5
0
5
10
0 100 200 300 400 500 600 700 800 900 1000
Fe Concentration (mg/L)
App
aren
t Co
(ug/
L)
100 IEC250 IEC500 IEC1000 IECAvg RF IECLSR IEC
Overlay of all
correction approaches
53
Interference of FE on SE
-150
-100
-50
0
50
100
150
0 100 200 300 400 500 600 700 800 900 1000
Fe Concentration (mg/L)
App
aren
t Co
(ug/
L)Correction based on 100 ppm Fe
Interference of FE on SE
-150
-100
-50
0
50
100
150
0 100 200 300 400 500 600 700 800 900 1000
Fe Concentration (mg/L)
App
aren
t Co
(ug/
L)Correction based on 250 ppm Fe
Interference of FE on SE
-150
-100
-50
0
50
100
150
0 100 200 300 400 500 600 700 800 900 1000
Fe Concentration (mg/L)
App
aren
t Co
(ug/
L)Correction based on 500 ppm Fe
Interference of FE on SE
-150
-100
-50
0
50
100
150
0 100 200 300 400 500 600 700 800 900 1000
Fe Concentration (mg/L)
App
aren
t Co
(ug/
L)Correction based on 1000 ppm Fe
Interference of FE on SE
-150
-100
-50
0
50
100
150
0 100 200 300 400 500 600 700 800 900 1000
Fe Concentration (mg/L)
App
aren
t Co
(ug/
L)Correction based on AVG CF from 100-1000 ppm Fe
Interference of FE on SE
-150
-100
-50
0
50
100
150
0 100 200 300 400 500 600 700 800 900 1000
Fe Concentration (mg/L)
App
aren
t Co
(ug/
L)Correction based on Lin. Reg. from 100-1000 ppm Fe
Interference of FE on SE
-100
-50
0
50
100
150
0 100 200 300 400 500 600 700 800 900 1000
Fe Concentration (mg/L)
App
aren
t Co
(ug/
L)100 IEC250 IEC500 IEC1000 IECAvg RF IECLSR IEC
Overlay of all correction approaches
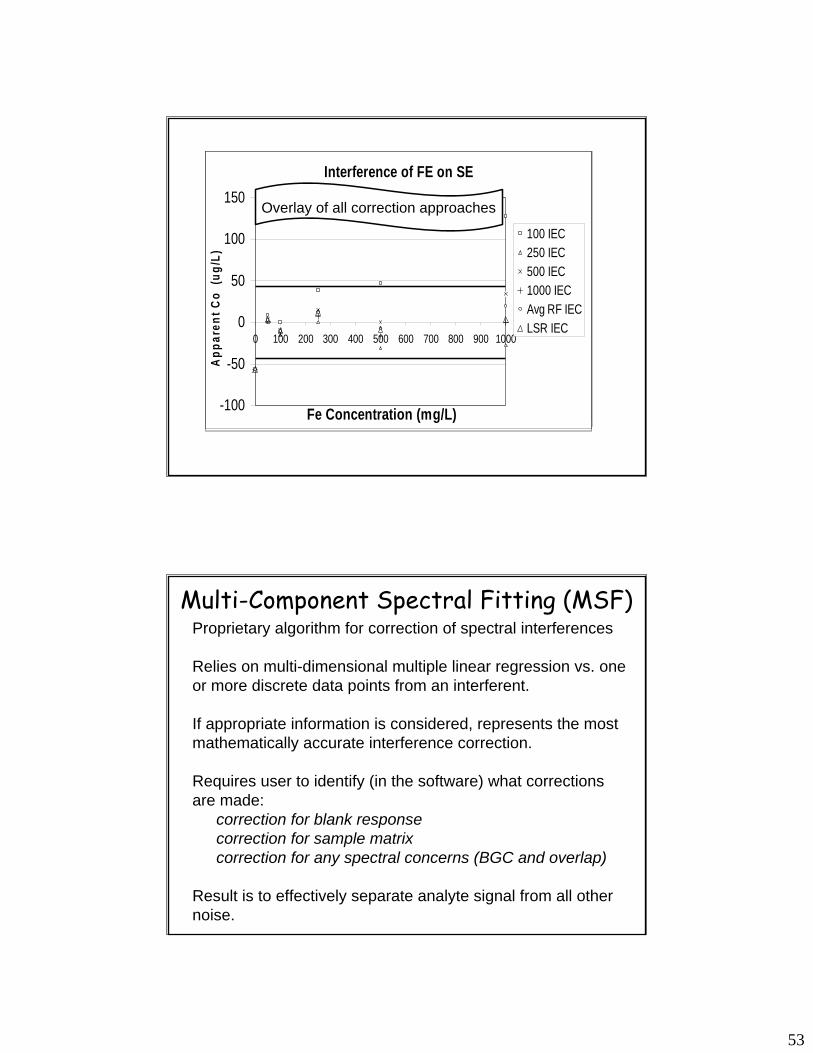
Multi-Component Spectral Fitting (MSF)Proprietary algorithm for correction of spectral interferences
Relies on multi-dimensional multiple linear regression vs. one or more discrete data points from an interferent.
If appropriate information is considered, represents the most mathematically accurate interference correction.
Requires user to identify (in the software) what corrections are made:
correction for blank responsecorrection for sample matrixcorrection for any spectral concerns (BGC and overlap)
Result is to effectively separate analyte signal from all other noise.
54
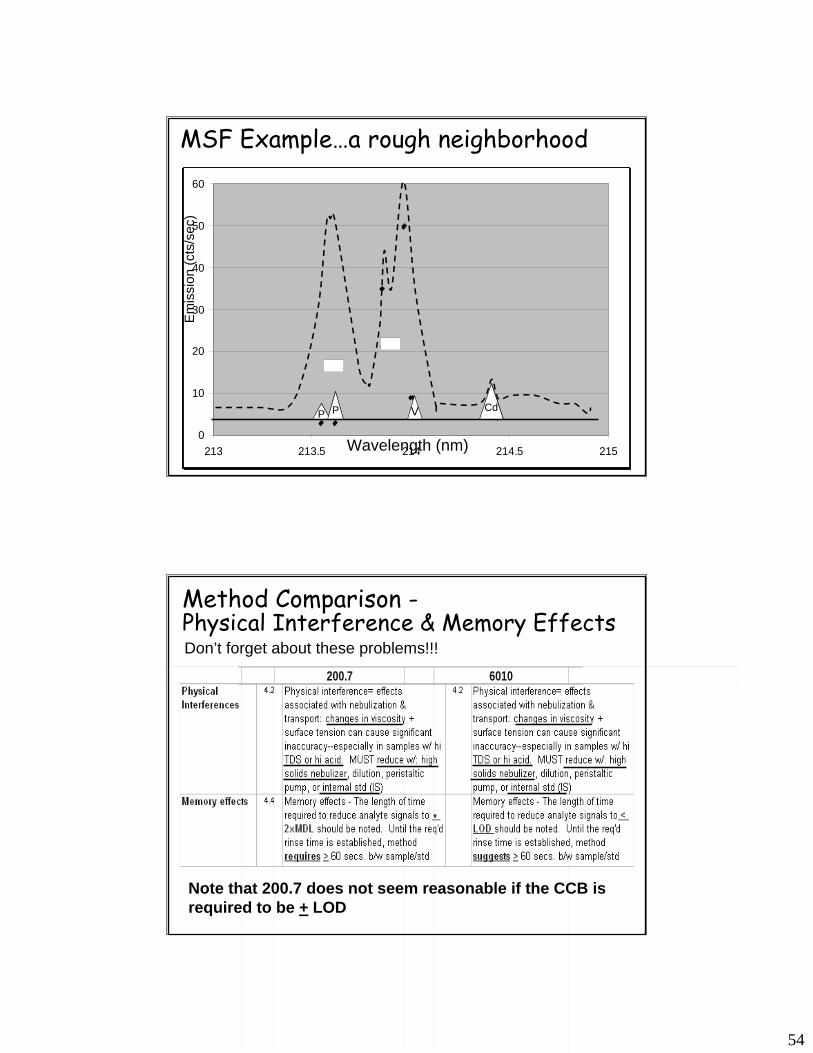
MSF Example…a rough neighborhood
0
10
20
30
40
50
60
213 213.5 214 214.5 215Wavelength (nm)
Emis
sion
(cts
/sec
)
♦
♦
♦
0
10
20
30
40
50
60
213 213.5 214 214.5 215
Cu Sb
ZnV CdP P
Cu Sb
ZnV Cd
Wavelength (nm)
Emis
sion
(cts
/sec
)
P P
♦
♦ ♦0
10
20
30
40
50
60
213 213.5 214 214.5 215
Sb
ZnV CdP P
Sb
ZnV Cd
Wavelength (nm)
Emis
sion
(cts
/sec
)
P P
♦
♦
♦♦0
10
20
30
40
50
60
213 213.5 214 214.5 215
ZnV CdP P
ZnV Cd
Wavelength (nm)
Emis
sion
(cts
/sec
)
P P
♦
♦
♦
♦ ♦0
10
20
30
40
50
60
213 213.5 214 214.5 215
V CdP P V Cd
Wavelength (nm)
Emis
sion
(cts
/sec
)
P P
♦
♦
♦
♦♦0
10
20
30
40
50
60
213 213.5 214 214.5 215
V CdP P Cd
Wavelength (nm)
Emis
sion
(cts
/sec
)
P P
♦
♦
♦
♦ ♦
Method Comparison -Physical Interference & Memory Effects
Note that 200.7 does not seem reasonable if the CCB is required to be + LOD
200.7 6010
Don’t forget about these problems!!!
55
Inter-element Correction Factors: Conclusions
• One size does not fit all• Use at least one concentration level• Best information obtained from multiple concentration levels• Method recommended 100 mg/L level is not suitable for
major cations• Best overall correction obtained from average CF over
multiple levels OR average of replicates at one level.• One level probably appropriate for 2° interferents• Watch for carryover when analyzing 100 ppm or higher• Spectral overlap yields positive bias• IECs can be based on either TRUE or observed
interferent concentration (“The proof is in the pudding”)
Blanks (Method, Calibration, Rinse)
LCS
MS/MSD
Duplicates
Internal Standards
Interference Checks
Basic Quality Control
56
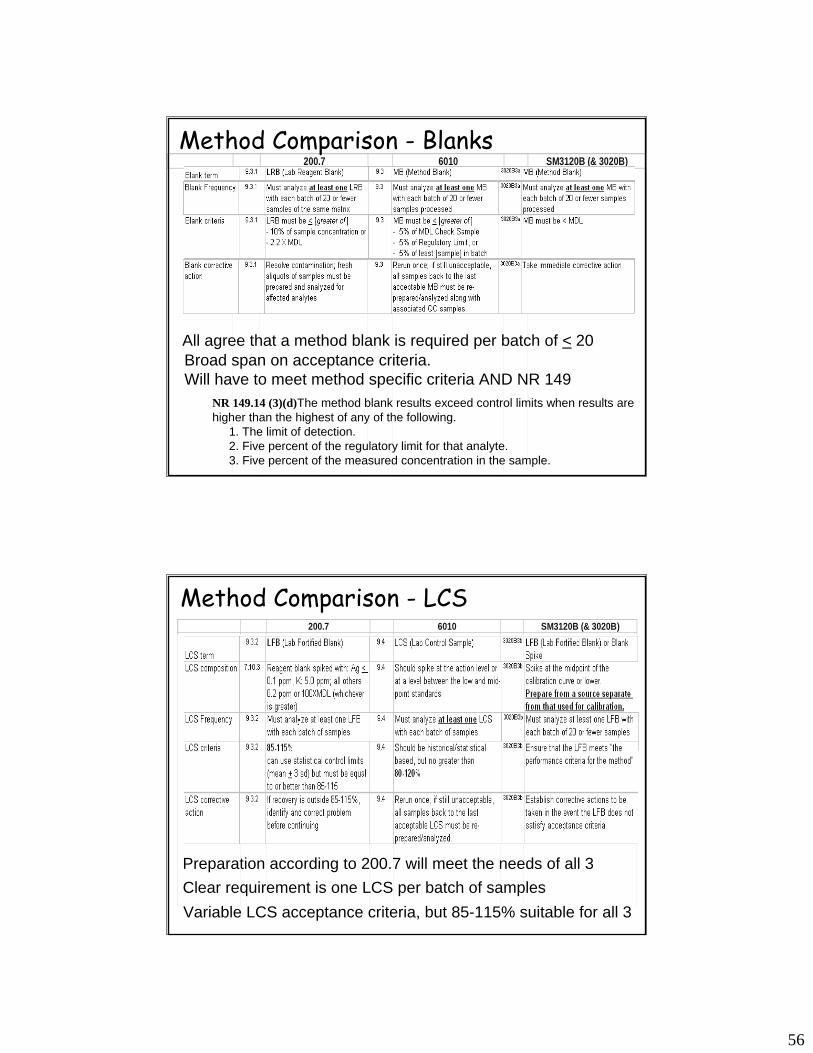
200.7 6010 SM3120B (& 3020B)Method Comparison - Blanks
All agree that a method blank is required per batch of < 20Broad span on acceptance criteria. Will have to meet method specific criteria AND NR 149
NR 149.14 (3)(d)The method blank results exceed control limits when results are higher than the highest of any of the following.
1. The limit of detection.2. Five percent of the regulatory limit for that analyte.3. Five percent of the measured concentration in the sample.
200.7 6010 SM3120B (& 3020B)9 3 1 ( ) 9 3 ( ) 3020B3 ( )
Method Comparison - LCS
Preparation according to 200.7 will meet the needs of all 3Clear requirement is one LCS per batch of samplesVariable LCS acceptance criteria, but 85-115% suitable for all 3
57
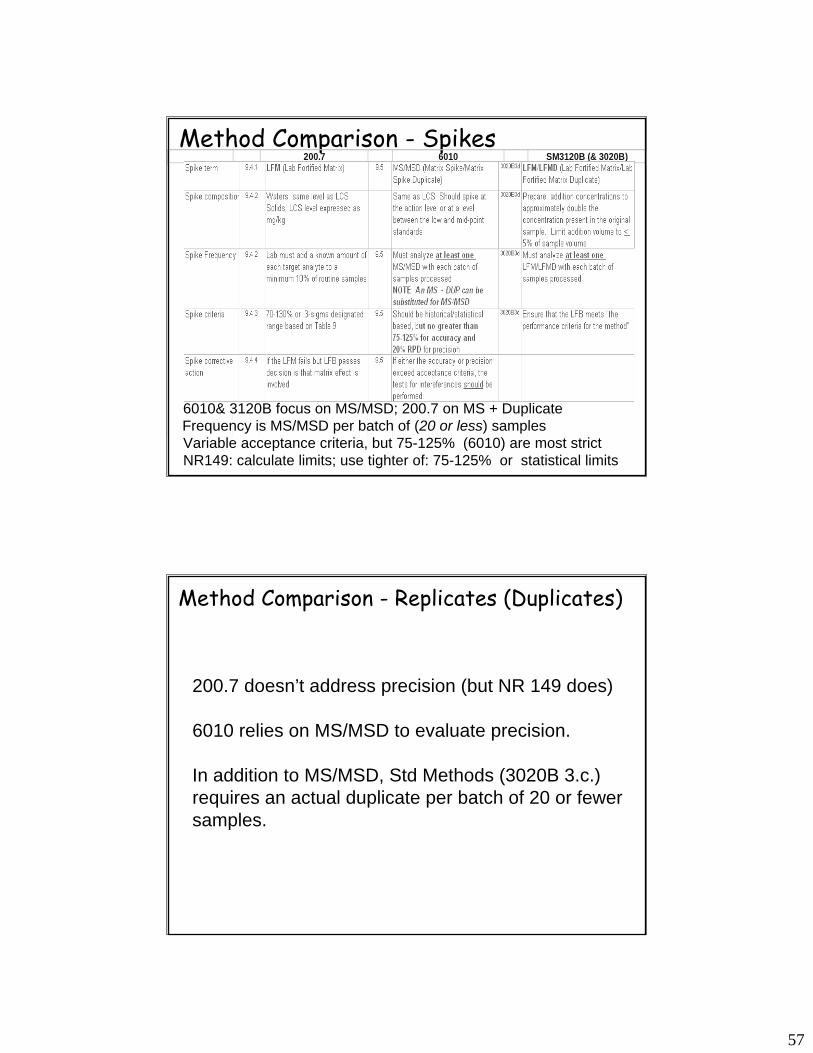
Method Comparison - Spikes200.7 6010 SM3120B (& 3020B)
9 3 1 ( ) 9 3 ( ) 3020B3 ( )
6010& 3120B focus on MS/MSD; 200.7 on MS + DuplicateFrequency is MS/MSD per batch of (20 or less) samplesVariable acceptance criteria, but 75-125% (6010) are most strictNR149: calculate limits; use tighter of: 75-125% or statistical limits
Method Comparison - Replicates (Duplicates)
200.7 doesn’t address precision (but NR 149 does)
6010 relies on MS/MSD to evaluate precision.
In addition to MS/MSD, Std Methods (3020B 3.c.) requires an actual duplicate per batch of 20 or fewer samples.
58
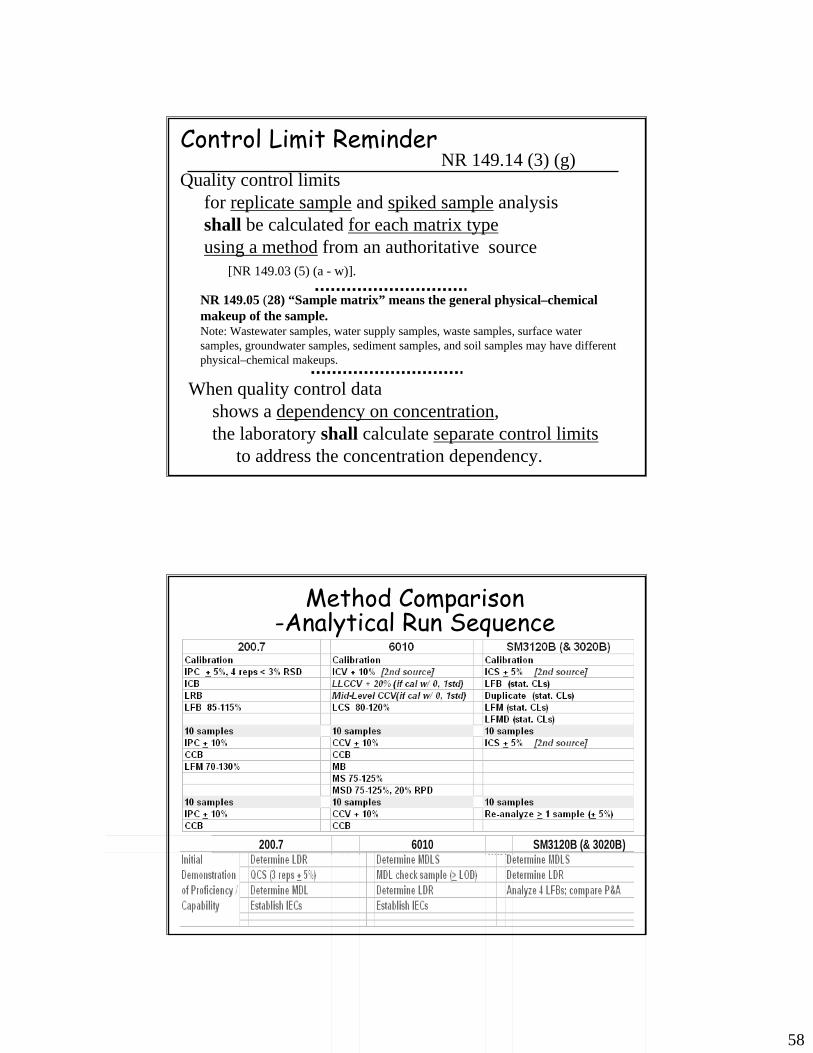
Control Limit ReminderNR 149.14 (3) (g)
Quality control limits for replicate sample and spiked sample analysisshall be calculated for each matrix typeusing a method from an authoritative source
[NR 149.03 (5) (a - w)].
When quality control data shows a dependency on concentration, the laboratory shall calculate separate control limits
to address the concentration dependency.
NR 149.05 (28) “Sample matrix” means the general physical–chemical makeup of the sample.Note: Wastewater samples, water supply samples, waste samples, surface watersamples, groundwater samples, sediment samples, and soil samples may have different physical–chemical makeups.
Method Comparison -Analytical Run Sequence
200.7 6010 SM3120B (& 3020B)(L b R Bl k) 9 3 MB (M h d Bl k) 3020B3 MB (M h d Bl k)
59
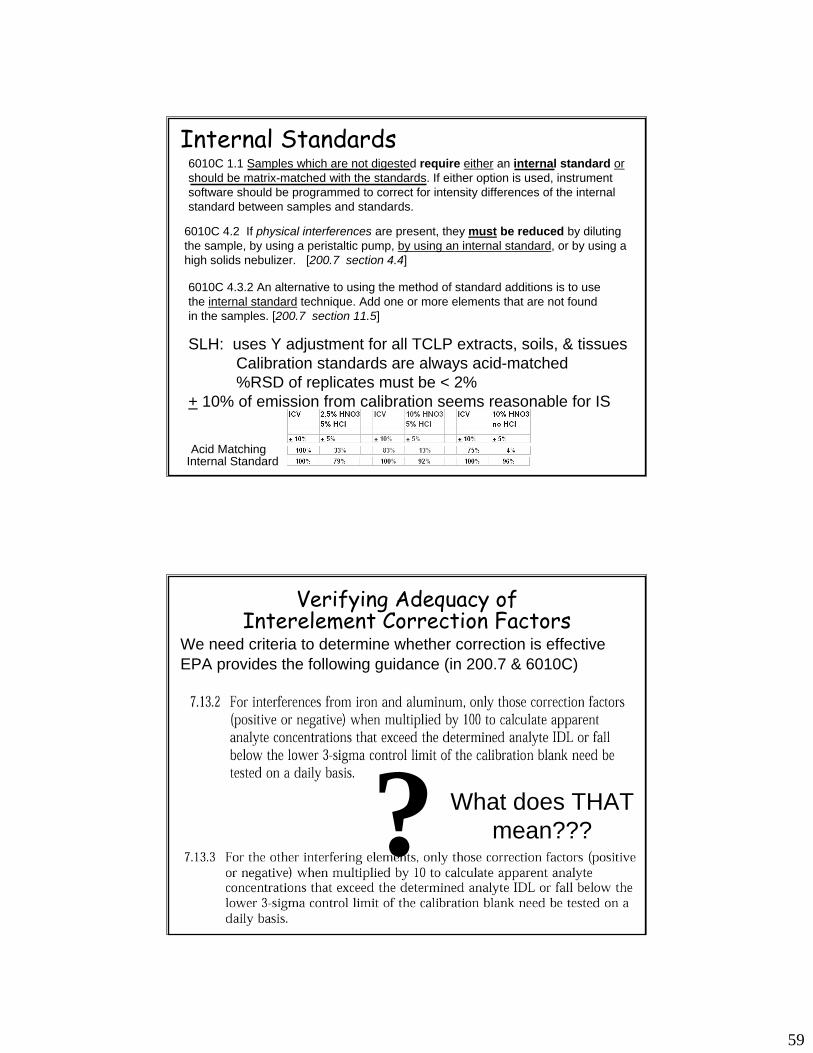
6010C 1.1 Samples which are not digested require either an internal standard or should be matrix-matched with the standards. If either option is used, instrumentsoftware should be programmed to correct for intensity differences of the internal standard between samples and standards.
6010C 4.2 If physical interferences are present, they must be reduced by diluting the sample, by using a peristaltic pump, by using an internal standard, or by using a high solids nebulizer. [200.7 section 4.4]
6010C 4.3.2 An alternative to using the method of standard additions is to use the internal standard technique. Add one or more elements that are not found in the samples. [200.7 section 11.5]
Internal Standards
SLH: uses Y adjustment for all TCLP extracts, soils, & tissuesCalibration standards are always acid-matched%RSD of replicates must be < 2%
+ 10% of emission from calibration seems reasonable for IS
Acid MatchingInternal Standard
?We need criteria to determine whether correction is effectiveEPA provides the following guidance (in 200.7 & 6010C)
What does THAT mean???
Verifying Adequacy of Interelement Correction Factors
60
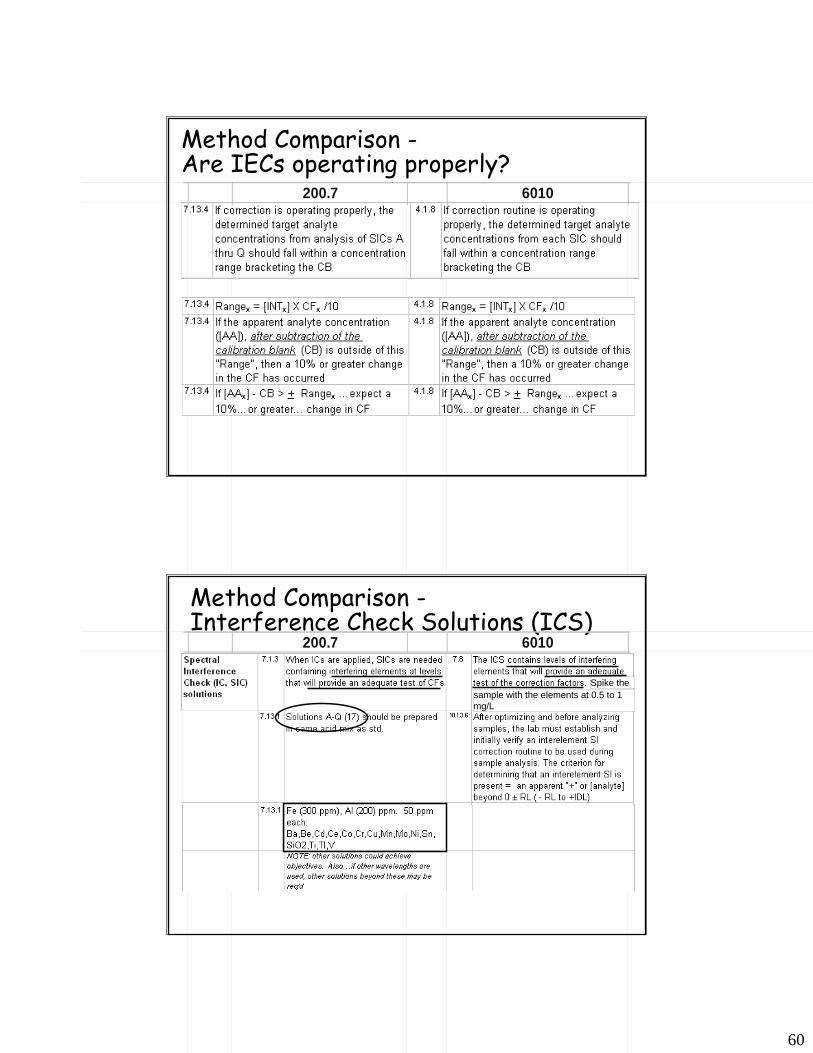
Method Comparison -Are IECs operating properly?
200.7 60109 3 1 ( ) 9 3 ( )
Method Comparison -Interference Check Solutions (ICS)
200.7 60109 3 1 ( ) 9 3 ( )
Spike thesample with the elements at 0.5 to 1 mg/L
61
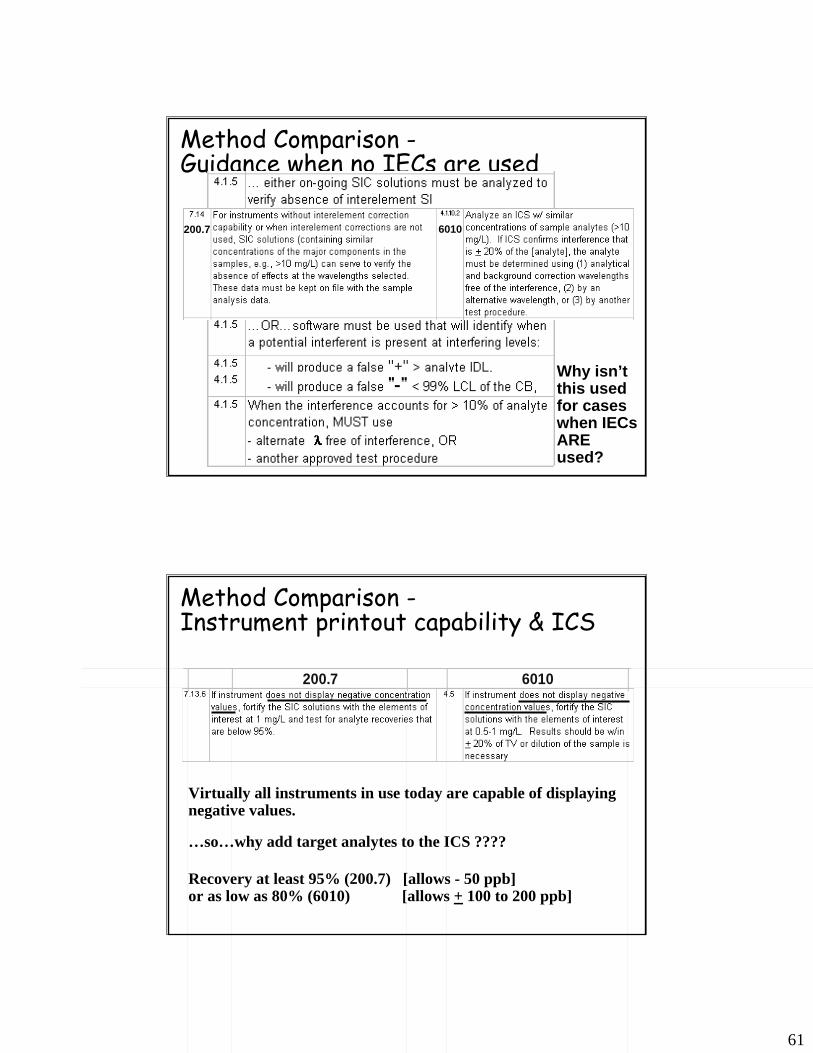
Method Comparison -Guidance when no IECs are used
200.7 6010
Why isn’t this used for cases when IECs ARE used?
200.7 60109 3 1 ( ) 9 3 ( )
Method Comparison -Instrument printout capability & ICS
Virtually all instruments in use today are capable of displayingnegative values.
…so…why add target analytes to the ICS ????
Recovery at least 95% (200.7) [allows - 50 ppb]or as low as 80% (6010) [allows + 100 to 200 ppb]
62
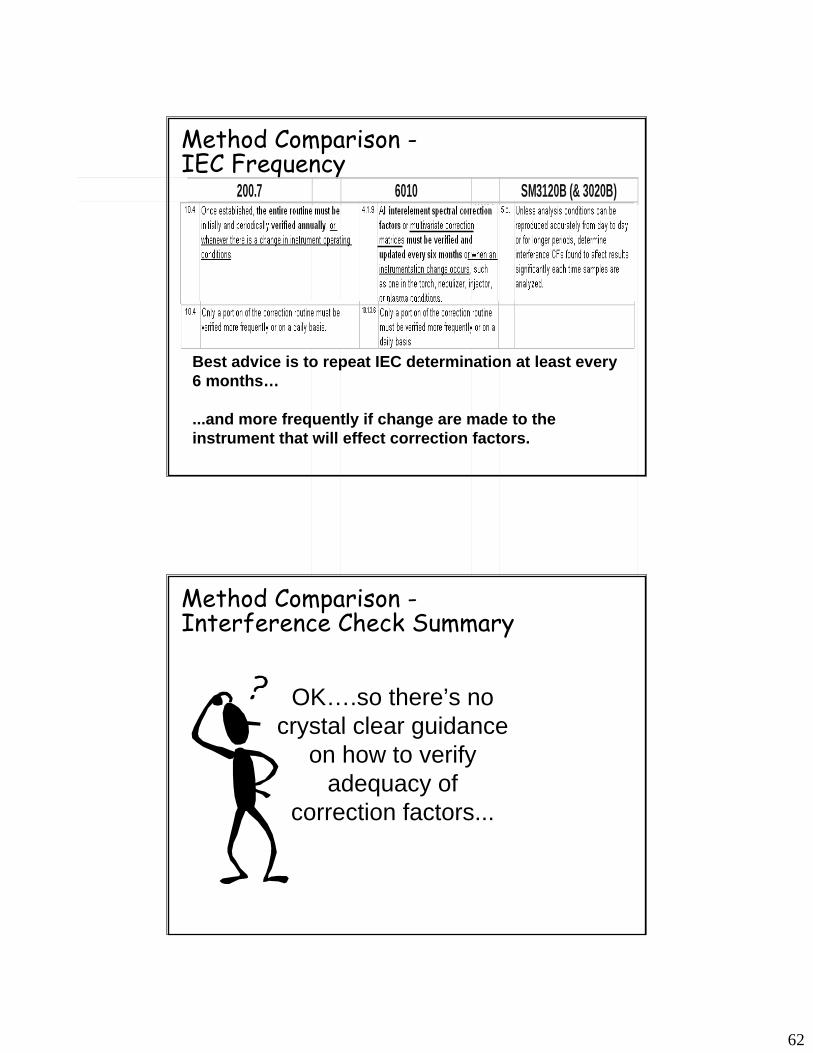
Method Comparison -IEC Frequency
200.7 6010 SM3120B (& 3020B)( ) 9 3 ( ) 3020B3 ( )
Best advice is to repeat IEC determination at least every 6 months…
...and more frequently if change are made to the instrument that will effect correction factors.
OK….so there’s no crystal clear guidance
on how to verify adequacy of
correction factors...
Method Comparison -Interference Check Summary
63
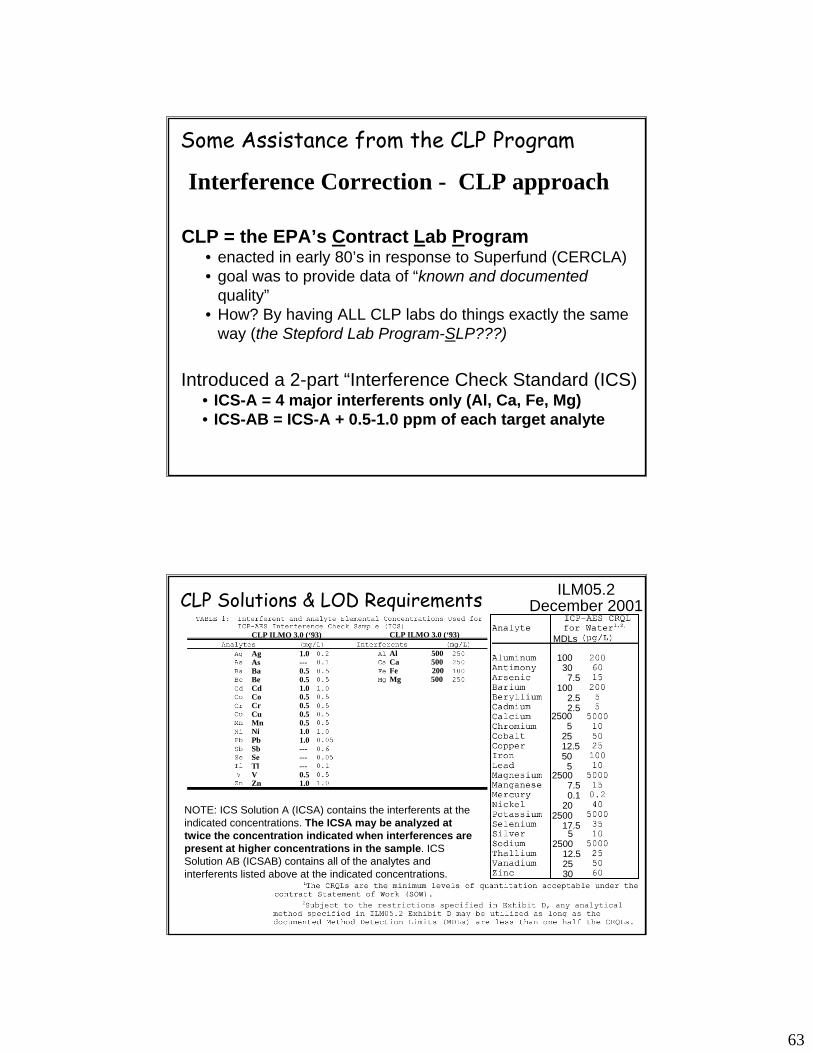
Interference Correction - CLP approach
CLP = the EPA’s Contract Lab Program• enacted in early 80’s in response to Superfund (CERCLA)• goal was to provide data of “known and documented
quality”• How? By having ALL CLP labs do things exactly the same
way (the Stepford Lab Program-SLP???)
Introduced a 2-part “Interference Check Standard (ICS)• ICS-A = 4 major interferents only (Al, Ca, Fe, Mg)• ICS-AB = ICS-A + 0.5-1.0 ppm of each target analyte
Some Assistance from the CLP Program
ILM05.2December 2001
NOTE: ICS Solution A (ICSA) contains the interferents at the indicated concentrations. The ICSA may be analyzed at twice the concentration indicated when interferences are present at higher concentrations in the sample. ICS Solution AB (ICSAB) contains all of the analytes and interferents listed above at the indicated concentrations.
CLP ILMO 3.0 (‘93)
Ag 1.0As ---Ba 0.5Be 0.5Cd 1.0Co 0.5Cr 0.5Cu 0.5Mn 0.5Ni 1.0Pb 1.0Sb ---Se ---Tl ---V 0.5Zn 1.0
CLP ILMO 3.0 (‘93)
Al 500Ca 500Fe 200Mg 500
CLP Solutions & LOD Requirements
100307.5
1002.52.5
25005
2512.5505
25007.50.1
202500
17.55
250012.52530
MDLs
64
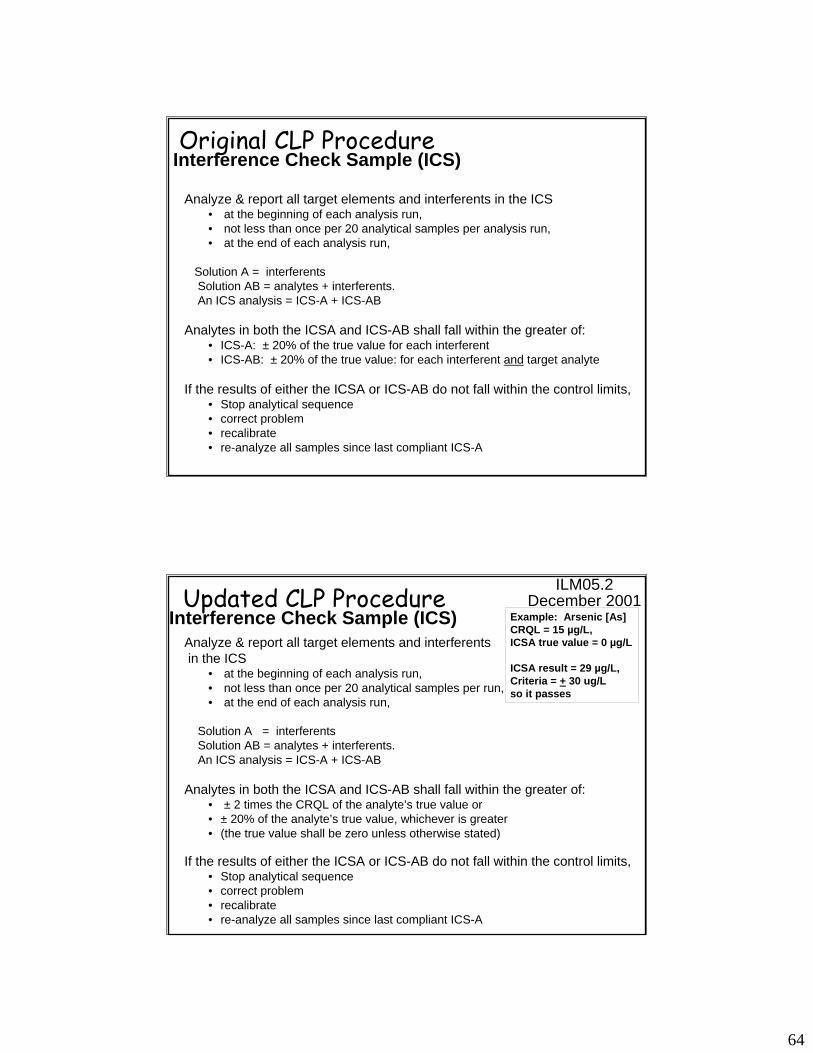
Analyze & report all target elements and interferents in the ICS• at the beginning of each analysis run, • not less than once per 20 analytical samples per analysis run, • at the end of each analysis run,
Solution A = interferentsSolution AB = analytes + interferents. An ICS analysis = ICS-A + ICS-AB
Analytes in both the ICSA and ICS-AB shall fall within the greater of:• ICS-A: ± 20% of the true value for each interferent• ICS-AB: ± 20% of the true value: for each interferent and target analyte
If the results of either the ICSA or ICS-AB do not fall within the control limits,• Stop analytical sequence• correct problem• recalibrate• re-analyze all samples since last compliant ICS-A
Interference Check Sample (ICS)Original CLP Procedure
Analyze & report all target elements and interferentsin the ICS
• at the beginning of each analysis run, • not less than once per 20 analytical samples per run, • at the end of each analysis run,
Solution A = interferentsSolution AB = analytes + interferents. An ICS analysis = ICS-A + ICS-AB
Analytes in both the ICSA and ICS-AB shall fall within the greater of:• ± 2 times the CRQL of the analyte’s true value or • ± 20% of the analyte’s true value, whichever is greater • (the true value shall be zero unless otherwise stated)
Example: Arsenic [As]CRQL = 15 µg/L, ICSA true value = 0 µg/L
ICSA result = 29 µg/L, Criteria = + 30 ug/Lso it passes
ILM05.2December 2001
Interference Check Sample (ICS)Updated CLP Procedure
If the results of either the ICSA or ICS-AB do not fall within the control limits,• Stop analytical sequence• correct problem• recalibrate• re-analyze all samples since last compliant ICS-A
65
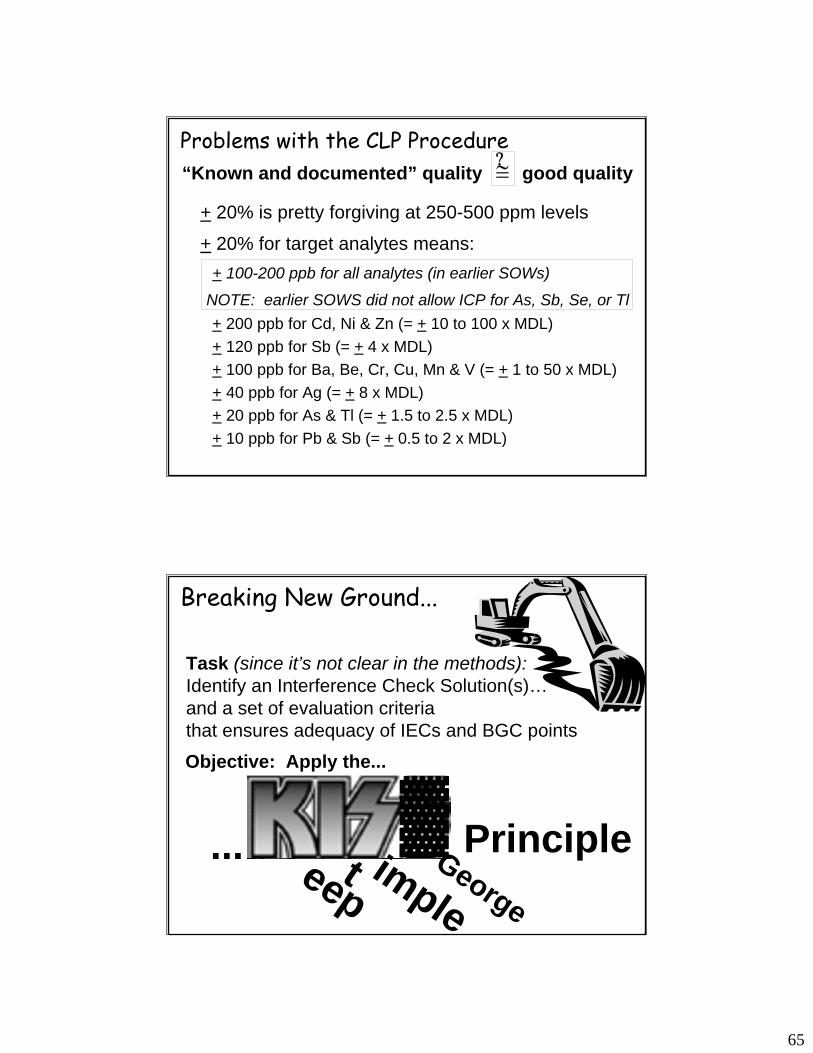
“Known and documented” quality ≠ good qualityProblems with the CLP Procedure
≅?
+ 20% is pretty forgiving at 250-500 ppm levels
+ 20% for target analytes means:+ 100-200 ppb for all analytes (in earlier SOWs)
NOTE: earlier SOWS did not allow ICP for As, Sb, Se, or Tl+ 200 ppb for Cd, Ni & Zn (= + 10 to 100 x MDL)+ 120 ppb for Sb (= + 4 x MDL)+ 100 ppb for Ba, Be, Cr, Cu, Mn & V (= + 1 to 50 x MDL)+ 40 ppb for Ag (= + 8 x MDL)+ 20 ppb for As & Tl (= + 1.5 to 2.5 x MDL)+ 10 ppb for Pb & Sb (= + 0.5 to 2 x MDL)
Principle
Breaking New Ground...
Task (since it’s not clear in the methods):Identify an Interference Check Solution(s)…and a set of evaluation criteriathat ensures adequacy of IECs and BGC points
impleteep
...
Objective: Apply the...
George
▓
66
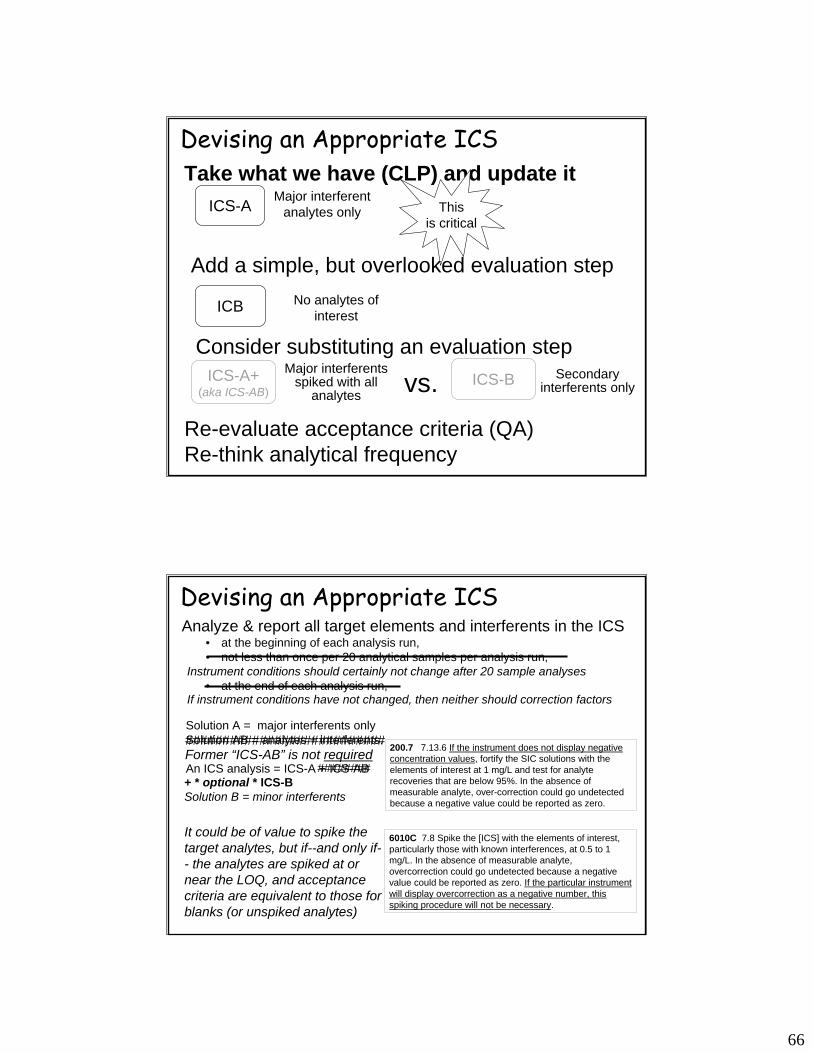
Take what we have (CLP) and update itDevising an Appropriate ICS
Re-evaluate acceptance criteria (QA)Re-think analytical frequency
ICB No analytes of interest
ICS-A This is critical
Major interferentanalytes only
Add a simple, but overlooked evaluation step
Consider substituting an evaluation stepICS-A+
(aka ICS-AB)
Major interferentsspiked with all
analytesICS-B Secondary
interferents onlyvs.
Analyze & report all target elements and interferents in the ICS• at the beginning of each analysis run, • not less than once per 20 analytical samples per analysis run,
• at the end of each analysis run,
6010C 7.8 Spike the [ICS] with the elements of interest, particularly those with known interferences, at 0.5 to 1 mg/L. In the absence of measurable analyte, overcorrection could go undetected because a negative value could be reported as zero. If the particular instrument will display overcorrection as a negative number, this spiking procedure will not be necessary.
200.7 7.13.6 If the instrument does not display negative concentration values, fortify the SIC solutions with the elements of interest at 1 mg/L and test for analyte recoveries that are below 95%. In the absence of measurable analyte, over-correction could go undetected because a negative value could be reported as zero.
Solution A = major interferents onlySolution AB = analytes + interferents.
An ICS analysis = ICS-A + ICS-AB
Instrument conditions should certainly not change after 20 sample analyses
If instrument conditions have not changed, then neither should correction factors
Devising an Appropriate ICS
########+ * optional * ICS-BSolution B = minor interferents
It could be of value to spike the target analytes, but if--and only if-- the analytes are spiked at or near the LOQ, and acceptance criteria are equivalent to those for blanks (or unspiked analytes)
###########################Former “ICS-AB” is not required

67
Analytes in both the ICSA & ICS-AB shall fall within the greater of:
• ± 2 times the CRQL or • ± 20% of the analyte’s true value, whichever is greater
• (the true value shall be zero unless otherwise stated)
Example: Arsenic [As]LOD = 50 µg/L, ICSA true value = 0 µg/L
ICSA result = 29 µg/L, Criteria = + 50 ug/Lso it passes
Devising an Appropriate ICS
If the results of either the ICSA or ICS-AB do not fall within the control limits,
• Stop analytical sequence• Correct problem• Re-calibrate• Re-analyze all samples since last
compliant ICS solution
ALL #### blank, , ▓##########
###### LOD #####
################### for unspiked analytes
### 10%(+ 10% represents a more realistic measure of ICP bias)
Elem Avg #1 #2 %RSD
Ag 328.068 0.0009 0.0009 0.0008 8.32%Al 308.215 0.2974 0.2837 0.3111 6.51%B 249.773 0.0655 0.0665 0.0645 2.16%Ba 233.527 -0.0001 -0.0001 0.0000 -141.42%Cd 226.502 -0.0021 -0.0012 -0.0029 -58.64%Cr 205.560 -0.0041 -0.0038 -0.0043 -8.73%Cu 324.754 0.0049 0.0043 0.0055 17.32%Fe 259.940 -0.0068 -0.0056 -0.0079 -24.09%Mn 257.610 -0.0017 -0.0016 -0.0017 -4.29%Mo 203.844 0.0012 0.0037 -0.0013 294.63%Ni 231.604 0.0044 0.0049 0.0039 16.07%Pb 220.353 -0.0128 0.0081 -0.0336 -231.27%Zn 213.856 0.0037 0.0042 0.0031 21.31%
Sc 361.384 1.0550 1.0520 1.0580 0.40%As 193.696 0.0144 0.0069 0.0219 73.66%Be 313.107 0.0012 0.0012 0.0011 6.15%Co 228.616 0.0023 0.0004 0.0042 116.83%Sb 206.833 0.0151 0.0222 0.0079 67.19%Se 196.026 -0.0474 0.0121 -0.1069 -177.52%Si 251.611 0.0027 0.0024 0.0029 13.34%Sn 189.933 -0.0026 -0.0014 -0.0037 -63.78%Sr 421.552 -0.0002 -0.0001 -0.0002 -47.14%Tl 190.800 -0.0126 0.0141 -0.0393 -299.68%Ti 334.941 -0.0008 -0.0006 -0.001 -35.36%V 292.402 0.0002 0.0002 0.0002 0.00%
0.00050.0130.1000.0010.0010.0020.0010.0080.0030.0080.0030.0080.007
???0.0010.002??????0.0260.0100.002???0.0100.002
LODInitial Calibration Blank (ICB): + LOD
Blank fluctuates at the LODBlank significantly greater than LODOK OKBlank fluctuates at -1-2X LOD Blank fluctuates at -2X LOD Blank fluctuates at 4-5X LOD OKOKOKBlank slightly greater than LOD Blank fluctuates widely: 1X to -4XOK
Lab does not report As from its ICPOKBlank fluctuates at -1-2X LOD Lab does not report Sb from its ICPLab does not report Se from its ICPOKOKOKLab does not report Tl from its ICPOKOK
68
Element AvgAg 328.068 0.0009Al 308.215 0.2974B 249.773 0.0655Ba 233.527 -0.0001Cd 226.502 -0.0021Cr 205.560 -0.0041Cu 324.754 0.0049Fe 259.940 -0.0068Mn 257.610 -0.0017Mo 203.844 0.0012Ni 231.604 0.0044Pb 220.353 -0.0128Zn 213.856 0.0037
Sc 361.384 1.0550As 193.696 0.0144Be 313.107 0.0012Co 228.616 0.0023Sb 206.833 0.0151Se 196.026 -0.0474Sn 189.933 -0.0026Sr 421.552 -0.0002Tl 190.800 -0.0126Ti 334.941 -0.0008V 292.402 0.0002
0.00050.0130.1000.0010.0010.0020.0010.0080.0030.0080.0030.0080.007
???0.0010.002??????0.0260.0100.002???0.010
BLANKAvg-0.0024
49.14000.10350.2967-0.0033-0.00420.004219.4050-0.0040-0.00490.0063-0.0089-0.0175
1.1450.03680.00150.0025-0.0038-0.10180.1039-0.08530.0179-0.0008-0.0018
Al 50 + Fe 20 ppmLOD
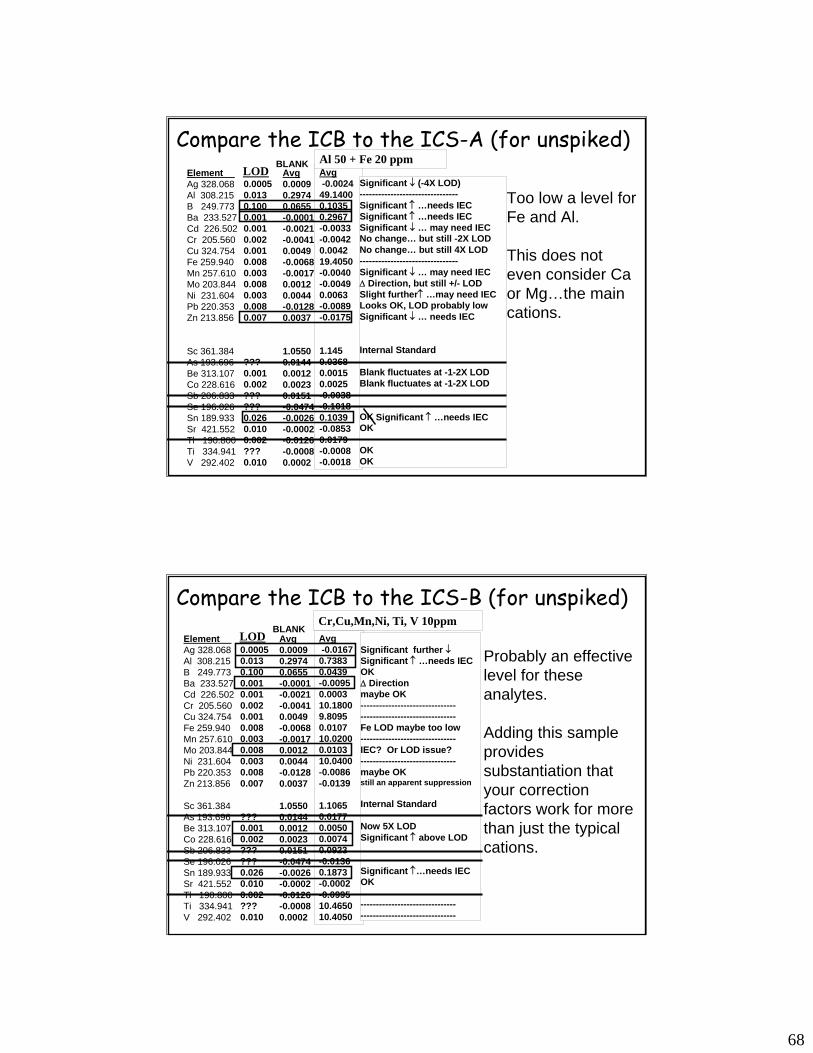
Compare the ICB to the ICS-A (for unspiked)
Significant ↓ (-4X LOD)--------------------------------Significant ↑ …needs IECSignificant ↑ …needs IEC Significant ↓ … may need IEC No change… but still -2X LOD No change… but still 4X LOD --------------------------------Significant ↓ … may need IEC Δ Direction, but still +/- LODSlight further↑ …may need IEC Looks OK, LOD probably lowSignificant ↓ … needs IEC
Internal Standard
Blank fluctuates at -1-2X LOD Blank fluctuates at -1-2X LOD
OKOK
OKOK
Too low a level for Fe and Al.
This does not even consider Ca or Mg…the main cations.
Significant ↑ …needs IEC
Element AvgAg 328.068 0.0009Al 308.215 0.2974B 249.773 0.0655Ba 233.527 -0.0001Cd 226.502 -0.0021Cr 205.560 -0.0041Cu 324.754 0.0049Fe 259.940 -0.0068Mn 257.610 -0.0017Mo 203.844 0.0012Ni 231.604 0.0044Pb 220.353 -0.0128Zn 213.856 0.0037
Sc 361.384 1.0550As 193.696 0.0144Be 313.107 0.0012Co 228.616 0.0023Sb 206.833 0.0151Se 196.026 -0.0474Sn 189.933 -0.0026Sr 421.552 -0.0002Tl 190.800 -0.0126Ti 334.941 -0.0008V 292.402 0.0002
0.00050.0130.1000.0010.0010.0020.0010.0080.0030.0080.0030.0080.007
???0.0010.002??????0.0260.0100.002???0.010
BLANKLOD
Compare the ICB to the ICS-B (for unspiked)Avg-0.0167
0.73830.0439-0.00950.000310.18009.80950.010710.02000.010310.0400-0.0086-0.0139
1.10650.01770.00500.00740.0923-0.01360.1873-0.0002-0.099510.465010.4050
Cr,Cu,Mn,Ni, Ti, V 10ppm
Significant further ↓Significant ↑ …needs IEC OKΔ Direction maybe OK--------------------------------------------------------------Fe LOD maybe too low-------------------------------IEC? Or LOD issue?-------------------------------maybe OKstill an apparent suppression
Internal Standard
Now 5X LODSignificant ↑ above LOD
Significant ↑…needs IECOK
--------------------------------------------------------------
Probably an effective level for these analytes.
Adding this sample provides substantiation that your correction factors work for more than just the typical cations.
69
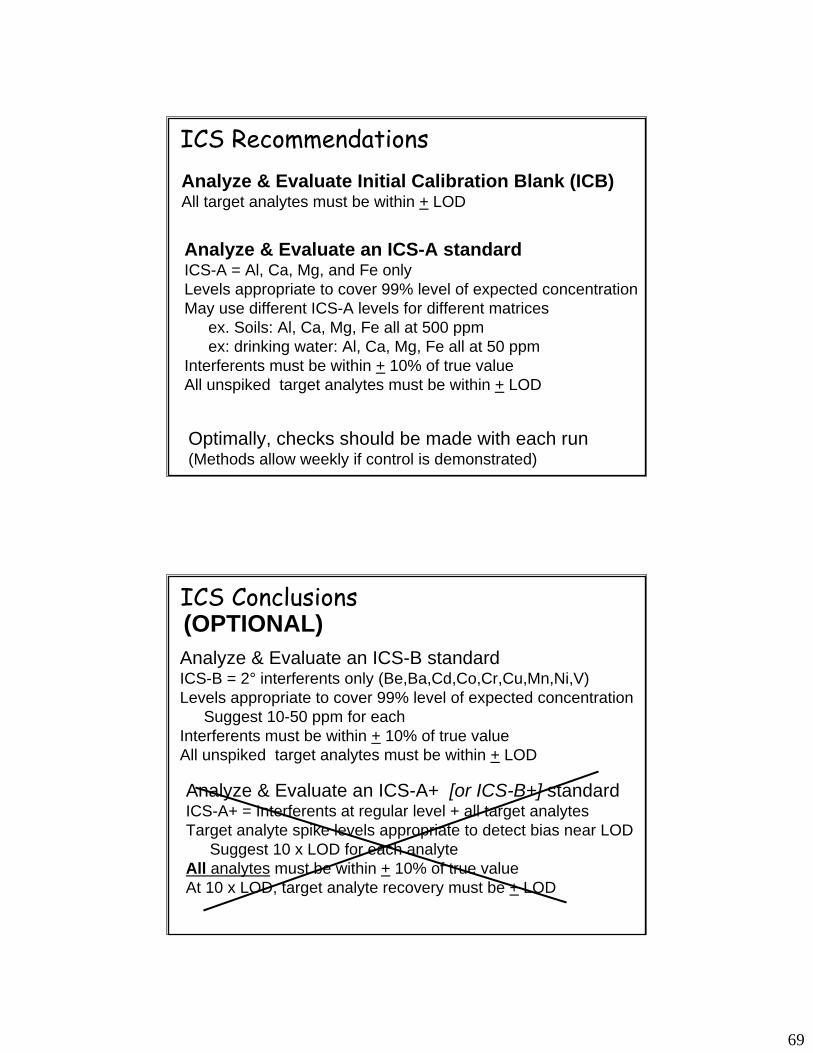
ICS RecommendationsAnalyze & Evaluate Initial Calibration Blank (ICB)All target analytes must be within + LOD
Analyze & Evaluate an ICS-A standardICS-A = Al, Ca, Mg, and Fe onlyLevels appropriate to cover 99% level of expected concentrationMay use different ICS-A levels for different matrices
ex. Soils: Al, Ca, Mg, Fe all at 500 ppmex: drinking water: Al, Ca, Mg, Fe all at 50 ppm
Interferents must be within + 10% of true value All unspiked target analytes must be within + LOD
Optimally, checks should be made with each run(Methods allow weekly if control is demonstrated)
ICS Conclusions
Analyze & Evaluate an ICS-B standardICS-B = 2° interferents only (Be,Ba,Cd,Co,Cr,Cu,Mn,Ni,V)Levels appropriate to cover 99% level of expected concentration
Suggest 10-50 ppm for eachInterferents must be within + 10% of true value All unspiked target analytes must be within + LOD
(OPTIONAL)
Analyze & Evaluate an ICS-A+ [or ICS-B+] standardICS-A+ = Interferents at regular level + all target analytesTarget analyte spike levels appropriate to detect bias near LOD
Suggest 10 x LOD for each analyteAll analytes must be within + 10% of true value At 10 x LOD, target analyte recovery must be + LOD
70
Record-Keeping - Method Development
Analytes to be Reported
Wavelength Selection
Background correction points
Interferents and Levels Tested
Interelement correction factors
LOD determinations
Linear Dynamic Range determination (each analyte)
Standard traceability (also for spikes)
Record-Keeping - DigestionRecords required for a given batch of samples
What samples (including standards &QC) were digested?
Who performed the digestion?
When was the digestion performed?
What digestion procedure was used?
Initial and final weight(s)/volume(s)
Documentation that digestion criteria fulfilled (temp/time)
Standard tracking numbers for acids & reagents
Standard tracking numbers for any standards solutions
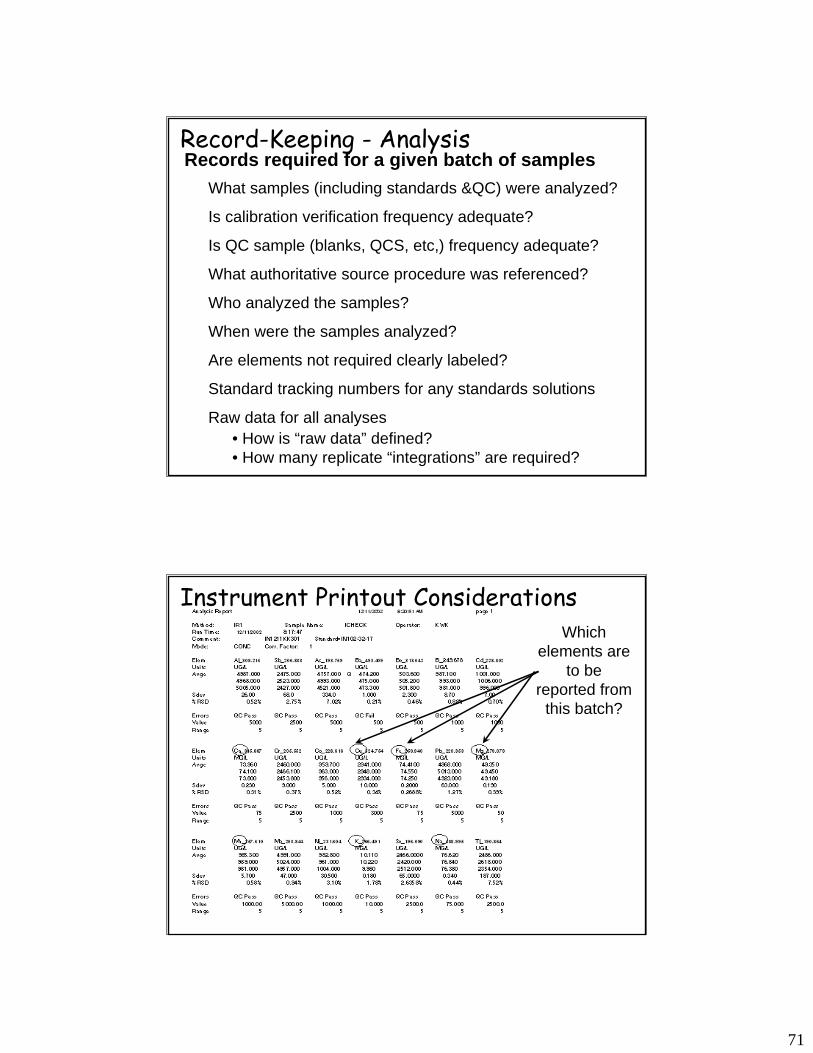
71
Record-Keeping - AnalysisRecords required for a given batch of samples
What samples (including standards &QC) were analyzed?
Is calibration verification frequency adequate?
Is QC sample (blanks, QCS, etc,) frequency adequate?
What authoritative source procedure was referenced?
Who analyzed the samples?
When were the samples analyzed?
Are elements not required clearly labeled?
Standard tracking numbers for any standards solutions
Raw data for all analyses• How is “raw data” defined?• How many replicate “integrations” are required?
Instrument Printout ConsiderationsWhich
elements are to be
reported from this batch?
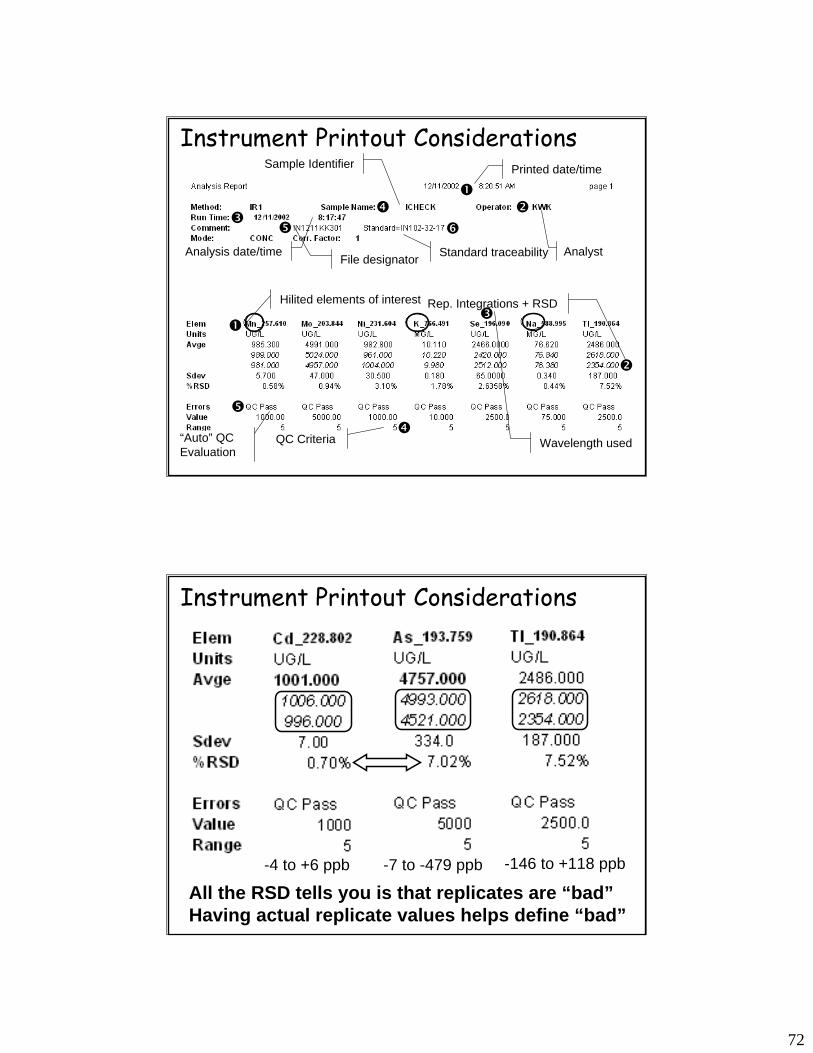
72
Printed date/timeSample Identifier
AnalystAnalysis date/timeFile designator Standard traceability
“Auto” QC Evaluation
QC Criteria
Rep. Integrations + RSDHilited elements of interest
Wavelength used
Instrument Printout Considerations
-4 to +6 ppb -7 to -479 ppb -146 to +118 ppb
All the RSD tells you is that replicates are “bad”Having actual replicate values helps define “bad”
Instrument Printout Considerations
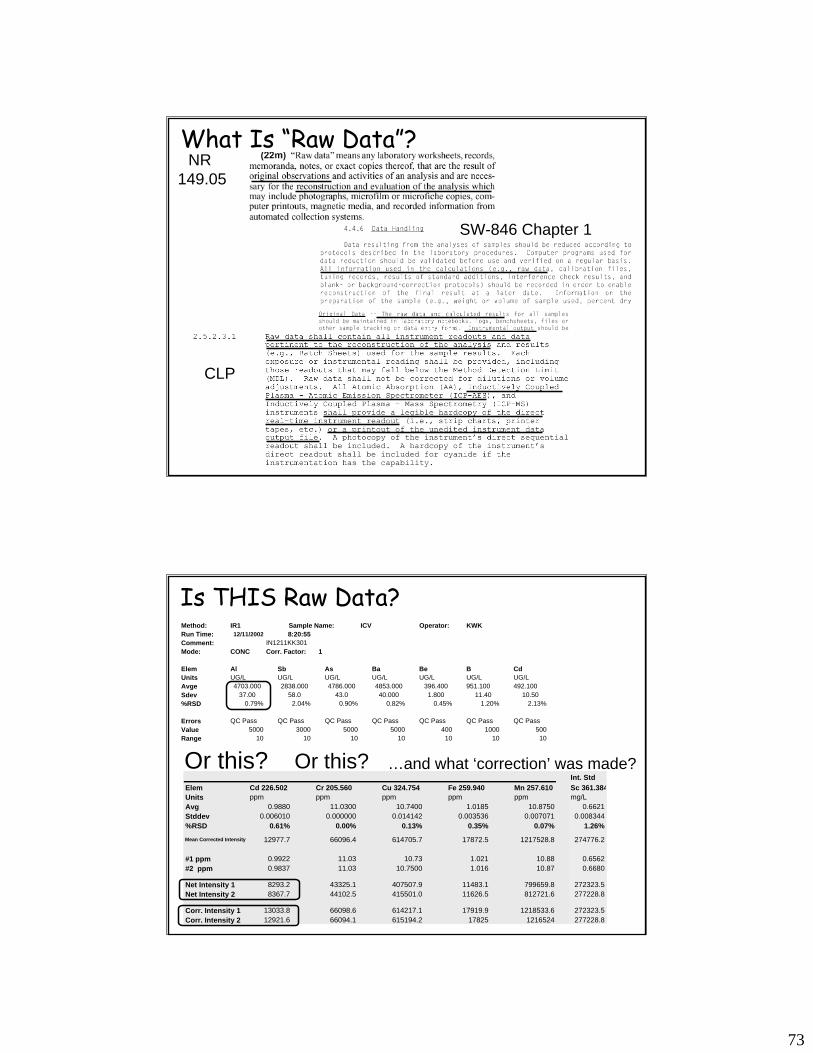
73
What Is “Raw Data”?NR
149.05
SW-846 Chapter 1
CLP
Method: IR1 Sample Name: ICV Operator: KWKRun Time: 12/11/2002 8:20:55Comment: IN1211KK301Mode: CONC Corr. Factor: 1
Elem Al Sb As Ba Be B CdUnits UG/L UG/L UG/L UG/L UG/L UG/L UG/LAvge 4703.000 2838.000 4786.000 4853.000 396.400 951.100 492.100Sdev 37.00 58.0 43.0 40.000 1.800 11.40 10.50%RSD 0.79% 2.04% 0.90% 0.82% 0.45% 1.20% 2.13%
Errors QC Pass QC Pass QC Pass QC Pass QC Pass QC Pass QC PassValue 5000 3000 5000 5000 400 1000 500Range 10 10 10 10 10 10 10
Int. StdElem Cd 226.502 Cr 205.560 Cu 324.754 Fe 259.940 Mn 257.610 Sc 361.384Units ppm ppm ppm ppm ppm mg/LAvg 0.9880 11.0300 10.7400 1.0185 10.8750 0.6621Stddev 0.006010 0.000000 0.014142 0.003536 0.007071 0.008344%RSD 0.61% 0.00% 0.13% 0.35% 0.07% 1.26%
Mean Corrected Intensity 12977.7 66096.4 614705.7 17872.5 1217528.8 274776.2
#1 ppm 0.9922 11.03 10.73 1.021 10.88 0.6562#2 ppm 0.9837 11.03 10.7500 1.016 10.87 0.6680
Net Intensity 1 8293.2 43325.1 407507.9 11483.1 799659.8 272323.5Net Intensity 2 8367.7 44102.5 415501.0 11626.5 812721.6 277228.8
Corr. Intensity 1 13033.8 66098.6 614217.1 17919.9 1218533.6 272323.5Corr. Intensity 2 12921.6 66094.1 615194.2 17825 1216524 277228.8
Is THIS Raw Data?
Or this? Or this? …and what ‘correction’ was made?
74
Do I need to retain emission data?LabCert has reviewed this issue and will not
require labs to retain emission data.Reports will include as a “Recommended Laboratory Practice” that ICP instruments should be capable of providing raw emission data for each wavelengthUltimate goal is to be able to reproduce analyte concentrations from raw, uncorrected emission data. This decision, as it relates to ICP, is not viewed as an exception, but rather as an interpretation of how the Program enforces sections of NR 149.Best parallel situation = GC or GC/MS raw data:• Raw data required = peak area• peak area is equivalent to ICP emission counts• GC: Peak area can be traced to final results• ICP: Emissions cannot (easily) be traced to final result
1. The code is the law, and in all cases, labs must meet code requirements.
2. Labs can be held to method requirements that are also addressed by code if the method requirements are as or more stringent than the code requirement:
•If a method is STRICTER than code requirement ---->method •If a method is LESS STRICT than code requirement---->code
3. Labs can also be held to specific or unique method requirements if the code is silent on the subject of that particular requirement.
An example: If a given method provides requirements for acceptable blank performance that are more stringent than the blank acceptance criteria listed in NR 149.14(3)(d), the laboratory can be held to the requirement of the method.
Which Do I Follow? The Code or the Method (or Both?)
If, however, the method requirements are less stringent than 149.14(3)(d), the lab will be held to the code requirements regardless of what the method states.
In MOST cases, passages using "should" are considered recommendations, while language using "must" are considered requirements. This is a general rule of thumb, and certain cases may provide justification for alternate interpretations.
75
200.7CFR version?EPA version?
Revision #? (currently rev. 4.4, 1994)Draft revision 5.0 out since Aug 1998
SW-8466010--> 6010B --> 6010C
Standard MethodsSM 3120B (18th, 19th, 20th ed.s approved)
+1020…to cover QA/QC
Authoritative Sources
Things to Come?•Proposed revision to MDL procedure (FR 3/12/03)
•Draft Revision 5 to 200.7 (8/98)•an actual IDC•new spike acceptance criteria• formal use of minimum level (ML) concept•new blank criteria: greater of (ML or 1/3 reg. criteria)
•new calibration requirements• lowest point must be equal to the “ML”• should include a standard at the LDR• calculate response factors• performance criteria to be established “later”
• Interferent concentrations must not exceed LDR
76
Internal audit as a tool for improving data quality
1.Purpose of an Internal Audit: Meet quality goals:A. Insure that the analysts are following procedures specified in
the lab’s methods and in the regulatory methods.B. Promote consistent practices from test to test throughout the
laboratory.C. Insure that the laboratory is meeting requirements of regulating
agencies (e.g. NELAC, USEPA, WDNR). Note: internal audits are a NELAC requirement.
2.Who Conducts an Internal Audit?
A. Ideally, a quality control coordinator.B. Someone who has a general knowledge of the procedure and
who is independent of the activity to be audited
A. Review method documentation to be sure it is up-to-date, complete, and meets regulations.1. Review the SOP:
• Does the SOP meet requirements of the reference method? Note any deviations.
Example: 200.7, 9.2.2: verify the LDR annually or when there is achange in operating conditions.
• Does the SOP meet requirements of any applicable NELAC, EPA, orDNR regulations?
Example: NR149.14(3)(c): analyze a known standard every 20 samples (limit ± 10%). However 200.7, 9.3.4 requires an Instrument Performance Check (IPC) after the calibration (limit ± 5%), every 10 samples (limit ± 10%), and at the end of the run (limit ± 10%). The lab's SOP should follow 200.7.
• Does the SOP follow a standard format for organization and content? A standard format makes items easier to find and insures that all requirements will be included. Corrective action language (e.g. what action will be taken if a spike fails?) is important to include.
What Is An Internal Audit
77
A. Review method documentation to be sure it is up-to-date, complete, and meets regulations.2. Review analyst training records, DOCs, LOD verifications,
LDR verifications, IEC factors, etc.
B. Review PT sample results analyzed by the method and any exceedance reports that may have been filed. Example: Arsenic by ICP failed an internal blind --
we discovered that the As standard was contaminated (but not at a level that would show in routine QC samples).
C. Review data to insure the analyst followed required procedures.1. Have the required quality control samples been analyzed and properly
recorded?
Note: the terminology (e.g. Spike vs. Lab Fortified Matrix) that will be used on the bench records should be recorded in the SOP.
What Is An Internal Audit
C. Review data to insure the analyst followed required procedures.2. Was the calibration done according to the method?3. Are data clearly recorded and manipulations clearly marked?4. Were the data reviewed by a second person before being reported?
5. Were the data properly reported and filed?
D. Check logbooks for proper entries. Example: Reagent/standard preparation log provides traceability.
Instrument log contains items such as dates used,instruments settings, and maintenance performed.
What Is An Internal Audit
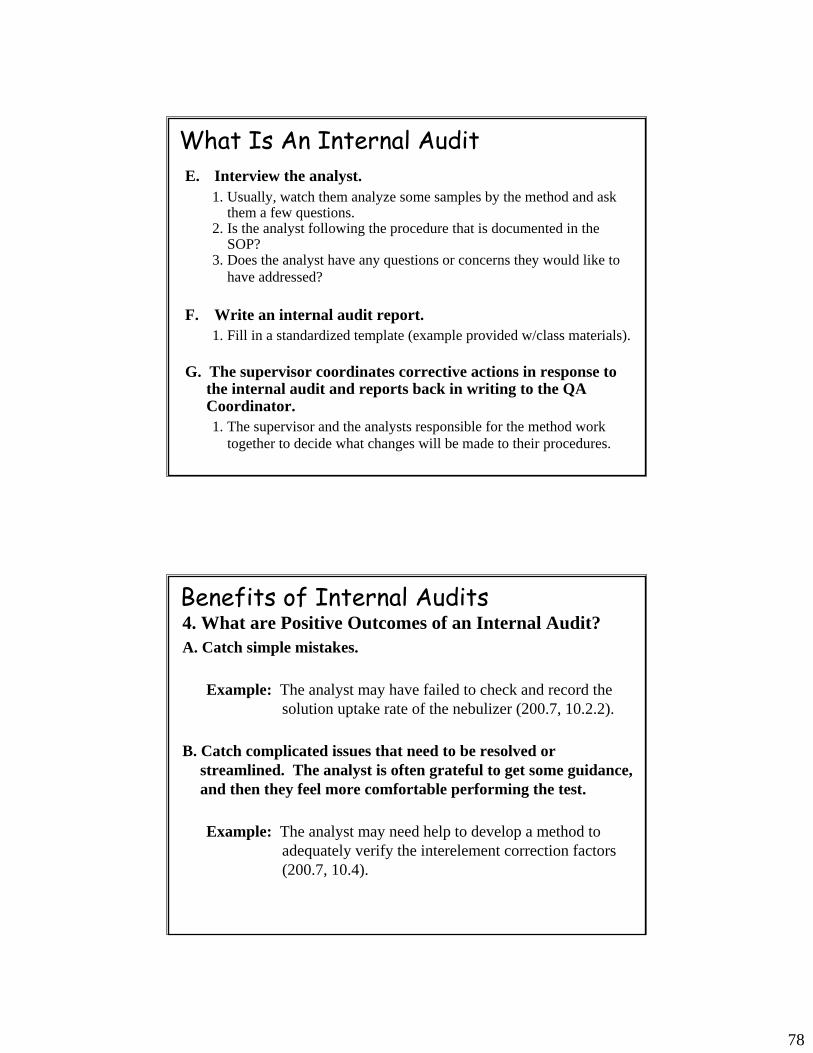
78
E. Interview the analyst.1. Usually, watch them analyze some samples by the method and ask
them a few questions.2. Is the analyst following the procedure that is documented in the
SOP?3. Does the analyst have any questions or concerns they would like to
have addressed?
F. Write an internal audit report.1. Fill in a standardized template (example provided w/class materials).
G. The supervisor coordinates corrective actions in response to the internal audit and reports back in writing to the QA Coordinator.1. The supervisor and the analysts responsible for the method work
together to decide what changes will be made to their procedures.
What Is An Internal Audit
4. What are Positive Outcomes of an Internal Audit?A. Catch simple mistakes.
Example: The analyst may have failed to check and record the solution uptake rate of the nebulizer (200.7, 10.2.2).
B. Catch complicated issues that need to be resolved or streamlined. The analyst is often grateful to get some guidance, and then they feel more comfortable performing the test.
Example: The analyst may need help to develop a method toadequately verify the interelement correction factors(200.7, 10.4).
Benefits of Internal Audits
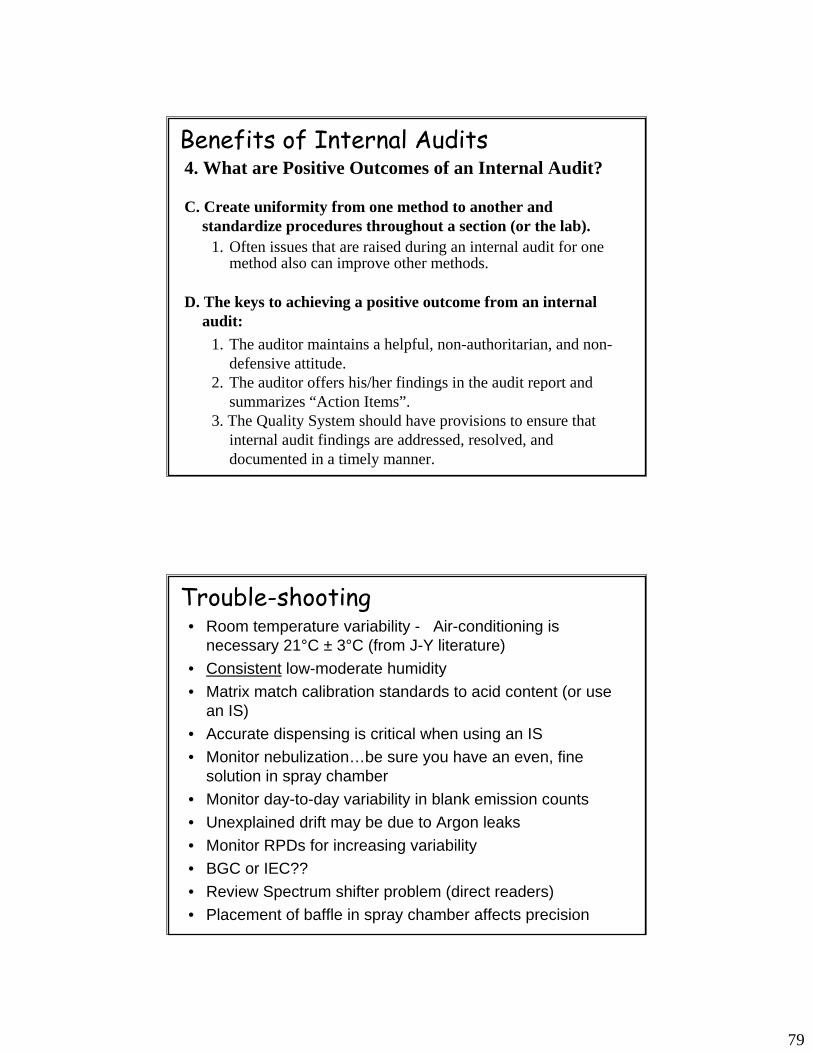
79
4. What are Positive Outcomes of an Internal Audit?
C. Create uniformity from one method to another and standardize procedures throughout a section (or the lab).
1. Often issues that are raised during an internal audit for one method also can improve other methods.
D. The keys to achieving a positive outcome from an internal audit:
1. The auditor maintains a helpful, non-authoritarian, and non-defensive attitude.
2. The auditor offers his/her findings in the audit report and summarizes “Action Items”.
3. The Quality System should have provisions to ensure that internal audit findings are addressed, resolved, and documented in a timely manner.
Benefits of Internal Audits
• Room temperature variability - Air-conditioning is necessary 21°C ± 3°C (from J-Y literature)
• Consistent low-moderate humidity• Matrix match calibration standards to acid content (or use
an IS)• Accurate dispensing is critical when using an IS • Monitor nebulization…be sure you have an even, fine
solution in spray chamber• Monitor day-to-day variability in blank emission counts• Unexplained drift may be due to Argon leaks• Monitor RPDs for increasing variability• BGC or IEC??• Review Spectrum shifter problem (direct readers)• Placement of baffle in spray chamber affects precision
Trouble-shooting
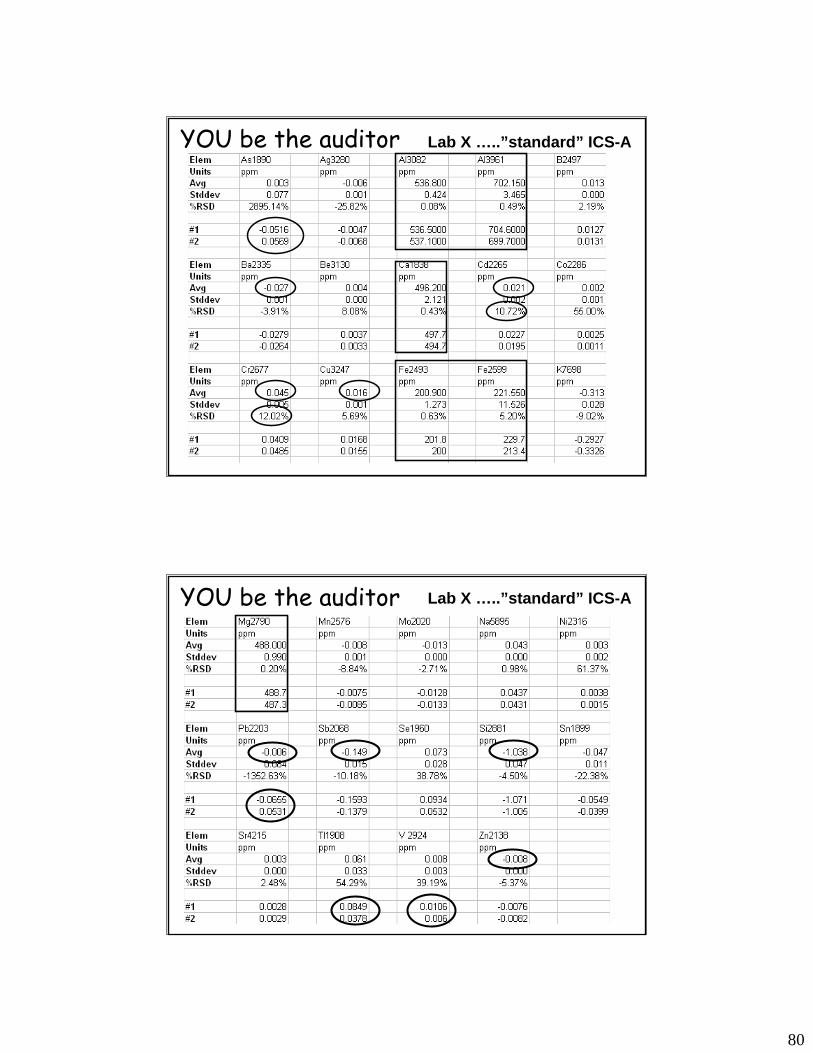
80
YOU be the auditor Lab X …..”standard” ICS-A
…and the rest of the elements in the run….YOU be the auditor Lab X …..”standard” ICS-A
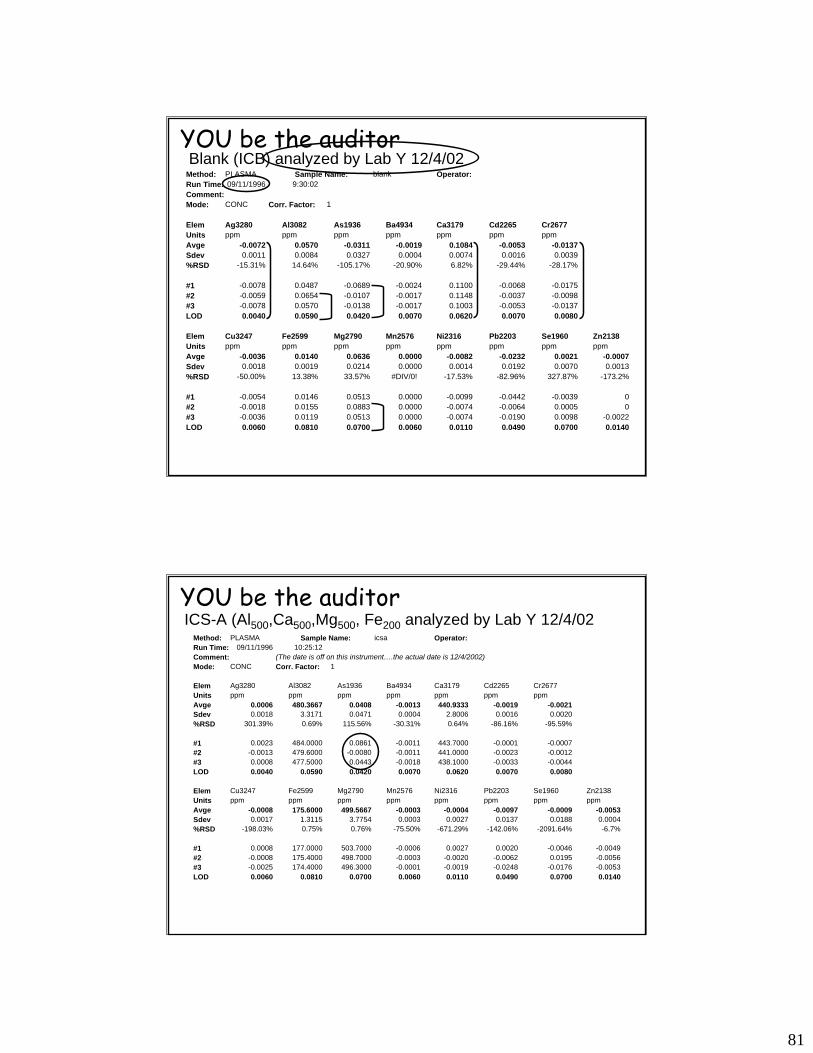
81
Method: PLASMA Sample Name: blank Operator:Run Time: 09/11/1996 9:30:02Comment:Mode: CONC Corr. Factor: 1
Elem Ag3280 Al3082 As1936 Ba4934 Ca3179 Cd2265 Cr2677Units ppm ppm ppm ppm ppm ppm ppmAvge -0.0072 0.0570 -0.0311 -0.0019 0.1084 -0.0053 -0.0137Sdev 0.0011 0.0084 0.0327 0.0004 0.0074 0.0016 0.0039%RSD -15.31% 14.64% -105.17% -20.90% 6.82% -29.44% -28.17%
#1 -0.0078 0.0487 -0.0689 -0.0024 0.1100 -0.0068 -0.0175#2 -0.0059 0.0654 -0.0107 -0.0017 0.1148 -0.0037 -0.0098#3 -0.0078 0.0570 -0.0138 -0.0017 0.1003 -0.0053 -0.0137LOD 0.0040 0.0590 0.0420 0.0070 0.0620 0.0070 0.0080
Elem Cu3247 Fe2599 Mg2790 Mn2576 Ni2316 Pb2203 Se1960 Zn2138Units ppm ppm ppm ppm ppm ppm ppm ppmAvge -0.0036 0.0140 0.0636 0.0000 -0.0082 -0.0232 0.0021 -0.0007Sdev 0.0018 0.0019 0.0214 0.0000 0.0014 0.0192 0.0070 0.0013%RSD -50.00% 13.38% 33.57% #DIV/0! -17.53% -82.96% 327.87% -173.2%
#1 -0.0054 0.0146 0.0513 0.0000 -0.0099 -0.0442 -0.0039 0#2 -0.0018 0.0155 0.0883 0.0000 -0.0074 -0.0064 0.0005 0#3 -0.0036 0.0119 0.0513 0.0000 -0.0074 -0.0190 0.0098 -0.0022LOD 0.0060 0.0810 0.0700 0.0060 0.0110 0.0490 0.0700 0.0140
YOU be the auditorBlank (ICB) analyzed by Lab Y 12/4/02
Method: PLASMA Sample Name: icsa Operator:Run Time: 09/11/1996 10:25:12Comment: (The date is off on this instrument….the actual date is 12/4/2002)Mode: CONC Corr. Factor: 1
Elem Ag3280 Al3082 As1936 Ba4934 Ca3179 Cd2265 Cr2677Units ppm ppm ppm ppm ppm ppm ppmAvge 0.0006 480.3667 0.0408 -0.0013 440.9333 -0.0019 -0.0021Sdev 0.0018 3.3171 0.0471 0.0004 2.8006 0.0016 0.0020%RSD 301.39% 0.69% 115.56% -30.31% 0.64% -86.16% -95.59%
#1 0.0023 484.0000 0.0861 -0.0011 443.7000 -0.0001 -0.0007#2 -0.0013 479.6000 -0.0080 -0.0011 441.0000 -0.0023 -0.0012#3 0.0008 477.5000 0.0443 -0.0018 438.1000 -0.0033 -0.0044LOD 0.0040 0.0590 0.0420 0.0070 0.0620 0.0070 0.0080
Elem Cu3247 Fe2599 Mg2790 Mn2576 Ni2316 Pb2203 Se1960 Zn2138Units ppm ppm ppm ppm ppm ppm ppm ppmAvge -0.0008 175.6000 499.5667 -0.0003 -0.0004 -0.0097 -0.0009 -0.0053Sdev 0.0017 1.3115 3.7754 0.0003 0.0027 0.0137 0.0188 0.0004%RSD -198.03% 0.75% 0.76% -75.50% -671.29% -142.06% -2091.64% -6.7%
#1 0.0008 177.0000 503.7000 -0.0006 0.0027 0.0020 -0.0046 -0.0049#2 -0.0008 175.4000 498.7000 -0.0003 -0.0020 -0.0062 0.0195 -0.0056#3 -0.0025 174.4000 496.3000 -0.0001 -0.0019 -0.0248 -0.0176 -0.0053LOD 0.0060 0.0810 0.0700 0.0060 0.0110 0.0490 0.0700 0.0140
ICS-A (Al500,Ca500,Mg500, Fe200 analyzed by Lab Y 12/4/02YOU be the auditor
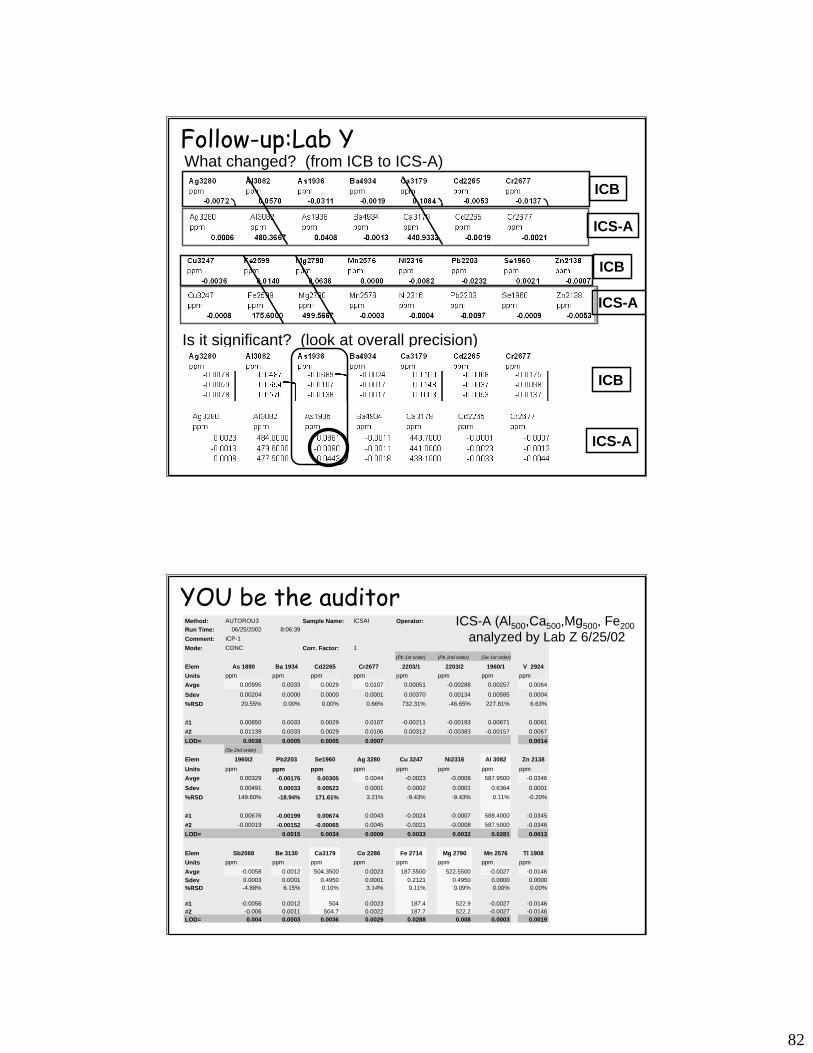
82
What changed? (from ICB to ICS-A)
Is it significant? (look at overall precision)
ICB
ICS-A
ICB
ICS-A
ICB
ICS-A
Follow-up:Lab Y
Method: AUTOROU3 Sample Name: ICSAI Operator:Run Time: 06/25/2002 8:06:39Comment: ICP-1Mode: CONC Corr. Factor: 1
(Pb 1st order) (Pb 2nd order) (Se 1st order)
Elem As 1890 Ba 1934 Cd2265 Cr2677 2203/1 2203/2 1960/1 V 2924Units ppm ppm ppm ppm ppm ppm ppm ppmAvge 0.00995 0.0033 0.0029 0.0107 0.00051 -0.00288 0.00257 0.0064
Sdev 0.00204 0.0000 0.0000 0.0001 0.00370 0.00134 0.00585 0.0004%RSD 20.55% 0.00% 0.00% 0.66% 732.31% -46.65% 227.81% 6.63%
#1 0.00850 0.0033 0.0029 0.0107 -0.00211 -0.00193 0.00671 0.0061#2 0.01139 0.0033 0.0029 0.0106 0.00312 -0.00383 -0.00157 0.0067LOD= 0.0036 0.0005 0.0005 0.0007 0.0014
(Se 2nd order)
Elem 1960/2 Pb2203 Se1960 Ag 3280 Cu 3247 Ni2316 Al 3082 Zn 2138Units ppm ppm ppm ppm ppm ppm ppm ppmAvge 0.00329 -0.00176 0.00305 0.0044 -0.0023 -0.0008 587.9500 -0.0346
Sdev 0.00491 0.00033 0.00523 0.0001 0.0002 0.0001 0.6364 0.0001%RSD 149.60% -18.94% 171.61% 3.21% -9.43% -9.43% 0.11% -0.20%
#1 0.00676 -0.00199 0.00674 0.0043 -0.0024 -0.0007 588.4000 -0.0345#2 -0.00019 -0.00152 -0.00065 0.0045 -0.0021 -0.0008 587.5000 -0.0346LOD= 0.0015 0.0034 0.0009 0.0033 0.0032 0.0281 0.0013
Elem Sb2068 Be 3130 Ca3179 Co 2286 Fe 2714 Mg 2790 Mn 2576 Tl 1908Units ppm ppm ppm ppm ppm ppm ppm ppmAvge -0.0058 0.0012 504.3500 0.0023 187.5500 522.5500 -0.0027 -0.0146Sdev 0.0003 0.0001 0.4950 0.0001 0.2121 0.4950 0.0000 0.0000%RSD -4.88% 6.15% 0.10% 3.14% 0.11% 0.09% 0.00% 0.00%
#1 -0.0056 0.0012 504 0.0023 187.4 522.9 -0.0027 -0.0146#2 -0.006 0.0011 504.7 0.0022 187.7 522.2 -0.0027 -0.0146LOD= 0.004 0.0003 0.0036 0.0029 0.0288 0.008 0.0003 0.0019
YOU be the auditorICS-A (Al500,Ca500,Mg500, Fe200
analyzed by Lab Z 6/25/02
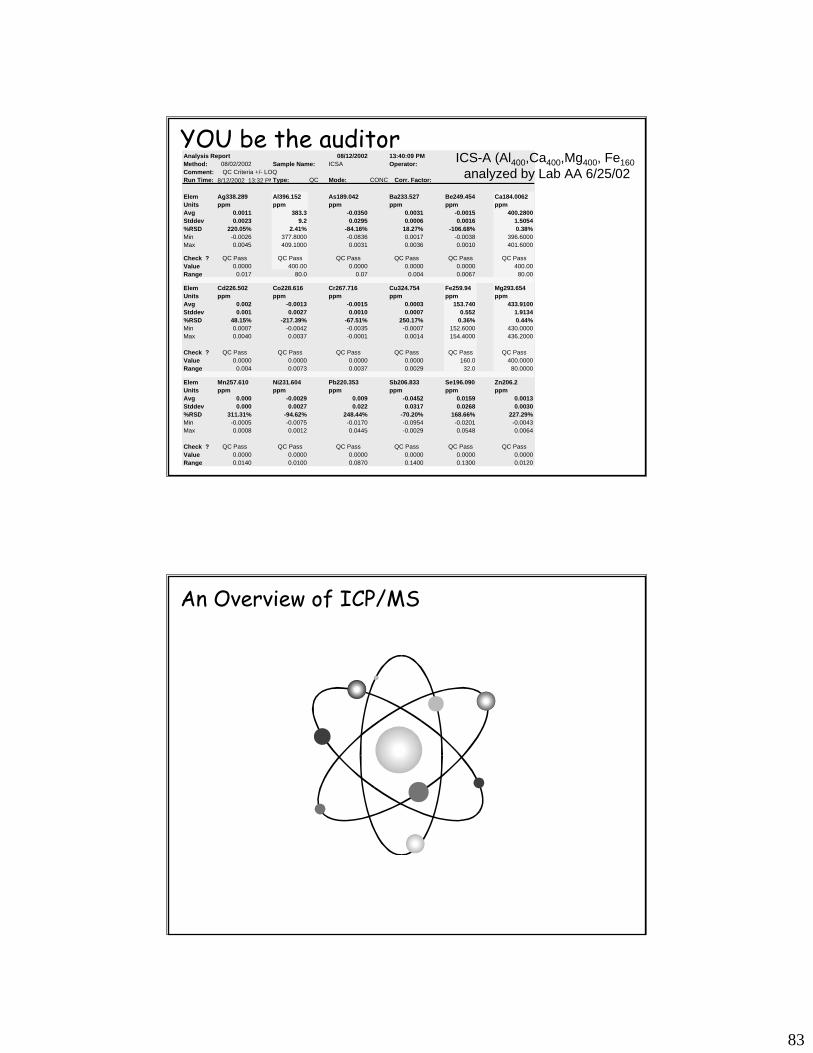
83
Analysis Report 08/12/2002 13:40:09 PMMethod: 08/02/2002 Sample Name: ICSA Operator:Comment: QC Criteria +/- LOQRun Time: Type: QC Mode: CONC Corr. Factor:
Elem Ag338.289 Al396.152 As189.042 Ba233.527 Be249.454 Ca184.0062Units ppm ppm ppm ppm ppm ppmAvg 0.0011 383.3 -0.0350 0.0031 -0.0015 400.2800Stddev 0.0023 9.2 0.0295 0.0006 0.0016 1.5054%RSD 220.05% 2.41% -84.16% 18.27% -106.68% 0.38%Min -0.0026 377.8000 -0.0836 0.0017 -0.0038 396.6000Max 0.0045 409.1000 0.0031 0.0036 0.0010 401.6000
Check ? QC Pass QC Pass QC Pass QC Pass QC Pass QC PassValue 0.0000 400.00 0.0000 0.0000 0.0000 400.00Range 0.017 80.0 0.07 0.004 0.0067 80.00
Elem Cd226.502 Co228.616 Cr267.716 Cu324.754 Fe259.94 Mg293.654Units ppm ppm ppm ppm ppm ppmAvg 0.002 -0.0013 -0.0015 0.0003 153.740 433.9100Stddev 0.001 0.0027 0.0010 0.0007 0.552 1.9134%RSD 48.15% -217.39% -67.51% 250.17% 0.36% 0.44%Min 0.0007 -0.0042 -0.0035 -0.0007 152.6000 430.0000Max 0.0040 0.0037 -0.0001 0.0014 154.4000 436.2000
Check ? QC Pass QC Pass QC Pass QC Pass QC Pass QC PassValue 0.0000 0.0000 0.0000 0.0000 160.0 400.0000Range 0.004 0.0073 0.0037 0.0029 32.0 80.0000
Elem Mn257.610 Ni231.604 Pb220.353 Sb206.833 Se196.090 Zn206.2Units ppm ppm ppm ppm ppm ppmAvg 0.000 -0.0029 0.009 -0.0452 0.0159 0.0013Stddev 0.000 0.0027 0.022 0.0317 0.0268 0.0030%RSD 311.31% -94.62% 248.44% -70.20% 168.66% 227.29%Min -0.0005 -0.0075 -0.0170 -0.0954 -0.0201 -0.0043Max 0.0008 0.0012 0.0445 -0.0029 0.0548 0.0064
Check ? QC Pass QC Pass QC Pass QC Pass QC Pass QC PassValue 0.0000 0.0000 0.0000 0.0000 0.0000 0.0000Range 0.0140 0.0100 0.0870 0.1400 0.1300 0.0120
8/12/2002 13:32 PM
ICS-A (Al400,Ca400,Mg400, Fe160analyzed by Lab AA 6/25/02
YOU be the auditor
An Overview of ICP/MS
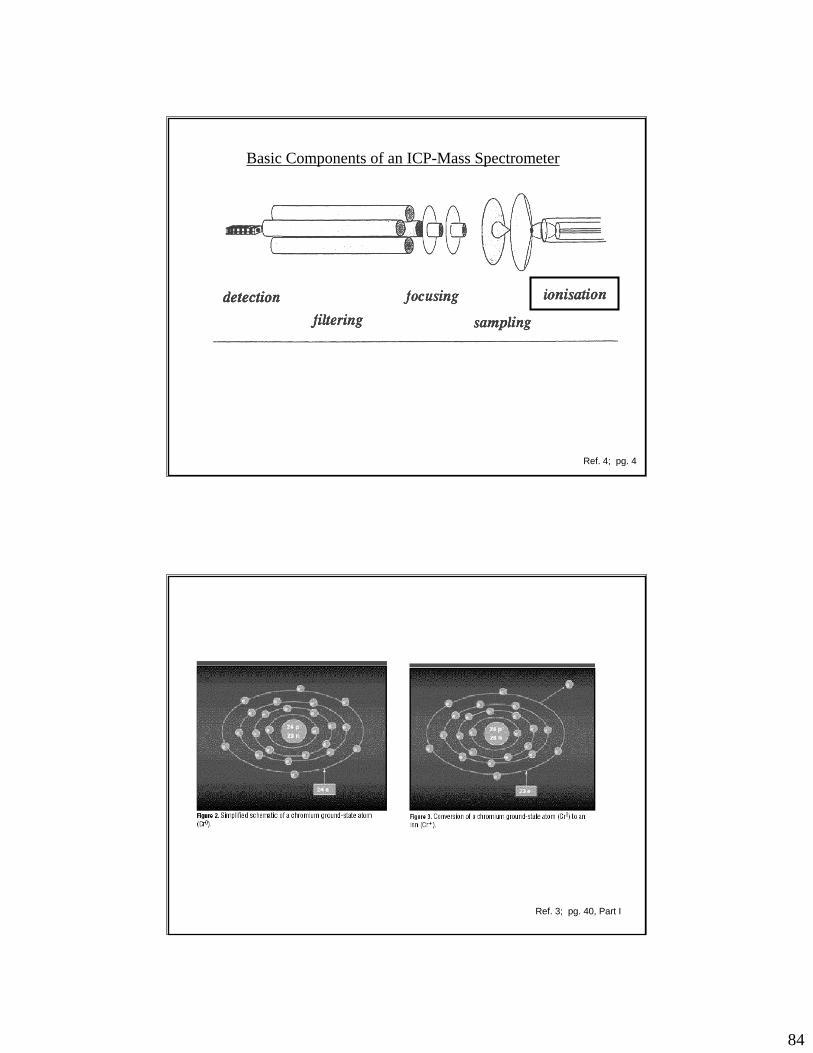
84
Basic Components of an ICP-Mass Spectrometer
Ref. 4; pg. 4
Ref. 3; pg. 40, Part I
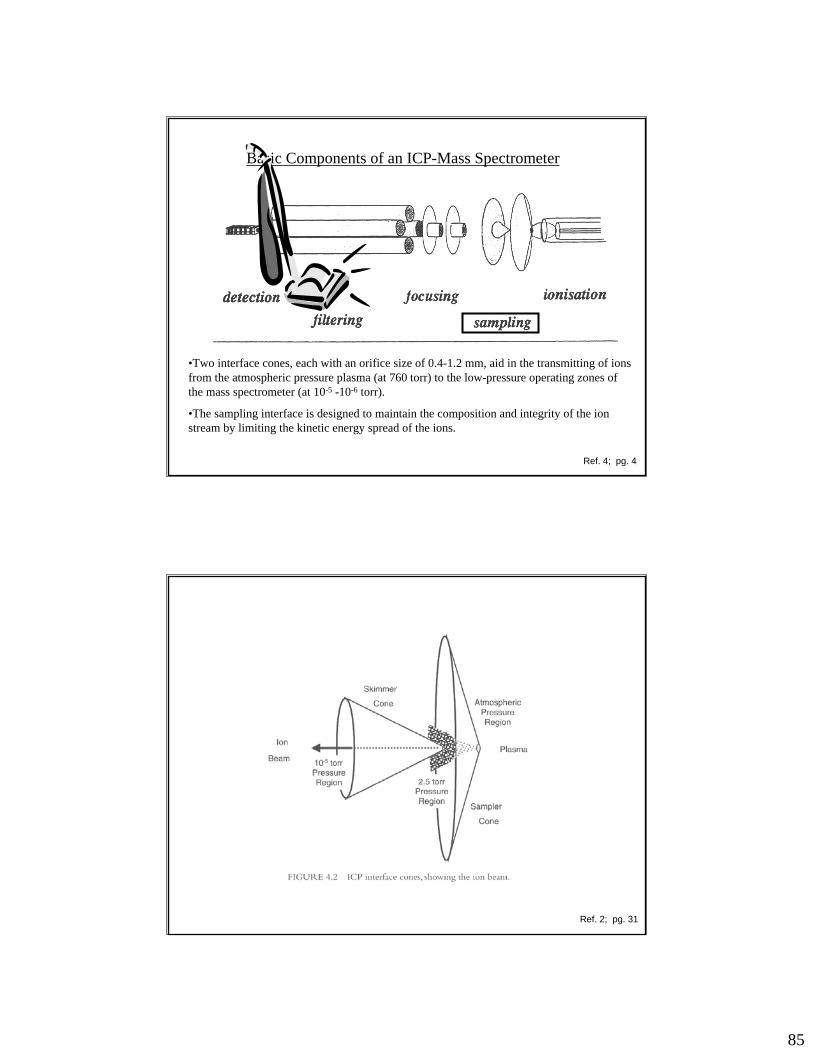
85
Basic Components of an ICP-Mass Spectrometer
•Two interface cones, each with an orifice size of 0.4-1.2 mm, aid in the transmitting of ions from the atmospheric pressure plasma (at 760 torr) to the low-pressure operating zones of the mass spectrometer (at 10-5 -10-6 torr).
•The sampling interface is designed to maintain the composition and integrity of the ion stream by limiting the kinetic energy spread of the ions.
Ref. 4; pg. 4
Ref. 2; pg. 31
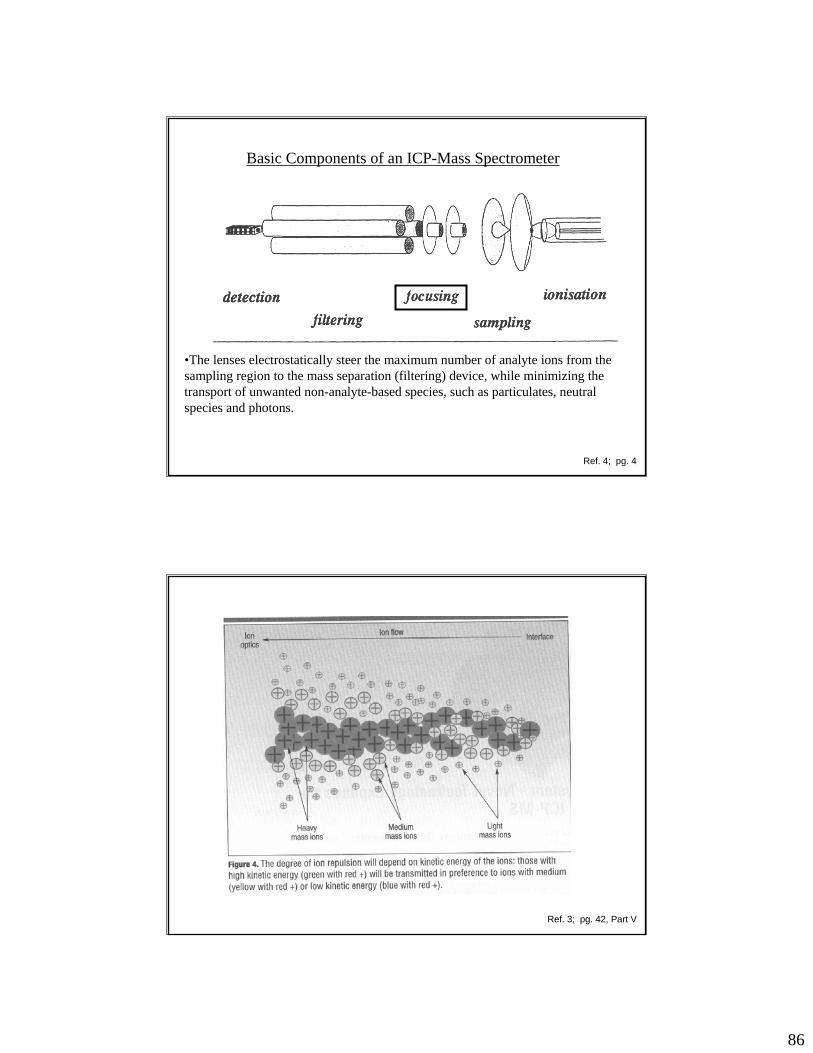
86
Basic Components of an ICP-Mass Spectrometer
•The lenses electrostatically steer the maximum number of analyte ions from the sampling region to the mass separation (filtering) device, while minimizing the transport of unwanted non-analyte-based species, such as particulates, neutral species and photons.
Ref. 4; pg. 4
Ref. 3; pg. 42, Part V
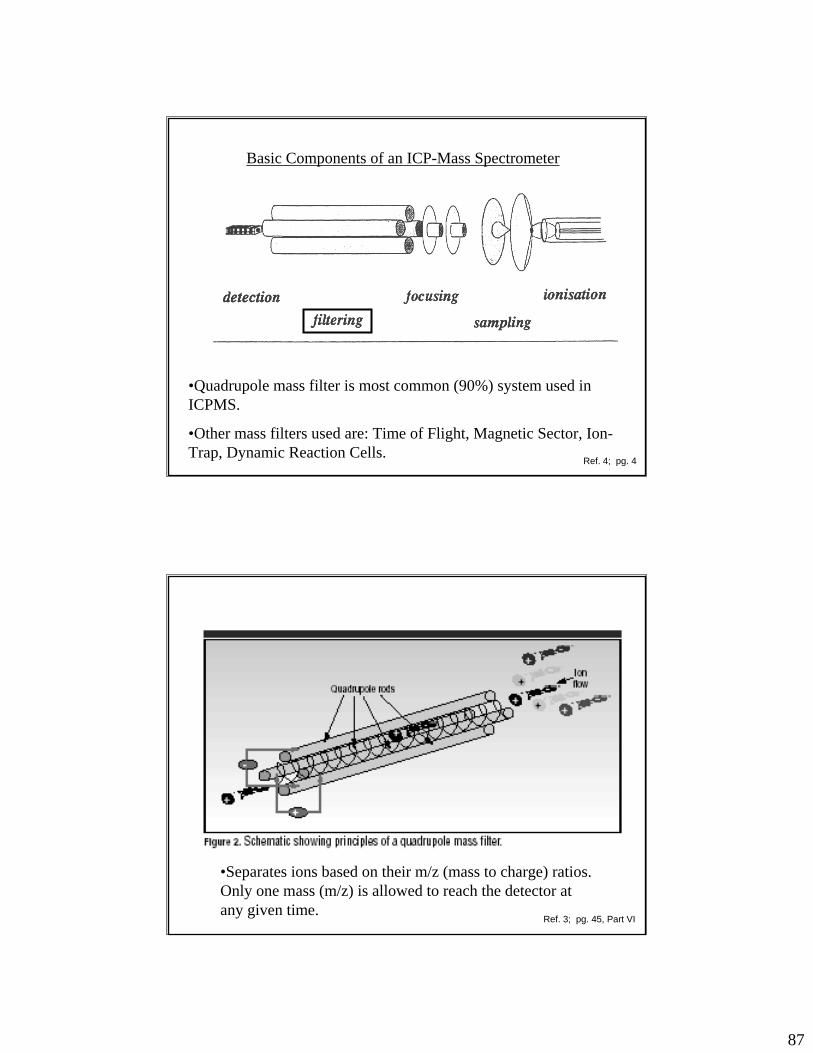
87
Basic Components of an ICP-Mass Spectrometer
•Quadrupole mass filter is most common (90%) system used in ICPMS.
•Other mass filters used are: Time of Flight, Magnetic Sector, Ion-Trap, Dynamic Reaction Cells.
Ref. 4; pg. 4
Ref. 3; pg. 45, Part VI
•Separates ions based on their m/z (mass to charge) ratios. Only one mass (m/z) is allowed to reach the detector at any given time.
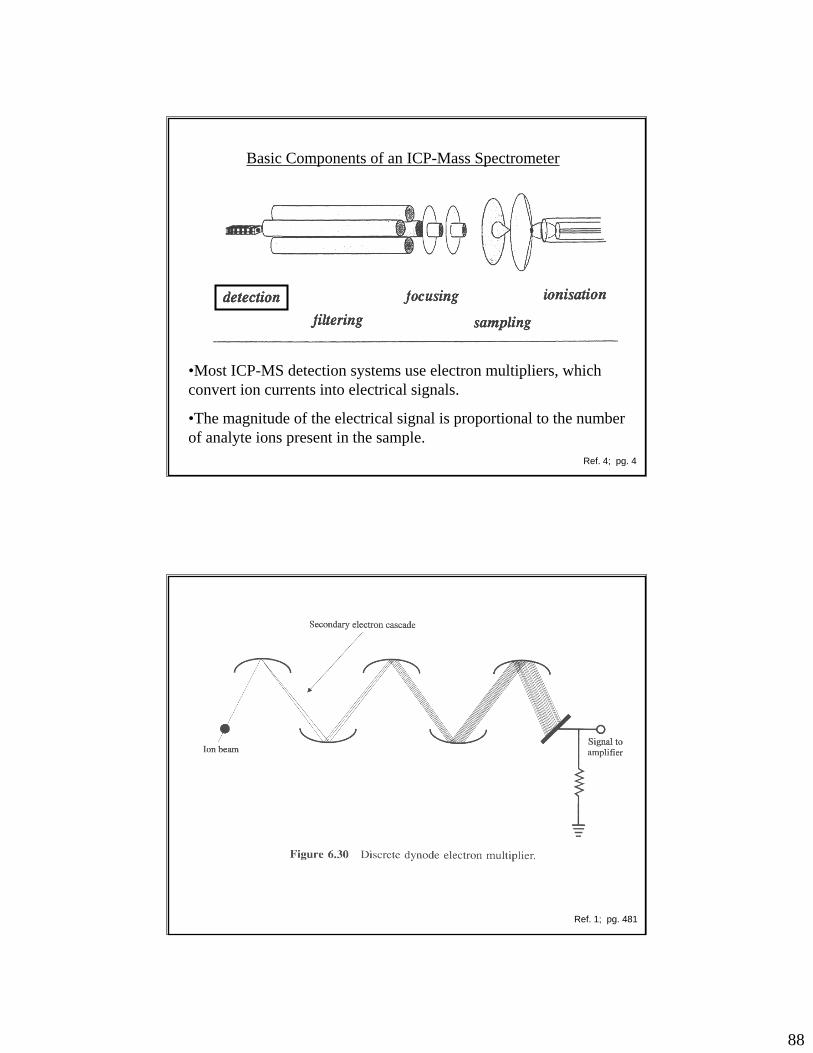
88
Basic Components of an ICP-Mass Spectrometer
•Most ICP-MS detection systems use electron multipliers, which convert ion currents into electrical signals.
•The magnitude of the electrical signal is proportional to the number of analyte ions present in the sample.
Ref. 4; pg. 4
Ref. 1; pg. 481
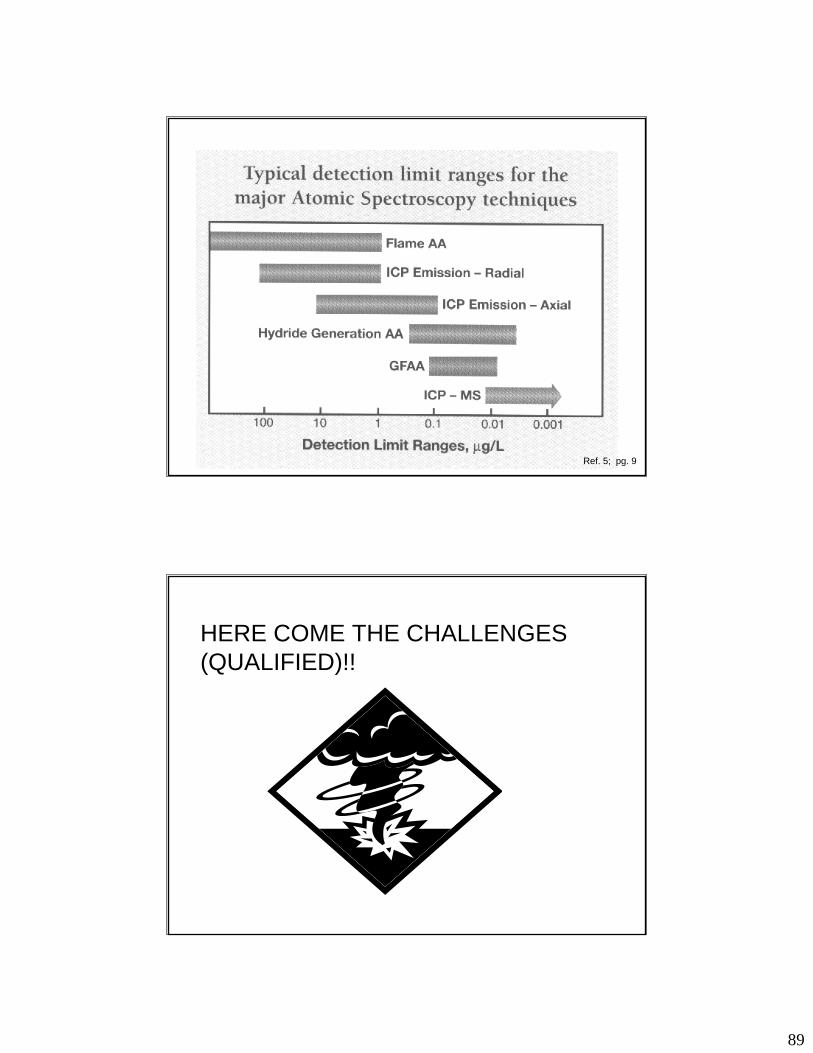
89
Ref. 5; pg. 9
HERE COME THE CHALLENGES (QUALIFIED)!!
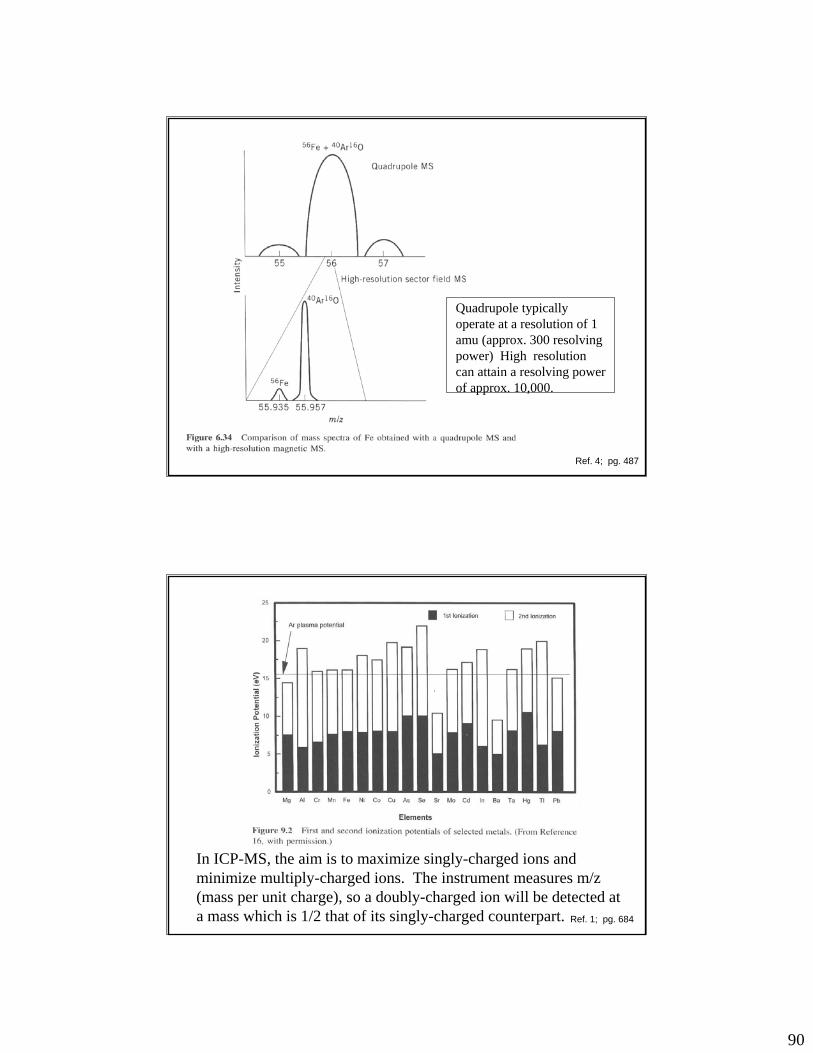
90
Quadrupole typically operate at a resolution of 1 amu (approx. 300 resolving power) High resolution can attain a resolving power of approx. 10,000.
Ref. 4; pg. 487
In ICP-MS, the aim is to maximize singly-charged ions and minimize multiply-charged ions. The instrument measures m/z (mass per unit charge), so a doubly-charged ion will be detected at a mass which is 1/2 that of its singly-charged counterpart. Ref. 1; pg. 684
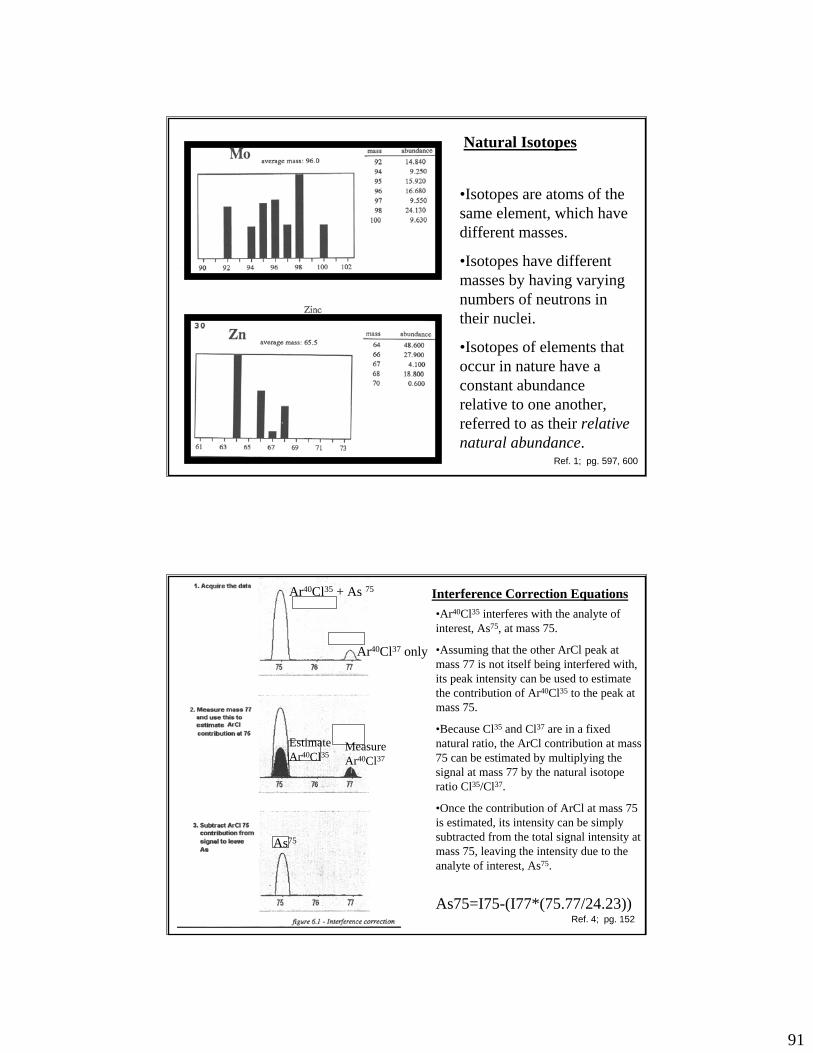
91
•Isotopes are atoms of the same element, which have different masses.
•Isotopes have different masses by having varying numbers of neutrons in their nuclei.
•Isotopes of elements that occur in nature have a constant abundance relative to one another, referred to as their relative natural abundance.
Natural Isotopes
Ref. 1; pg. 597, 600
Ar40Cl35 + As 75
Ar40Cl37 only
Measure Ar40Cl37
Estimate Ar40Cl35
As75
Interference Correction Equations•Ar40Cl35 interferes with the analyte of interest, As75, at mass 75.
•Assuming that the other ArCl peak at mass 77 is not itself being interfered with, its peak intensity can be used to estimate the contribution of Ar40Cl35 to the peak at mass 75.
•Because Cl35 and Cl37 are in a fixed natural ratio, the ArCl contribution at mass 75 can be estimated by multiplying the signal at mass 77 by the natural isotope ratio Cl35/Cl37.
•Once the contribution of ArCl at mass 75 is estimated, its intensity can be simply subtracted from the total signal intensity at mass 75, leaving the intensity due to the analyte of interest, As75.
As75=I75-(I77*(75.77/24.23))Ref. 4; pg. 152
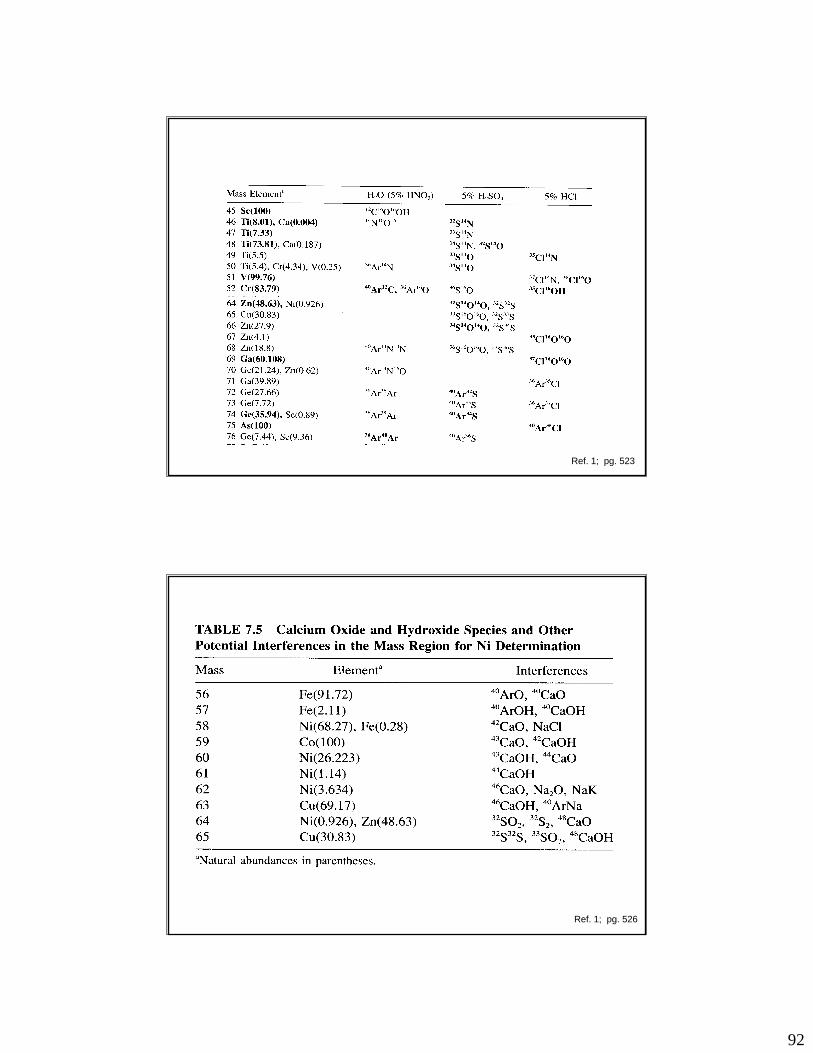
92
Ref. 1; pg. 523
Ref. 1; pg. 526
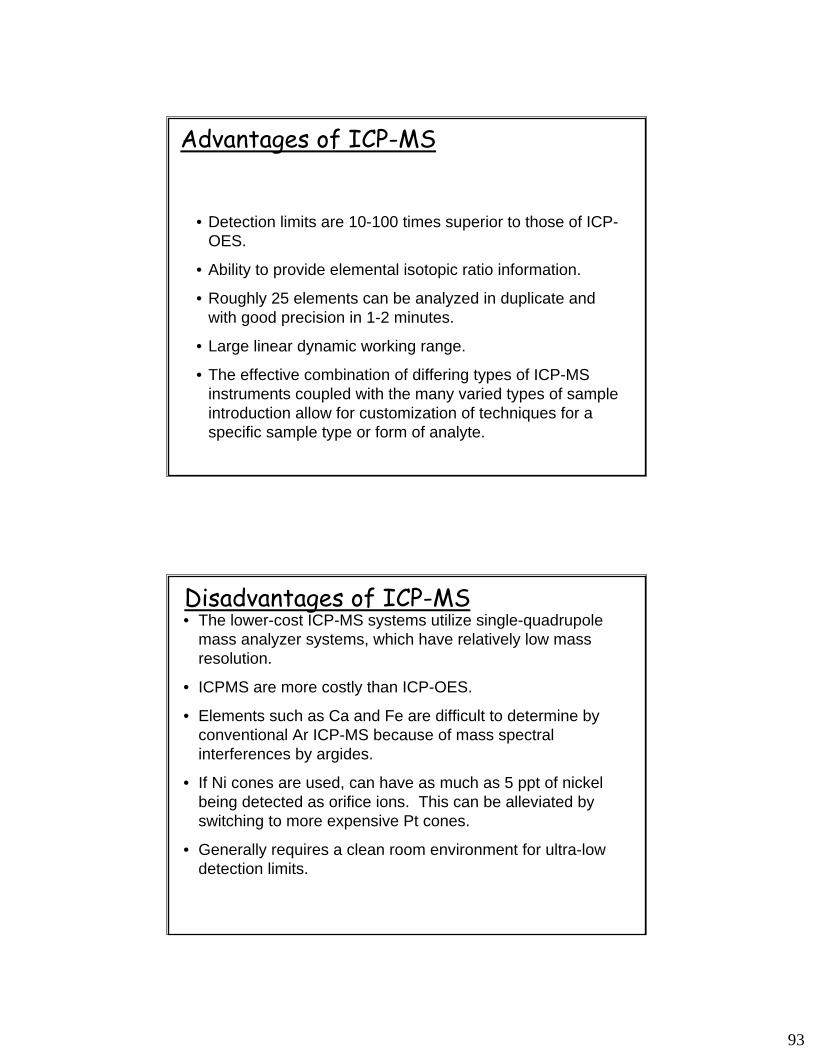
93
Advantages of ICP-MS
• Detection limits are 10-100 times superior to those of ICP-OES.
• Ability to provide elemental isotopic ratio information.
• Roughly 25 elements can be analyzed in duplicate and with good precision in 1-2 minutes.
• Large linear dynamic working range.
• The effective combination of differing types of ICP-MS instruments coupled with the many varied types of sample introduction allow for customization of techniques for a specific sample type or form of analyte.
Disadvantages of ICP-MS• The lower-cost ICP-MS systems utilize single-quadrupole
mass analyzer systems, which have relatively low mass resolution.
• ICPMS are more costly than ICP-OES.
• Elements such as Ca and Fe are difficult to determine by conventional Ar ICP-MS because of mass spectral interferences by argides.
• If Ni cones are used, can have as much as 5 ppt of nickel being detected as orifice ions. This can be alleviated by switching to more expensive Pt cones.
• Generally requires a clean room environment for ultra-low detection limits.
94
Disadvantages of ICP-MS
•An outstanding ICP-OES instrument offers a long-term RSD of less than 1% compared to less than 4% for most ICP-MS systems.
•The presence of oxides and doubly-charged ions in the plasma deteriorates the quantitative capability of ICP-MS in ultratrace analysis.
•ICP-MS instruments are more susceptible to instability than ICP-OES intruments when running samples with higher levels of total dissolved solids.
•The relatively cooler sampler and skimmer cones provide direct contact points for sample deposition from the plasma, and can become clogged over time when difficult matrices are analyzed.
References(1) Montaser, A., Ed., Inductively Coupled Plasma Mass Spectrometry, Wiley-VCH, New York, 1998.
(2) Taylor, H.E., Inductively Coupled Plasma Mass Spectrometry, Academic Press, San Diego, 2001.
(3) Thomas, R., “A Beginner’s Guide to ICP-MS”, Spectroscopy magazine, April 2001 - February 2003, in 14 parts.
(4) VG Elemental, PlasmaQuad Software Manual, VG PlasmaQuad 3 User’s Guide.
(5) TJA Solutions, “AAS, FAAS, ICP, or ICP/MS? Which Technique Should I Use?”. March 2000.
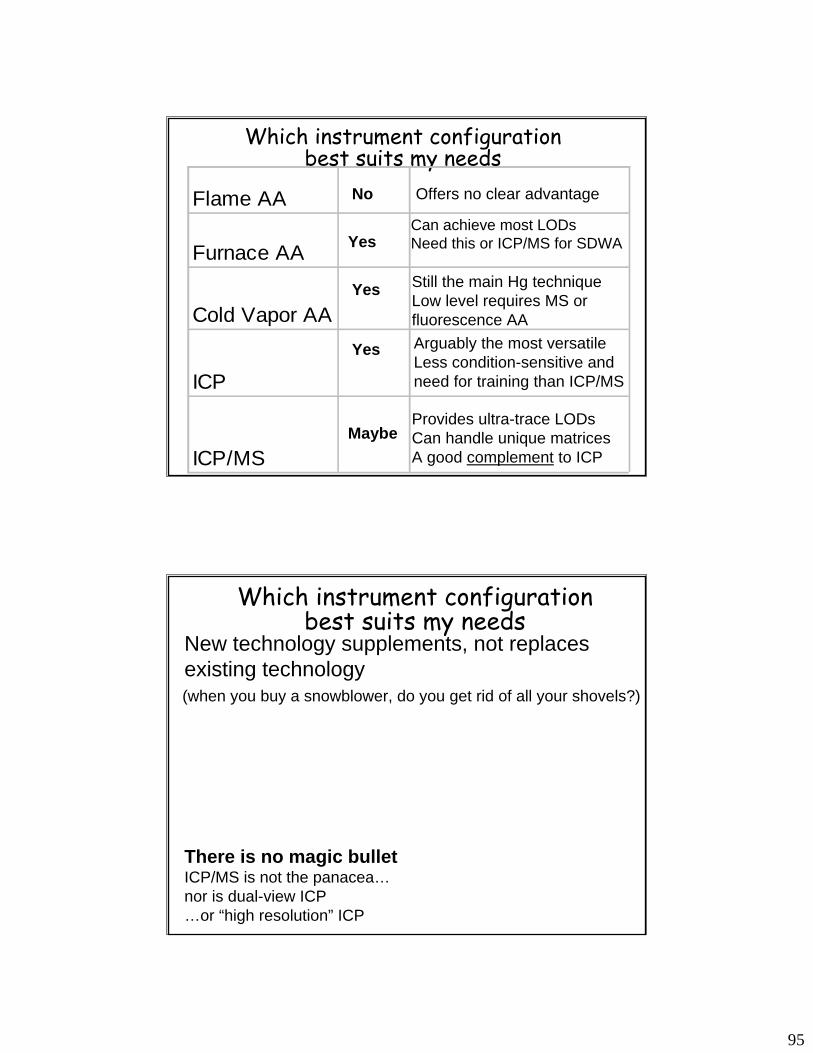
95
Which instrument configuration best suits my needs
Flame AA
Furnace AA
Cold Vapor AA
ICP
ICP/MS
No Offers no clear advantage
YesCan achieve most LODsNeed this or ICP/MS for SDWA
Maybe
Yes Arguably the most versatileLess condition-sensitive and need for training than ICP/MS
Yes Still the main Hg techniqueLow level requires MS or fluorescence AA
Provides ultra-trace LODsCan handle unique matricesA good complement to ICP
Which instrument configuration best suits my needs
(when you buy a snowblower, do you get rid of all your shovels?)
There is no magic bulletICP/MS is not the panacea…nor is dual-view ICP…or “high resolution” ICP
New technology supplements, not replaces existing technology
96
ICP TrainingGeorge Bowman (WI State Laboratory of Hygiene)Kevin Kaufman (WI State Laboratory of Hygiene)DeWayne Kennedy-Parker (WI State Laboratory of Hygiene)Rick Mealy (WI Dept. of Natural Resources)Roger Schultz (WI State Laboratory of Hygiene)
Developed and presented by the following:
Internal Audit ProcessSue Hill (WI State Laboratory of Hygiene)
ICP/MS OverviewAndy Klisz (WI State Laboratory of Hygiene)Chris Worley (WI State Laboratory of Hygiene)
…and a very special thanks to Barb Burmeister (WI State Laboratory of Hygiene) for coordination of registration and development of presentation material packages


![[SHIMADZU] 島津製作所 · cc-ms cv-aas, cv-afs, icp-oes, icp-ms, aas pbb/pbde cr(vl) pb/cd icp-oes. icp-ms icp-oes. icp-ms, icp-oes, icp-ms, cc-ms aas cv-aas aas : aas . - icp-oes](https://img.pdfslide.net/doc/110x75/602bef1d6551697710154f3f/shimadzu-eoe-cc-ms-cv-aas-cv-afs-icp-oes-icp-ms-aas-pbbpbde-crvl.jpg)