Embed Size (px)
Citation preview
Identifying Methods and Metrics for Evaluating Interagency Coordination in Traffic Incident Management
Final Report
Prepared by:
Robert G. Feyen, Ph.D.
Chinweike I. Eseonu, M.S.
Department of Mechanical and Industrial Engineering University of Minnesota - Duluth
March 2009
Published by:
Center for Transportation Studies University of Minnesota
200 Transportation and Safety Building 511 Washington Ave. S.E. Minneapolis, MN 55455
This report represents the results of research conducted by the authors and does not necessarily represent the views or policies of the University of Minnesota and/or the Center for Transportation Studies. This report does not contain a standard or specified technique.

Acknowledgements
This work was conducted in part with funding from the Northland Advanced Transportation Systems Research Laboratories (NATSRL), a cooperative research and education initiative of the Minnesota Department of Transportation (Mn/DOT), the University of Minnesota Center for Transportation Studies and its Intelligent Transportation Systems Institute, and the Swenson College of Science & Engineering at the University of Minnesota Duluth. The authors’ opinions stated within do not necessarily reflect those of these supporting agencies.
The authors would like to thank Eil Kwon, the director of NATSRL, for his suggestions and guidance. In addition, this work could not have been completed without the cooperation and assistance of staff at the Mn/DOT Regional Traffic Management Center in Roseville, MN. Brian Kary and Todd Kramascz of the RTMC deserve special thanks for their time and contributions.
iii
Table of Contents
Chapter 1: Introduction ................................................................................................ 1
Research objectives................................................................................................ 4 Steps taken ............................................................................................................. 5
Report structure...................................................................................................... 6
Chapter 2: Literature Review........................................................................................ 8
Traffic Incident Management ................................................................................. 8 Benefits of Traffic Incident Management....................................................... 10
Stages in Traffic Incident Management.......................................................... 10 Challenges to Effective Traffic Incident Management................................... 13
Approaches to Traffic Incident Management ................................................. 15 Performance Measures.......................................................................................... 17
Performance Measures in Traffic Incident Management................................ 19 Barriers to Effective Performance Measurement............................................ 20
Best Practices in TIM Performance Measurement ......................................... 21 Benchmarking ....................................................................................................... 22
Approaches to Benchmarking..........................................................................25 AQPC Blueprint for Benchmarking.................................................................26 Approaches to Benchmarking in Traffic Incident Management......................28
Challenges to Effective Benchmarking Practices ............................................29
Chapter 3: Competitive Benchmarking .......................................................................32
Competitive Benchmarking .................................................................................. 32 Identify Similar Regions for Comparison........................................................35
Results................................................................................................................... 39
Chapter 4: Internal Benchmarking...............................................................................50
Data Collection and Analysis................................................................................ 54 Results................................................................................................................... 62
Descriptive Statistics........................................................................................62 One-way Analyses ...........................................................................................64
Model Fitting ...................................................................................................66
iv
Variability Charting .........................................................................................73 Contingency Analysis ......................................................................................74
Process Charting .............................................................................................76
Chapter 5: Recommendations and Future Work..........................................................80
Recommendations................................................................................................. 81 Future Work .......................................................................................................... 86
References....................................................................................................................88
Acronyms.....................................................................................................................93
Appendix A: Traffic Incident Management Survey ................................................ A-1
Appendix B: Process Charts ..................................................................................... B-1
Appendix C: Survey Responses................................................................................ C-1
v
List of Tables
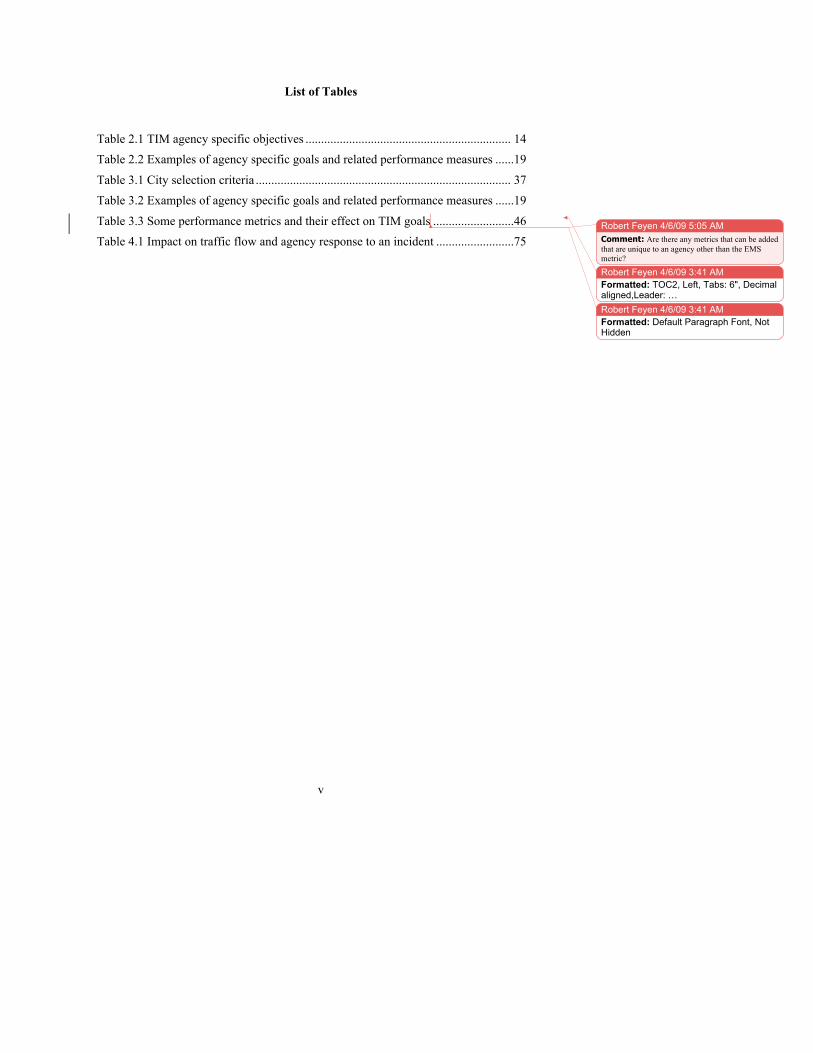
Table 2.1 TIM agency specific objectives .................................................................. 14 Table 2.2 Examples of agency specific goals and related performance measures ......19
Table 3.1 City selection criteria .................................................................................. 37 Table 3.2 Examples of agency specific goals and related performance measures ......19
Table 3.3 Some performance metrics and their effect on TIM goals ..........................46 Table 4.1 Impact on traffic flow and agency response to an incident .........................75
Robert Feyen � 4/6/09 5:05 AM
Robert Feyen � 4/6/09 3:41 AMFormatted: TOC2, Left, Tabs: 6", Decimalaligned,Leader: …Robert Feyen � 4/6/09 3:41 AMFormatted: Default Paragraph Font, NotHidden
Comment: Are there any metrics that can be added that are unique to an agency other than the EMS metric?
vi
List of Figures
Figure 1.1 Incident management timeline .................................................................. 12 Figure 2.2 The AQPC benchmarking cycle.................................................................27
Figure 3.1 Annual incident-induced delays in Seattle, Salt Lake City and Minneapolis - St. Paul .........................................................................44
Figure 3.2 Agency-specific TIM priorities ................................................................. 48 Figure 4.1 Incident response timeline – or simple process flow diagram?..................52
Figure 4.2 Incident information webpage from Mn/DOT’s 511 Traveler Service..... 55 Figure 4.3:Example of TIS incident data.....................................................................56
Figure 4.4 Excel spreadsheet format of incident response data.................................. 58 Figure 4.5 Twin Cities metro freeway system.............................................................59
Figure 4.6 Incident log data entry screen.................................................................... 60 Figure 4.7:Probability of incident detection by detection mechanism ........................63
Figure 4.8 FIRST dispatch time for different positions of a stall relative to the roadway......................................................................................................66
Figure 4.9 Actual vs. predicted values for the FIRST dispatch time model............... 71 Figure 4.10 Variability charts breaking down response time (a) means and (b) standard deviation by time of day and direction of travel...................74 Figure 4.11 Mosaic plot of responding agencies against impact on traffic flow.........76
Figure 4.12 Process charting symbols .........................................................................77 Figure 4.13 Excerpt from process chart for MSP response to a disabled vehicle .......79
Figure 4.14 Relationship between process chart and incident response metrics .........79
vii
Executive Summary
Traffic incidents involve vehicle stalls and collisions, debris, stray animals and other
impediments to the free flow of traffic on a public road. At an annual cost of $78 billion (TTI,
2007), traffic incidents are a pressing concern and attempting to manage these occurrences to
avoid the costs discussed above is crucial in the current economic climate. Among
transportation and traffic incident management (TIM) agencies in the United States, efforts are
shifting from infrastructure creation and maintenance toward performance optimization through
intelligent transportation systems (ITS) (Smith, 2007). As a result, considerable progress is
being made in detecting and rapidly responding to unpredictable incidents as well as effectively
managing planned incidents to reduce impact on road users.
Responding to traffic incidents, however, often requires resources from multiple
agencies. Complicating this, each agency has different objectives from which they have derived
specific response protocols. These different objectives often lead to conflicts between agencies
during an incident, posing a significant challenge for those parties coordinating the overall
incident management efforts between agencies.
Thus, the research objectives of this study were:
• Identify a common interagency goal;
• Use this goal to identify quantitative performance metrics that can be used to
evaluate TIM performance; and,
• Identify a method for using these metrics as feedback to improve interagency
coordination and overall TIM performance
viii
With respect to the first objective, a literature review and competitive benchmarking
effort using selected North American cities suggested the following common interagency goal:
Without compromising safety, minimize the time spent dealing
with a traffic-related incident.
In turn, this goal suggested the following set of time-based metrics that could effectively
evaluate TIM performance across all agencies involved – meeting the second objective of this
study.
• Verification time: Detection to dispatch
• Agency dispatch time: Dispatch to arrival
• Lane clearance time: Arrival to lane clearance
• Queue dissipation: Lane clearance to all clear
• Removal time: Arrival to all clear
• Overall incident response time: Dispatch to all clear
• Overall incident time: Detection to all clear
Finally, these metrics suggested the use of a methodology for evaluating performance of
a TIM system, the third objective of the study. Adopting a process-centered view for incident
response, an internal benchmarking approach was demonstrated using process charting and a set
of five statistical methods. Prediction model fitting, variability charts and process charting apply
well to general performance evaluation and can be considered the primary benchmarking tools;
one-way factor analyses, contingency analysis and descriptive statistics are secondary methods
that, although valuable, may be more suited to answering specific questions about TIM
performance.

ix
As a result, this study recommends adopting a complementary approach to tackling the
congestion and travel delays associated with incidents: make them as short as possible. In most
cases, the less time that an incident has to impact traffic, the less congestion and delay it can
cause. The following four recommendations were be drawn from the internal benchmarking
demonstration to support a process-based approach to TIM performance improvement:
Recommendation 1
Modify data collection and archiving methods to support a process-centered
approach to performance evaluation.
Recommendation 2
Using appropriate statistical tools, analyze archival incident response data to
support internal benchmarking and subsequent process improvement efforts.
Recommendation 3
For each major incident type, compile process charts that illustrate the steps and
completion sequences for each responding agency.
Recommendation 4
Develop simulation models of the incident response process.
1
Chapter 1 Introduction
A traffic incident is defined as a “…non-recurring event that causes a reduction
in roadway capacity or an abnormal increase in demand” [1]. These incidents include
anticipated and unanticipated events that are obstructions to the free flow of vehicular
traffic. Traffic incident management (TIM) is “a planned, coordinated process to detect,
respond to, and remove traffic incidents” in a manner that ensures motorist safety and
the rapid restoration of traffic capacity [2]. The management of traffic congestion,
vehicle crashes, and other such traffic incidents is highly important to most municipal
authorities. To this end, steady but dramatic increases in urban populations have resulted
in the development of new infrastructure and the modernization of existing road and
railway facility to alleviate increasing demand on road networks.
Considering vehicle ownership trends and the limited benefits (and feasibility) of
further road construction in finite and developed urban spaces, there has been a move
toward intelligent traffic systems (ITS) aimed at optimizing existing traffic management
methods, and demand control through improvements in the quality and availability of
public transportation, flexible work hours, and high occupancy vehicle (HOV) and toll
(HOT) lanes. However, with its rapid population and business growth, Minneapolis-St.
Paul has the 17th highest level of traffic congestion in the U.S., according to the Texas
Transportation Institute’s 2007 Urban Mobility Report [3]. Traffic congestion is no
small matter: in 2005 alone, the economic cost of traffic congestion in the United States
was estimated at $78 billion. This is derived from the 4.2 billion labor-hours and 2.9
billion gallons of fuel (equivalent to 105 million weeks of vacation and 58 fully loaded
2
supertankers) wasted due to traffic delays [4]. Effective and efficient TIM becomes
even more critical in cities such as Minneapolis-St. Paul in which the population is large
and growing. The Twin Cities is home to over 2.81 million people – a 6.4 percent
increase from the 2000 census figures - and the number of households in the region rose
to 1.1 million in the 5-year period following the census, according to Metropolitan
Council estimates [6]. Since population growth can be correlated with increases in
vehicle ownership and traffic density, one can extrapolate that traffic congestion will
likely continue to worsen unless negated by effective traffic management practices,
including TIM.
In Minneapolis-St. Paul, incident-induced delays account for about 50% of all
traffic congestion [3] and at least one-half of these delays arise from unplanned and
unanticipated incidents such as automobile crashes, debris, spilled cargo and stray
wildlife. These conditions and increasing levels of congestion indicate the importance
of effective TIM practices. Thus, could targeted modifications to the management of
traffic incidents at Minnesota Department of Transportation (Mn/DOT) facilities reduce
traffic congestion levels (and lower its national congestion ranking) by reducing delay
times during traffic incidents and more quickly restoring free flow conditions (roughly
defined as vehicle travel speeds of 60 miles per hour)?
One area to explore for targeted modifications is the resource coordination
between multiple transportation and public safety agencies required for effective
management of traffic incidents. In the Twin Cities, the Regional Transportation
Management Center (RTMC) was opened by staff at the Minnesota Department of
Transportation in the 1970’s in response to a need for uniform traffic response systems

3
in the Twin Cities. Tasked with monitoring and responding to traffic incidents across
the region, the RTMC comprises multiple agencies, including the Minnesota State
Police (MSP) dispatch, Mn/DOT Metro District Maintenance dispatch and the Mn/DOT
Office of Traffic, Security and Operations [5].
Across the country, TIM personnel state that this type of interagency
arrangement engenders coordination between law enforcement and transportation
officials and allows for uniform incident response plans which, in turn, yields shorter
incident response and clearance times as well as reductions in the risk of secondary
accidents. But these claims are made anecdotally and rarely backed up with quantitative
data or analysis. Yet, case studies of business and industry (e.g., manufacturing, retail,
service) repeatedly show that, if performance measures are not consistently measured or
evaluated, organizations frequently have difficulty identifying areas for improvement,
hindering their ability to meet core objectives effectively and efficiently.
In addition, an absence of consensus between agencies on an overall TIM goal
and related objectives often occurs and is manifested by overlap and gaps in response
protocols. These are driven by agency-specific goals and performance measures and are
thought to contribute to prolonged incident durations and degradation in public safety,
greater probability of fatalities, longer traffic delays, and increased occurrence of
secondary incidents (crashes or related events caused elsewhere in the transportation
network by the subsequent delays and confusion of the original incident) [2]. To make
matters even worse, the Statistical Abstract of the United States reports that, in 2005,
three hundred and ninety-one (391) responders from various agencies were killed and
numerous others injured or disabled while attending to an incident.
4
Research Objectives
This report considers TIM practices in selected cities across the United States in
order to identify any quantifiable effects that coordinated TIM efforts have on traffic
congestion measures and determine methods and metrics that could facilitate
interagency coordination in the management of traffic incidents. This work, carried out
with the support of the Northland Advanced Transportation Systems Research
Laboratory (NATSRL) at the University of Minnesota Duluth, compares these findings
to incident management practices at Mn/DOT’s Regional Transportation Management
Center (RTMC) in Minneapolis-St Paul and suggests modifications targeted to that
facility. However, the suggestions made easily can be generalized and applied to other
TIM facilities across the country.
This study attempts to identify and assess quantitative metrics through which
interagency coordination of incident response could be evaluated and improved.
Consideration will be given to how well a metric supports the goals outlined by the
National Traffic Incident Management Coalition (NTIMC) and co-located agencies
across the country: maximizing vehicle flow, minimizing congestion, providing traveler
information, managing incidents, and aiding stranded motorists [5]. Keeping this in
mind, the following three objectives are proposed:
1. Identify a goal common to all agencies involved in traffic incident
management;
2. Use this goal to identify suitable quantitative performance metrics
that can be used effectively to evaluate TIM performance; and
5
3. Identify a method for using these metrics as feedback to guide
suggestions for improving interagency coordination and overall
TIM performance.
Steps taken
To achieve these objectives, the following steps were taken. First, historical
traffic data from 1982 to 2005 was analyzed for relationships between incident
management programs in different North American cities. Possible performance metrics
were assessed by comparing incident data to TIM practices (based on data and responses
to surveys) in several North American cities. Time constraints necessitate the use of
historical incident response data. Considerable ambiguity exists in definitions for TIM
parameters; delay in one city might not be regarded as such in a comparable locale. In
order to ensure standardization, data was obtained from the Texas Transportation
Institute and not from individual agencies. While this had no apparent impact on the
validity of results, the effects of city – specific variations were not as readily evident.
Second, as suggested above, TIM personnel in selected cities were surveyed to
gather information on actual TIM practices utilized in each locale. Combining this
information with the historical data provided some insight into likely cause-and-effect
relationships. In this case, cities were selected based on levels of interagency
coordination, population size, and other related factors. Because surveys, while an
excellent source of information, are time consuming and have historically low response
rates, city selection criteria were closely defined in an effort to (1) accomplish goals
within the established time frame and (2) obtain relevant, representative information.
6
While this entailed using a smaller survey and sample size than considered optimal,
comparing dissimilar cities would ultimately prove unhelpful.
Third, the results of these first two steps indicated that a process-based approach
to evaluating TIM performance might be beneficial. However, none of the cities
surveyed seemed to be using a process-based approach nor could an example be found
in the TIM literature. To investigate how such an approach might benefit TIM practices,
a proposed methodology was used to analyze a sample set of incident data obtained from
the RTMC and suggest changes in data collection and analysis of appropriate TIM
performance measures at the RTMC.
Report structure
To this end, this report is structured as follows. Chapter 2 reviews the literature
on incident management with a focus on interagency coordination issues. This chapter
looks to identify best practices, benefits and issues currently associated with TIM
practices across the country. Chapter 3 outlines a competitive benchmarking approach
taken in this study to build on the findings from the prior chapter. Chapter 4 presents
results from an internal benchmarking exercise, keeping an eye on addressing the stated
research objectives and Chapter 5 summarizes the findings, making suggestions to
modify certain procedures in order to improve and guide TIM efforts. .
.

7
8
Chapter 2 Literature Review
To investigate the effect of interagency coordination on Traffic Incident
Management (TIM) and establish suitable performance metrics, a review of relevant
literature on Traffic Incident Management has been conducted to determine variations in
TIM approaches, documented effectiveness, and best practices across North America.
This review looked to satisfy the research objectives by addressing questions concerning
the effect of interagency coordination on the quality of response to traffic incidents, the
effect of responder resources on their effectiveness and on the use of performance
metrics that can be applied across agencies.
As TIM performance is commonly measured in terms of delay and congestion
levels, definitions of these two measures should be standardized in some way. This
report utilizes the standard definitions used by the Texas Transportation Institute (TTI);
the TTI was also the primary source of historical data for the first step of this study. The
TTI defines delay as “…travel occurring at less than free flow speed (60 mph [70 mph in
Minnesota] on freeways and 35 mph on streets)” and congestion is defined as the accrual
of delay [7].
Traffic Incident Management
A traffic incident is defined as an event that creates hazardous driving conditions
and/or delays the normal flow of traffic. Traffic Incident Management (TIM) is an
attempt to control these occurrences: “the systematic, planned and coordinated use of
human, institutional, mechanical, and technical resources to reduce the duration and
9
impact of [traffic] incidents [1].” To this end, Traffic Incident Management involves the
timely detection of incidents and dispatch of necessary response personnel to execute
predetermined plans that often entail the management of multi-agency, multi-
jurisdictional responses to traffic disruptions [8]. Therefore, TIM increasingly requires
cooperation between police, fire, medical, transportation, and other public and private
agencies.
As was mentioned in Chapter 1, due to the nature of multi-agency operations,
definitions for incidents and severity classifications are agency-specific and vary in
accordance with organizational goals [9]. Incident severity depends on its effect on the
following agency specific variables:
1. Public safety (Police departments)
2. Traffic flow (Departments of Transportation, DOTs )
3. Presence and extent of injuries (Emergency Medical Services)
4. Presence and extent of fires and/or entrapment (Fire departments)
5. Ease of retrieval and transportation (Towing companies)
Apart from delay and congestion (defined earlier), definitions in this report are
intended to be consistent with Mn/DOT objectives and (where available) standardized,
currently implemented interagency agreements. Although traffic delays often arise from
planned or predictable incidents such as roadway construction and maintenance, athletic
and entertainment events, parades and other highly attended public gatherings [10], the
focus in this report is on unplanned or unpredictable incidents, such as those involving
car crashes, stray animals, hazardous spills and other occurrences unexpectedly resulting
in traffic delay and congestion.
10
Benefits of Traffic Incident Management
As suggested above, one can easily argue that society benefits from efficient and
effective TIM programs [17]. The major benefits of TIM are expected to include
reductions in incident induced delays and traffic congestion along with an increase in
safety [15]. Shorter delays have benefits extending beyond the roadway network. The
Environmental Protection Agency (EPA) reports the emissions from a single light-duty
gasoline fueled vehicle (i.e., an automobile) contain an average of 21.2 grams/hour of
Volatile Organic Compounds (VOCs), 371 grams/hour of Carbon Monoxide (CO) and
6.16 grams per hour of Nitrogen Oxide [16]. Factoring in emissions from trucks, busses
and other large heavy-duty vehicles, reductions in a region’s incident-induced traffic
congestion should yield lower harmful emissions and improved air quality due to shorter
vehicle operation and idling periods. In essence, TIM efforts have an added benefit of
reduced fuel consumption and cleaner air. These claims were examined in a study of
over 32,000 incidents by the Coordinated Highway Action Response Team (CHART) in
Maryland in which researchers at the University of Maryland evaluated regional TIM
system performance based on detection, response time, clearance and overall duration.
They used this information to develop a regression model that illustrated an annual total
delay reduction of 30 million hours due to regional TIM efforts, which they associate
with a 5 million gallon reduction in fuel consumption [17].
Stages in Traffic Incident Management
Among transportation and Traffic Incident Management agencies in the United
States, efforts are shifting from infrastructure creation and maintenance toward
11
performance optimization through intelligent transportation systems (ITS) [11]. In
doing so, TIM agencies are shifting their emphasis toward detecting and rapidly
responding to unpredictable incidents as well as improving management of planned
incidents so that any given incident will have a minimal impact on road users. As a
result, incident management is becoming increasingly complex and utilizes a wide
variety of strategies and standards.
Widely accepted as an authoritative voice on incident management practices [2,
8, 9, 12], the Traffic Incident Management Handbook details the following five stages of
Traffic Incident Management [1], which is corroborated by other sources as well [8]:
1. Detection and verification
2. Dispatch and response
3. Site management
4. Traffic management
5. Traveler information
Detection refers to the means by which response agencies become aware of
incidents. Examples include in-field discovery, 911 calls, closed circuit TV cameras, and
loop detectors. Verification involves methods used to confirm an incident’s occurrence
and its location; these methods overlap with detection and include means such as closed
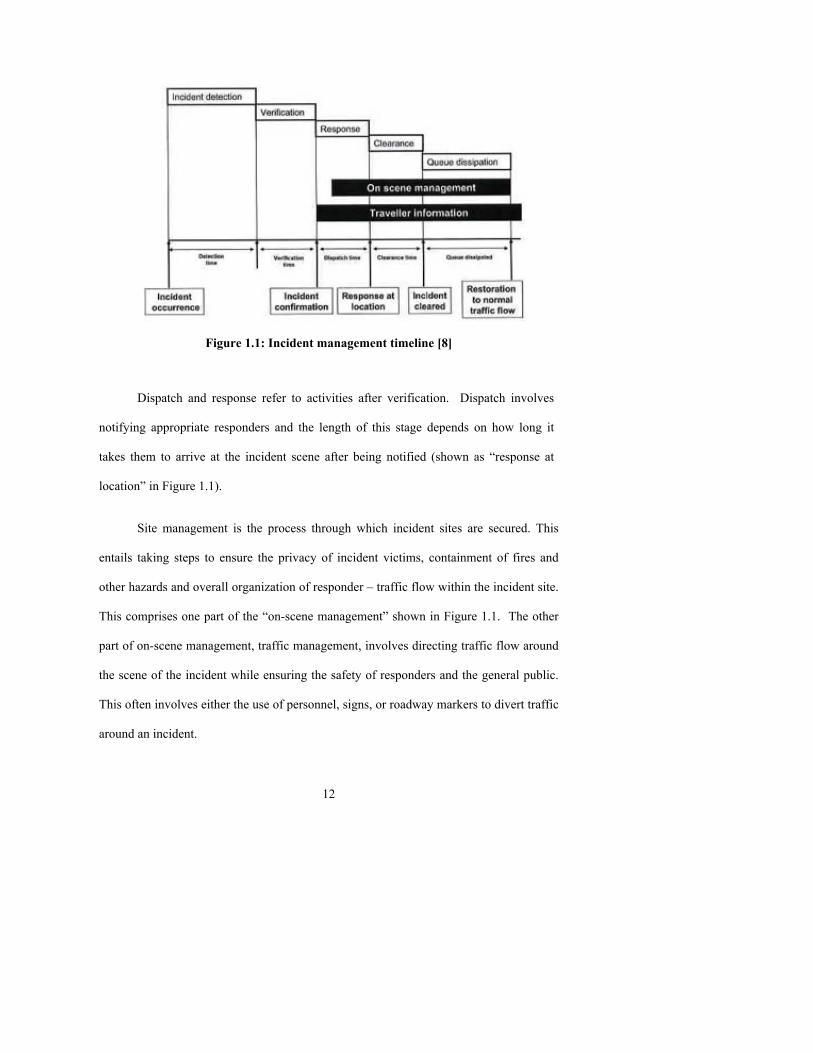
circuit television cameras, loop detectors, and patrol teams. As shown in Figure 1.1, the
duration of this stage is the time elapsed between an incident’s occurrence and its
confirmation by TIM parties.
12
Figure 1.1: Incident management timeline [8]
Dispatch and response refer to activities after verification. Dispatch involves
notifying appropriate responders and the length of this stage depends on how long it
takes them to arrive at the incident scene after being notified (shown as “response at
location” in Figure 1.1).
Site management is the process through which incident sites are secured. This
entails taking steps to ensure the privacy of incident victims, containment of fires and
other hazards and overall organization of responder – traffic flow within the incident site.
This comprises one part of the “on-scene management” shown in Figure 1.1. The other
part of on-scene management, traffic management, involves directing traffic flow around
the scene of the incident while ensuring the safety of responders and the general public.
This often involves either the use of personnel, signs, or roadway markers to divert traffic
around an incident.
13
Finally, the “traveler information” phase involves disseminating incident
information to road users, an element essential to traffic incident management. Variable
Message Signs (VMS) and public radio systems help divert traffic to alternate routes,
thus helping some drivers avoid the incident and reducing the chance for secondary
incidents and prolonged delay.
Challenges to Effective Traffic Incident Management
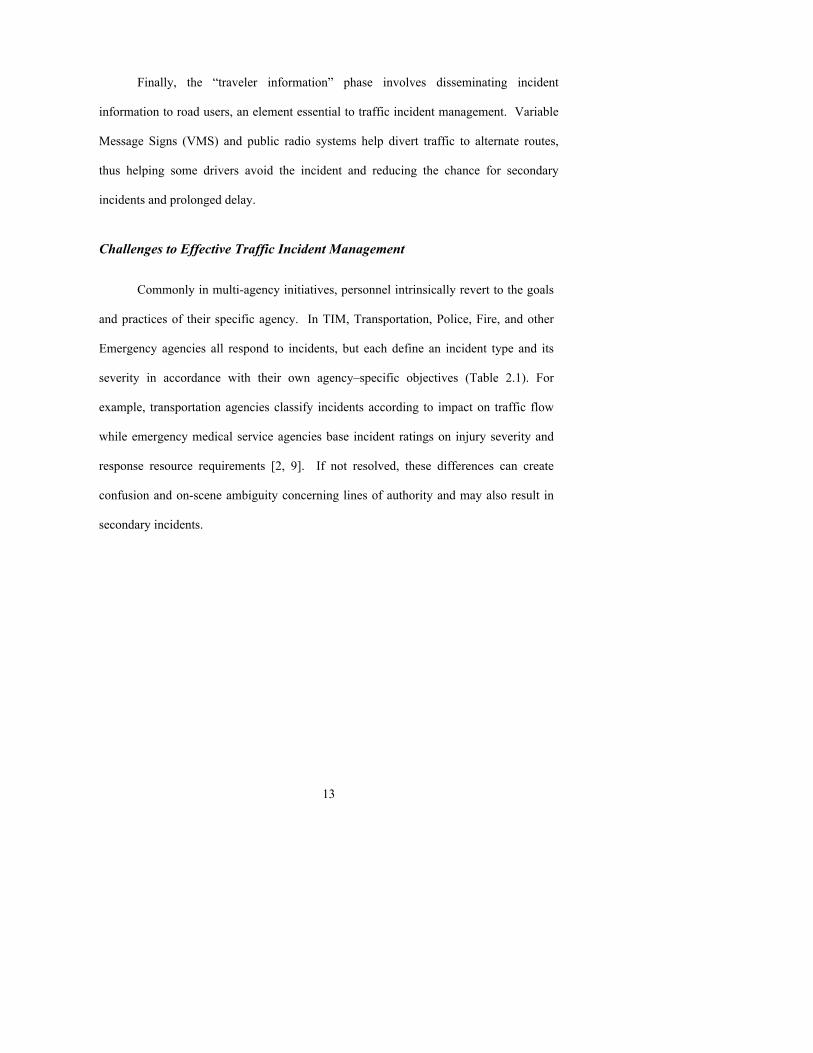
Commonly in multi-agency initiatives, personnel intrinsically revert to the goals
and practices of their specific agency. In TIM, Transportation, Police, Fire, and other
Emergency agencies all respond to incidents, but each define an incident type and its
severity in accordance with their own agency–specific objectives (Table 2.1). For
example, transportation agencies classify incidents according to impact on traffic flow
while emergency medical service agencies base incident ratings on injury severity and
response resource requirements [2, 9]. If not resolved, these differences can create
confusion and on-scene ambiguity concerning lines of authority and may also result in
secondary incidents.
14
Table 2.1: TIM agency specific objectives
On an interpersonal level, tasks performed by any one responder are dependent
on his or her immediate individual goals and objectives, which may not be in accordance
with the agency’s overall goal. As noted by researchers at the Center for Advanced
Transportation Technology (CATT) at the University of Maryland, schemes to
standardize and measure TIM efforts are uncommon. Consequently, improvements to
incident management are difficult to assess, particularly with respect to the effectiveness
of proactive inter-agency cooperation. Complicating effective TIM efforts even further
is the erosion of resources (equipment and personnel) in many publicly funded agencies,
a factor identified by some researchers as an additional hindrance to “effectively
contend[ing] with ever increasing congestion in the daily commuting traffic network”
[17].
15
Approaches to Traffic Incident Management
Only in the past decade have proactive Traffic Incident Management practices
been widely adopted. As a result, there is no single recommended method of
implementation; instead, this rapid and sporadic development of TIM programs across
the country over the past decade has created a hodgepodge of TIM procedures and
guidelines that vary widely from a more “traditional” ad-hoc and unstructured use of
response agencies on one extreme to interagency teams utilizing coordinated response
protocols on the other [13]. Many locales seemingly have “reinvented the wheel” when
implementing or modifying a TIM program, repeating efforts and – in some cases -
mistakes already carried out elsewhere. While region-specific protocols appear essential
to the success of TIM, some understanding is needed regarding which methods applied
in successful TIM agencies across the country are regionally specific and which can be
considered “best practices” that can be applied anywhere in the country.
The wide variation in TIM quality and standard operating procedures has
prompted a movement to create a national approach to incident response. The National
Traffic Incident Management Coalition (NTIMC) – an alliance of national organizations
that represent TIM stakeholders from across the United States – has formulated a
National Unified Goal (NUG) to promote a unified national agenda for TIM practices.
Stakeholder groups include Transportation Departments, Public Safety Communications
bodies, Emergency Medical Services, Law Enforcement agencies, Fire & Rescue
services, and Towing & Recovery firms. The NTIMC argues that its NUG will
facilitate performance measurement and improvement efforts as well as improve
program and institutional cohesion in joint incident management exercises. In
16
particular, the NUG has the dual aims of reducing traffic congestion and increasing
responder safety by advocating the nationwide adoption of unified, multi-disciplinary
policies, procedures and practices geared toward optimizing the following [14]:
1. Responder safety;
2. Safe, quick incident scene clearance; and
3. Prompt, reliable incident communication.
However, the NUG may be met with some resistance. The idea of a generalized
national strategic approach may not sit well with many regional TIM centers, who have
already adopted specific pragmatic approaches they believe work for their areas and
which also account for regional factors. Further, in their 2002 report on Incident
Management Performance Measures [2], Balke, Fenno and Ullman suggest that most
regional agencies have converged independently on a common set of performance
measures that help them manage incidents:
1. Detection Time – the time between the occurrence of an incident and
notification of a response agency.
2. Preparation (or verification) Time – the elapsed time between when
an incident is detected to when the response vehicles are dispatched.
3. Response Time – the elapsed time between when the response vehicle
was dispatched and when response vehicles arrive at the incident
scene.
4. Clearance Time – the elapsed time between when response vehicles
arrive at the incident scene to when traffic completely recovers after
the incident.
5. Response Time – the elapsed time between when an incident is
17
detected to when the response vehicles arrive at the scene.
6. Incident Duration -- the elapsed time between when an incident
occurred to when the response vehicles depart at the scene.
Performance Measures
This common set of performance measures warrants further exploration. In
general, performance measures are standards that express the degree to which tasks are
accomplished efficiently and effectively. In many settings, performance measurement
includes the use of statistical analysis to determine conformity to organizational goals
[2]. These measures reflect the objectives governing the activities being performed and
are used for [27]:
1. Identifying critical areas,
2. As-is situation analysis,
3. Planning and implementing changes,
4. Monitoring results, and
5. Developing control systems.
While the cost of operations provides some indication of business performance
with regard to profitability, a focus on cost management/reduction in project and agency
management is often achieved at the expense of true organizational goals [28]. Thus, a
need exists for additional indicators that directly reflect and drive commitment toward
accomplishing the goal of the agency in question, highlighted by the following quote
from a Brown University report on performance measurement [29]:
“The rationale for performance measurement is that [every]…organization requires objective feedback about its own performance [This is feedback with which] it can

18
internally…support quality-improvement activities, and externally demonstrate its accountability to the public, payers, regulators and advocacy groups”.
Further, the Government Accounting Standards Board (GASB) defines
performance measurement as the reporting of “…Service Efforts and Accomplishments
(SEA)…” which indicate:
1. Productivity (expresses outputs as a quantitative fraction of
inputs),
2. Effectiveness (provides relation of outputs to intended goals),
3. Quality (relates performance to accepted standard or state of
practice), and
4. Timeliness (measures the time required to produce a desired
output).
These measures are generally aimed at identifying areas in which to make
improvements, whether by indicating successes to be duplicated or shortcomings to be
addressed. In this case, performance measures provide a baseline for the evaluation of
subsequent efforts that [30]:
1. Provide a basis upon which required improvements can be determined; and
2. Allow for predictions of future performance – invaluable in planning for future
agency expansions should urban/road network growth occur.
Perhaps of greatest importance is the use of performance measures in progress
reporting. In cases where the measures are representative of TIM goals (e.g., where they
provide feedback on the impact of incidents on traffic flow), they facilitate detailed
19
evaluation of TIM practices, allow for comparison between locations and inform the
determination of aggressive but achievable goals.
Performance Measures in Traffic Incident Management
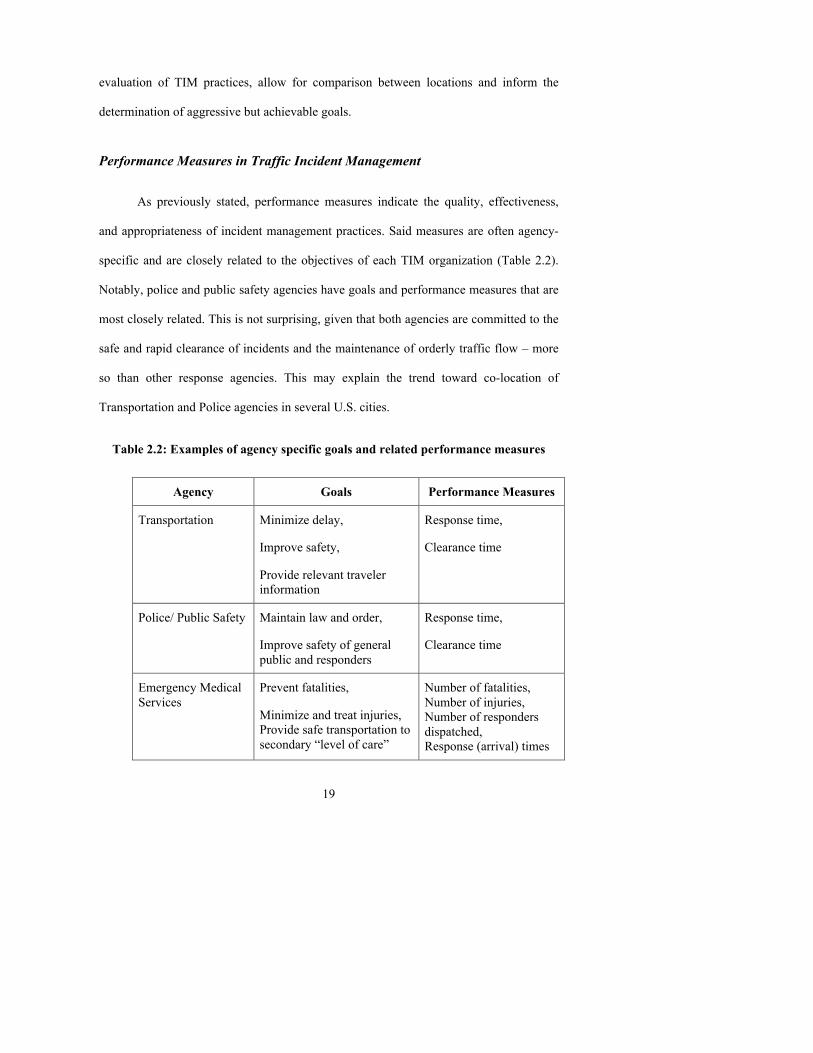
As previously stated, performance measures indicate the quality, effectiveness,
and appropriateness of incident management practices. Said measures are often agency-
specific and are closely related to the objectives of each TIM organization (Table 2.2).
Notably, police and public safety agencies have goals and performance measures that are
most closely related. This is not surprising, given that both agencies are committed to the
safe and rapid clearance of incidents and the maintenance of orderly traffic flow – more
so than other response agencies. This may explain the trend toward co-location of
Transportation and Police agencies in several U.S. cities.
Table 2.2: Examples of agency specific goals and related performance measures
Agency Goals Performance Measures
Transportation Minimize delay,
Improve safety,
Provide relevant traveler information
Response time,
Clearance time
Police/ Public Safety Maintain law and order,
Improve safety of general public and responders
Response time,
Clearance time
Emergency Medical Services
Prevent fatalities,
Minimize and treat injuries, Provide safe transportation to secondary “level of care”
Number of fatalities, Number of injuries, Number of responders dispatched, Response (arrival) times
20
Barriers to Effective Performance Measurement
As discussed earlier, the use of agency-specific goals and definitions complicate
incident management, data collection and consequently the ability to assess
improvements in response, clearance, and other incident management goals. This
fragmentation leads to a lack of understanding of metrics where present and a resultant
lack of uniformity in the application of these metrics.
An example from a non-transportation related entity illustrates this issue. In
their report on the Value and Impact Program (VAMP) at university libraries across the
United Kingdom, Creaser, Conyers, and Lockyer discuss the perceived lack of effective
performance measures at these institutions. Through surveys and other analysis, they
portray a lack of either understanding or awareness of available tools, a lack of
standardized tools and methods of application, an overall unawareness of the
relationship between feedback from existing performance tools, and overly broad
objectives [31]. Although not in the area of traffic management, lessons learned here
readily apply to TIM.
As evidenced in recent attempts by the NTIMC at education and streamlining of
national TIM activities, the conditions described by Creaser et al (2007) are common to
large, decentralized systems. The Kansas City Scout (Kansas City’s TIM body) details
[32] similar challenges faced in disseminating incident management guidelines and
increasing awareness of the existence and content of the manual among TIM personnel.
This challenge is exacerbated in situations in which component agencies are
21
increasingly dissimilar – achieving consensus between Department of Transportation
and fire or emergency medical services, for instance.
Best Practices in TIM Performance Measurement
In their investigation of system operations performance measures for the Virginia
Department of Transportation (VDOT), researchers from the Virginia Transportation
Research Council (VTRC) attempted to “develop system operations performance
measures for VDOT” [11]. They discussed the need and willingness at VDOT to
determine and standardize definitions for incidents, incident duration, and other like
parameters. By placing focus on agency goals aimed at improving safety and security,
preserving infrastructure, and improving highway operational performance, VDOT was
able to develop a set of clear measures for assessing various TIM related efforts in
traffic operations, incident response, traveler information and ITS device reliability.
In general, the integration of performance measures into the budgetary process is
also advocated by the Government Finance Officers Association (GFOA) since [33]:
1. Government agencies use strategic plans to identify broad goals, which
are then translated into specific objectives;
2. Budgetary decisions are framed on the basis of results and outcomes
that are directly linked to these specific goals and objectives; and
3. Performance measures are the sole means of monitoring results and
outcomes, and thus, the achievement of outlined goals and objectives.
22
As a result, the GFOA calls for the use of non-generic performance measures.
Their argument appears to oppose the propositions of organizations like the NTIMC who
are looking to create common and perhaps generic measures and goals for TIM
organizations across the country. However, while basic concepts of performance
measurement apply across industries, the need for non-generic measures in the highly
diverse and mature financial sector of government and private organizations may not be
readily transferable to the largely generic transportation sector. Although true that locales
may differ and adaptations might be necessary, the need in TIM is largely one of
uniformity with an aim to create comparable performance data. And, arguably, the best
method to identify and utilize these performance measures is benchmarking.
Benchmarking
An internationally recognized authority on benchmarking, knowledge and
performance management, the American Productivity and Quality Center (APQC)
defines benchmarking as the “process of identifying, sharing, and using knowledge
and best practices [involving] the continuous process of measuring products, services
and practices” [19]. The identification process involves establishing what is to be
compared and where or with whom said comparisons are to be made. Sharing refers to
the exchange of identified parameters or processes between benchmarking partners, who
then apply or exploit shared knowledge to the advantage of their respective agencies.
A comprehensive understanding of the benchmarking process is gained through
clearly defining the parameters being measured and leads to the determination of best
practices; activities that give an organization a competitive advantage [20]. Within
23
industry, Wireman indicates that best practices vary depending on industry conditions
and product life cycle – for example, while best practices in a declining industry will
reflect profitability and risk aversion capabilities, a manufacturer of products that are in
the growth phase of the product life cycle will look for best practices that yield market
penetration, customer satisfaction and an increasing return on investment.
In order to assess performance in TIM, the effects of interagency coordination on
incident management must be better understood. In this case, the expected (normal)
responses (or, baselines) must be identified before post interagency coordination
comparisons can be made. Where interagency comparisons are being made, generally
accepted response metrics – based on information from government or other nationally
recognized transportation research bodies – should be used as performance measures.
Benchmarks serve as excellent tools for performance evaluation and the determination
of best practices. While they do not relieve managers of goal and direction setting
responsibility, they serve as valid yardsticks for progress measurement and as indicators
of methods to be adopted [21]. The establishment of these standards (benchmarks) in
TIM is crucial as failure to do so will hinder identification of interagency coordination
effects on the quality of incident response, discovery of areas in need of improvement,
and evaluation of performance metrics required for continuous process enhancement.
By providing an objective assessment of internal changes in performance, the
creation of relevant internal and/or external baseline standards against which future
performance can be evaluated gives insight to organizational strengths and weaknesses
[22]. This allows for innovation through proactive process improvement attempts by
management and non-management staff [23]. When these measures are collected by a

24
different organizations working toward a common goal, benchmarks can provide a
useful tool for motivating individuals and creating “learning organizations” adept at
knowledge acquisition, transfer and rapid adaptation into standard operating procedures
[24]. McGonagle and Flemming [39] claim the benefits of effective benchmarking
include:
1. An exposure of disparities between perceived and actual
organizational performance,
2. The creation, and sustenance, of momentum for organizational
change,
3. The establishment of criteria against which goals, and advancement
toward said goals, can be determined, and
4. The discovery of improvements in “the state of practice” with
respect to technological and other improvements.
These benefits are directly applicable to the operation of Traffic Incident
Management programs and the interactions between agencies. The development of
benchmarks could provide a means to identify cities with best practices with regards to
incident clearance, traffic congestion, and other such criteria. Benchmarks also provide
a basis against which local agencies can measure performance and, in turn, identify areas
in which improvements are needed. Developing benchmarks in this sector would,
therefore, facilitate interagency and perhaps even inter-city TIM coordination, as
promoted by the NTIMC.
25
Approaches to Benchmarking
In the attempt to determine suitable performance metrics, it is essential to choose
an appropriate benchmarking methodology. To this end, consideration will be given to
various benchmarking methods. A brief review of these approaches and previous
applications should provide an indication of any methods currently used in the
transportation industry and of the method(s) to which this study is best suited.
The fact that benchmarking highlights potential targets for improvement makes it
critical to the success of any improvement project. In accordance with project specific
requirements and resource availability, the following approaches to benchmarking are
discussed by Storhaug [26] as originally put forward by McGonagle and Flemming [39]:
1. Internal Benchmarking: In this approach, an organization looks
within, often to other divisions for ideas for improvements. Typically,
the focus is on low-level, repetitive operations lacking strategic focus.
2. Competitive Benchmarking: This method involves comparisons
between competitors on specific products or operations, often using
information readily available in trade journals and other public portals.
3. Shadow Benchmarking: In this scenario, benchmarking is aimed at
dominance to the detriment of the organization being benchmarked as
opposed to the improvement of the general “state of knowledge/practice.”
Competitor-to-competitor comparisons are made without the knowledge
of the “benchmarked” party.
26
4. Industrial Benchmarking: This approach appears to eschew the
intuitive purpose of benchmarking activities. The comparison here is
often with an organization not typically considered as exemplar.
Industrial, or functional, benchmarking often is used by organizations in
search of new and different ideas for process improvement.
5. Transnational Benchmarking: This involves comparisons of generic,
non-industry-specific activities. Also aimed at the determination and
application of best practices, this method involves comparisons with
organizations considered “best in class” for the activity being performed.
APQC Blueprint for Benchmarking
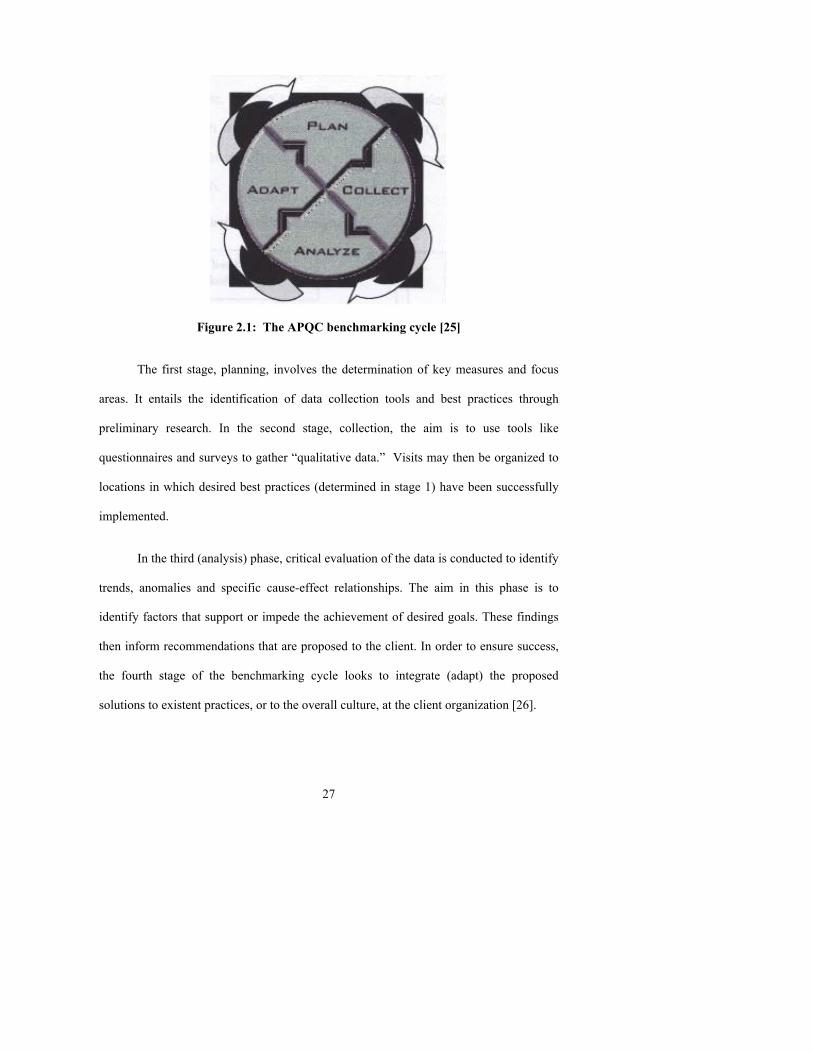
Irrespective of approach, a generic benchmarking process outline (Figure 2.1)
has been developed by the APQC. The concept of a “structured approach” to
benchmarking has been widely upheld by organizations in which benchmarking
activities have been successfully conducted [25, 26]. Among these approaches, the
APQC is widely recognized as having the best methodology. Its four-step approach is
divided into a planning, [data] collection, [data] analysis, and an adaptation phase.
27
Figure 2.1: The APQC benchmarking cycle [25]
The first stage, planning, involves the determination of key measures and focus
areas. It entails the identification of data collection tools and best practices through
preliminary research. In the second stage, collection, the aim is to use tools like
questionnaires and surveys to gather “qualitative data.” Visits may then be organized to
locations in which desired best practices (determined in stage 1) have been successfully
implemented.
In the third (analysis) phase, critical evaluation of the data is conducted to identify
trends, anomalies and specific cause-effect relationships. The aim in this phase is to
identify factors that support or impede the achievement of desired goals. These findings
then inform recommendations that are proposed to the client. In order to ensure success,
the fourth stage of the benchmarking cycle looks to integrate (adapt) the proposed
solutions to existent practices, or to the overall culture, at the client organization [26].
28
Finally, the APQC highlights three attributes common to historically excellent
benchmarking activities:
1. The realization that knowledge transfer is a people-to-people process.
Interpersonal relationships are central to the successful establishment of
benchmarks and must be developed before meaningful information
sharing can occur.
2. An ongoing commitment to the re-evaluation of benchmarks. The
learning process is dynamic and employee knowledge acquisition leads
to process improvements. Realization of this process and the creation
of avenues through which acquired knowledge can be disseminated
within an organization is essential to the benchmarking process.
3. A deep-seated desire to learn. The APQC informally defines
benchmarking as being sufficiently humble to admit that others perform
some tasks better and wise enough to learn to match and surpass them
at said tasks.
Approaches to Benchmarking in Traffic Incident Management
Based on a review of TIM literature, the predominant approach to benchmarking
among TIM agencies and municipal traffic authorities focuses on internal and
competitive benchmarking. One example of pre-existent internal benchmarking occurs
in Salt Lake City, where the Utah Department of Transportation (UDOT) uses postage
paid response cards to solicit feedback from motorists involved in a traffic incident.
29
These responses provide raw data for evaluating the effectiveness of operational
changes. Other sources of data that can be used in internal benchmarking include
uniform computer aided dispatch (CAD) systems which, when properly implemented,
can generate automatic records of incident response and clearance times, and shared
radio systems (between police and transportation, and in some cities, fire personnel),
which can provide transcripts from which interagency coordination can be analyzed to
suggest updated training requirements, protocol adjustments, and required improvements
to information dissemination systems. The records generated by these systems provide
the historical basis for internal performance against which current and proposed
activities can be measured.
Competitive benchmarking among TIM agencies is facilitated by published
studies and research projects. Agencies and programs like the Federal Highway
Administration (FHWA), the Transportation Research Board (TRB), the National
Cooperative Highway Research Program (NCHRP), Texas Transportation Institute (TTI)
and Austroads provide a wealth of information about traffic incident management in not
only the United States, but in countries around the world.
Challenges to Effective Benchmarking Practices
Because TIM involving multiple agencies dispatched from a single location is a
recent development, few uniform metrics for this scenario exist. Farradyne discusses the
discrepancy between traditionally benchmarked data and incident performance
measures. He states that there is no means for comparison between agencies due to the
absence of quantitative measures [1].
30
A considerable challenge to effective internal benchmarking is the absence of
good data. Due to the high workload and responsibility levels in TIM centers, the
inconsistencies in training procedures for data entry personnel, or perhaps simply sheer
fatigue, the information found in many TIM data collection systems is either incomplete
or illogical. As discussed by Katmale and Wyrick [34], such data sets compromise
efforts at process improvement and often require careful examination of incident radio
transcripts – a time consuming process which TIM personnel cannot often indulge.
Networking at transportation conferences with professionals from other TIM
centers can make for excellent industrial benchmarking opportunities based on
proximity, personal preference, and other similarities. However, the NTIMC and similar
organizations have yet to achieve consensus buy-in by TIM agencies across the country,
thus denying prospective benchmarking partners the opportunity to utilize standardized
“best in class” performance metrics. Further, reviewing and analyzing transportation-
related literature detailing best practices and other such recommendations often requires
considerable time commitment, which TIM agencies typically cannot afford their
employees. Regrettably, crucial information contained in such reports often gain
prominence only after major transportation disasters.
Perhaps of greatest concern, is the challenge posed to effective comparisons
between TIM agencies (both intra- and inter-city) by the absence of clearly defined and
standardized measures of performance. This absence can hinder effective benchmarking
and, as noted earlier, the differences in agency goals, training procedures, and authority
structures often impede incident clearance and increase the likelihood of a secondary

31
incident. There remain, however, stellar examples of effective TIM practices which will
be presented in later chapters of this report.

32
Chapter 3 Competitive Benchmarking
As noted in the prior chapter, benchmarking is a widely accepted and proven
method for evaluating program effectiveness [22]. Recall that planning, the first stage in
benchmarking, involves identifying areas of focus and associated metrics, then utilizing
research to select appropriate data collection methods and best practices. From a
benchmarking view, incident management can be considered as a service provided to
motorists. This service is rendered by the TIM agencies through use of an incident
response process intended to minimize the impact of incidents on other motorists. In this
view, the motorists’ perception of incident response quality is a critical metric and quality
is compromised if a motorist perceives a discrepancy between their expectations for
incident response and the actual response experienced. Personal comfort also plays a
part, influenced by the degree of inconvenience the motorist associates with the incident
response process. In this case, because delays experienced by road users (clients) due to
an incident are typically unexpected and perceived as inconvenient, delay-related metrics
will likely provide a reasonable indicator of how motorists will rate a region’s incident
response quality.
Competitive Benchmarking
From a competitive benchmarking standpoint, using delay-related measures to
indicate the quality of TIM in a region would permit comparisons of incident-related
delays between different cities. These comparisons could be used to estimate the impact
of different levels of interagency coordination on incident-related delays and indicate
TIM practices associated with high-quality incident responses.
33
To explore this further, uniform data sets for incident response in several North
American cities were obtained from the Texas Transportation Institute (TTI). TTI
compiles exhaustive data sets on traffic flow in regions across the United States and
publishes an annual Urban Mobility Report. Because the Urban Mobility Report presents
various transportation-related measures for cities throughout the United States, the TTI
database has been standardized with regard to definitions of the data collected, methods
of collecting that data and the calculations utilizing that data. Time constraints and
limited access to personnel and comprehensive data sets also influenced the decision to
use the TTI data sets.
In addition to comparisons based on the data obtained from the TTI, a second
method of competitive benchmarking was also used: surveying TIM agencies from
different regions across North America. As is widely discussed in literature, surveys can
be conducted in three primary ways [36, 37]: face-to-face interviews, telephone
interviews, and self-administered questionnaires (mailings, e-mail, web based, et cetera).
Notably, the effectiveness of each survey type progressively declines, starting with the
highly effective face-to-face interviews and ending with the self-administered alternative
that is often biased by low response rates and nonchalant responses. Because survey
respondents were spread across the country, face-to-face interviews were deemed
prohibitively expensive and inefficient in view of time constraints. Telephone interviews
remained an acceptable option, but the need for detailed information on TIM practices
necessitated the design of short, self-administered surveys. The risk of low response rates
typically associated with this latter approach was mitigated through the following
techniques.
34
1. Targeted selection of respondents
Applying the criteria in the following section, Traffic Management
Center supervisors or other such professionals with a significant
interest in TIM improvements were identified as potential
respondents to this survey.
2. Initial telephone contact
Once respondents were identified, they were contacted by phone and
preliminary discussion held with each prospective respondent in order
to detail the broad objectives of the study and its expected benefits as
well as to make a personal request for participation in the survey.
3. Reiteration of survey objectives
Once a potential respondent agreed to participate, the survey was sent
by e-mail. The survey included a brief re-introduction the project,
assured participants of response and personal detail confidentiality,
and requested contact details for follow-up purposes (e.g.,
confirmation of the veracity of statements made in telephone and e-
mail correspondence.)
The questionnaire (Appendix A) was designed to elicit specific information from
which cause-effect relationships might be determined as well as provide broader details
on operations in each locale. This latter information was solicited through open-ended
questions and a request for “any additional information” deemed relevant to TIM
interagency coordination.
35
Identify Similar Regions for Comparison
In order to utilize competitive benchmarking, regions similar to Minneapolis-St.
Paul with respect to TIM had to be selected. In 2003, the Transportation Research Board
published NCHRP 520 [15], a study on incident management practices in U.S. cities
providing insight into levels of interagency coordination in each of the cities included in
the report. Selection of regions was based on the following criteria indicating a region’s
similarity to Minneapolis-St. Paul; inclusion in the Federal Highway Authority’s
Intelligent Transportation Systems (ITS) early deployment plan (EDP) and the NCHRP
520 report was weighted heavily as these provided contact information for individuals
who had participated in prior TIM studies. Table 3.1 shows the cities selected for
consideration and the criteria which applied.
1. Number of peak period travelers
Based on peak travel volume data from the Texas Transportation Institute, this
criterion was chosen on the assumption that similar numbers of peak period
travelers would yield comparable incident levels.
2. Population size
A common measure used in comparing cities, this criterion was assumed to
impact the number of peak period travelers.
3. The number of freeway miles
The number of freeway miles covered by the TIM center in question is a
measure of infrastructure availability. Comparing miles to population size
36
and traffic density was thought to provide an indication of the effectiveness of
certain TIM practices and facilitate comparisons between locales.
4. Availability of quality data
As discussed by Katmale and Wyrick [34], the availability of quality data
relevant to TIM in a given city is a major determinant. Inconsistent,
inaccurate, or missing data is a major hindrance to effective benchmarking
and improvement initiatives. The NCHRP report provided some indication of
a region’s data quality.
5. Evidence of efforts toward implementation of interagency TIM plans
The extent to which TIM activities are coordinated in a given locale was
another criterion selected. TIM activities across North America were divided
into the following categories:
Category A: Indicates proactive Traffic Incident Management
that may include co-location of several agencies in a single
command center (like the RTMC).
Category B: Although formal/procedural incident management
plans exist, they are not proactively implemented.
Category C: No Traffic Incident Management plans implemented
or published.
This criterion, coupled with explanations for the division between categories
(in Chapter 4), was assumed to provide further insight into the effect of
37
interagency interaction on Traffic Incident Management and have the
potential to assess the effect of interagency coordination on the quality of
incident response.
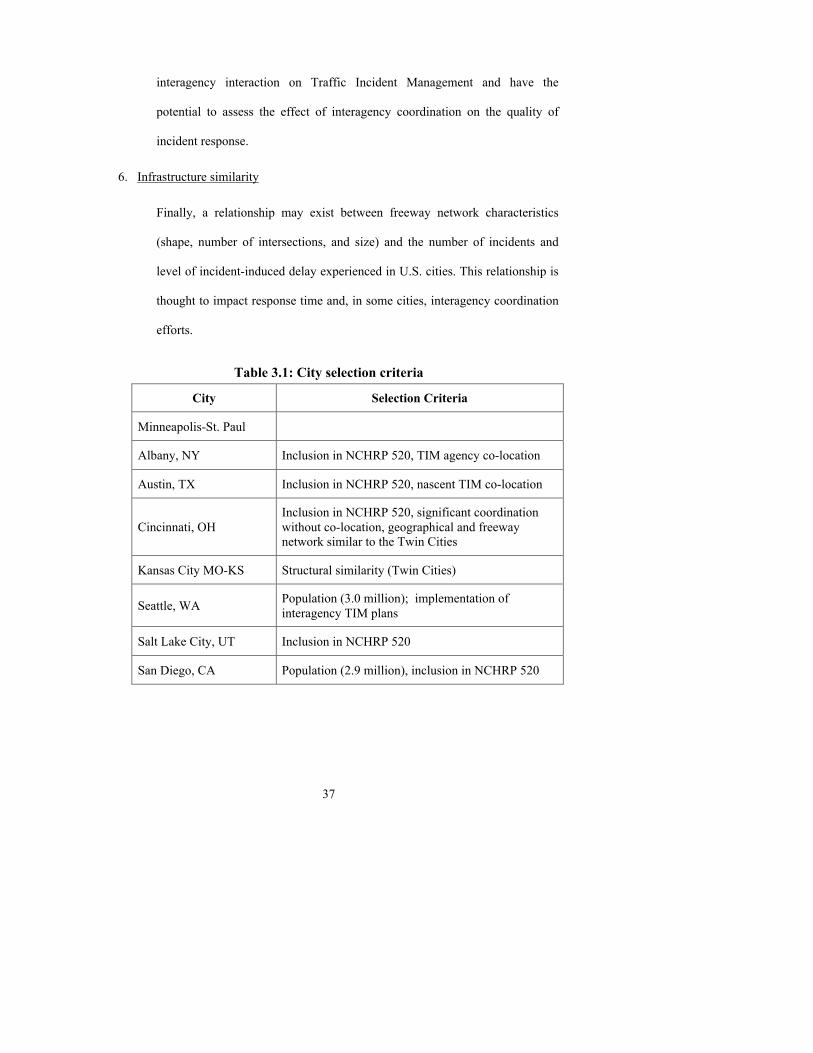
6. Infrastructure similarity
Finally, a relationship may exist between freeway network characteristics
(shape, number of intersections, and size) and the number of incidents and
level of incident-induced delay experienced in U.S. cities. This relationship is
thought to impact response time and, in some cities, interagency coordination
efforts.
Table 3.1: City selection criteria
City Selection Criteria
Minneapolis-St. Paul
Albany, NY Inclusion in NCHRP 520, TIM agency co-location
Austin, TX Inclusion in NCHRP 520, nascent TIM co-location
Cincinnati, OH Inclusion in NCHRP 520, significant coordination without co-location, geographical and freeway network similar to the Twin Cities
Kansas City MO-KS Structural similarity (Twin Cities)
Seattle, WA Population (3.0 million); implementation of interagency TIM plans
Salt Lake City, UT Inclusion in NCHRP 520
San Diego, CA Population (2.9 million), inclusion in NCHRP 520

38
At this point, some detail regarding the individual regions selected is warranted.
Albany is a small city in which co-location and resource sharing between police and
transportation officials occurs primarily as a result of proximity to the New York
Thruway system. The inclusion of Austin gives some insight into conditions before co-
location and the process of achieving coordination between agencies. TIM practices in
Cincinnati involve a wide array of public and private agencies. Coordination between
these agencies appears to rival that of most co-located areas. This case seems to challenge
the need for co-location and provides an interesting perspective.
Kansas City, geographically split between Missouri and Kansas, was chosen
primarily due to its structural (municipal) similarity to Minneapolis-St. Paul. Being a
“twin city” in Missouri and Kansas, any effect of jurisdiction overlap or other
administrative issues should - to some extent - be evident in both cities. If an effect is not
evident in one of the cities the method of mitigating such problems might be included in
best practice recommendations for implementation in the other city.
While having a strikingly different geographical layout from Minneapolis-St.
Paul, Seattle is a larger city in which interagency coordination has also been
implemented, although lacking a co-located center on the scale of the RTMC. Its
inclusion was partly driven by the degree of cooperation by officials at the Washington
Department of Transportation.
The effect of geographical layout can be discussed in light of data from San
Francisco, which was included based on analysis by Brooke (2004) in the NCHRP 520
report. Also identified in the NCHRP 520 report, Salt Lake City is a growing, medium-
39
sized city (population: 1.06 million) [35]. Though located in a single building, police and
transportation personnel operate out of separate areas.
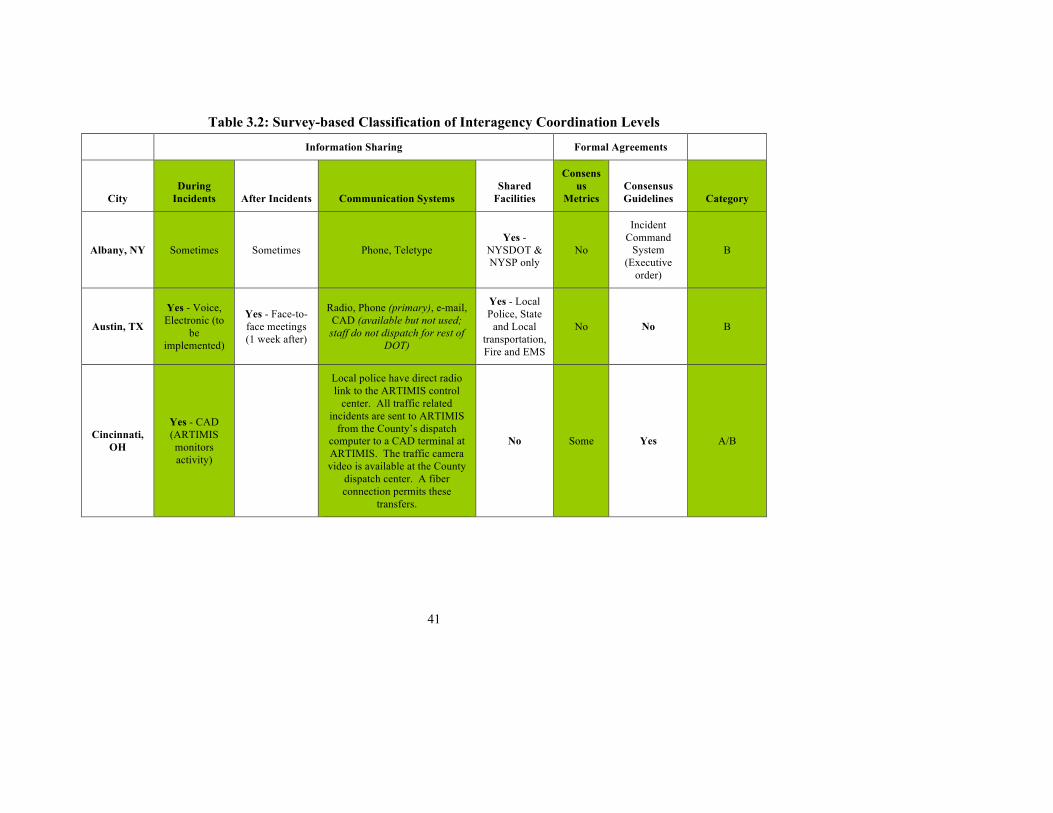
Results
The survey results are summarized in Table 3.2; see Appendix C for the unedited
responses to the open-ended questions on the survey. With respect to the latter, while
several respondents indicated improvements to TIM as a result of coordination between
agencies, most responses reinforced the pattern evident in the literature of portraying
qualitative benefits with little or no quantitative basis – apart from possible cost savings
to the agencies involved.
While spending reductions are beneficial, the objective of most TIM agencies
remains the maintenance of safe and “hassle-free” traffic flow. As defined earlier,
incident-induced delay refers to both reductions in the free flow of traffic that are solely
due to an incident and delays that are exacerbated (i.e., in addition to normal traffic
delays) as a result of traffic incidents. Anecdotally, TIM-related improvements (i.e.,
improved interagency coordination plans, increased traffic capacity (e.g., additional
lanes)) are believed to positively impact motorists as reflected in changes to incident-
induced delay over the years. On the other hand, these impacts may be masked by
increases in regional population and road construction projects.
Notably, cities in which co-location does not exist are relatively small compared
to Minneapolis-St. Paul. Further, attempts at correlating delay data with population or
size of the freeway network (in miles) proved unsuccessful. Although the number of
miles in a regional freeway network tended to increase as the region’s population
40
climbed, the rate of increase varied widely between cities. Thus, an alternative method
of evaluation was devised in which cities were divided into the following three categories
reflecting the levels of interagency coordination:
Category A: Proactive interagency Traffic Incident Management.
Category B: Formal/procedural interagency incident management plans.
Category C: No interagency Traffic Incident Management plans.
Table 3.2 indicates the category assigned to each city selected for this study as well as the
factors used in assigning these classifications.
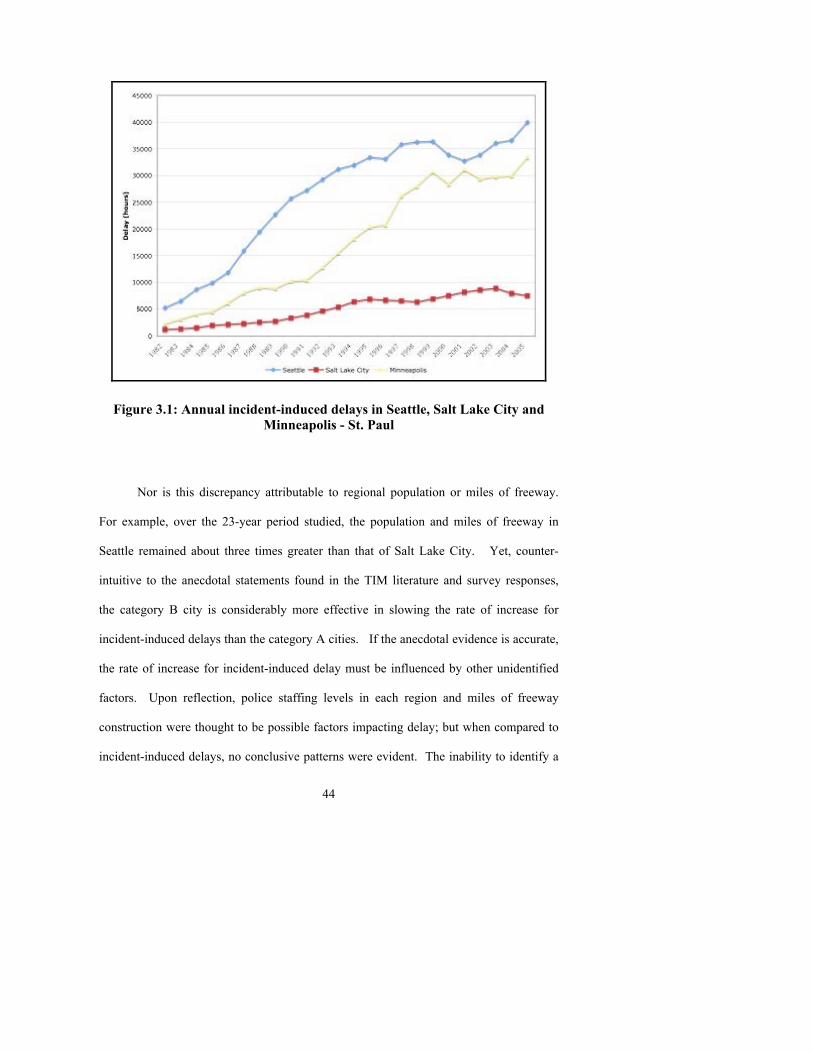
Once assigned, TIM efforts in category A cities were compared with efforts in
cities assigned to categories B and C in hopes of identifying any effect on incident-
induced delays due to coordination level. However, this also was unsuccessful, as
illustrated by Figure 3.1 which compares incident-induced delay in three cities.
Minneapolis falls into category A as does Seattle, the latter providing one of the best
examples of interagency collaboration in terms of protocol and goal setting for TIM
practices. Yet between 1982 and 2005, delays in both cities increased at roughly 1.25
million hours/year while delays in Salt Lake City, placed in category B because TIM
agencies are located in separate rooms and lack formal inter-agency agreements,
increased only about 0.25 million hours/year.
41
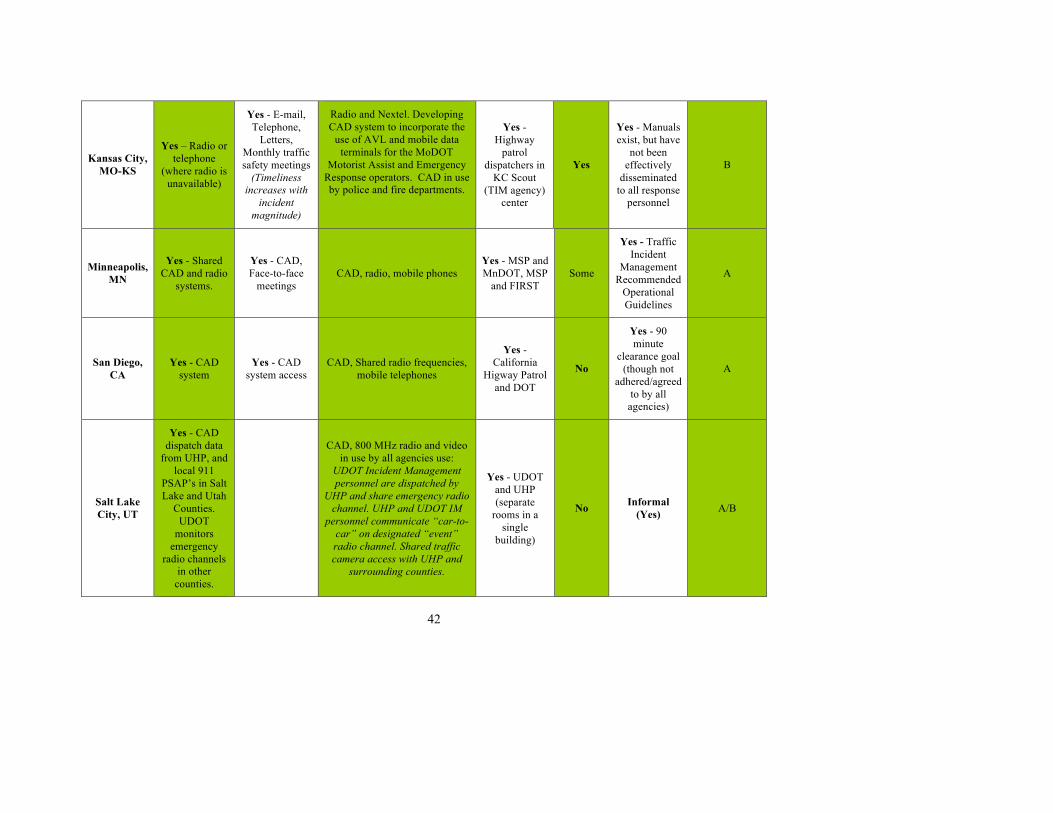
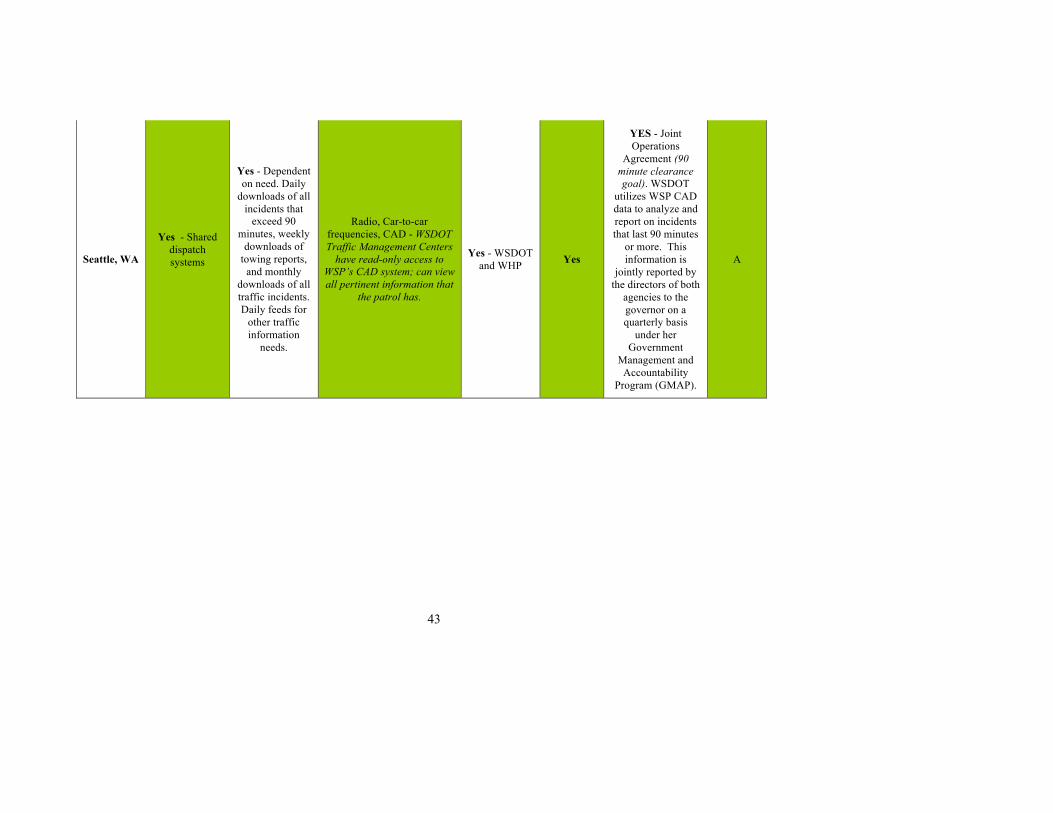
Table 3.2: Survey-based Classification of Interagency Coordination Levels
Information Sharing Formal Agreements
City During
Incidents After Incidents Communication Systems Shared
Facilities
Consensus
Metrics Consensus Guidelines Category
Albany, NY Sometimes Sometimes Phone, Teletype Yes -
NYSDOT & NYSP only
No
Incident Command
System (Executive
order)
B
Austin, TX
Yes - Voice, Electronic (to
be implemented)
Yes - Face-to-face meetings (1 week after)
Radio, Phone (primary), e-mail, CAD (available but not used; staff do not dispatch for rest of
DOT)
Yes - Local Police, State
and Local transportation, Fire and EMS
No No B
Cincinnati, OH
Yes - CAD (ARTIMIS monitors activity)
Local police have direct radio link to the ARTIMIS control
center. All traffic related incidents are sent to ARTIMIS
from the County’s dispatch computer to a CAD terminal at ARTIMIS. The traffic camera video is available at the County
dispatch center. A fiber connection permits these
transfers.
No Some Yes A/B
42
Kansas City, MO-KS
Yes – Radio or telephone
(where radio is unavailable)
Yes - E-mail, Telephone,
Letters, Monthly traffic safety meetings
(Timeliness increases with
incident magnitude)
Radio and Nextel. Developing CAD system to incorporate the
use of AVL and mobile data terminals for the MoDOT
Motorist Assist and Emergency Response operators. CAD in use by police and fire departments.
Yes - Highway
patrol dispatchers in
KC Scout (TIM agency)
center
Yes
Yes - Manuals exist, but have
not been effectively
disseminated to all response
personnel
B
Minneapolis, MN
Yes - Shared CAD and radio
systems.
Yes - CAD, Face-to-face
meetings CAD, radio, mobile phones
Yes - MSP and MnDOT, MSP
and FIRST Some
Yes - Traffic Incident
Management Recommended
Operational Guidelines
A
San Diego, CA
Yes - CAD system
Yes - CAD system access
CAD, Shared radio frequencies, mobile telephones
Yes - California
Higway Patrol and DOT
No
Yes - 90 minute
clearance goal (though not
adhered/agreed to by all
agencies)
A
Salt Lake City, UT
Yes - CAD dispatch data
from UHP, and local 911
PSAP’s in Salt Lake and Utah
Counties. UDOT
monitors emergency
radio channels in other
counties.
CAD, 800 MHz radio and video in use by all agencies use:
UDOT Incident Management personnel are dispatched by
UHP and share emergency radio channel. UHP and UDOT IM
personnel communicate “car-to-car” on designated “event” radio channel. Shared traffic camera access with UHP and
surrounding counties.
Yes - UDOT and UHP (separate
rooms in a single
building)
No Informal (Yes) A/B
43
Seattle, WA
Yes - Shared dispatch systems
Yes - Dependent on need. Daily
downloads of all incidents that
exceed 90 minutes, weekly
downloads of towing reports,
and monthly downloads of all traffic incidents. Daily feeds for
other traffic information
needs.
Radio, Car-to-car frequencies, CAD - WSDOT Traffic Management Centers
have read-only access to WSP’s CAD system; can view all pertinent information that
the patrol has.
Yes - WSDOT and WHP Yes
YES - Joint Operations
Agreement (90 minute clearance goal). WSDOT
utilizes WSP CAD data to analyze and report on incidents that last 90 minutes
or more. This information is
jointly reported by the directors of both
agencies to the governor on a quarterly basis
under her Government
Management and Accountability
Program (GMAP).
A
44
Figure 3.1: Annual incident-induced delays in Seattle, Salt Lake City and Minneapolis - St. Paul
Nor is this discrepancy attributable to regional population or miles of freeway.
For example, over the 23-year period studied, the population and miles of freeway in
Seattle remained about three times greater than that of Salt Lake City. Yet, counter-
intuitive to the anecdotal statements found in the TIM literature and survey responses,
the category B city is considerably more effective in slowing the rate of increase for
incident-induced delays than the category A cities. If the anecdotal evidence is accurate,
the rate of increase for incident-induced delay must be influenced by other unidentified
factors. Upon reflection, police staffing levels in each region and miles of freeway
construction were thought to be possible factors impacting delay; but when compared to
incident-induced delays, no conclusive patterns were evident. The inability to identify a

45
factor influencing this particular incident-induced delay measure begins to suggest that,
although appropriate for the TTI urban mobility report, it may not be an appropriate
metric for competitive benchmarking between cities.
However, this metric might still be useful for competitive benchmarking if one
considers the rate of increase before and after implementing one or more TIM
improvement strategies. Given that survey respondents had been asked to provide
timeline information for TIM efforts, perhaps implementation of TIM practices could be
correlated with changes in the rate of incident-induced delay. Yet once again, the
evidence was inconclusive - although certain strategies seemed to have yielded
improvements within a year of implementation.
• Cincinnati: after the Advanced Regional Traffic Interactive
Management and Information System (ARTIMIS) became operational,
the rate of increase in delay dropped from a 19% annual increase
between 1982 and 1994 to a 4% annual increase between 1995 (the
year of implementation) and 2005.
• Salt Lake City: After a co-located TIM center was built, a 15% rate of
increase in annual delay between 1982 and 1994 gave way to a 2%
annual reduction for the next five years.
• Seattle: On average, the rate of incident-induced delay dropped from a
14% annual increase prior to a 2% annual decrease over a five year
period after TIM agencies were co-located.
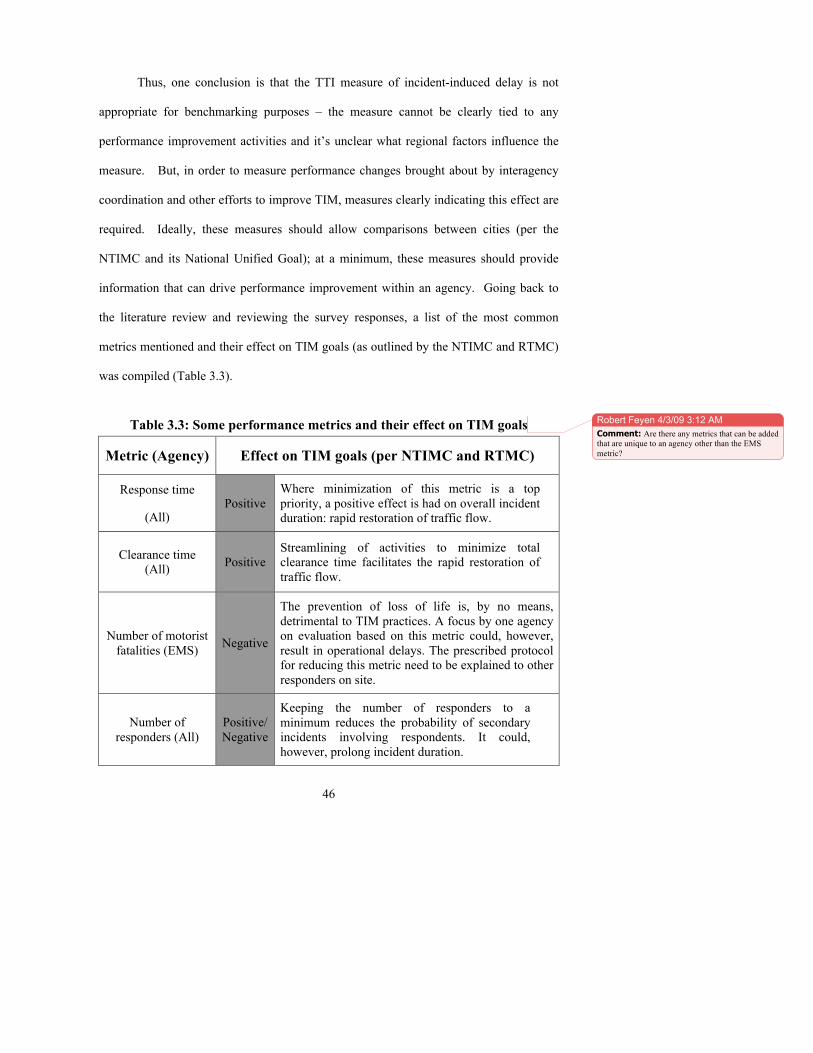
46
Thus, one conclusion is that the TTI measure of incident-induced delay is not
appropriate for benchmarking purposes – the measure cannot be clearly tied to any
performance improvement activities and it’s unclear what regional factors influence the
measure. But, in order to measure performance changes brought about by interagency
coordination and other efforts to improve TIM, measures clearly indicating this effect are
required. Ideally, these measures should allow comparisons between cities (per the
NTIMC and its National Unified Goal); at a minimum, these measures should provide
information that can drive performance improvement within an agency. Going back to
the literature review and reviewing the survey responses, a list of the most common
metrics mentioned and their effect on TIM goals (as outlined by the NTIMC and RTMC)
was compiled (Table 3.3).
Table 3.3: Some performance metrics and their effect on TIM goals
Metric (Agency) Effect on TIM goals (per NTIMC and RTMC)
Response time
(All) Positive
Where minimization of this metric is a top priority, a positive effect is had on overall incident duration: rapid restoration of traffic flow.
Clearance time (All) Positive
Streamlining of activities to minimize total clearance time facilitates the rapid restoration of traffic flow.
Number of motorist fatalities (EMS) Negative
The prevention of loss of life is, by no means, detrimental to TIM practices. A focus by one agency on evaluation based on this metric could, however, result in operational delays. The prescribed protocol for reducing this metric need to be explained to other responders on site.
Number of responders (All)
Positive/Negative
Keeping the number of responders to a minimum reduces the probability of secondary incidents involving respondents. It could, however, prolong incident duration.
Robert Feyen � 4/3/09 3:12 AMComment: Are there any metrics that can be added that are unique to an agency other than the EMS metric?
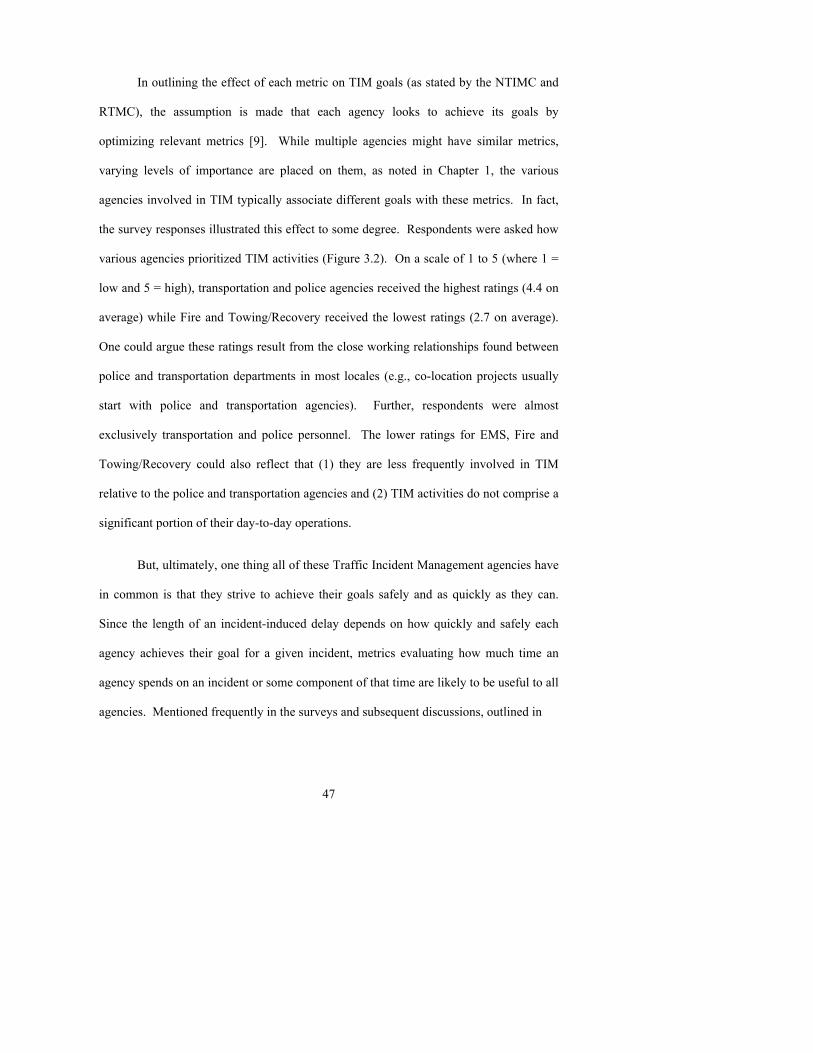
47
In outlining the effect of each metric on TIM goals (as stated by the NTIMC and
RTMC), the assumption is made that each agency looks to achieve its goals by
optimizing relevant metrics [9]. While multiple agencies might have similar metrics,
varying levels of importance are placed on them, as noted in Chapter 1, the various
agencies involved in TIM typically associate different goals with these metrics. In fact,
the survey responses illustrated this effect to some degree. Respondents were asked how
various agencies prioritized TIM activities (Figure 3.2). On a scale of 1 to 5 (where 1 =
low and 5 = high), transportation and police agencies received the highest ratings (4.4 on
average) while Fire and Towing/Recovery received the lowest ratings (2.7 on average).
One could argue these ratings result from the close working relationships found between
police and transportation departments in most locales (e.g., co-location projects usually
start with police and transportation agencies). Further, respondents were almost
exclusively transportation and police personnel. The lower ratings for EMS, Fire and
Towing/Recovery could also reflect that (1) they are less frequently involved in TIM
relative to the police and transportation agencies and (2) TIM activities do not comprise a
significant portion of their day-to-day operations.
But, ultimately, one thing all of these Traffic Incident Management agencies have
in common is that they strive to achieve their goals safely and as quickly as they can.
Since the length of an incident-induced delay depends on how quickly and safely each
agency achieves their goal for a given incident, metrics evaluating how much time an
agency spends on an incident or some component of that time are likely to be useful to all
agencies. Mentioned frequently in the surveys and subsequent discussions, outlined in

48
Figure 3.2: Agency-specific TIM priorities (average values)
the Traffic Incident Management Handbook [1] and widely used across the United States,
three time-based metrics seem particularly appropriate. All agencies involved can easily
collect and understand these measures; plus, they can be used for both competitive and
internal benchmarking:
1. Agency response time – the elapsed time between when an
incident is detected to when an agency's response vehicle arrives at
the scene;
2. Clearance time – the elapsed time between the arrival of the first
response vehicle and the restoration of traffic flow to normal
levels; and

49
3. Incident duration – the elapsed time between detection and
departure of the last response vehicle from the scene.
These measures can easily be defined differently between agencies: for example,
response time may be broken down into two separate pieces: incident detection to vehicle
dispatch and vehicle dispatch to arrival on the scene. On the one hand, a tow agency
would likely treat response time as dispatch to arrival since they have little to do with
incident detection; however, a police or transportation agency would likely use the formal
definition above. For this reason, terms should be clearly defined and standardized
between agencies. This is especially important if a national organization such as the
NTIMC were to promote collection and dissemination of standardized performance
metrics across the country for the purposes of competitive benchmarking and
performance improvement. Until that occurs, competitive benchmarking of TIM efforts
between cities will be a very difficult and perhaps meaningless endeavor. On the other
hand, internal benchmarking deserves a closer look.

50
Chapter 4 Internal Benchmarking
In addressing this report’s first objective, the close of the last chapter suggested
the following may be the one goal easily shared by all agencies involved in traffic
incident response:
Without compromising safety, minimize the time spent dealing with a
traffic-related incident.
At first glance, this goal seems “common sense” and obvious. Perhaps it is. But therein
lay the issue: for much the same reason, this goal appears to be the 800-lb pink elephant
in the room that no one talks about. And so, very few TIM agencies devote much
consistent effort or coordination with other agencies towards this specific goal.
This is not to say TIM agencies are unconcerned with incident response times.
On the contrary, almost all TIM agencies surveyed or described in the literature collect
some element of timing data. After all, some form of response, clearance, and overall
incident duration times are recorded and archived by almost all TIM agencies and some
use descriptive statistics to address specific questions about incident response. Others,
like the RTMC, archive descriptive incident data as well. A select few TIM agencies go
further and compare incident durations to a predetermined threshold value (e.g., 60
minutes) in order to consistently trigger a review of incidents that are not resolved
quickly.
Beyond that, though, none of the agencies contacted or described in the literature
appear to do much quantitative analysis beyond this. Is this surprising? Not really, when

51
one considers that 72 metro area TIM agencies have already reported that the two areas in
which they have the least success are in interagency coordination and quantitative
evaluation [2, 13].
But the goal stated above may actually help TIM agencies achieve success in
these areas: providing a common ground for coordinating incident response efforts across
agencies, it utilizes an easily collected and understood variable: time. Now, assume that
an interagency TIM team adopts this as their goal. How might they use this goal to guide
how they coordinate incident response efforts? What incident data would be needed?
How could this data be used by various agencies to measure how well they are meeting
performance objectives?
Recalling the earlier discussion from Chapter 2, one could consider the incident
response timeline (repeated in Figure 4.1) as a simple process flow diagram. The
incident response process requires various responders (or, resources) to perform a number
of tasks sequentially, either independently or cooperatively, so they can achieve the
overall common goal while meeting their own specific objectives. Internal
benchmarking strives to improve this process by using past performance as the starting
point for comparisons with future performance. Recall that the steps in benchmarking a
process are planning, collecting data, analyzing data and adapting the process. In this
case, planning involves selecting appropriate metrics based on knowledge of the process
and the goal to be achieved. The next step is collecting or obtaining the data necessary to
evaluate these metrics. The data is then analyzed and results used to generate ideas for
improving (adapting) the overall process.
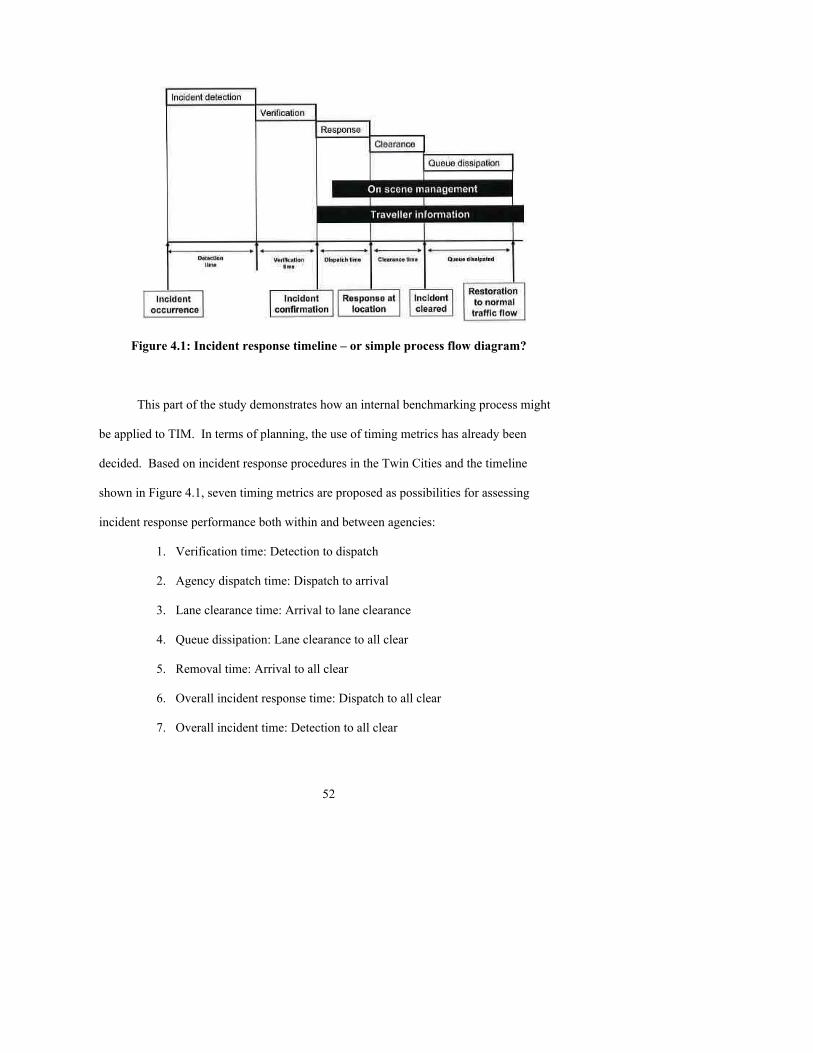
52
Figure 4.1: Incident response timeline – or simple process flow diagram?
This part of the study demonstrates how an internal benchmarking process might
be applied to TIM. In terms of planning, the use of timing metrics has already been
decided. Based on incident response procedures in the Twin Cities and the timeline
shown in Figure 4.1, seven timing metrics are proposed as possibilities for assessing
incident response performance both within and between agencies:
1. Verification time: Detection to dispatch
2. Agency dispatch time: Dispatch to arrival
3. Lane clearance time: Arrival to lane clearance
4. Queue dissipation: Lane clearance to all clear
5. Removal time: Arrival to all clear
6. Overall incident response time: Dispatch to all clear
7. Overall incident time: Detection to all clear

53
For the second step of the internal benchmarking procedure, historical incident
response data will be obtained for a small segment of the Twin Cities freeway network
and, in the third step, used to establish performance benchmarks for a select subset of
metrics. These benchmarks set the standard against which future incident response
performance should be compared and may help identify a core set of factors impacting
the incident response duration. In terms of analysis, the various factors considered most
likely to impact the duration of an incident response are:
• Location
• Time of day
• Direction of travel
• Incident type
• Weather conditions
• Number and type of vehicles involved
• Number and location of lanes involved
• Number and type of responders required on scene
• Traffic queues (delay)
As a result of one or more of these factors, the times associated with the incident
response process are never the same – in other words, the timing metrics exhibit
variability. However, one tenet of production and operations management is that, as
variability increases, process performance decreases (i.e., on average, the process will
also take more time). Further, variability occurring early in a process will often increase
the overall process time more than variability occurring late in the process. Thus,
determining where and how much variability occurs in the process will indicate the
54
segment to be worked on first and what might be done to yield the most process
improvement – the final step in the internal benchmarking process.
Data Collection and Analysis
At present, RTMC personnel collect incident response data differently than they
did when this project started. Under a project through the Minnesota Guidestar
initiative, the Conditions Acquisition and Reporting System (CARS) tool has been
integrated with the Minnesota State Police’s Computer Aided Dispatch (CAD) system.
The CARS tool is linked directly to the 511 traveler information system to provide
information on transportation-related events and conditions. Information input to CARS
is reflected in the various messages, maps and displays generated by the 511 phone and
web-based systems. Linking the two systems was done in hopes of providing more
accurate and up-to-date traveler information, particularly with respect to crashes and
other incidents available via the 511 phone and web systems (Figure 4.2) while
eliminating the redundancy of data entry into both the CARS and CAD systems. This
also allowed RTMC staff to stop entering incident response data into a separate incident
log maintained by the on-duty Traffic Information Officers.
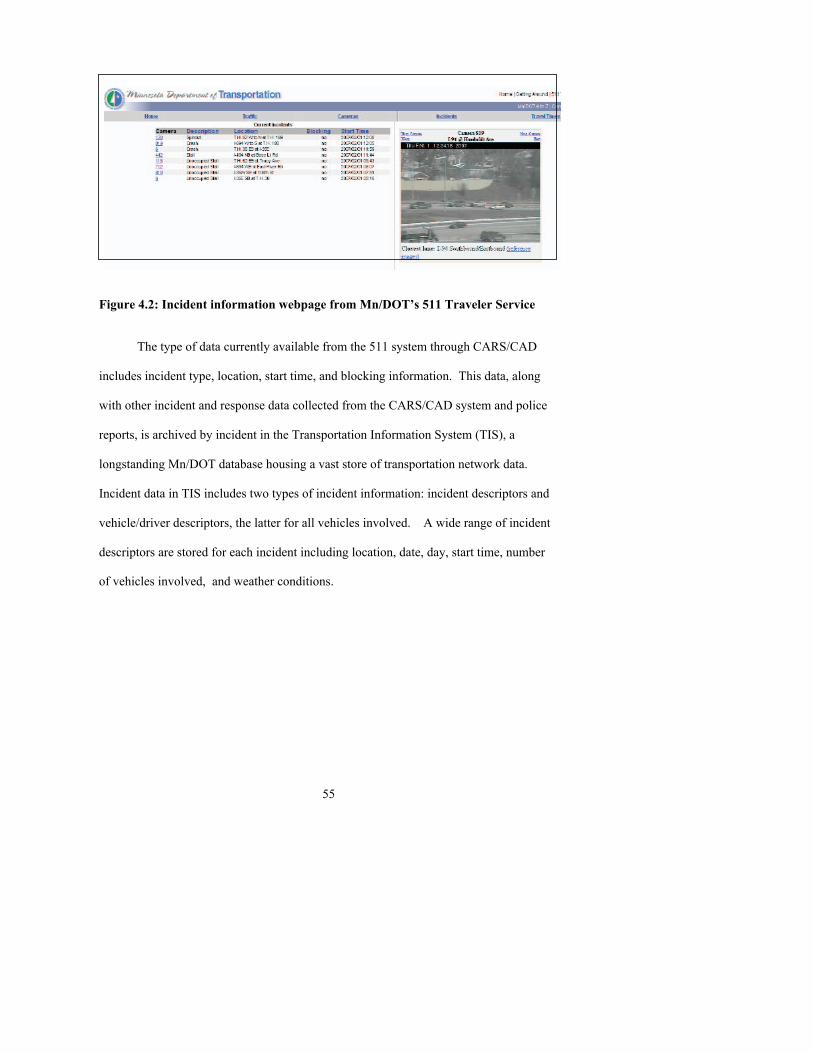
55
Figure 4.2: Incident information webpage from Mn/DOT’s 511 Traveler Service
The type of data currently available from the 511 system through CARS/CAD
includes incident type, location, start time, and blocking information. This data, along
with other incident and response data collected from the CARS/CAD system and police
reports, is archived by incident in the Transportation Information System (TIS), a
longstanding Mn/DOT database housing a vast store of transportation network data.
Incident data in TIS includes two types of incident information: incident descriptors and
vehicle/driver descriptors, the latter for all vehicles involved. A wide range of incident
descriptors are stored for each incident including location, date, day, start time, number
of vehicles involved, and weather conditions.
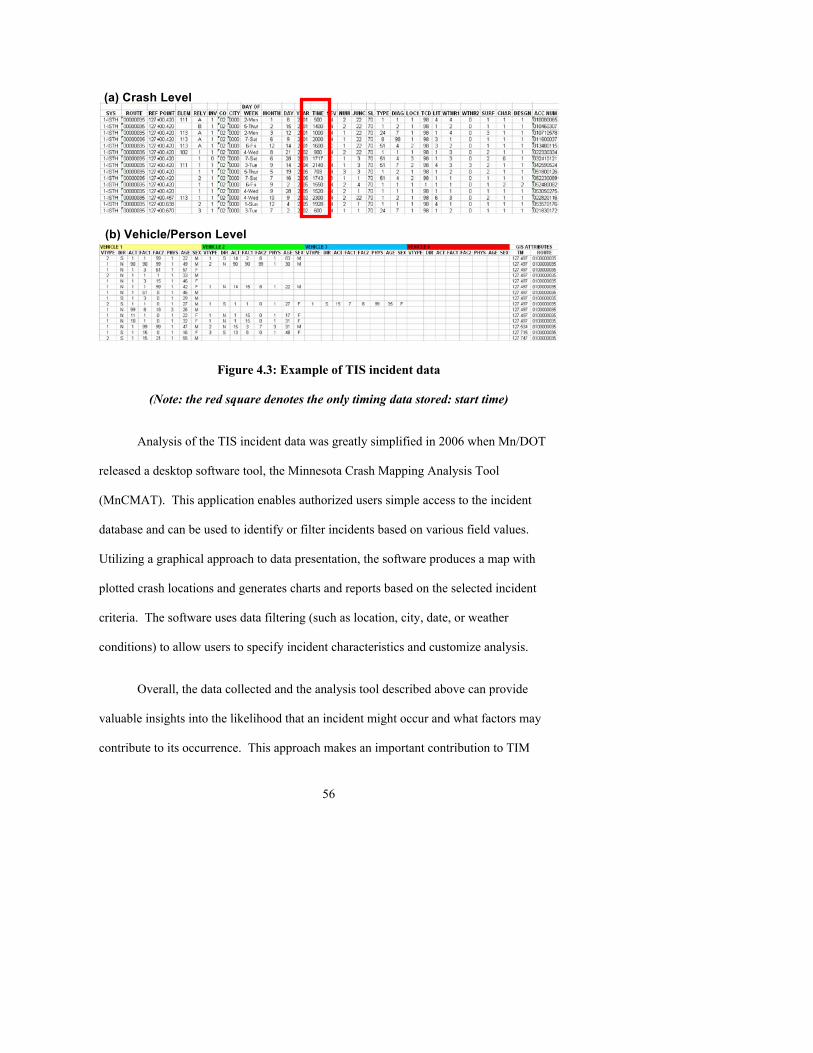
56
Figure 4.3: Example of TIS incident data
(Note: the red square denotes the only timing data stored: start time)
Analysis of the TIS incident data was greatly simplified in 2006 when Mn/DOT
released a desktop software tool, the Minnesota Crash Mapping Analysis Tool
(MnCMAT). This application enables authorized users simple access to the incident
database and can be used to identify or filter incidents based on various field values.
Utilizing a graphical approach to data presentation, the software produces a map with
plotted crash locations and generates charts and reports based on the selected incident
criteria. The software uses data filtering (such as location, city, date, or weather
conditions) to allow users to specify incident characteristics and customize analysis.
Overall, the data collected and the analysis tool described above can provide
valuable insights into the likelihood that an incident might occur and what factors may
contribute to its occurrence. This approach makes an important contribution to TIM
(a) Crash Level
(b) Vehicle/Person Level
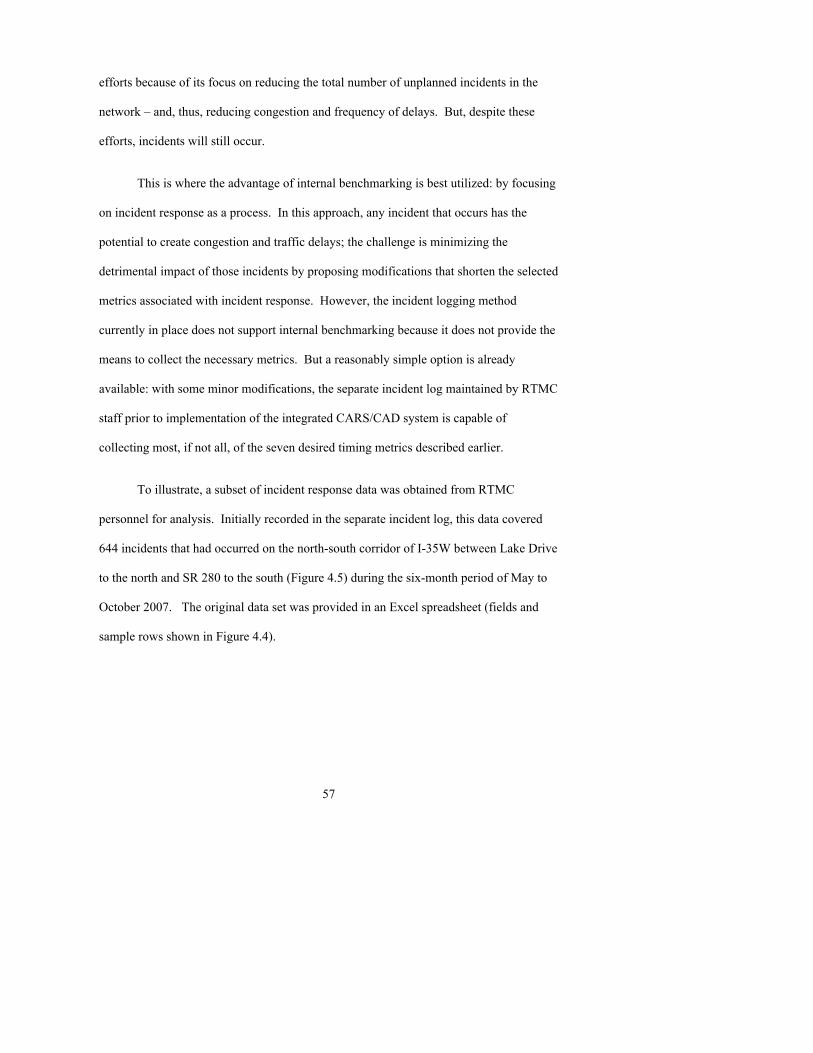
57
efforts because of its focus on reducing the total number of unplanned incidents in the
network – and, thus, reducing congestion and frequency of delays. But, despite these
efforts, incidents will still occur.
This is where the advantage of internal benchmarking is best utilized: by focusing
on incident response as a process. In this approach, any incident that occurs has the
potential to create congestion and traffic delays; the challenge is minimizing the
detrimental impact of those incidents by proposing modifications that shorten the selected
metrics associated with incident response. However, the incident logging method
currently in place does not support internal benchmarking because it does not provide the
means to collect the necessary metrics. But a reasonably simple option is already
available: with some minor modifications, the separate incident log maintained by RTMC
staff prior to implementation of the integrated CARS/CAD system is capable of
collecting most, if not all, of the seven desired timing metrics described earlier.
To illustrate, a subset of incident response data was obtained from RTMC
personnel for analysis. Initially recorded in the separate incident log, this data covered
644 incidents that had occurred on the north-south corridor of I-35W between Lake Drive
to the north and SR 280 to the south (Figure 4.5) during the six-month period of May to
October 2007. The original data set was provided in an Excel spreadsheet (fields and
sample rows shown in Figure 4.4).
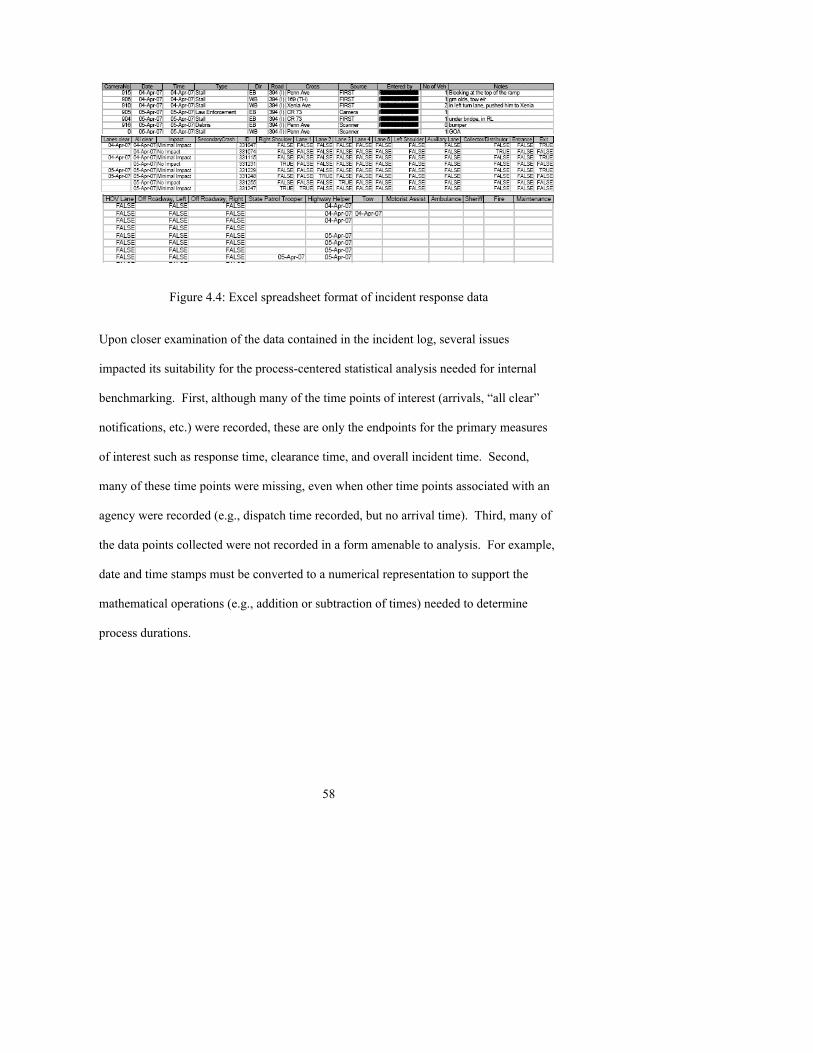
58
Figure 4.4: Excel spreadsheet format of incident response data
Upon closer examination of the data contained in the incident log, several issues
impacted its suitability for the process-centered statistical analysis needed for internal
benchmarking. First, although many of the time points of interest (arrivals, “all clear”
notifications, etc.) were recorded, these are only the endpoints for the primary measures
of interest such as response time, clearance time, and overall incident time. Second,
many of these time points were missing, even when other time points associated with an
agency were recorded (e.g., dispatch time recorded, but no arrival time). Third, many of
the data points collected were not recorded in a form amenable to analysis. For example,
date and time stamps must be converted to a numerical representation to support the
mathematical operations (e.g., addition or subtraction of times) needed to determine
process durations.
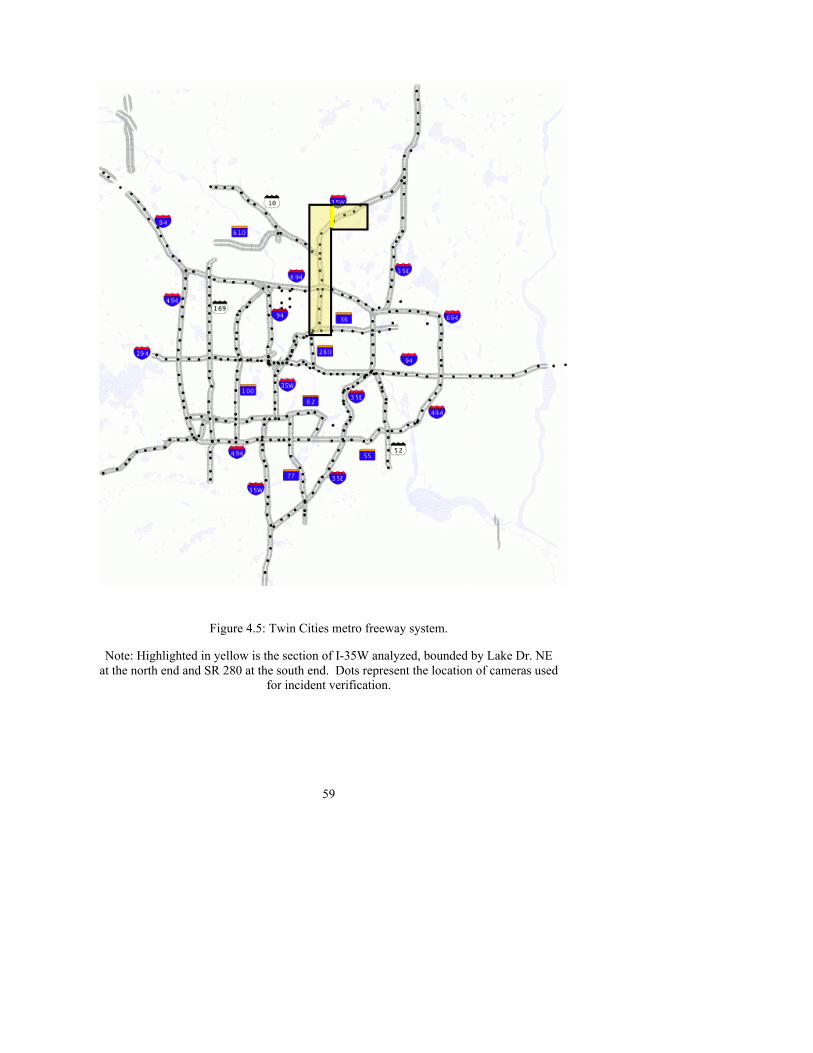
59
Figure 4.5: Twin Cities metro freeway system.
Note: Highlighted in yellow is the section of I-35W analyzed, bounded by Lake Dr. NE at the north end and SR 280 at the south end. Dots represent the location of cameras used
for incident verification.
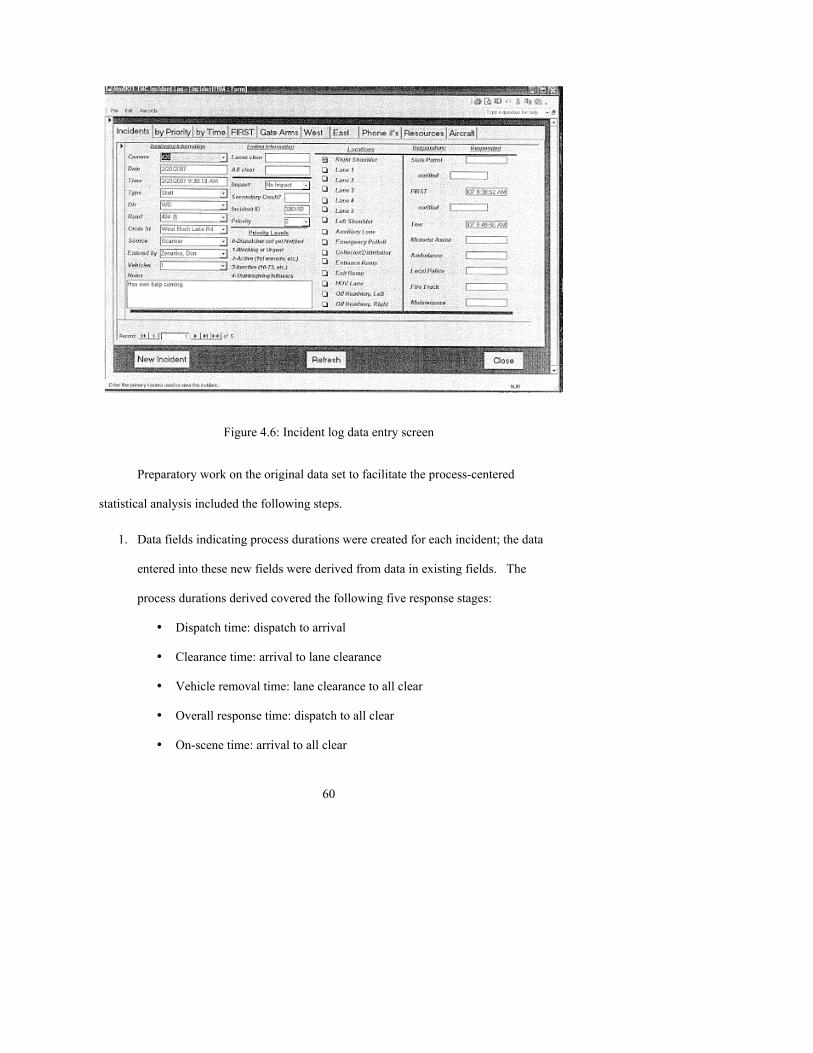
60
Figure 4.6: Incident log data entry screen
Preparatory work on the original data set to facilitate the process-centered
statistical analysis included the following steps.
1. Data fields indicating process durations were created for each incident; the data
entered into these new fields were derived from data in existing fields. The
process durations derived covered the following five response stages:
• Dispatch time: dispatch to arrival
• Clearance time: arrival to lane clearance
• Vehicle removal time: lane clearance to all clear
• Overall response time: dispatch to all clear
• On-scene time: arrival to all clear
61
2. Categorical data such as time of day, impact, vehicle position relative to roadway
and agencies responding were recoded to support statistical comparisons using
contingency tables. For example, time of day was recoded to the closest hour and
recorded in 24 hour format (e.g., “2:15:05 pm” would be recoded as “14”).
3. The existing categorical data were screened for subtle coding differences that
could impact analysis; for example, spelling errors or extra spaces in a code
would result in that term being treated as a unique categorical level (e.g., “NW”
and “N W” would be treated separately).
4. The overall data set was screened for errors and anomalies: for example, several
incidents were logged with date stamps of 01/01/00 or had overall incident times
exceeding 24 hours; these incidents were excluded from analysis.
Upon completion, the modified data set was imported into JMP, a statistical exploration
tool developed by SAS, Inc. and analyzed using five different methods:
• Descriptive statistics
• One-way factor analysis
• Model fitting
• Variability charting.
• Contingency analysis
In addition to the five statistical analyses, one other important analysis method was
carried out to assist in the benchmarking task: process charting. For all six methods,
examples of possible benchmarks will be presented – but the examples are by no means
exhaustive. Other benchmarks may also be relevant based on the needs or questions
posed by the agency conducting the benchmarking task.
62
Results
The following results are presented solely for demonstration purposes. Because
the dataset obtained did not contain sufficient data to make statistically valid conclusions
for certain analyses, the following results should not be used as the basis for conclusions
or statements pertaining to actual incident response performance.
Descriptive Statistics
To simplify analysis for purposes of this demonstration, only occupied stalls were
examined further. All analyses conducted, however, can be extended to the other
incident types. The rationale for this decision stems from the finding that, of the 644
total incidents in the dataset, occupied stalls were by far the most frequent incident type:
359 (56%) Occupied stalls
125 (19%) Crashes (including rollovers and spinouts)
56 ( 9%) Unoccupied stalls
40 ( 6%) Debris-related incidents
64 (10%) Other (fire, law enforcement, maintenance, pedestrians, etc.)
Within the dataset, insufficient data was recorded to accurately generate many of the
basic metrics pertaining to occupied vehicle stalls in which only state police (MSP) or
tow services responded (i.e., average response times or overall duration times for
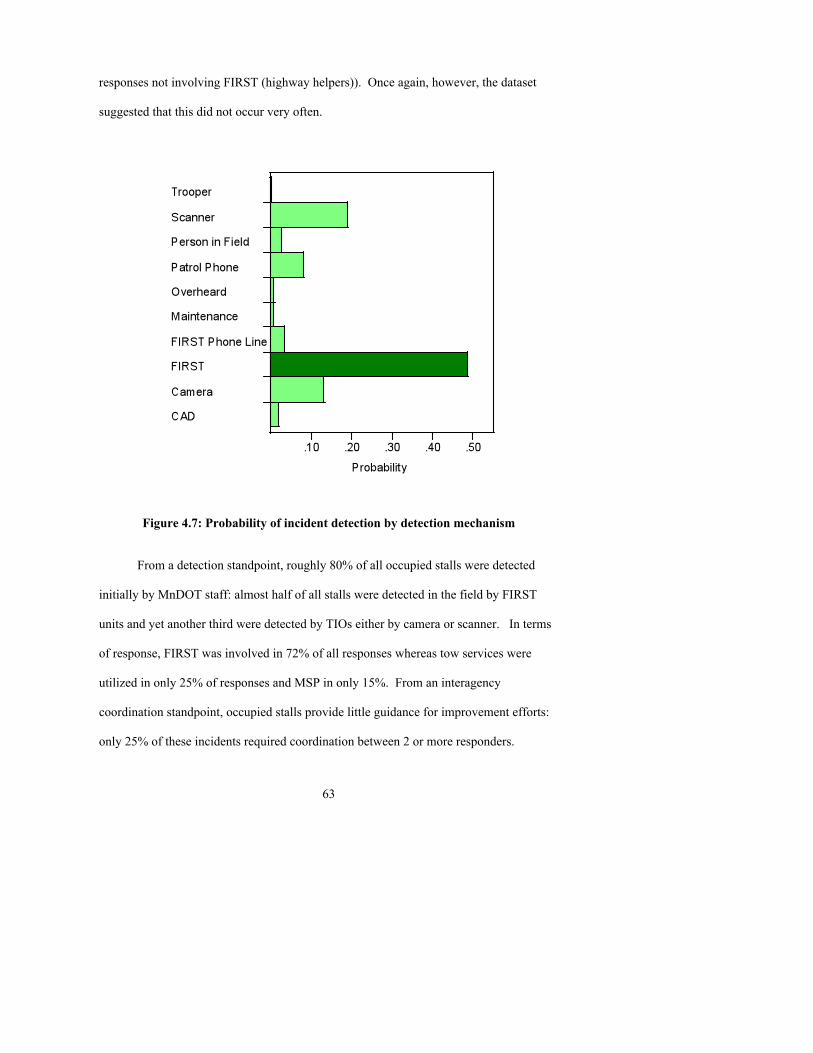
63
responses not involving FIRST (highway helpers)). Once again, however, the dataset
suggested that this did not occur very often.
Figure 4.7: Probability of incident detection by detection mechanism
From a detection standpoint, roughly 80% of all occupied stalls were detected
initially by MnDOT staff: almost half of all stalls were detected in the field by FIRST
units and yet another third were detected by TIOs either by camera or scanner. In terms
of response, FIRST was involved in 72% of all responses whereas tow services were
utilized in only 25% of responses and MSP in only 15%. From an interagency
coordination standpoint, occupied stalls provide little guidance for improvement efforts:
only 25% of these incidents required coordination between 2 or more responders.

64
On average, the performance benchmarks for FIRST vehicles responding to an
occupied vehicle stall were
• FIRST dispatch time: mean = 12 minutes SD = 8 minutes
• Lane clearance time: mean = 9 minutes SD = 14 minutes
• Vehicle removal time: mean = 19 minutes SD = 28 minutes
• Overall response time: mean = 36 minutes SD = 30 minutes
One-way analyses
One-way statistical analyses examine the effect of a single factor on a variable
(e.g., performance metric). Quite often, these include an analysis of variance (ANOVA)
and comparisons of means associated with different factor levels (i.e., conditions). From
an incident response benchmarking standpoint, this may be useful for determining if one
specific condition yields timing metrics significantly different (e.g., longer) than during
other conditions and can guide TIM interventions to take advantage or downplay
disadvantages posed by a specific condition.
In developing this benchmarking demonstration, 40 analysis of variance
(ANOVA) tests were used to explore the statistical significance of factors (or, main
effects) on incidence response metrics. A factor was considered significant if the p-value
from the ANOVA test was greater than 0.05. Effects were graphed using quartile box
plots (in which the bottom floating line represents the 10th percentile and the top floating
line represents the 90th percentile; the bottom, middle, and top lines of the box represent
the 25th, 50th, and 75th percentiles respectively), a line showing the overall mean, and

65
means comparison circles (with a diameter representing the 95% confidence interval - if
two circles overlap, the factors associated with those two circles are not significantly
different). Almost all of the tests did not indicate any significance differences between
factor levels. In part, this stems from the high number of levels in many factors (e.g.,
hours per day, days per week, number of crossings); thus, grouping factors into fewer
levels may be more appropriate for future one-way analyses.
As an example of a one-way analysis, consider the position of a stall relative to
the roadway. Once dispatched, do FIRST responders arrive more quickly to a scene if a
stall is detected on the roadway compared to a stall detected elsewhere (e.g., the road
shoulder or a freeway access ramp)? Initially, no differences were detected. But once
the position data was recoded into three groups: roadway, shoulder and access ramps, a
different answer was obtained. With the recoded data, ANOVA indicates that roadway
position does have a statistically significant effect on FIRST dispatch times (p-value =
0.015). The means comparison clarifies this finding: the statistical significance lies in the
difference between response to stalls on the roadway and stalls on the access ramps.
FIRST units arrived in just over 3 minutes to stalls detected on the roadway while taking
almost 12 minutes when dispatched to a stall detected on a shoulder and over 18 minutes
for stalls on an access (exit or entrance) ramp.
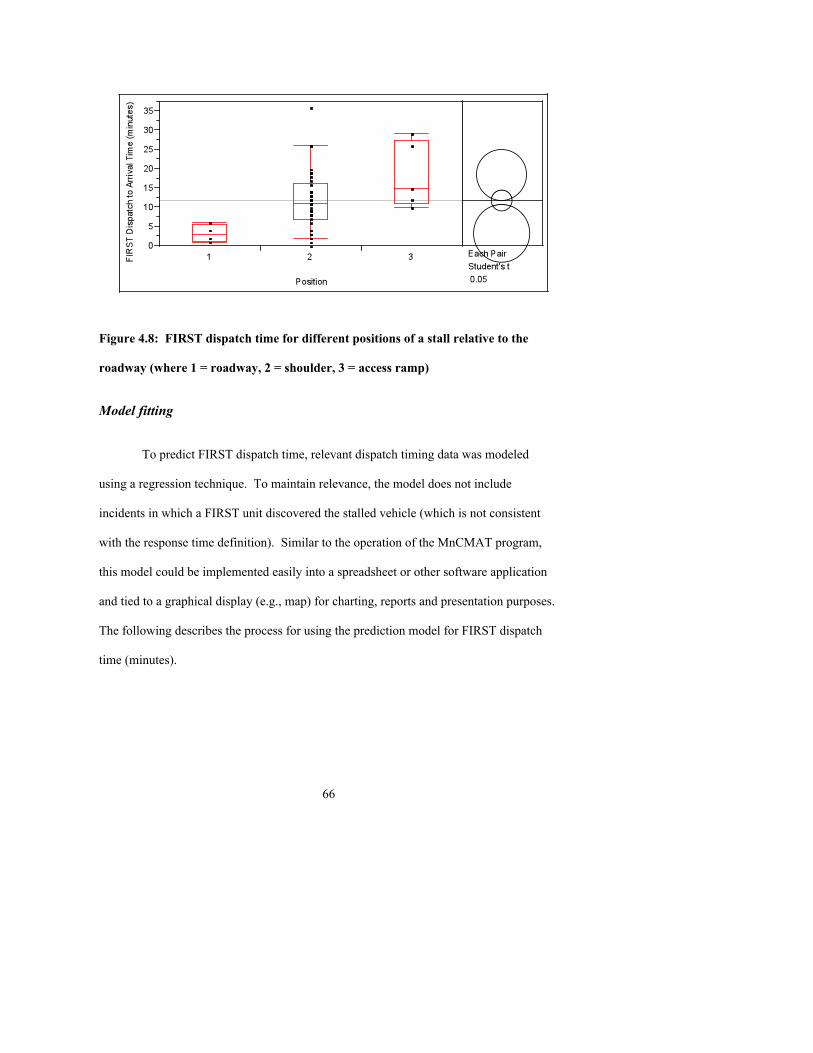
66
Figure 4.8: FIRST dispatch time for different positions of a stall relative to the
roadway (where 1 = roadway, 2 = shoulder, 3 = access ramp)
Model fitting
To predict FIRST dispatch time, relevant dispatch timing data was modeled
using a regression technique. To maintain relevance, the model does not include
incidents in which a FIRST unit discovered the stalled vehicle (which is not consistent
with the response time definition). Similar to the operation of the MnCMAT program,
this model could be implemented easily into a spreadsheet or other software application
and tied to a graphical display (e.g., map) for charting, reports and presentation purposes.
The following describes the process for using the prediction model for FIRST dispatch
time (minutes).
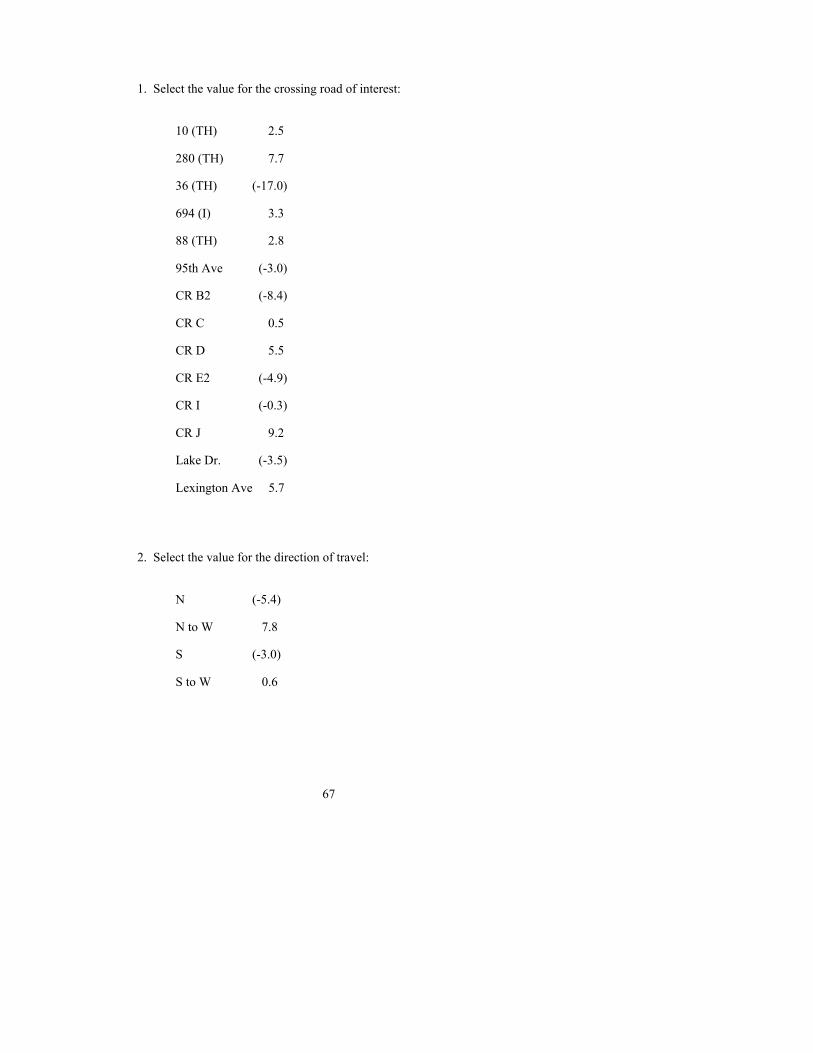
67
1. Select the value for the crossing road of interest:
10 (TH) 2.5
280 (TH) 7.7
36 (TH) (-17.0)
694 (I) 3.3
88 (TH) 2.8
95th Ave (-3.0)
CR B2 (-8.4)
CR C 0.5
CR D 5.5
CR E2 (-4.9)
CR I (-0.3)
CR J 9.2
Lake Dr. (-3.5)
Lexington Ave 5.7
2. Select the value for the direction of travel:
N (-5.4)
N to W 7.8
S (-3.0)
S to W 0.6

68
3. Select the value for the time of day (24 hour clock):
6 (-20.3)
7 12.8
8 (-3.9)
9 5.9
10 (-5.1)
11 ( -8.1)
12 3.3
13 0.0
14 (-0.7)
15 14.8
16 2.5
17 (-6.9)
18 5.7
4. Select the value for the vehicle position relative to the roadway:
Exit 9.4
Lane 1 6.0
Lane 2 (-28.5)
Left Shoulder 9.6
N/A (-1.0)
Right Shoulder 4.5

69
5. Add the four values together
6. Add a constant of 10.1 minutes to get the predicted dispatch time
To show how the model is used, assume a vehicle stall on the right shoulder of
southbound I-35W near County Road D is verified at 3 pm. To estimate how long it will
take a FIRST responder to arrive at the scene, simply sum the values for each parameter
and add the constant to obtain the following prediction of FIRST dispatch time
5.5 + (-3.0) + 14.8 + 4.5 + 10.1 = 31.9 minutes
So, based on this limited set of data and the conditions described, a FIRST
responder will take an average of about one half hour to respond. Someone monitoring
FIRST dispatch time for performance improvements might be intrigued: this particular
response time is almost 3 times longer than the average FIRST dispatch time (11.8
minutes) for the segment of highway analyzed. A closer look reveals that FIRST
responders in this segment take longer to respond during the 3 o’clock time slot than any
other time of the day – an anomaly perhaps worth investigating further.
This predicted value can also serve as a benchmark (i.e., the baseline average) for
assessing actual incident dispatch times. A complementary prediction equation from the
model can be used to estimate the standard deviation (a.k.a. the standard error) of the
predicted dispatch time under the given conditions (in this case, 15.7 minutes).
Assuming that dispatch times are normally distributed and recognizing that 68% of all
normally distributed data falls within one standard deviation of the mean, roughly 15% of
the dispatch times will be longer than a dispatch time that is one standard deviation above

70
the mean (~48 minutes). Thus, from a benchmarking standpoint, any dispatch time under
these conditions exceeding 48 minutes could trigger a preliminary incident screening to
see if some previously unidentified factor or event contributed to the longer than
expected dispatch time.
This particular model predicts the FIRST dispatch times quite well, as suggested
by Figure 4.9 and the r-square (r2) value of 0.91. However, as noted before, this analysis
is intended more as a demonstration than an in-depth statistical analysis. In this case, the
dataset used to develop the model was rather limited in scope: several combinations of
factors occurred only once or not at all. Further, all available data was used when
developing the model, leaving none for validation purposes – this means that, although
the model may be good at predicting the dispatch times found in the data set, it may not
be nearly as good when predicting new scenarios. Nor was there sufficient data to
conduct any interaction analysis – for example, one can reasonably surmise that, in many
parts of the freeway network, dispatch times in a given direction will vary with changes
in the time of day (i.e., rush hour traffic into or out of downtown). Using a similar
approach, prediction models can be developed for other performance measures. For
example, four additional performance measures were modeled using this data set:
• FIRST on-scene (arrival to all clear) time (r2 = 0.15)
• FIRST overall response (dispatch to all clear) time (r2 = 0.69)
• MSP on-scene time (r2 = 0.84)
• Tow on-scene time (r2 = 0.51)

71
Figure 4.9: Actual vs. predicted values for the FIRST dispatch time model
Due to the insufficient number of available data points in the data set, the following
performance measures – although potentially useful - could not be modeled:
• FIRST arrival to lane clear (clearance) time
• FIRST lane clear to all clear (vehicle removal) time
• MSP dispatch to arrival (dispatch) time
• MSP arrival to lane clear time
• MSP lane clear to all clear time
• MSP dispatch to all clear (overall response) time
• Tow dispatch to arrival time

72
• Tow arrival to lane clear time
• Tow lane clear to all clear time
• Tow dispatch to all clear time
A couple observations are worth noting. In determining the r-square value, prediction
models are compared against the overall average from the data set. In general, the
models predict the various timing measures quite well and much better than the overall
average alone. However, in some cases, a model with a number of factors thought to
impact performance may not predict performance any better than the overall mean and a
low r-square value is obtained. Such is the case with the “FIRST arrival to all clear time”
model, which also suggests another factor not yet identified is impacting performance.
Another curious observation resulting from exploring these other performance
measures with prediction models was that a number of factors thought to influence
performance actually did not contribute much to the best prediction models. Instead, four
common factors influenced performance across the measures far more than any others:
time of day, vehicle position relative to the roadway, nearest crossing, and direction.
Other factors such as number of vehicles involved, day of the week, impact on traffic
flow and responder type had little effect, even though the one-way analyses often
suggested one of these other factors might have a greater impact. Of course, these
findings apply only to occupied stalls only; these latter factors may be more relevant to
crashes and other incident types.
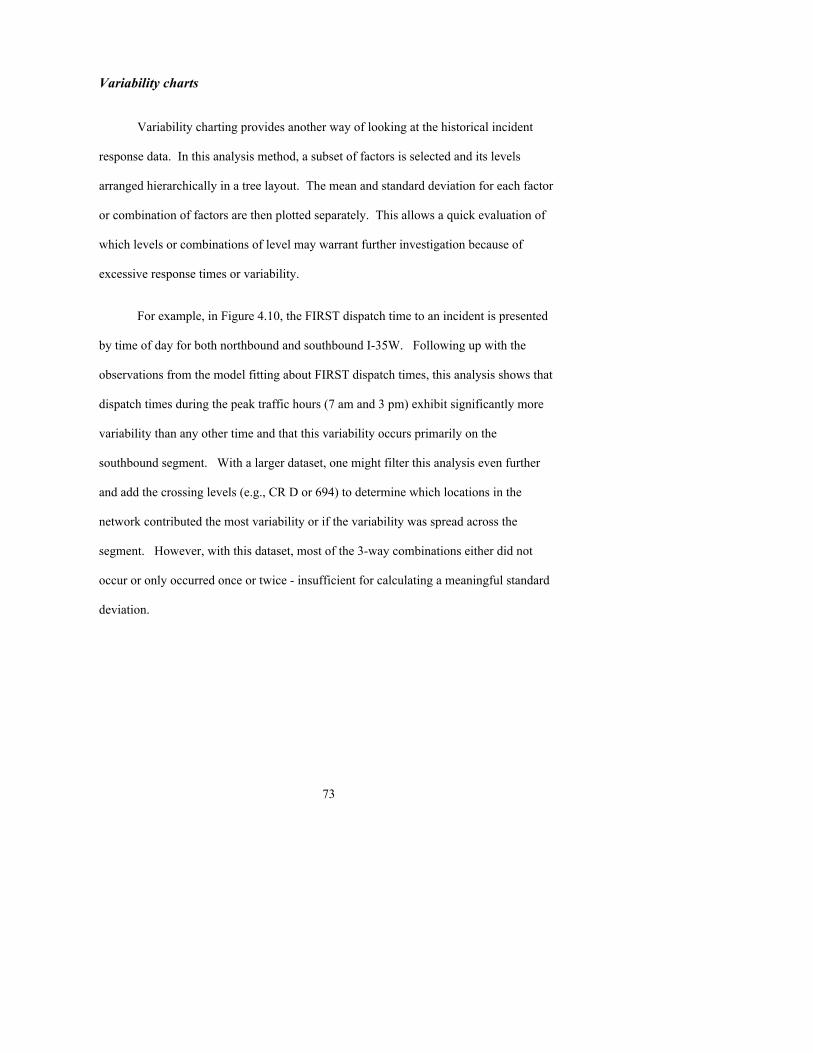
73
Variability charts
Variability charting provides another way of looking at the historical incident
response data. In this analysis method, a subset of factors is selected and its levels
arranged hierarchically in a tree layout. The mean and standard deviation for each factor
or combination of factors are then plotted separately. This allows a quick evaluation of
which levels or combinations of level may warrant further investigation because of
excessive response times or variability.
For example, in Figure 4.10, the FIRST dispatch time to an incident is presented
by time of day for both northbound and southbound I-35W. Following up with the
observations from the model fitting about FIRST dispatch times, this analysis shows that
dispatch times during the peak traffic hours (7 am and 3 pm) exhibit significantly more
variability than any other time and that this variability occurs primarily on the
southbound segment. With a larger dataset, one might filter this analysis even further
and add the crossing levels (e.g., CR D or 694) to determine which locations in the
network contributed the most variability or if the variability was spread across the
segment. However, with this dataset, most of the 3-way combinations either did not
occur or only occurred once or twice - insufficient for calculating a meaningful standard
deviation.
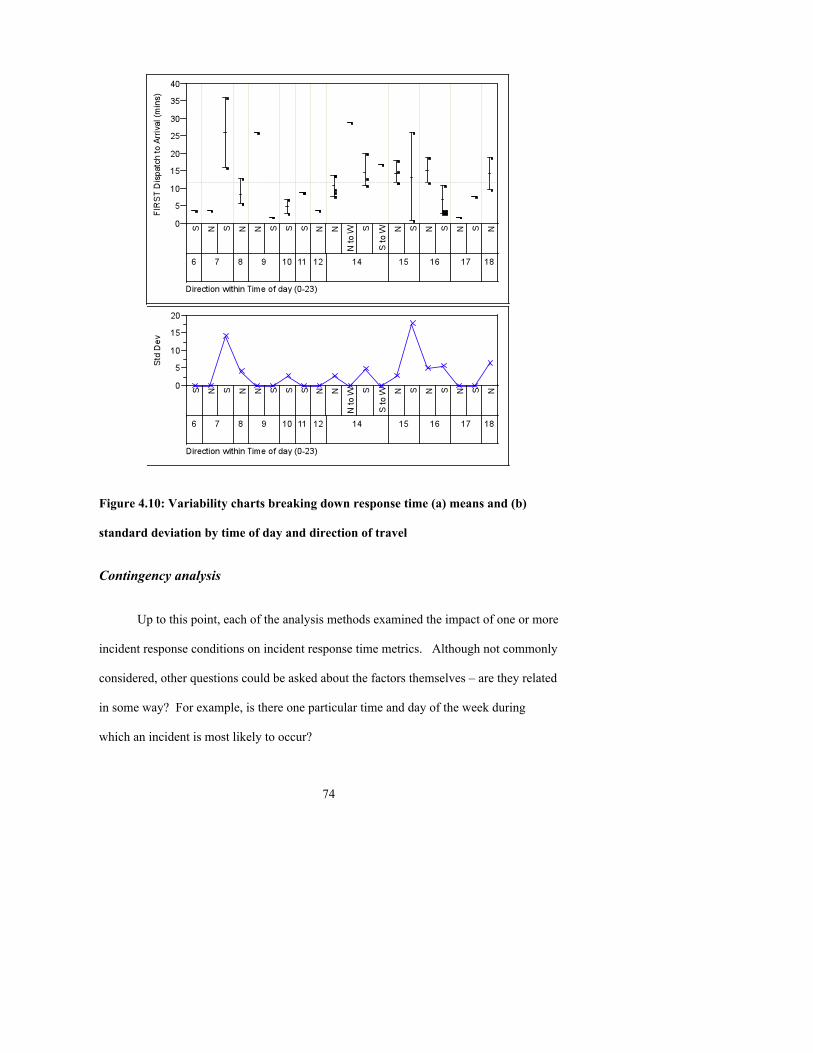
74
Figure 4.10: Variability charts breaking down response time (a) means and (b)
standard deviation by time of day and direction of travel
Contingency analysis
Up to this point, each of the analysis methods examined the impact of one or more
incident response conditions on incident response time metrics. Although not commonly
considered, other questions could be asked about the factors themselves – are they related
in some way? For example, is there one particular time and day of the week during
which an incident is most likely to occur?

75
To answer these types of questions, a statistical method for exploring
relationships between categorical data involves the use of contingency tables. These
tables present how often a given condition is present when another condition is present.
In addition to tables, mosaic plots are frequently used to illustrate the relationships
between various conditions. Using contingency analysis, the most likely time and day for
a stall to occur was found to be 2 – 3 pm on Thursdays and the second most likely
occurred immediately afterwards: 3 – 4 pm on Thursdays.
To further illustrate, one might ask if any link could be identified between the
agencies responding to a stall and its overall impact on traffic flow. Results, shown in
Table 4.1 and Figure 4.11, indicate that only 7 of the 354 stalls caused traffic queues
longer than a.0.5 miles. On the other hand, nobody responded in about 20% of all
detected stalls. These likely include scenarios in which the motorist was able to rectify
the stall before anyone was dispatched or arrived (e.g., repair a flat tire), but they might
warrant further review since 40% of these stalls impact, albeit minimal, on traffic flow.
Table 4.1: Impact on traffic flow and agency response to an incident Count Total % Col % Row %
0: No responders
1: MSP only
2: FIRST only
3: MSP and FIRST
4: Tow only
5: MSP and Tow
6: FIRST and Tow
7: MSP, Tow, and FIRST
0: No impact
40 11.30 59.70 16.88
4 1.13
33.33 1.69
136 38.42 77.71 57.38
6 1.69
35.29 2.53
9 2.54
75.00 3.80
5 1.41
50.00 2.11
34 9.60
69.39 14.35
3 0.85
25.00 1.27
237 66.95
1: Less than ¼ mile queue
27 7.63
40.30 24.55
7 1.98
58.33 6.36
38 10.73 21.71 34.55
9 2.54
52.94 8.18
3 0.85
25.00 2.73
3 0.85
30.00 2.73
15 4.24
30.61 13.64
8 2.26
66.67 7.27
110 31.07
2: Less than ½ mile queue
0 0.00 0.00 0.00
1 0.28 8.33
20.00
0 0.00 0.00 0.00
1 0.28 5.88
20.00
0 0.00 0.00 0.00
2 0.56
20.00 40.00
0 0.00 0.00 0.00
1 0.28 8.33
20.00
5 1.41
4: More than ½ mile queue
0 0.00 0.00 0.00
0 0.00 0.00 0.00
1 0.28 0.57
50.00
1 0.28 5.88
50.00
0 0.00 0.00 0.00
0 0.00 0.00 0.00
0 0.00 0.00 0.00
0 0.00 0.00 0.00
2 0.56
67 18.93
12 3.39
175 49.44
17 4.80
12 3.39
10 2.82
49 13.84
12 3.39
354
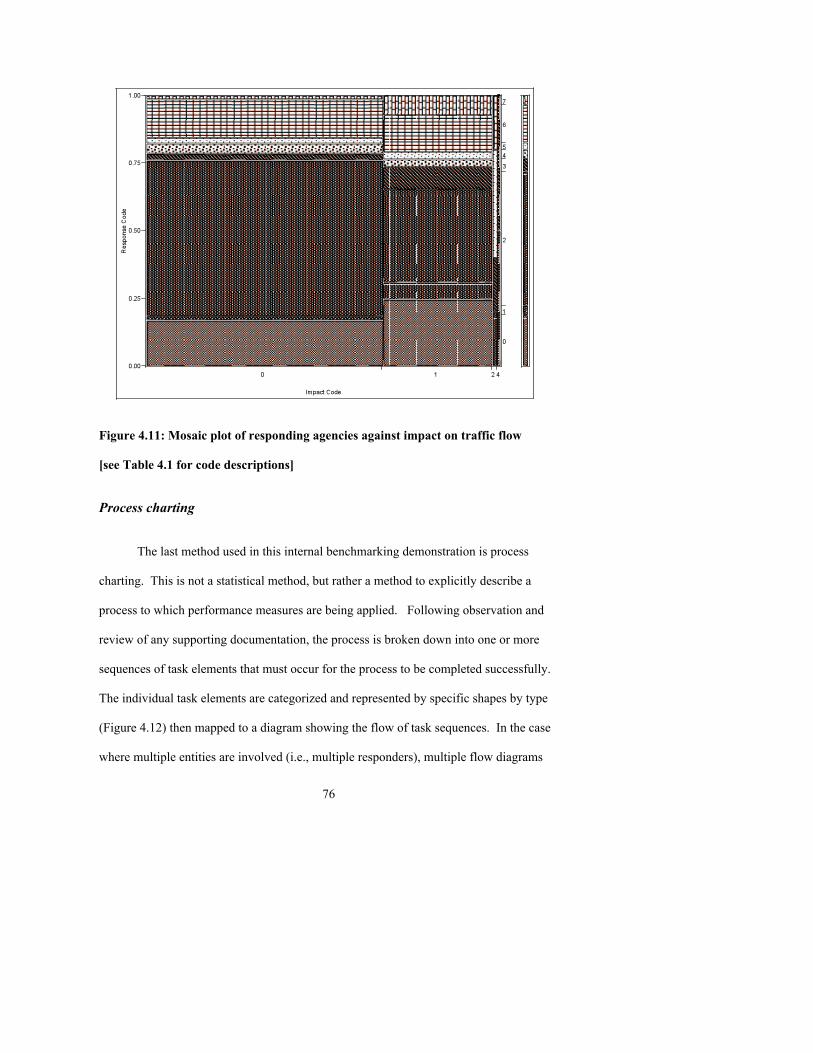
76
Figure 4.11: Mosaic plot of responding agencies against impact on traffic flow
[see Table 4.1 for code descriptions]
Process charting
The last method used in this internal benchmarking demonstration is process
charting. This is not a statistical method, but rather a method to explicitly describe a
process to which performance measures are being applied. Following observation and
review of any supporting documentation, the process is broken down into one or more
sequences of task elements that must occur for the process to be completed successfully.
The individual task elements are categorized and represented by specific shapes by type
(Figure 4.12) then mapped to a diagram showing the flow of task sequences. In the case
where multiple entities are involved (i.e., multiple responders), multiple flow diagrams

77
may be developed that showing the allocation of tasks as well as any resource sharing or
communications occurring between entities. The finished process chart is itself a
benchmark, illustrating the currently expected sequence and allocation of tasks required
for a given process (Figure 4.13).
Figure 4.12: Process charting symbols
In the context of TIM, several benefits of process charting should be noted. In
Minneapolis, incident response communications are recorded and archived for a year.
Having process charts for different agencies and incident types would these audio records
to be used in comparisons between how responders are expected to handle stalled
vehicles (e.g., operational guidelines) and what is actually done in the field. Differences
between the actual process and guidelines may indicate sources of variability in response
times, reflect adaptations in the field to more effectively handle incidents, or highlight
coordination conflicts and resource sharing needs between agencies in handling incidents.

78
Process charts are also useful when reviewing incidents with excessively long
response times. In this case, the process chart becomes a template for identifying what
task elements may have contributed and suggesting how the response delays may have
occurred. These analyses may point out dependencies between agencies and other
resources (e.g., personnel or equipment), inefficiencies in the overall process such as
redundant communications or lack of guidance in certain infrequent scenarios. And,
when evaluating proposed interventions to improve task performance, process charts can
assist in assessing the impact of changes in task duties, task ordering, agency
responsibilities, resource allocation, and communications.
In the latter case, process charts can also become the foundation for
computational models of incident response. The statistical analyses described above
provide timing information that can be integrated with the process charts to simulate
incident response times under different task sequences, conditions, etc. Although not the
intent of this study, the benefits of simulation-based incident response modeling will be
discussed briefly in the next chapter.
In this study, incident response processes in the Minneapolis-St. Paul area were
charted to illustrate the steps taken by the State Police, FIRST and tow services once a
stalled (disabled) vehicle is detected. The process charts are based on incident response
observations and guidelines published in 2002 by the region’s Interagency Coordination
Management Team. An excerpt is shown in Figure 4.13; the complete charts and task
lists can be found in Appendix B. Worth noting is that the process charts can be split
into segments corresponding to the incident response timeline and associated timing
metrics described at the beginning of this chapter (Figure 4.14).
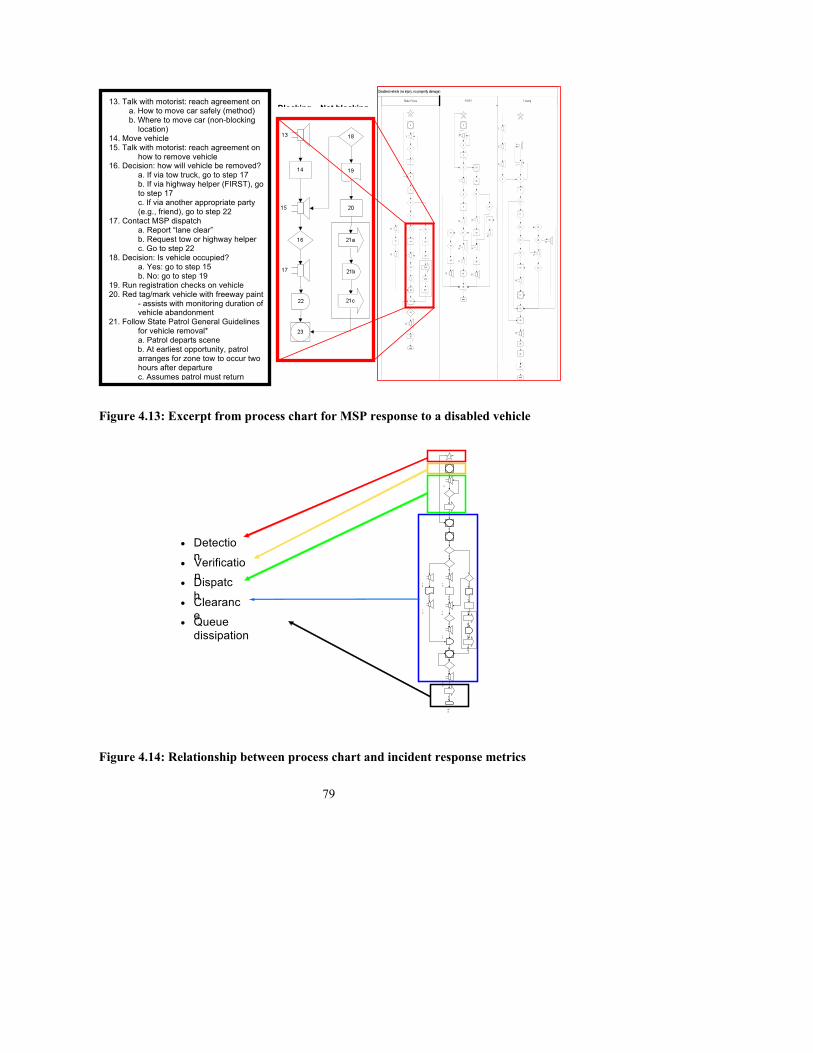
79
Figure 4.13: Excerpt from process chart for MSP response to a disabled vehicle
Figure 4.14: Relationship between process chart and incident response metrics
• Detection • Verification • Dispatch • Clearance • Queue dissipation
1 2
4 5
6 7 8 9
14
16
26
19
18
20
11
3
10
12
13
22
end
23 24
15
17
25
21b 21c
21a
13. Talk with motorist: reach agreement on a. How to move car safely (method) b. Where to move car (non-blocking
location) 14. Move vehicle 15. Talk with motorist: reach agreement on
how to remove vehicle 16. Decision: how will vehicle be removed? a. If via tow truck, go to step 17 b. If via highway helper (FIRST), go
to step 17 c. If via another appropriate party
(e.g., friend), go to step 22 17. Contact MSP dispatch a. Report “lane clear” b. Request tow or highway helper c. Go to step 22 18. Decision: Is vehicle occupied? a. Yes: go to step 15 b. No: go to step 19 19. Run registration checks on vehicle 20. Red tag/mark vehicle with freeway paint - assists with monitoring duration of
vehicle abandonment 21. Follow State Patrol General Guidelines
for vehicle removal* a. Patrol departs scene b. At earliest opportunity, patrol
arranges for zone tow to occur two hours after departure
c. Assumes patrol must return when tow occurs (go to step 23)
22. Wait for requested party to arrive …
Blocking Not blocking
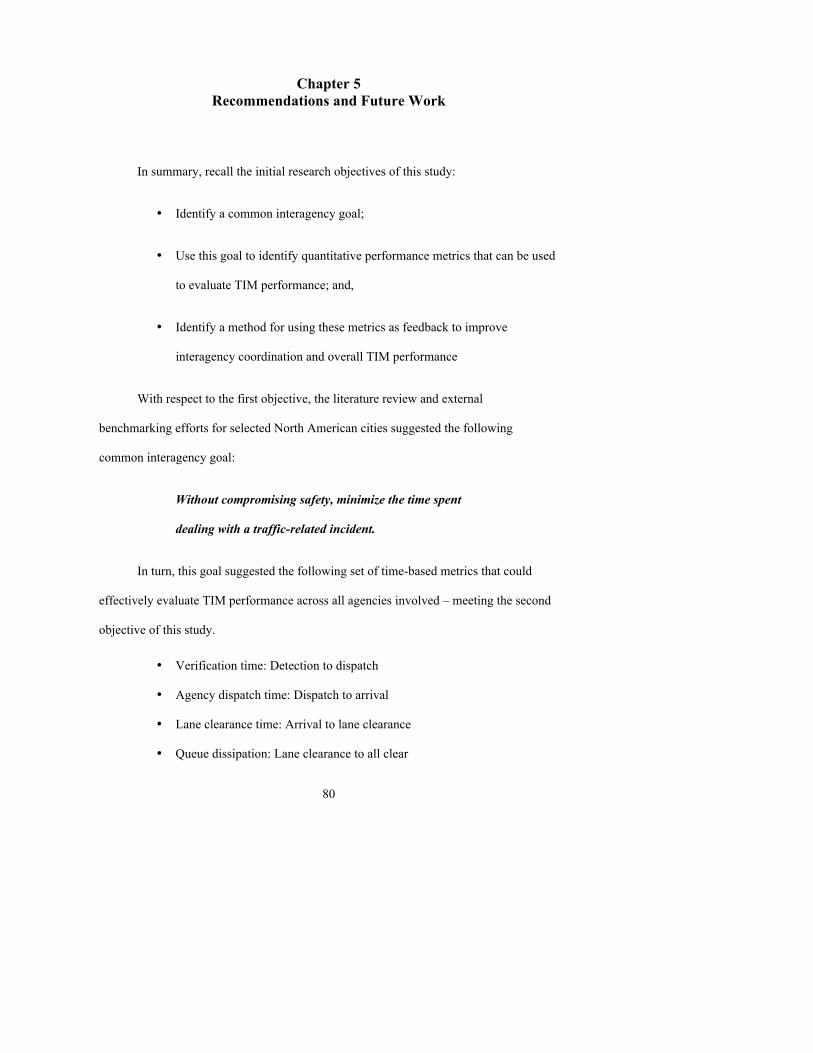
80
Chapter 5 Recommendations and Future Work
In summary, recall the initial research objectives of this study:
• Identify a common interagency goal;
• Use this goal to identify quantitative performance metrics that can be used
to evaluate TIM performance; and,
• Identify a method for using these metrics as feedback to improve
interagency coordination and overall TIM performance
With respect to the first objective, the literature review and external
benchmarking efforts for selected North American cities suggested the following
common interagency goal:
Without compromising safety, minimize the time spent
dealing with a traffic-related incident.
In turn, this goal suggested the following set of time-based metrics that could
effectively evaluate TIM performance across all agencies involved – meeting the second
objective of this study.
• Verification time: Detection to dispatch
• Agency dispatch time: Dispatch to arrival
• Lane clearance time: Arrival to lane clearance
• Queue dissipation: Lane clearance to all clear

81
• Removal time: Arrival to all clear
• Overall incident response time: Dispatch to all clear
• Overall incident time: Detection to all clear
Finally, these metrics suggested the use of a methodology for evaluating
performance of a TIM system, the third objective of the study. Adopting a process-
centered view for incident response, internal benchmarking was used to demonstrate
process charting and a set of five statistical methods. Prediction model fitting, variability
charts and process charting apply well to general performance evaluation and can be
considered the primary benchmarking tools; one-way factor analyses, contingency
analysis and descriptive statistics are secondary methods that, although valuable, are
more suited to answering specific questions about TIM performance.
Recommendations
As noted above, current incident response data collection and analysis supports an
approach to reducing traffic congestion that emphasizes minimizing the number of
incidents that occur. But incidents will still occur – and likely quite a few. This study
recommends adopting a complementary approach to tackling the congestion and travel
delays associated with incidents: make them as short as possible. In most cases, the less
time that an incident has to impact traffic, the less congestion and delay it can cause.
Should this latter approach appeal to a group of TIM agencies, four recommendations can
be drawn from the internal benchmarking demonstration in Chapter 4; either by
themselves or combined, each facilitates implementing a process-based approach to TIM
performance improvement.

82
Recommendation 1
Modify data collection and archiving methods to support a process-
centered approach to performance evaluation
Similar to the dataset preparation described in Chapter 4 (p. 59-62), this would
entail reconfiguring current traffic incident data collection and archiving methods to track
relevant timing data for one or more agencies involved in TIM. In some regional TIM
centers, this would be in addition to the incident descriptors currently logged. In
addition, the data should be stored using coding capable of supporting a variety of data
filtering and analysis methods.
In some locales, a specialized means of entering, storing and retrieving the
relevant incident timing data will have to be developed (e.g., a software application or
front-end interface to an existing program like Excel). For the RTMC, the real-time
incident logging application used prior to Fall 2008 would require few modifications. On
the other hand, given the gaps in the dataset, training and other steps may have to be
taken to improve the quality of the real-time data entry.
The primary outcome of this recommendation would be an updated system
capable of obtaining large quantities of relevant quality data and stored in formats that
can be readily used for relevant statistical analyses, as recommended next.

83
Recommendation 2
Using appropriate statistical tools, analyze archival incident response
data to support internal benchmarking and subsequent process
improvement efforts
As illustrated in pages 63-77, properly selected and archived traffic incident data
can be used to establish baselines for various timing measures associated with incident
response, taking into account the numerous factors that may influence each measure. In
turn, these baselines can be used in several ways to suggest possible improvements or
trigger reviews of specific incidents.
Examples of analyses that could be helpful include determining the 10 worst (or
best) locations for each metric, identifying factor levels (i.e., conditions) that have a
significant impact on each metric, and suggesting root causes of poor incident response
performance (e.g., locations where another agency takes the lead). The prediction models
could be used to suggest “waiting times” for traveler information (e.g., variable message
signs) or provide an estimated time against which to compare actual response times and
perhaps trigger incident reviews. Another area of interest is finding sources of variability
and targeting them to minimize response variability. The benchmarking efforts
ultimately aid decision making by providing insight into the impact of a process
improvement intervention, knowledge that helps guide decisions regarding the selection
and prioritization of various improvement options. The benchmarks also provide a
quantitative baseline from which to assess the effectiveness of an improvement once
implemented and justify expenditures for other improvement efforts.

84
Recommendation 3
For each major incident type, compile process charts that illustrate the
steps and completion sequences for each responding agency
Each agency has a different role and procedures to carry out when responding to
an incident. These may also vary by incident type, and may at times require coordination
of efforts and resource sharing between agencies. Significant variation in a process
results when a different method or sequence of tasks are used each time it is encountered.
One way to assess this variation is to establish process charts for each incident type and
agency (see pp. 77-80 and Appendix B). Preferably based on operational guidelines set
by interagency consensus, each chart illustrates the recommended tasks, sequence of
tasks and allocation of tasks and resources between responding agencies.
This allows comparison of actual response processes in the field to the
recommended guidelines and aid identification of process variability. Elements which
may differ from the recommended guidelines include not only different tasks or
completion sequences, but also added or omitted tasks, task precedence (e.g., what tasks
must finish before another can start), decision making, resources required, and
communications with others. The latter can differ in terms of contact, reason for the
contact, and the information shared (if any). Archived audio or transcripts of
communications during an incident, particularly ones with excessive delay, can then be
followed using the process charts to identify which steps contributed most to the delay
and show where process differences between the actual incident and the operational
guidelines may have occurred.

85
Recommendation 4
Develop a simulation model of the incident response process
This last recommendation builds on the prior two, utilizing the process charts and
statistical prediction models to inform a simulation model of incident response.
Conceptually, this model treats incidents as objects entering the freeway network at some
random location in the network and requiring some type of processing by one or more
network resources. These network resources, primarily the responders from various
agencies, must then be notified and travel through the network to the incident. The
responders follow the required steps to process the incident, possibly requiring additional
resources to be brought through the network to the incident scene. Timing data is
generated for the various stages, and the incident “exits” the network when processing is
complete.
The benefits of a simulation model include the ability to quickly explore changes
in the incident response process such as modifying initial responder locations (e.g.,
restructure FIRST or MSP zone boundaries), altering the number of available responders,
or changing the task sequences. The model could also serve as a visual tool, potentially
using animated graphics, to illustrate the impact of these various changes and provide
quantitative data to support decision makers evaluating the effectiveness of various
process improvement options.
86
Future work
Any continued work would require substantial RTMC support, not only in terms
of advice and feedback, but also in terms of access to the archived incident data, both
from the TIS and the incident logs maintained by the RTMC staff, and the audio archived
for selected incidents with excessive response times. Assuming that the RTMC incident
logs are reinstated, minor changes would be required with respect to data collection and
entry and a mechanism established for gathering and storing relevant incident data from
other agencies (i.e., MSP). This may also require permissions and access to observe on-
site operations as well as raining on systems used to detect, track and manage incidents.
In addition, as the process charts and simulation models are developed, contacts from the
various agencies involved will be necessary so that each agency can provide feedback on
the accuracy of a given chart or model.
Assuming these details could be worked out, this study leaves several avenues for
continued work. The first is extending the internal benchmarking demonstration by
incorporating data over a longer period of time and analyzing different incident types
throughout the entire Twin Cities freeway network. Second, the TIS system contains
data about incident response conditions such as weather and traffic levels not recorded in
the RTMC incident logging system or the integrated CAD/CARS system. The influence
of this data on incident response times may be significant, particularly for the prediction
models, and is worth exploring further. Third, if a process-based performance
improvement program were implemented at a TIM center, how should the program be
administered and how would the data from the various agencies be gathered, compiled

87
and stored (e.g., would this require a new graphical software tool, perhaps similar to
MnCMAT)? Ultimately, work on each of these topics would help TIM staff reduce
traffic congestion and delays and meet the overall goal stated earlier:
Without compromising safety, minimize the time spent
dealing with a traffic-related incident.
88
References
1. Farradyne, P.B., Traffic Incident Management Handbook. 2000, United States
Federal Highway Administration.
2. Balke, K.N., D.W. Fenno, and B. Ullman, Incident Management Performance
Measures. 2002, United States. Federal Highway Administration.
3. TTI, Texas Transportation Institute, 2007 Annual Urban Mobility Report:
Complete Congestion Data 2007, TTI.
4. TTI , Texas Transportation Institute, Urban Mobility Report. 2007, Texas A&M
University.
5. Kramascz, T. RTMC – Tour Overview. Presented at a meeting between University
of Minnesota Duluth and Mn/DOT personnel at the Regional Transportation
Management Center. September 2007.
6. TMC , The Metropolitan Council, Twin Cities Area Population Facts. 2006. p. 1 -
2.
7. Schrank, D., Personal Interview. June 16, 2008.
8. Charles, P., Review of Current Traffic Incident Management Practices. 2007,
Austroads.
9. Charles, P., Improving Traffic Incident Management: Literature Review. 2007,
Austroads.
10. WSDOT, Wisconsin Department of Transportation. Planned Event Strategies.
2008 [cited 2008 15 May]; Available from:
http://www.dot.wisconsin.gov/travel/smartways/planevent.htm.
89
11. Smith, B.L., et al., Investigation of System Operations Performance Measures for
the Virginia Department of Transportation. 2007, Virginia Transportation
Research Council: Charlottesville, Virginia.
12. Dunn, W.M., et al., Safe and quick clearance of traffic incidents. 2003,
Transportation Research Board: Washington, D.C.
13. FHWA, Traffic Incident Management (TIM) Self Assessment: National Detail
Summary Report. 2003, Federal Highway Administration.
14. Corbin, J., K.C. Vásconez, and D. Helman, "Unifying Incident Response." Public
Roads, 2007. 71(2)
15. Brooke, K., Sharing information between public safety and transportation
agencies for traffic incident management. 2004, National Cooperative Highway
Research Program: Washington, D.C.
16. EPA , United States Environmental Protection Agency, Idling Vehicle Emissions.
1998.
17. Liu, Y., et al., Emergency incident management, benefits and operational issues -
Performance and benefits evaluation of CHART. 2004, Institute of Electrical and
Electronics Engineers Inc., Piscataway, United States: Taipei, Taiwan. p. 1143-
1147.
18. Charles, P., Traffic Incident Management: Best Practice. 2007.
19. Housley, J., "Benchmarking- is it worth it?" Perspectives: Policy and Practice in
Higher Education, 1999. 3(3): p. 74 - 79.
20. Wireman, T., Benchmarking Best Practices in Maintenance Management. 2nd
edition. 2003: Industrial Press.
90
21. Wireman, T., "Benchmarking or performance measurement: Which is right for
your plant?" Plant Engineering, 2004. 58(5): p. 54-56.
22. Cooke, J., "Benchmarks drive performance.(Research)." Strategic Finance, 2004:
p. 18(1).
23. Costa, D.B., et al., "Benchmarking Initiatives in the Construction Industry:
Lessons Learned and Improvement Opportunities." Journal of Management in
Engineering, 2006. 22(4): p. 158-167.
24. Garvin, D.A., "Building a learning organization." Harvard Business Review,
1993. 71(4): p. 78-91.
25. APQC, American Productivity and Quality Center. What is
Benchmarking?APQC's Benchmarking Methodology. 2002 [cited 2008 May
2008]; Available from:
http://www.apqc.org/portal/apqc/ksn/BenchmarkingMethodology.pdf?paf_gear_i
d=contentgearhome&paf_dm=full&pageselect=contentitem&docid=108227.
26. Storhaug, B.J., Benchmarking fleet management performance measures within
state DOTs. 2003, University of Minnesota, Duluth (MSEM thesis): 2003. p. viii,
101 leaves.
27. Berrah, L., G. Mauris, and F. Vernadat, "Information aggregation in industrial
performance measurement: rationales, issues and definitions." International
Journal of Production Research, 2004. 42(20): p. 4271-4293.
28. Goldratt, E.M., The Goal: A Process of Ongoing Improvement. 2004: North River
Press.
29. Brown University, Why performance measurement? Brown University Long-
Term Care Quality Advisor, 1997. 9(18): p. 6.
91
30. Hatry, H.P., Performance Measurement: Getting Results. 1999, Washington D.C.:
The Urban Institute.
31. Creaser, C., A. Conyers, and S. Lockyer, "VAMP - laying the foundations."
Performance Measurement & Metrics, 2007. 8(3): p. 157-169.
32. James, W., TIM Questionnaire Response, 2008.
33. Grewe, T., "The GASB's Mission and Performance Measurement," Government
Finance Review. 2001. p. 4.
34. Katmale, H. and D.A. Wyrick. "Difficulties in Fleet Management: intangible
factors, information overload, and data integrity." in Proceedings of the 27th
Annual National Conference of the American Society for Engineering
Management, Huntsville, AL, 2006.
35. U.S. Census Bureau: Statistical Abstract of the United States, Metropolitan
Statistical Areas With More Than 750,000 Persons in 2006--Population by Age:
2006. 2008.
36. Denstadli, J.M., "Analyzing Air Travel: A Comparison of Different Survey
Methods and Data Collection Procedures." Journal of Travel Research, 2000.
39(1): p. 4.
37. Webb, K. and H.P. Hatry, Obtaining Citizen Feedback: The application of citizen
surveys to local governments. 1973, Washington D.C.: The Urban Institute.
38. Greiling, A., K. McCarrier, and M.C. Stringer. "Comparing Web-Based Survey
Methods with other Approaches: An examination of health knowledge, opinion,
and behaviors" in American Association for Public Opinion Research Conference.
2003.

92
39. McGonagle, J.J. and Flemming, D., "Options in benchmarking." Journal for
Quality and Participation 21(2) 1998, pp 38(5).
40. Frandrup, C., Groth, S., Anderson, S., Sroga, J., and Hanzalik, J. Traffic Incident
Management: Recommended Operational Guidelines. 2002, Minnesota
Department of Transportation. Available from:
http://www.dot.state.mn.us/tmc/documents/Freeway Incident Management.pdf

93

94
Acronyms
CHART Coordinated Highway Action Response Team (Maryland)
DOT Department of Transportation
FHWA Federal Highway Administration
ITS Intelligent Transportation Systems
HOT High Occupancy Toll (lane)
HOV High Occupancy Vehicle (lane)
MnDOT Minnesota Department of Transportation
MoDOT Missouri Department of Transportation
NATSRL National Advanced Transportation Systems Research Laboratory
RTMC Regional Transportation Management Center (Minneapolis-St.Paul)
TIM Traffic Incident Management
VMS Variable Message Signs
WSDOT Washington State Department of Transportation

Appendix A
Traffic Incident Management Survey
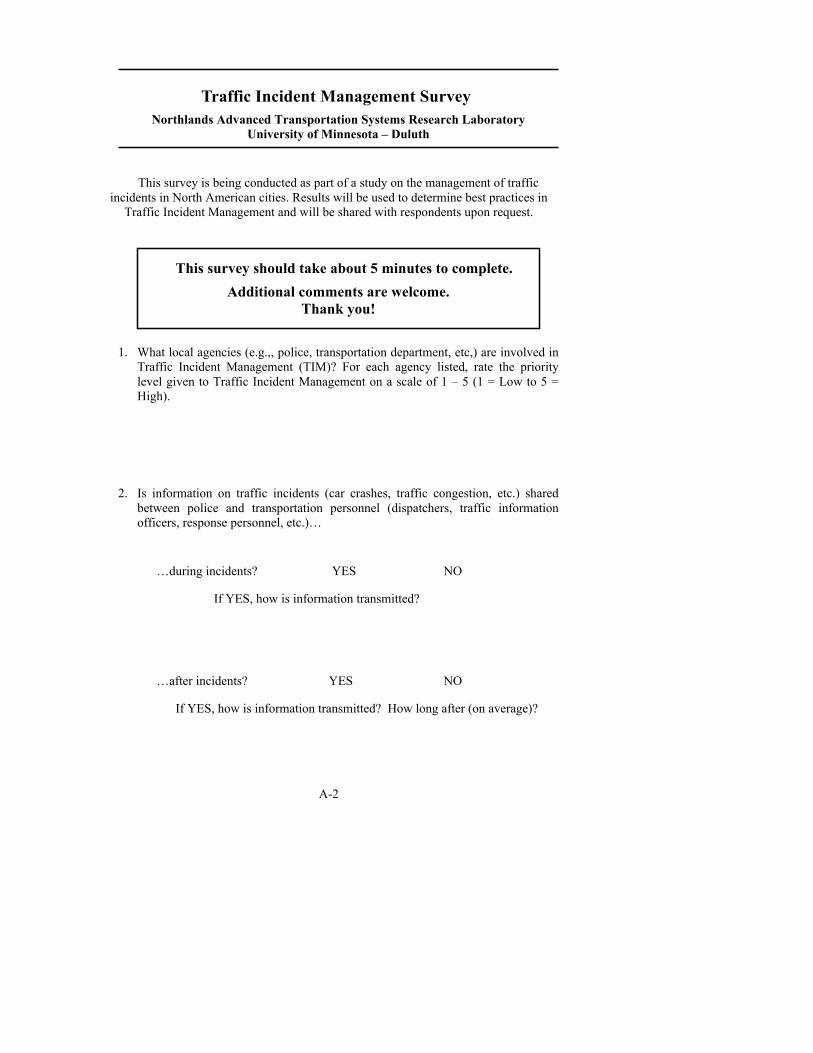
A-2
Traffic Incident Management Survey Northlands Advanced Transportation Systems Research Laboratory
University of Minnesota – Duluth
This survey is being conducted as part of a study on the management of traffic incidents in North American cities. Results will be used to determine best practices in
Traffic Incident Management and will be shared with respondents upon request.
This survey should take about 5 minutes to complete. Additional comments are welcome.
Thank you!
1. What local agencies (e.g.,, police, transportation department, etc,) are involved in Traffic Incident Management (TIM)? For each agency listed, rate the priority level given to Traffic Incident Management on a scale of 1 – 5 (1 = Low to 5 = High).
2. Is information on traffic incidents (car crashes, traffic congestion, etc.) shared
between police and transportation personnel (dispatchers, traffic information officers, response personnel, etc.)…
…during incidents? YES NO
If YES, how is information transmitted?
…after incidents? YES NO
If YES, how is information transmitted? How long after (on average)?
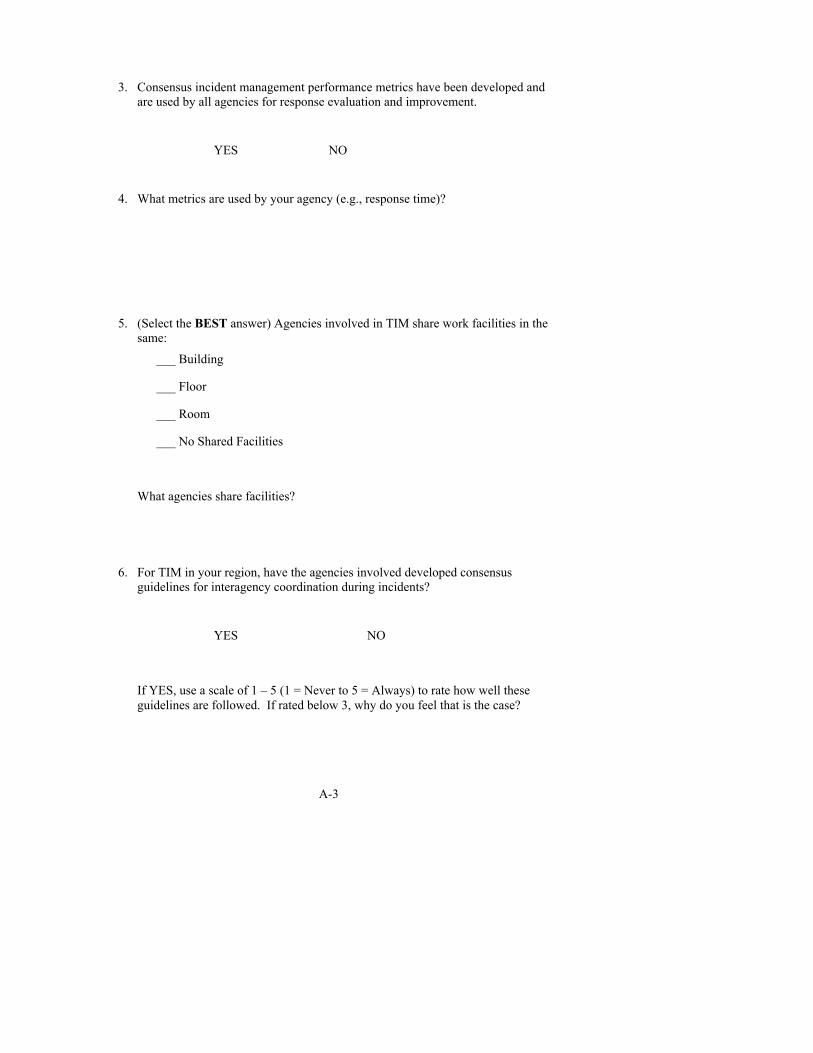
A-3
3. Consensus incident management performance metrics have been developed and are used by all agencies for response evaluation and improvement.
YES NO
4. What metrics are used by your agency (e.g., response time)?
5. (Select the BEST answer) Agencies involved in TIM share work facilities in the same:
___ Building
___ Floor
___ Room
___ No Shared Facilities
What agencies share facilities?
6. For TIM in your region, have the agencies involved developed consensus guidelines for interagency coordination during incidents?
YES NO
If YES, use a scale of 1 – 5 (1 = Never to 5 = Always) to rate how well these guidelines are followed. If rated below 3, why do you feel that is the case?

A-4
7. What communication systems/methods do you use for dispatch and response (e.g., CAD, radio, et cetera)?
8. Are there changes to current practices and overall interagency coordination in your region that would improve TIM?
9. Would you like to receive a summary of the results when the survey has been
completed?
YES NO
10. Is there any additional information you would like to share?

A-5
Name (of contact person):____________________________________
Agency:____________________________________
Title:____________________________________
Phone:____________________________________
E-Mail:____________________________________
Address:
Please send completed survey by e-mail or fax by [Date]
Chinweike Eseonu UMD – Graduate Research Assistant Engineering Management Program
105 Voss Kovach Hall 1305 Ordean Court Duluth, MN 55812
Phone: 218-726-6544 Fax: 218-726-8596
E-Mail: [email protected]
Thank you for your time in completing this survey - Your help is greatly appreciated!

Appendix B
Process Charts

B-2
Note: The task descriptions and process charts assume all requests for assistance are routed through the various agency dispatchers. No linkages have been drawn illustrating on-scene dependencies between agencies. The following incident response sequences have been derived from incident response observations and the Interagency Coordination Management Team’s recommended operational guidelines [40].
Recommended sequence of operational procedures for a disabled vehicle with no injuries or property damage
State Police
1. Incident occurs; time elapses until detected
a. If incident detected by patrol car, go to step 6
b. Else, go to step 2
2. Detection and verification of incident at RTMC
a. Detection: 911 call, report from patrols, report from other sources (e.g., maintenance crews or highway helpers (“FIRST”)), traffic flow patterns observed via cameras or road sensors
b. Verification: Either via cameras or reports from other sources
3. MSP dispatch contacts patrol unit
4. Decide: Is unit able to respond?
a. Yes: go to step 5
b. No: MSP dispatch must call another unit (go to step 3)
5. Travel to scene
6. Protect scene
a. Position vehicle
b. Activate rear emergency flashers and/or chevron
7. Assess incident

B-3
8. Decide: Is vehicle blocking traffic?
a. Yes: go to step 9
b. No: go to step 18
9. Decide: Is vehicle occupied?
a. Yes: go to step 13
b. No: go to step 10
10. Contact MSP dispatch: request Zone Tow
11. Complete impound paperwork
12. Contact MSP dispatch
a. Provide vehicle identification information
b. Go to step 22
13. Talk with motorist: reach agreement on
a. How to move vehicle safely (method)
b. Where to move vehicle (non-blocking location)
14. Move vehicle
15. Talk with motorist: reach agreement on how to remove vehicle from highway
16. Decide: how will vehicle be removed?
a. If via tow truck, go to step 17
b. If via highway helper (FIRST), go to step 17
c. If via another appropriate party (e.g., friend), go to step 22
17. Contact MSP dispatch
a. Report “lane clear”
b. Request tow and/or highway helper
c. Go to step 22
18. Decide: Is vehicle occupied?
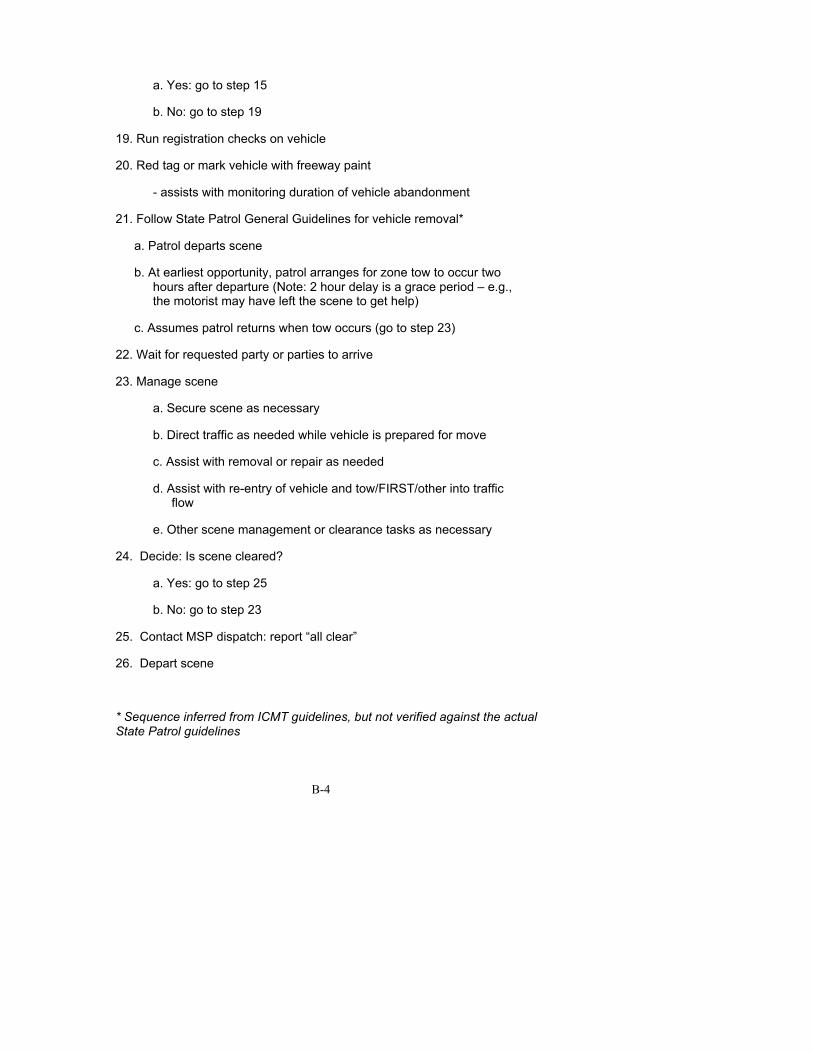
B-4
a. Yes: go to step 15
b. No: go to step 19
19. Run registration checks on vehicle
20. Red tag or mark vehicle with freeway paint
- assists with monitoring duration of vehicle abandonment
21. Follow State Patrol General Guidelines for vehicle removal*
a. Patrol departs scene
b. At earliest opportunity, patrol arranges for zone tow to occur two hours after departure (Note: 2 hour delay is a grace period – e.g., the motorist may have left the scene to get help)
c. Assumes patrol returns when tow occurs (go to step 23)
22. Wait for requested party or parties to arrive
23. Manage scene
a. Secure scene as necessary
b. Direct traffic as needed while vehicle is prepared for move
c. Assist with removal or repair as needed
d. Assist with re-entry of vehicle and tow/FIRST/other into traffic flow
e. Other scene management or clearance tasks as necessary
24. Decide: Is scene cleared?
a. Yes: go to step 25
b. No: go to step 23
25. Contact MSP dispatch: report “all clear”
26. Depart scene
* Sequence inferred from ICMT guidelines, but not verified against the actual State Patrol guidelines
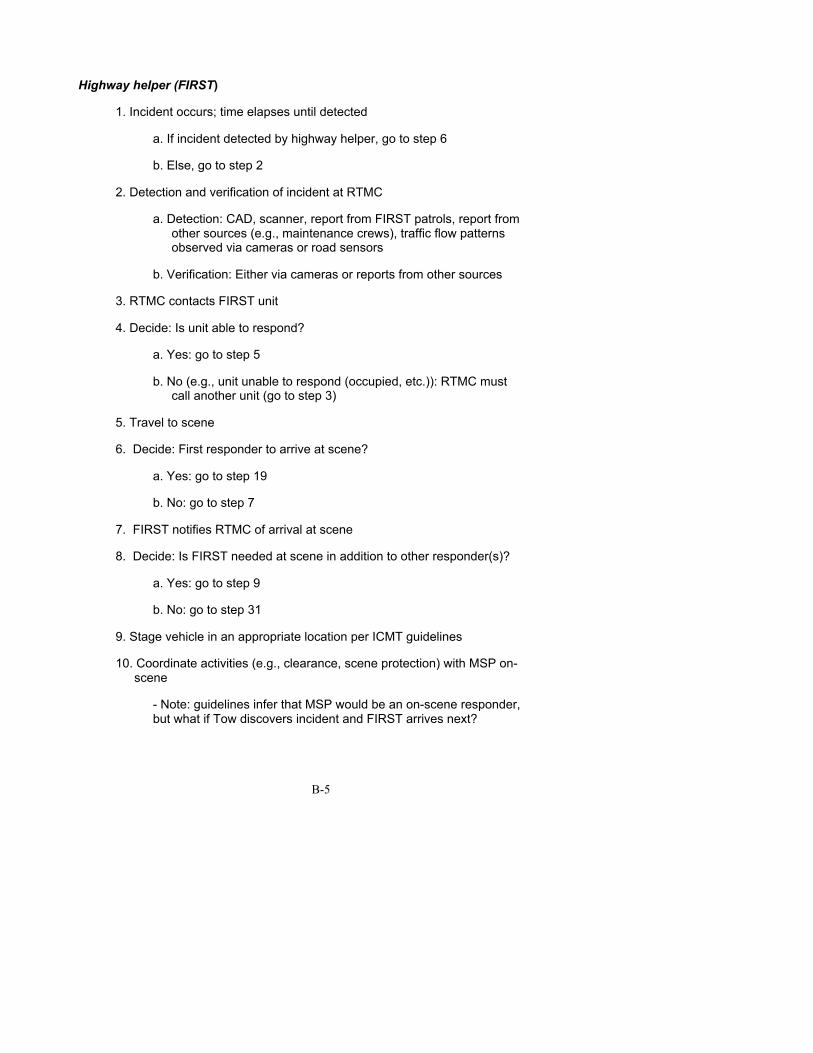
B-5
Highway helper (FIRST)
1. Incident occurs; time elapses until detected
a. If incident detected by highway helper, go to step 6
b. Else, go to step 2
2. Detection and verification of incident at RTMC
a. Detection: CAD, scanner, report from FIRST patrols, report from other sources (e.g., maintenance crews), traffic flow patterns observed via cameras or road sensors
b. Verification: Either via cameras or reports from other sources
3. RTMC contacts FIRST unit
4. Decide: Is unit able to respond?
a. Yes: go to step 5
b. No (e.g., unit unable to respond (occupied, etc.)): RTMC must call another unit (go to step 3)
5. Travel to scene
6. Decide: First responder to arrive at scene?
a. Yes: go to step 19
b. No: go to step 7
7. FIRST notifies RTMC of arrival at scene
8. Decide: Is FIRST needed at scene in addition to other responder(s)?
a. Yes: go to step 9
b. No: go to step 31
9. Stage vehicle in an appropriate location per ICMT guidelines
10. Coordinate activities (e.g., clearance, scene protection) with MSP on-scene
- Note: guidelines infer that MSP would be an on-scene responder, but what if Tow discovers incident and FIRST arrives next?

B-6
11. Decide: What task is assigned to FIRST?
a. Repair or assist to get vehicle operational and back on the road
- go to Step 12
b. Assist with tow arrangements (owner and vehicle together)
- go to Step 16
c. Transport owner (separate from vehicle) to an off-highway location
- go to Step 29
(Note: at this point, guidelines infer the vehicle has already been moved into a non-blocking location by the initial responder, but what if the vehicle is still blocking traffic?)
12. Perform repairs and/or assist as necessary
13. Decide: Is vehicle operational?
a. Yes: go to step 14
b. No: go to step 16
14. Assist with re-entry of vehicle into traffic flow
15. Notify RTMC: “all clear” and go to step 31
16. Contact RTMC regarding need for tow
- Note: assumes no prior Tow request (e.g., MSP step 17)
17. RTMC contacts Tow
18. Wait for Tow to arrive; go to Step 31
- Note: Assumes FIRST does not assist Tow with recovery operations
19. Protect scene
a. Position vehicle
b. Activate rear emergency flashers and/or chevron
20. Assess incident

B-7
21. Decision: Is vehicle blocking traffic?
a. Yes: go to step 22
b. No: go to step 26
22. Decision: Is vehicle occupied?
a. Yes: go to step 23
b. No: go to step 24
23. Talk with motorist and reach agreement on
a. How to move car safely (method)
b. Where to move car (non-blocking location)
24. Move vehicle
25. Coordinate vehicle removal plan with others present, if any; go to step 11
26. Decide: Is vehicle occupied?
a. Yes: go to step 25
b. No: go to step 27
27. Red tag or mark vehicle with freeway paint
- assists with monitoring duration of vehicle abandonment
28. Notify RTMC of vehicle status; go to 30
29. Assist as necessary with securing scene
30. Contact TIO to inform of transport plan
31. Depart scene

B-8
Tow service
1. Incident occurs; time elapses until detected
a. If incident detected by tow unit, go to step 2
b. Else, go to step 6
2. Tow unit notifies tow dispatch of incident
3. Tow dispatch notifies MSP of stalled vehicle and receives instructions
4. Tow dispatch contacts tow unit
5. Decide: unit needed on scene?
a. Yes: go to step 8
b. No: go to step 28
6. After detection and verification of incident at RTMC and determination of need, MSP or RTMC dispatch contacts appropriate tow service dispatch
7. Tow dispatch contacts appropriate tow unit(s) until an available one found; if no units available to respond, inform MSP/RTMC and go to step 6
8. Decide: tow unit(s) able to respond?
a. Yes: go to step 9
b. No: go to step 7
9. Travel to scene
10. Decide: First responder to arrive at scene?
a. Yes: go to step 11
b. No: go to step 25
11. Protect scene, stage vehicle in an appropriate location per ICMT guidelines

B-9
12. Decide: Is vehicle blocking traffic?
a. Yes: go to step 13
b. No: go to step 20
13. Decide: Is vehicle occupied?
a. Yes: go to step 18
b. No: go to step 14
14. Decide: Do traffic conditions permit a move of the vehicle to a nearby non-blocking location?
a. Yes: go to step 15
b. No: go to step 17
15. Move vehicle to safe non-blocking location
16. Tow notifies MSP and/or RTMC dispatch about new vehicle location
17. Wait for MSP and/or FIRST to arrive; upon arrival, go to step 24
18. Talk with motorist
a. Inform motorist that MSP and/or FIRST is on its way
b. If necessary,
1) Decide where to move vehicle (non-blocking location)
2) Decide how to move vehicle safely (method)
19. Decide: Does owner give tow consent to move vehicle?
a. Yes: go to step 14
b. No: go to step 17
20. Decide: Is vehicle occupied?
a. Yes: go to step 21
b. No: go to step 17
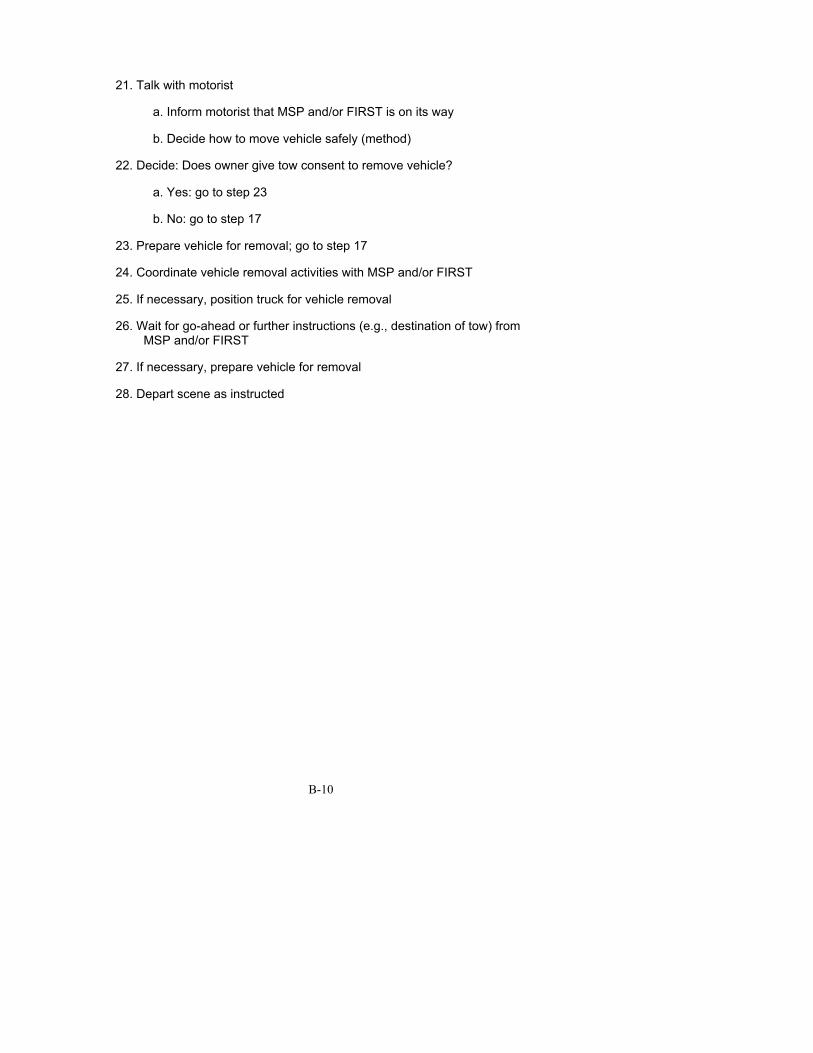
B-10
21. Talk with motorist
a. Inform motorist that MSP and/or FIRST is on its way
b. Decide how to move vehicle safely (method)
22. Decide: Does owner give tow consent to remove vehicle?
a. Yes: go to step 23
b. No: go to step 17
23. Prepare vehicle for removal; go to step 17
24. Coordinate vehicle removal activities with MSP and/or FIRST
25. If necessary, position truck for vehicle removal
26. Wait for go-ahead or further instructions (e.g., destination of tow) from MSP and/or FIRST
27. If necessary, prepare vehicle for removal
28. Depart scene as instructed

B-11
Figure B-3: Process chart for response to a disabled (stalled) vehicle

Appendix C
Survey Responses
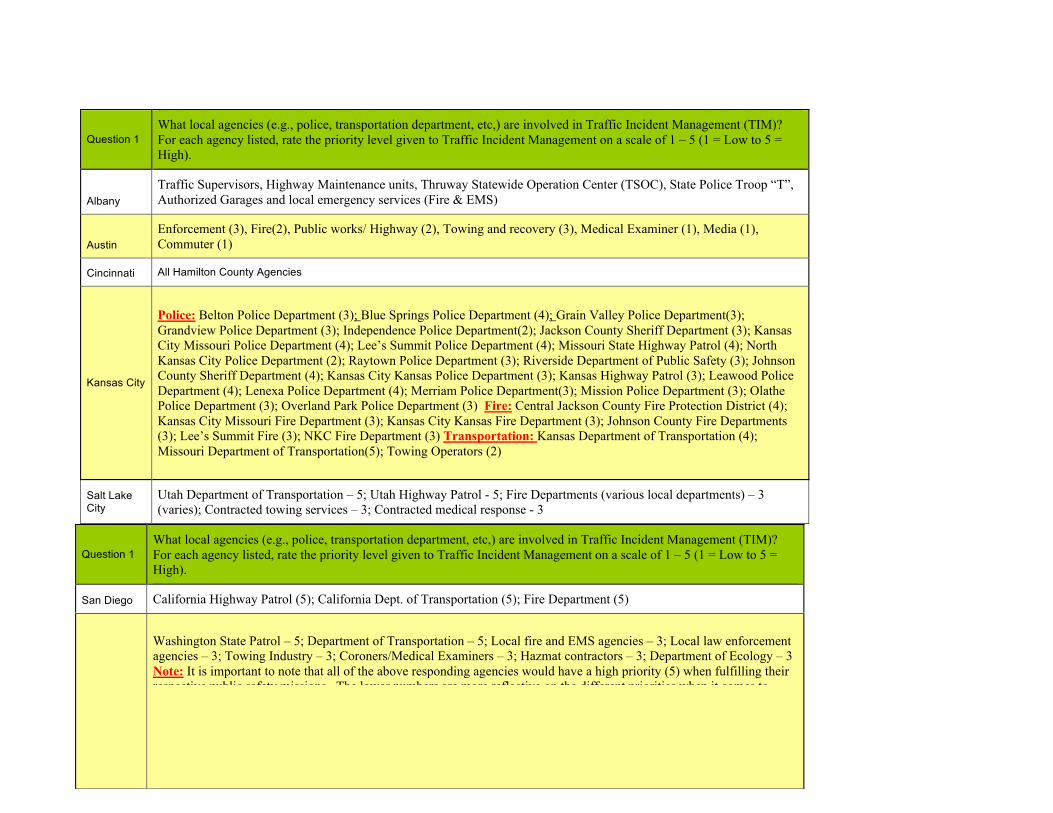
C-2
Question 1 What local agencies (e.g., police, transportation department, etc,) are involved in Traffic Incident Management (TIM)? For each agency listed, rate the priority level given to Traffic Incident Management on a scale of 1 – 5 (1 = Low to 5 = High).
Albany Traffic Supervisors, Highway Maintenance units, Thruway Statewide Operation Center (TSOC), State Police Troop “T”, Authorized Garages and local emergency services (Fire & EMS)
Austin Enforcement (3), Fire(2), Public works/ Highway (2), Towing and recovery (3), Medical Examiner (1), Media (1), Commuter (1)
Cincinnati All Hamilton County Agencies
Kansas City
Police: Belton Police Department (3); Blue Springs Police Department (4); Grain Valley Police Department(3); Grandview Police Department (3); Independence Police Department(2); Jackson County Sheriff Department (3); Kansas City Missouri Police Department (4); Lee’s Summit Police Department (4); Missouri State Highway Patrol (4); North Kansas City Police Department (2); Raytown Police Department (3); Riverside Department of Public Safety (3); Johnson County Sheriff Department (4); Kansas City Kansas Police Department (3); Kansas Highway Patrol (3); Leawood Police Department (4); Lenexa Police Department (4); Merriam Police Department(3); Mission Police Department (3); Olathe Police Department (3); Overland Park Police Department (3) Fire: Central Jackson County Fire Protection District (4); Kansas City Missouri Fire Department (3); Kansas City Kansas Fire Department (3); Johnson County Fire Departments (3); Lee’s Summit Fire (3); NKC Fire Department (3) Transportation: Kansas Department of Transportation (4); Missouri Department of Transportation(5); Towing Operators (2)
Salt Lake City
Utah Department of Transportation – 5; Utah Highway Patrol - 5; Fire Departments (various local departments) – 3 (varies); Contracted towing services – 3; Contracted medical response - 3
Question 1 What local agencies (e.g., police, transportation department, etc,) are involved in Traffic Incident Management (TIM)? For each agency listed, rate the priority level given to Traffic Incident Management on a scale of 1 – 5 (1 = Low to 5 = High).
San Diego California Highway Patrol (5); California Dept. of Transportation (5); Fire Department (5)
Washington State Patrol – 5; Department of Transportation – 5; Local fire and EMS agencies – 3; Local law enforcement agencies – 3; Towing Industry – 3; Coroners/Medical Examiners – 3; Hazmat contractors – 3; Department of Ecology – 3 Note: It is important to note that all of the above responding agencies would have a high priority (5) when fulfilling their respective public safety missions. The lower numbers are more reflective on the different priorities when it comes to
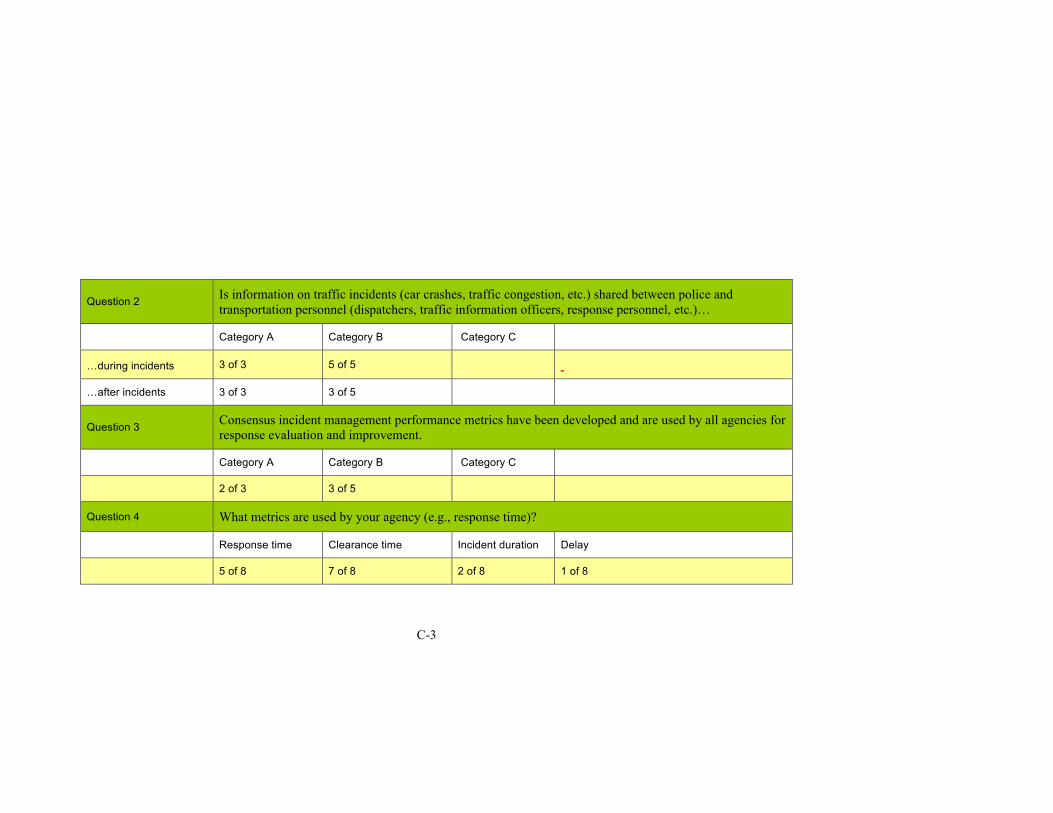
C-3
Question 2 Is information on traffic incidents (car crashes, traffic congestion, etc.) shared between police and transportation personnel (dispatchers, traffic information officers, response personnel, etc.)…
Category A Category B Category C
…during incidents 3 of 3 5 of 5
…after incidents 3 of 3 3 of 5
Question 3 Consensus incident management performance metrics have been developed and are used by all agencies for response evaluation and improvement.
Category A Category B Category C
2 of 3 3 of 5
Question 4 What metrics are used by your agency (e.g., response time)?
Response time Clearance time Incident duration Delay
5 of 8 7 of 8 2 of 8 1 of 8
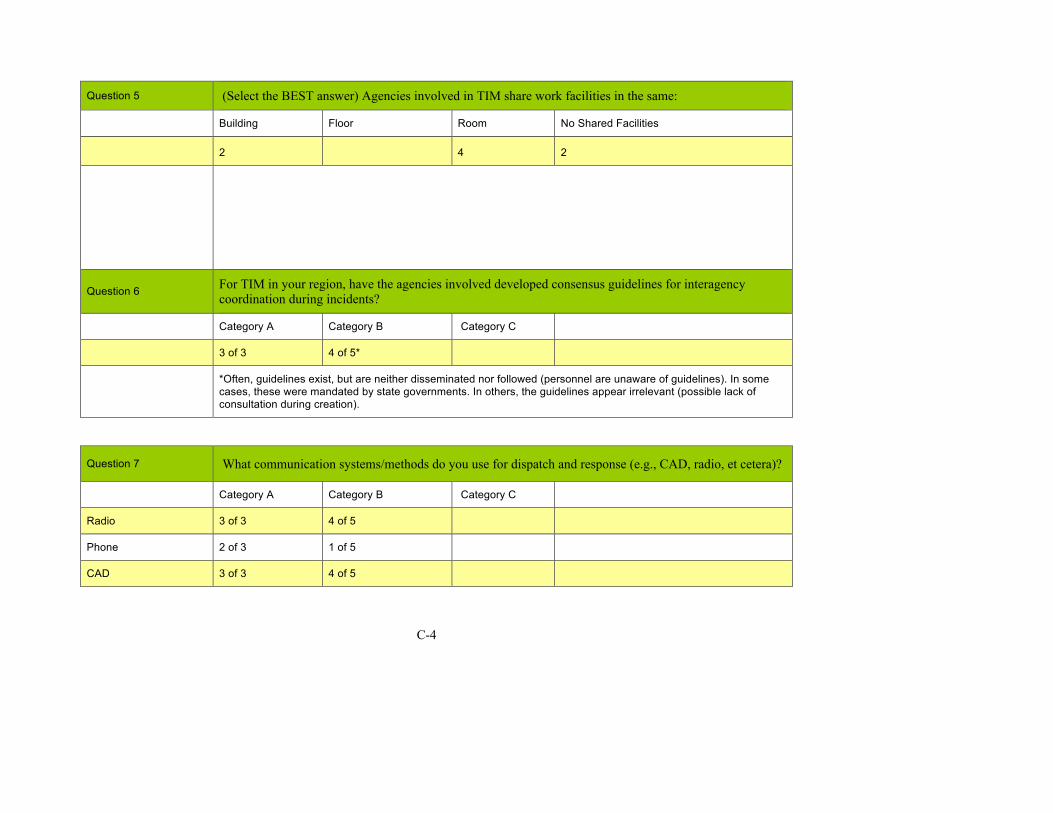
C-4
Question 5 (Select the BEST answer) Agencies involved in TIM share work facilities in the same:
Building Floor Room No Shared Facilities
2 4 2
Question 6 For TIM in your region, have the agencies involved developed consensus guidelines for interagency coordination during incidents?
Category A Category B Category C
3 of 3 4 of 5*
*Often, guidelines exist, but are neither disseminated nor followed (personnel are unaware of guidelines). In some cases, these were mandated by state governments. In others, the guidelines appear irrelevant (possible lack of consultation during creation).
Question 7 What communication systems/methods do you use for dispatch and response (e.g., CAD, radio, et cetera)?
Category A Category B Category C
Radio 3 of 3 4 of 5
Phone 2 of 3 1 of 5
CAD 3 of 3 4 of 5
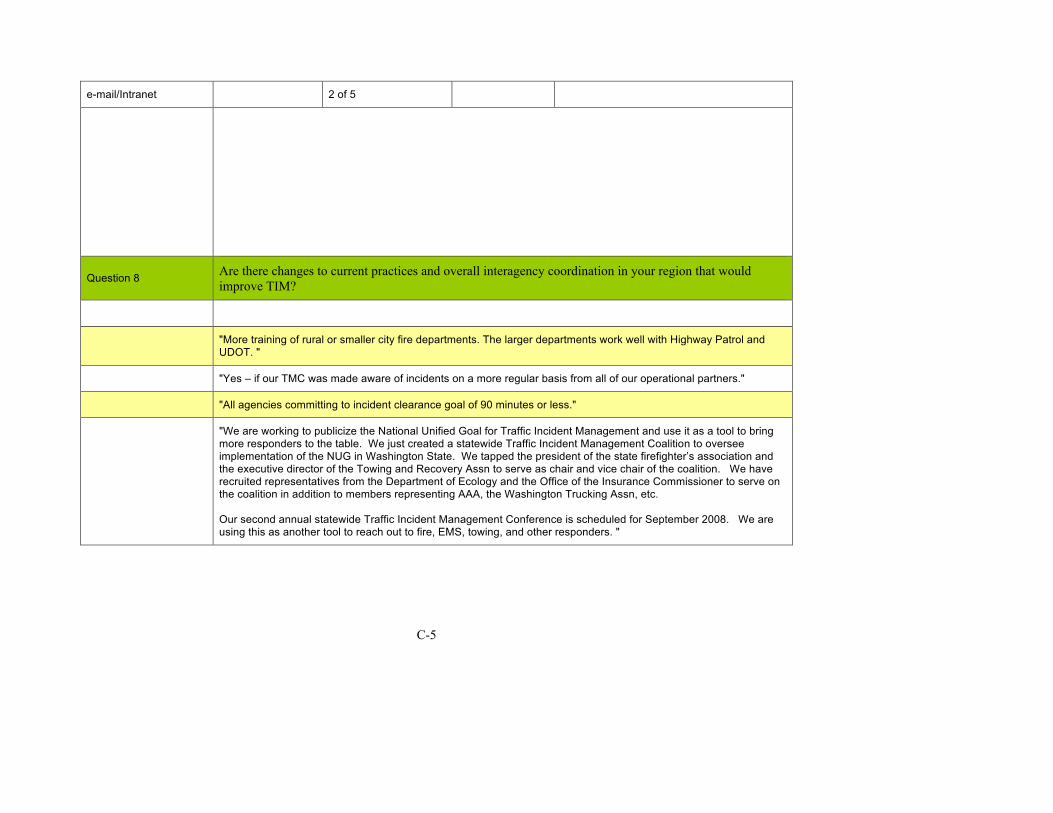
C-5
e-mail/Intranet 2 of 5
Question 8 Are there changes to current practices and overall interagency coordination in your region that would improve TIM?
"More training of rural or smaller city fire departments. The larger departments work well with Highway Patrol and UDOT. "
"Yes – if our TMC was made aware of incidents on a more regular basis from all of our operational partners."
"All agencies committing to incident clearance goal of 90 minutes or less."
"We are working to publicize the National Unified Goal for Traffic Incident Management and use it as a tool to bring more responders to the table. We just created a statewide Traffic Incident Management Coalition to oversee implementation of the NUG in Washington State. We tapped the president of the state firefighter’s association and the executive director of the Towing and Recovery Assn to serve as chair and vice chair of the coalition. We have recruited representatives from the Department of Ecology and the Office of the Insurance Commissioner to serve on the coalition in addition to members representing AAA, the Washington Trucking Assn, etc. Our second annual statewide Traffic Incident Management Conference is scheduled for September 2008. We are using this as another tool to reach out to fire, EMS, towing, and other responders. "

C-6
"We are in the process of updating and making adjustments to the incident management manual. KC Scout will be providing training to departments / agencies on the manual. The information will be provided in a format that will be easy for the responders to use, and it will be kept updated. The biggest problem is that the responders don’t even know that the manual exists, much less what is in it."
"It could always be better, but I feel we do a pretty good job. We have a consolidated communications center for the majority of the police and fire agencies in the county and work well with each other for major incidents..."