Embed Size (px)
Citation preview
Identity and Bias:
Insights from Driving Tests�
Revital Bar and Asaf Zussman
Economics Department, The Hebrew University of Jerusalem
January 31, 2018
Abstract
How does one�s identity a¤ect the evaluation of others? To shed light
on this question, we analyze the universe of driving tests conducted in
Israel between 2006 and 2015, leveraging the e¤ectively random assign-
ment of students and testers to tests. We �nd strong and robust evi-
dence of both ethnic (Arab/Jewish) in-group bias and gender out-group
bias. While the �rst result is in line with the typical �nding in the liter-
ature, the second is novel. Analyses of administrative and survey data
�We thank Ian Ayres, Simon Jager, David Neumark, Gautam Rao and audiences atthe Bank of Israel, Bar Ilan University, Ben Gurion University, EALE, Hebrew University,I-Core, SOLE, Tel Aviv University, University of Exeter, University of Warwick and theWeizmann Institute of Science for useful comments and to Hanania Afangar, Ella Dorfman,Galia Hardon, E¢ Rozen, Dalit Tamari and Elena Zlocisty from the Israeli Ministry ofTransport and Road Safety for their help with the data. Financial support for the projectwas generously provided by the I-Core Program of the Planning and Budgeting Committeeat the Israel Science Foundation (grant no. 1821/12). Surveys conducted as part of thisproject were approved by the Hebrew University�s Ethics Committee for Research.
1
suggest a utility-based interpretation for the observed patterns: testers
seem to reward members of groups whose company they enjoy.
JEL classi�cation codes: J15, J16.
Keywords: Identity, Ethnicity, Gender, Bias, Discrimination.
2
1 Introduction
How does one�s identity a¤ect the evaluation of others? In this paper we
shed light on this question using data on driving tests. A driving test is
a standard procedure designed to test a person�s ability to drive a motor
vehicle under normal operating conditions. Such tests are conducted in most
countries around the world and serve as a requirement for obtaining a driver�s
license. Testers are typically government employees who are expected to assess
students�driving abilities in an impartial manner. At the same time, however,
testers enjoy a great deal of discretion in making their decisions, which opens
the door for bias and discrimination.
Speci�cally, the paper studies ethnic (Arab/Jewish) and gender bias using
data on the universe of driving tests conducted in Israel between 2006 and
2015. The vast majority of Israelis take this test, usually when they are in
their late teens and early twenties. Consequently, one out of every 1.4 Israelis
aged 17 and above holds a driving license. Most of our analysis focuses on tests
for a private vehicle license �in total, more than 2.5 million such tests were
conducted during this period. These tests were conducted by 236 testers, of
whom 20 (8.5 percent) are Arab and 21 (8.9 percent) are female. Identi�cation
of causal e¤ects relies on the e¤ectively random assignment of students and
testers to tests.
The analysis yields evidence of both ethnic in-group bias and gender out-
group bias: a student is 14 percent more likely to pass a test when assigned
a tester from the same ethnic group and 11 percent more likely to pass a test
when assigned a tester from the opposite gender. We show that these results
3
(a) are not driven by potential confounds such as endogenous student behavior
or language barriers and (b) are robust to various changes in the estimated
equations.
We argue that the observed patterns are inconsistent with classical models
of statistical discrimination (Arrow, 1972 and Phelps, 1972). In our context,
such models would claim that when evaluating the driving abilities of individ-
ual students, testers might be in�uenced by rational and accurate perceptions
regarding the distribution of driving skills of students from di¤erent ethnicities
and genders. However, classical models of statistical discrimination assume no
cross-evaluator variation in these perceptions, which rules out the possibility
of in-group bias and out-group bias, at least in theory.
Several analyses provide empirical support for our claim that the observed
biases are not driven by statistical discrimination. First, statistical discrimi-
nation would predict that more experienced testers are better able to estimate
individual students�driving abilities and therefore need to rely less on statisti-
cal inference. Using two di¤erent measures, we �nd that neither bias declines
with tester experience. We also �nd that tester experience with speci�c groups
of students is not associated with the extent of bias. Second, in cooperation
with the Israel Ministry of Transport and Road Safety (MOT), which employs
the driving testers, we surveyed a sample of testers. The survey focused on
testers�perceptions regarding the driving skills of students from di¤erent eth-
nicities and genders. We �nd that cross-tester variation in these perceptions
does not explain di¤erential test outcomes across groups.
The leading alternative to statistical discrimination is the taste-based dis-
4
crimination model, �rst presented in Gary Becker�s path-breaking book The
Economics of Discrimination (Becker, 1957). The key element in this model
is that agents incur di¤erent levels of utility from contact with members of
di¤erent groups. Becker�s book focuses almost exclusively on racial relations
in the US, arguing that the underlying force driving discriminatory behavior
is that whites incur a non-pecuniary cost from interaction with non-whites
(particularly blacks). Becker mentions discrimination against women only in
passing. When thinking about the issue, it is quite obvious that the rationale
for racial discrimination described above does not easily carry over to gender
discrimination, since both men and women usually do not shy away from �
and in many situations even prefer �interacting with members of the opposite
sex.
We argue that it is easy reconcile our two key results by simply extending a
Becker-type, utility-based, model to include gender preferences. Such a model
would naturally predict both in-group bias in the case of race (or ethnicity)
and out-group bias in the case of gender. Our �ndings are consistent with
these predictions and suggest that testers seem to reward members of groups
whose company they enjoy. We provide several pieces of evidence to further
support this interpretation.
First, we explore whether the extent of bias in driving tests is correlated
with measures of prejudicial attitudes. This analysis focuses on ethnic bias,
capitalizing on the fact that inter-ethnic relations in Israel exhibit considerable
spatial and temporal variation. Similar to Charles and Guryan (2008), who
study racial wage gaps in the US, prejudicial attitudes are measured using the
5
extent of public support for laws banning inter-group marriages. Consistent
with the taste-based interpretation, we �nd positive and strong spatial and
temporal associations between bias and prejudicial views.
Second, we argue that if bias is indeed driven by the di¤erent levels of
utility testers derive from interacting with members of di¤erent groups during
the test, it is natural to assume that this e¤ect would decline with physical
distance between testers and students. To explore this hypothesis, we replicate
our analysis of bias using data on the universe of driving tests for motorcycle
licenses, where the student and the tester drive di¤erent vehicles and are thus
not in close proximity. We �nd no evidence of bias in motorcycle tests (since
there is only one female tester conducting motorcycle tests, in this case too
we focus on ethnic bias).
The third test of the utility-based interpretation focuses on gender bias
and relies on a large scale survey we conducted among the Israeli public. The
survey examined public perceptions regarding the determinants of driving test
outcomes. One of the most striking results of the survey is that the vast ma-
jority of participants believed that since most driving testers are male, some
female students emphasize their gender identity (e.g. by dressing provoca-
tively) in order to increase their likelihood of passing the test. Moreover,
most of the participants thought that such behavior does indeed achieve its
intended objective. Assuming these perceptions re�ect actual behaviors, they
lend support for our argument that gender out-group bias is driven by tastes.
The literature on discrimination and bias is extensive. Most of it focuses on
the identity of the subject of evaluation, e.g. studying discrimination against
6
job applicants from speci�c groups. Our paper is most closely related to a
strand in the literature which examines the e¤ect on outcomes of a match
between the identity of the evaluator and the identity of the subject of eval-
uation. Researchers use this approach for two main purposes. First, in some
situations there are no objective measures of performance, ability, quali�ca-
tion etcetera, which makes it impossible to argue that di¤erences in outcomes
between members of di¤erent groups are due to discrimination. In these situ-
ations, and when assignment is random, examining the e¤ect on outcomes of
a match in identity between the evaluator and the subject of evaluation allows
researchers to credibly establish the existence of discrimination. Second, this
approach enables researchers to better understand the mechanisms underlying
observed bias and in particular to disentangle taste-based from statistical dis-
crimination. The idea is that if bias is statistical in nature, its extent should
not vary with the evaluator�s identity.
An important dichotomy within this literature is between studies that rely
on lab or �eld experiments and those that rely on naturally occurring data.
While experiments, especially those conducted in the lab, give researchers
greater control, in many cases they su¤er from well-known weaknesses such
as the fact that decision makers are not professional, group identities are
arti�cially-generated and stakes are low. The use of naturally occurring data
overcomes these di¢ culties.
Recent examples of research that examines the e¤ect of a match between
evaluator�s and subject�s identities and relies on naturally occurring data in-
clude papers exploring bias in: judicial decision making (Shayo and Zussman
7
(2011 and 2017), Anwar, Bayer, and Hjalmarsson (2012) and Depew, Eren
and Mocan (forthcoming)); policing (Anwar and Fang (2006), Antonovics and
Knight (2009) and West (2016)); refereeing in academic journals (Abrevaya
and Hamermesh (2012)) and in sports (Price and Wolfers (2010), Parsons
et al. (2011), Sandberg (forthcoming)); teacher evaluation of students (Dee
(2005)); student evaluation of teachers (Mengel, Sauermann and Zolitz (forth-
coming) and Boring (2017)); lending decisions (Beck, Behr and Madestam
(forthcoming) and Fisman, Paravisini and Vig (2017)); equity analysts�rec-
ommendations (Jannati et al. (2016)); the allocation of workload between
workers (Hjort (2014)); and recruiting and promotion decisions (Bagues and
Esteve-Volart (2010) and Bagues, Sylos-Labini and Zinovyeva (2017)).
Beyond the credible identi�cation of bias facilitated by the context we
study, several features make it perfect for uncovering the role of tastes. First,
decision makers face weak incentives to evaluate candidates in an objective
manner (mainly because there is very little monitoring by supervisors and pay
does not depend on the accuracy of evaluation or on pass rates). Second,
decisions are made by a single individual at a single point in time. Third, the
decision maker and the person being evaluated are in close physical proximity.
The key contribution of this paper to the literature rests on our ability to
uncover the role of the tastes while studying ethnic and gender bias simul-
taneously. We show that as far as tastes are concerned, the type of identity
examined matters for the direction of bias. The result of ethnic in-group bias
is in line with the typical �nding in the relevant literature. However, while
intuitive, to our knowledge, this paper is the �rst to provide evidence of gender
8
out-group bias in evaluations made by individual professional decision makers.1
Admittedly, the context we study is quite di¤erent from the ones econo-
mists usually focus on. For instance, when deciding whom to hire or whether
to approve a loan application, there are strong incentives to evaluate candi-
dates objectively since a mistake in judgment could be costly for the decision
maker. Therefore, our results may be viewed as an upper bound on the role
of tastes, i.e. utility considerations likely play a more muted role in contexts
where incentives do matter (for a similar argument, in the context of grading
by university professors, see Bar and Zussman (2012)).
Two limitations of the methodological approach we employ in this study
are worth noting. First, we are able to estimate only relative rather than
absolute levels of bias against certain groups. Suppose, for example, that in
addition to the utility-based considerations we have emphasized so far, both
male and female testers incorrectly believe that female students are less able
drivers than male students. In this case, we would only be able to pick up the
e¤ect of tastes but not the e¤ect of stereotypes. Second, we are unable to say
which group of testers is biased and what is the direction of bias. In the case
of ethnicity, for example, we cannot determine whether Jewish testers, Arab
testers or both are biased. Moreover, it is impossible to determine whether
1Although quite a few of the empirical papers mentioned above examine gender bias,only Bagues and Esteve-Volart (2010) show convincing evidence of an opposite-gender pref-erence. However, unlike our paper, Bagues and Esteve-Volart (2010) examine decision mak-ing by committees (the authors do not observe individual votes within committees). Bagues,Sylos-Labini and Zinovyeva (2017) also examine committee decision making, but do observeindividual voting reports. Analyses at the individual level provides no evidence of genderin-group bias.In any case, the mechanisms suggested in these papers are di¤erent from the one we
highlight here.
9
testers from a speci�c group are biased in favor of students from their own
group or biased against students from the other group.2
The rest of the paper is structured as follows. Section 2 provides details
on the institutional context. Section 3 describes the datasets we use in the
analysis and provides summary statistics. In Section 4 we show results of
balancing tests, outline the empirical strategy and provide the main results
concerning ethnic and gender bias. Section 5 addresses potential confounds
and presents results of robustness checks. In Section 6 we explore possible
interpretations of the results. Section 7 concludes.
2 Driving Tests in Israel
In this section we brie�y describe the institutional context in which driving
tests are conducted, focusing on private vehicle tests (a more detailed descrip-
tion is provided in online Appendix A).
The MOT divides the country into 4 regions. Each of these regions contains
several testing centers; overall, there are 43 centers. Each MOT tester and
each driving school � and through it each driving teacher and student � is
associated with one of these regions. A student must be tested in the same
region to which her driving school belongs.
2In a recent study, Feld, Salamanca and Hamermesh (2016) use a �eld experiment toexplore the last issue.
10
2.1 Assignment
The assignment of testers to tests is based on computerized, region-speci�c,
waiting lists. Based on the number of students waiting to be tested and the
number of available tests in each region in each month, the MOT allocates a
speci�c number of test slots to each teacher. A test slot is de�ned by a test
center, date and time. Crucially, the MOT does not inform the teachers about
the identity of the tester in each slot. The four MOT region o¢ ces construct
a weekly work plan for each tester, detailing in which test centers they will
work each day within the MOT region they belong to. These assignments
are revealed to the testers a week in advance. Only when the tester shows
up for work in the morning, is he provided with a work schedule for that
day specifying the name of the driving school for each time slot. Under no
circumstances are testers allowed to deviate from this schedule. With this
work schedule in hand, the tester approaches a designated parking area and
locates the vehicle of the speci�c driving school assigned to him (this is the
vehicle in which the student took his driving lessons and it belongs to the
driving teacher). The identity of the student is revealed to the tester (and vice
versa) only when the tester enters the car.
The main objective of the MOT assignment procedure is to make sure that
testers will not be able to choose whom to test and students will not be able to
choose whom to be tested by. This implies that the assignment of students and
testers to tests is e¤ectively random. In other words, on a given day, within a
test center, the likelihood of being assigned a tester of a certain ethnicity or
gender is the same for all students. We later use balancing tests to show that
11
assignment is indeed e¤ectively random.
2.2 Tests
Tests are allocated between 25 and 30 minutes. During the test, testers provide
students with simple driving instructions (e.g. �turn left�, �continue straight
ahead�); testers are forbidden from talking to students about subjects unre-
lated to the test. At the end of the test, after leaving the car, the tester �lls out
a detailed test evaluation form which includes a large number of criteria. The
pass/fail decisions are communicated to the students through their teachers
only at the end of the workday.
How do testers decide whether to pass or fail a student? Although testers
are well trained and have detailed testing guidelines, assessing the driving skills
of students based on dozens of criteria is very much subjective. Moreover, there
is no o¢ cial formula for aggregating the separate marks into a single outcome.
Taken together, these facts imply that testers have a lot of discretion in making
the pass/fail decision. In fact, in our data the average pass rate per tester �
for testers who conducted at least 1,000 tests �varies greatly: it is 26 percent
at the 5th percentile and 62 percent at the 95th percentile.
Failing the driving test has several negative implications for the student.
First, the student has to wait for the next available slot. In our data, the
average waiting time between tests is about two and a half months. Second,
in order to increase the chances of passing the next test, most students take
additional (costly) driving lessons. Third, not having a driver�s license has
additional costs, such as limiting work opportunities.
12

3 Data
In order to carry out the analysis, we merge 3 datasets provided to us by
the MOT. The �rst contains information on the universe of driving tests con-
ducted between June 2006 and September 2015. Each observation includes
the following �elds: test outcome (pass/fail), scrambled student identi�cation
number, scrambled tester identi�cation number, test date, test center, number
of theory tests, the current driving test number and the type of driving license
the test is for. The dataset contains information on over 3 million tests, of
which 81 percent are for private vehicle licenses and 8 percent are for motorcy-
cle licenses. The rest are tests for licenses for buses, trucks, tractors etcetera.
Our analysis focuses on private vehicle tests (to explore the sources of bias, in
Section 6 we additionally utilize the data on motorcycle tests).
The second dataset contains information on the students who took these
tests. Each observation contains the following �elds: scrambled identi�cation
number, �rst name, gender, birth year, locality of residence, zip code within
this locality, type of license for which the student was tested and identi�cation
keys for driving school and teacher. The dataset contains information on more
than a million students.
The third dataset has information on the driving testers who performed the
tests in the �rst dataset. Each observation has the following �elds: scrambled
identi�cation number, �rst name, gender, birth year, locality of residence and
zip code within this locality. The dataset covers 236 testers for private vehicle
licenses.
To deduce the ethnicity of students and testers we rely on an approach
13
similar to that used in Shayo and Zussman (2011) and Zussman (2013). It
builds on the fact that Arabs and Jews in Israel have very di¤erent naming
conventions and on the very high degree of residential ethnic segregation �the
population of most localities is either all-Arab or all-Jewish and the population
of integrated localities, such as Jerusalem and Tel Aviv, is ethnically segregated
by neighborhood. Overall, our procedure enables us to assign ethnicity to all
testers and to 99 percent of students; the remaining students are excluded
from the analysis. Details on this procedure are provided in online Appendix
B.
3.1 Summary statistics
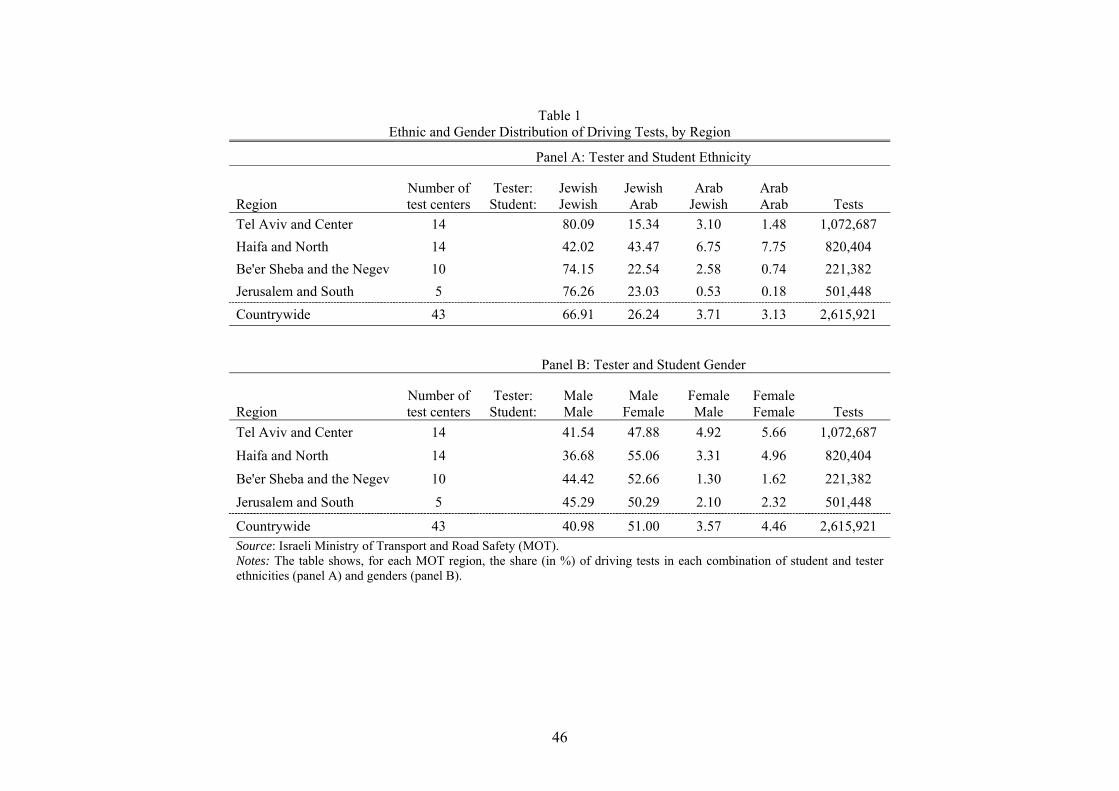
Panel A of Table 1 shows the distribution of private vehicle tests across MOT
regions by the ethnicity of students and testers. We note several interesting
patterns in the data. Seven percent of tests were conducted by Arab testers
while 29 percent of tests were taken by Arab students. The share of cross-
ethnicity tests (where the tester and the student belong to di¤erent ethnic
groups) is 30 percent. This share exhibits signi�cant variation across MOT
regions: it is 18 percent in the Tel Aviv and Center region and 50 percent in
the Haifa and North region. This variation stems from the fact that the Arab
population of Israel is not uniformly distributed across the di¤erent regions of
the country.
[Table 1]
14
Panel B of Table 1 shows the distribution of tests across MOT regions by
the gender of students and testers. Eight percent of tests were conducted by
female testers while 55 percent of tests were taken by female students. The
share of cross-gender tests is 55 percent; as one might expect, this share does
not vary much across regions.
Summary statistics for students and testers are presented and discussed in
online Appendix C. Here we only note that the share of Arabs is about 25
percent among students and 9 percent among testers; the share of females is
roughly 50 percent among students and 9 percent among testers.
4 Ethnic and Gender Bias
In this section we explore whether a student is more (or less) likely to pass a
test when assigned a tester from his or hers own ethnic group or gender. Our
ability to credibly identify such biases crucially depends on the assumption
that the assignment of students and testers to tests is random. The results of
balancing tests, provided in online Appendix D, show that the assignment of
students and testers to tests seems to be e¤ectively random.
4.1 Ethnic Bias
Figure 1 displays pass rates by tester and student ethnicity. When the tester
is Jewish (left two columns), the pass rate is 42.5 percent for Jewish students
but only 32.7 percent for Arab students. In itself, this 9.8 percentage points
di¤erence does not indicate the existence of ethnic bias. It is possible, for
15
example, that on average, Arab students arrive to the test less prepared than
Jewish students. If this was the only di¤erence between Arab and Jewish
students, we would expect a similar cross-ethnicity di¤erence in pass rates
when the tester is Arab. In fact, however, we observe that when the tester
is Arab (right two columns), the pass rate is 33.6 percent for Jewish students
and 33.0 percent for Arab students (a 0.6 percentage points di¤erence). The
di¤erence in these di¤erences, of 9.2 percentage points, is the raw estimate of
the extent of in-group bias (online Appendix Table E1 reports this di¤erence-
in-di¤erences analysis in more detail). It is crucial to note that, in the absence
of an objective measure of driving ability (e.g. derived from video footage of
the tests), it is impossible to determine whether Jewish or Arab testers are
biased and whether they are biased in favor of students from their own ethnic
group or against students from the opposite ethnic group.3
[Figure 1]
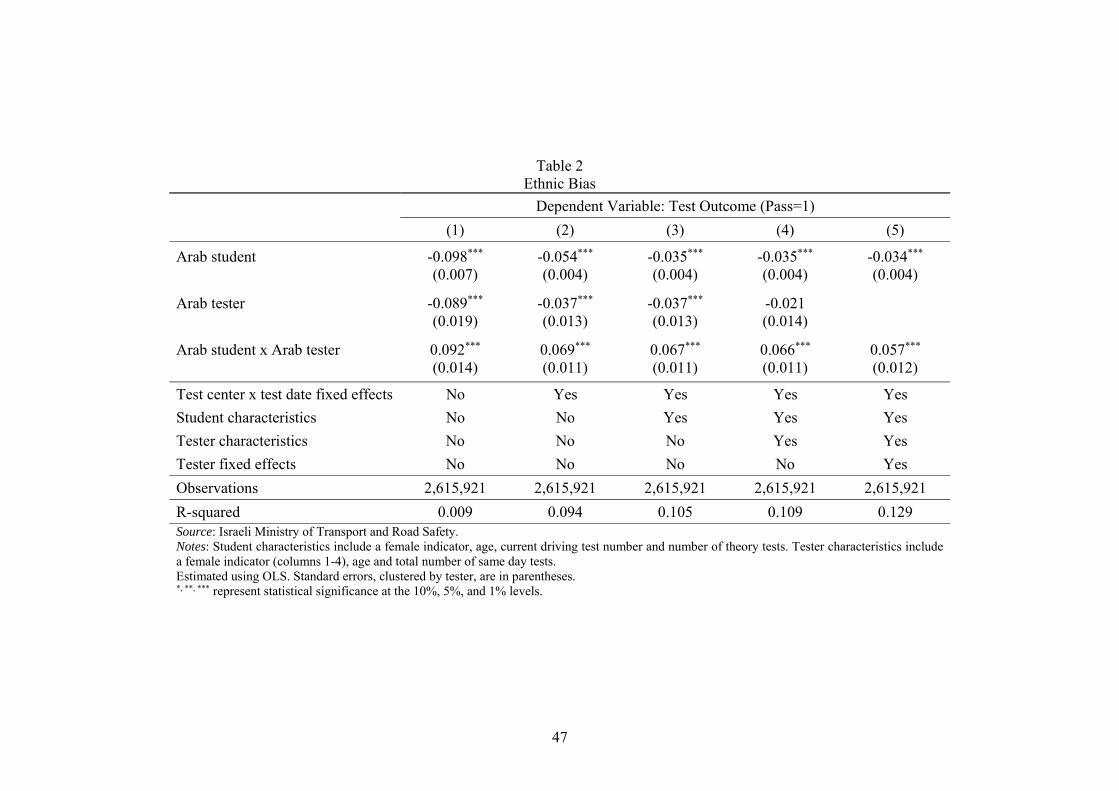
Next, we explore ethnic bias econometrically. We start by estimating the
following basic speci�cation which replicates the graphical analysis:
Passijct = �0 + �1ArabStudent i + �2ArabTester j (1)
+�3ArabStudent i � ArabTester j + �ijct3An interesting observation is that pass rates for Arab students (under testers of both
ethnicities) and for Jewish students with Arab testers are all similar. If one is willing to makethe very strong assumption that Jewish and Arab students objectively perform similarly wellin the test, then one might be able to argue that this is the correct pass rate and thereforethat in-group bias solely re�ects Jewish testers discriminating in favor of Jewish students.
16
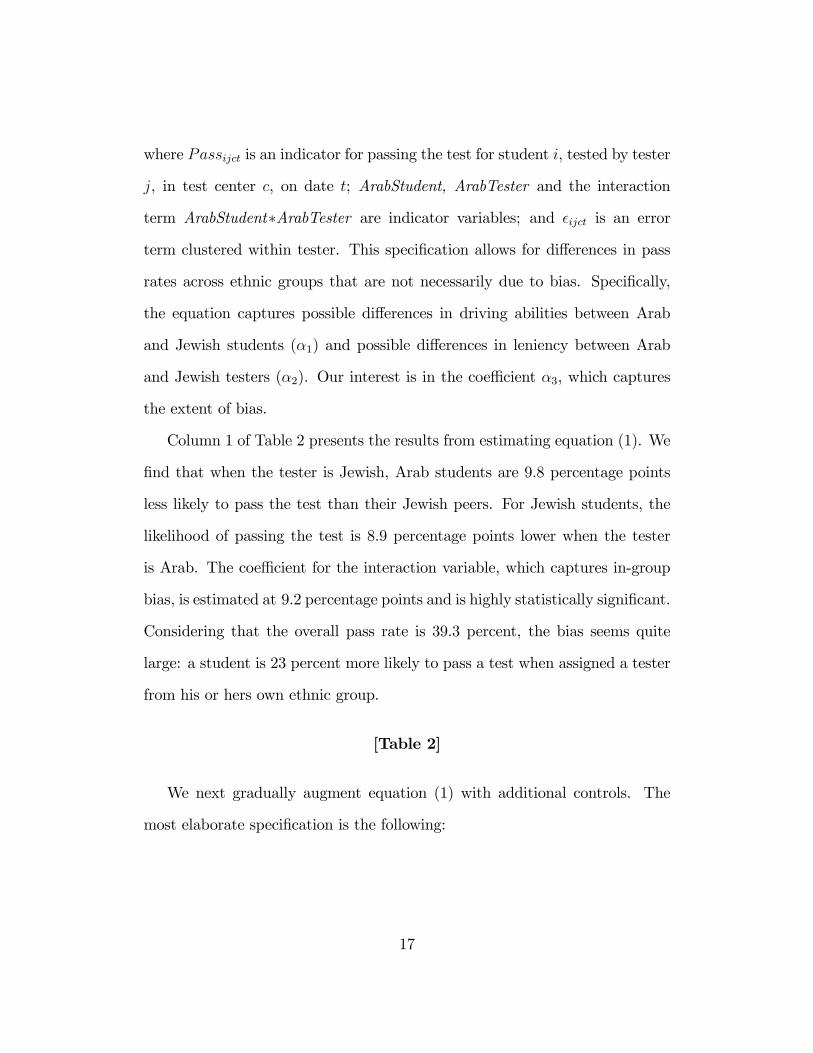
where Passijct is an indicator for passing the test for student i, tested by tester
j, in test center c, on date t; ArabStudent, ArabTester and the interaction
term ArabStudent�ArabTester are indicator variables; and �ijct is an error
term clustered within tester. This speci�cation allows for di¤erences in pass
rates across ethnic groups that are not necessarily due to bias. Speci�cally,
the equation captures possible di¤erences in driving abilities between Arab
and Jewish students (�1) and possible di¤erences in leniency between Arab
and Jewish testers (�2). Our interest is in the coe¢ cient �3, which captures
the extent of bias.
Column 1 of Table 2 presents the results from estimating equation (1). We
�nd that when the tester is Jewish, Arab students are 9.8 percentage points
less likely to pass the test than their Jewish peers. For Jewish students, the
likelihood of passing the test is 8.9 percentage points lower when the tester
is Arab. The coe¢ cient for the interaction variable, which captures in-group
bias, is estimated at 9.2 percentage points and is highly statistically signi�cant.
Considering that the overall pass rate is 39.3 percent, the bias seems quite
large: a student is 23 percent more likely to pass a test when assigned a tester
from his or hers own ethnic group.
[Table 2]
We next gradually augment equation (1) with additional controls. The
most elaborate speci�cation is the following:
17

Passijct = �0 + �1ArabStudent i + �3ArabStudent i � ArabTester j (2)
+�ct + �1Sit + �2Tjt + j + �ijct
where �ct is a test center x test date �xed-e¤ect (note that this is the variable
used as control in the balancing tests); Sit is a set of student characteristics
�female indicator, age in test, driving test number (i.e. number of previous
driving tests + 1) and number of theory tests; Tjt is a set of time varying tester
characteristics �age in test and number of tests conducted by the tester on
the same day; and j is a tester �xed-e¤ect.4
The inclusion of these additional controls lowers the estimate of in-group
bias from 9.2 percentage points in column 1 to 5.7 percentage points in column
5. The latter estimate is still large (about 14 percent of the mean pass rate)
and highly statistically signi�cant.
4.2 Gender Bias
Figure 2 displays pass rates by tester and student gender. When the tester
is male, the pass rate is 44.1 percent for male students but only 35.7 percent
for female students, an 8.3 percentage points di¤erence. When the tester is
female, the pass rate is 44.7 percent for male students but only 31.9 percent
for female students, a 12.9 percentage points di¤erence. This indicates the
existence of gender out-group bias of a substantial magnitude: 4.5 percentage
4Note that adding tester �xed-e¤ects to the estimated equation makes the inclusion oftester characteristics that are not time varying, i.e. ethnicity and gender, redundant.
18
points or 12 percent (online Appendix Table E2 reports this di¤erence-in-
di¤erences analysis in more detail). Here too, there is no way to determine
whether male testers discriminate in favor of female students, female testers
discriminate against female students or some combination of the two.5
[Figure 2]
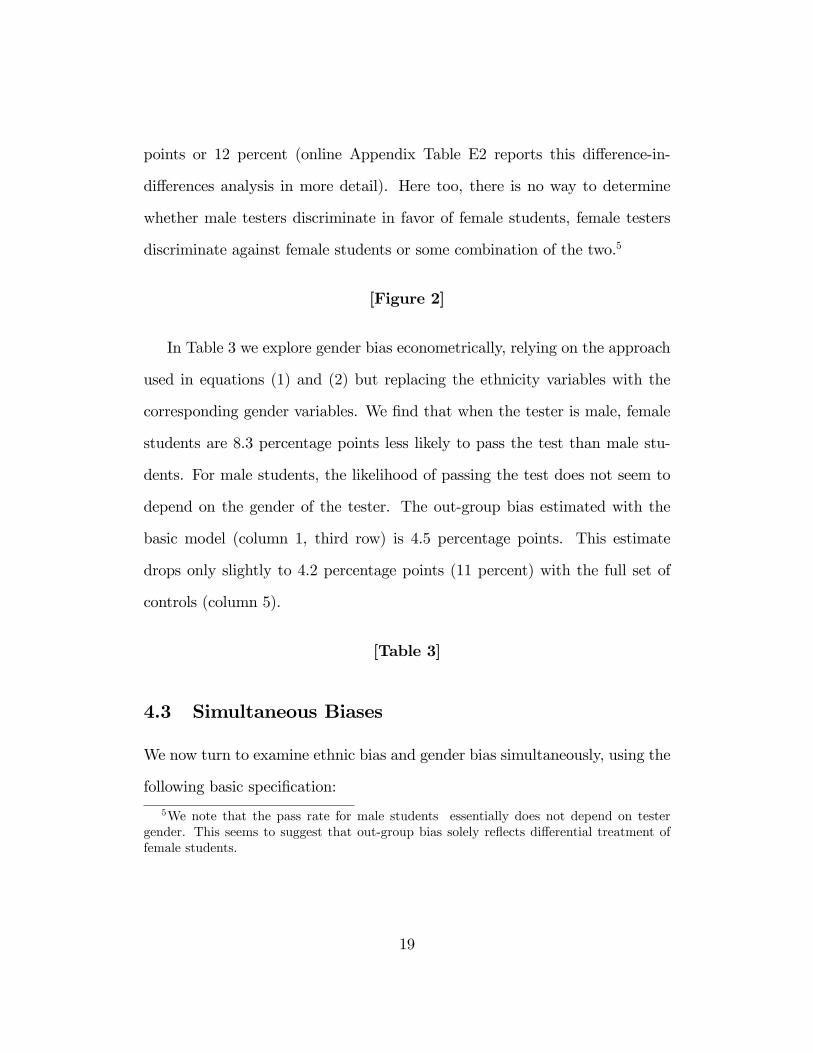
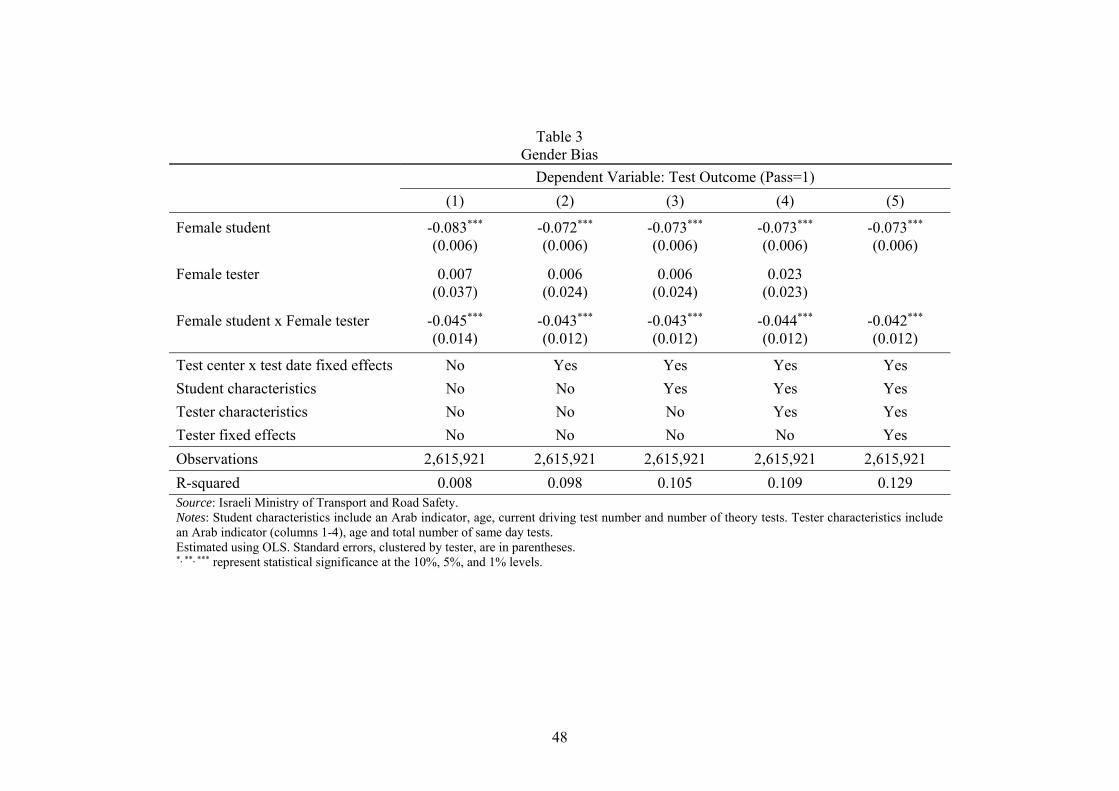
In Table 3 we explore gender bias econometrically, relying on the approach
used in equations (1) and (2) but replacing the ethnicity variables with the
corresponding gender variables. We �nd that when the tester is male, female
students are 8.3 percentage points less likely to pass the test than male stu-
dents. For male students, the likelihood of passing the test does not seem to
depend on the gender of the tester. The out-group bias estimated with the
basic model (column 1, third row) is 4.5 percentage points. This estimate
drops only slightly to 4.2 percentage points (11 percent) with the full set of
controls (column 5).
[Table 3]
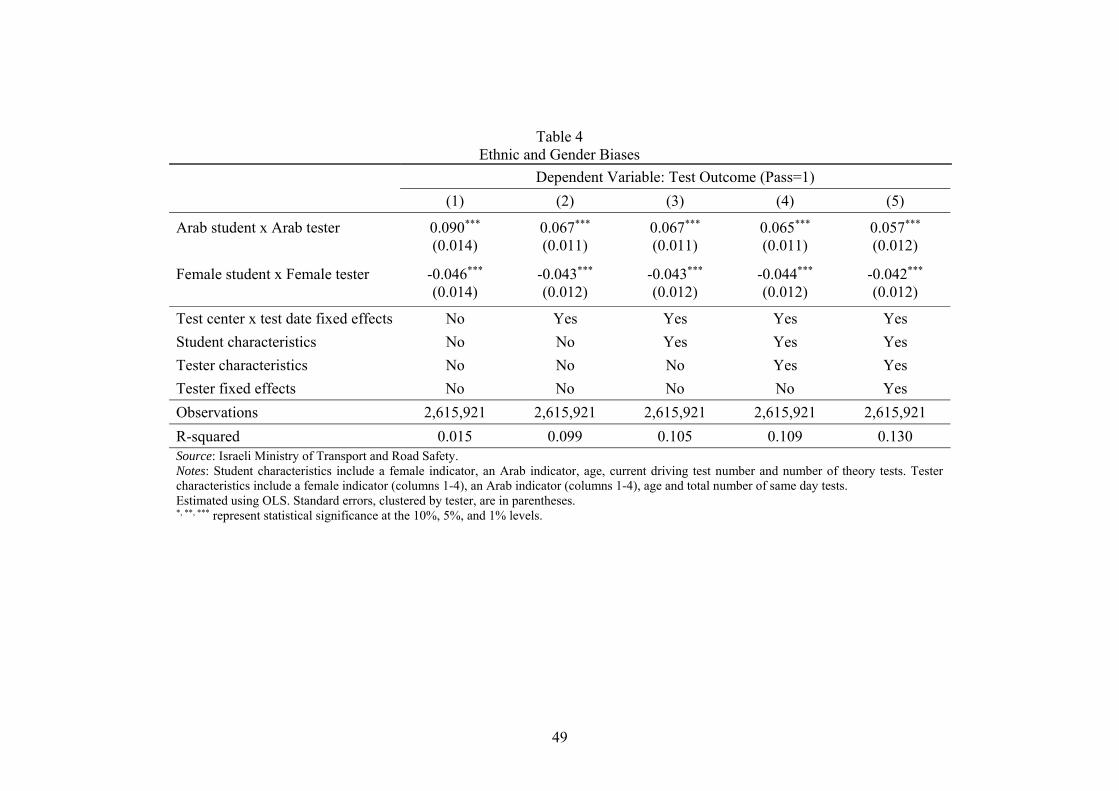
4.3 Simultaneous Biases
We now turn to examine ethnic bias and gender bias simultaneously, using the
following basic speci�cation:
5We note that the pass rate for male students essentially does not depend on testergender. This seems to suggest that out-group bias solely re�ects di¤erential treatment offemale students.
19
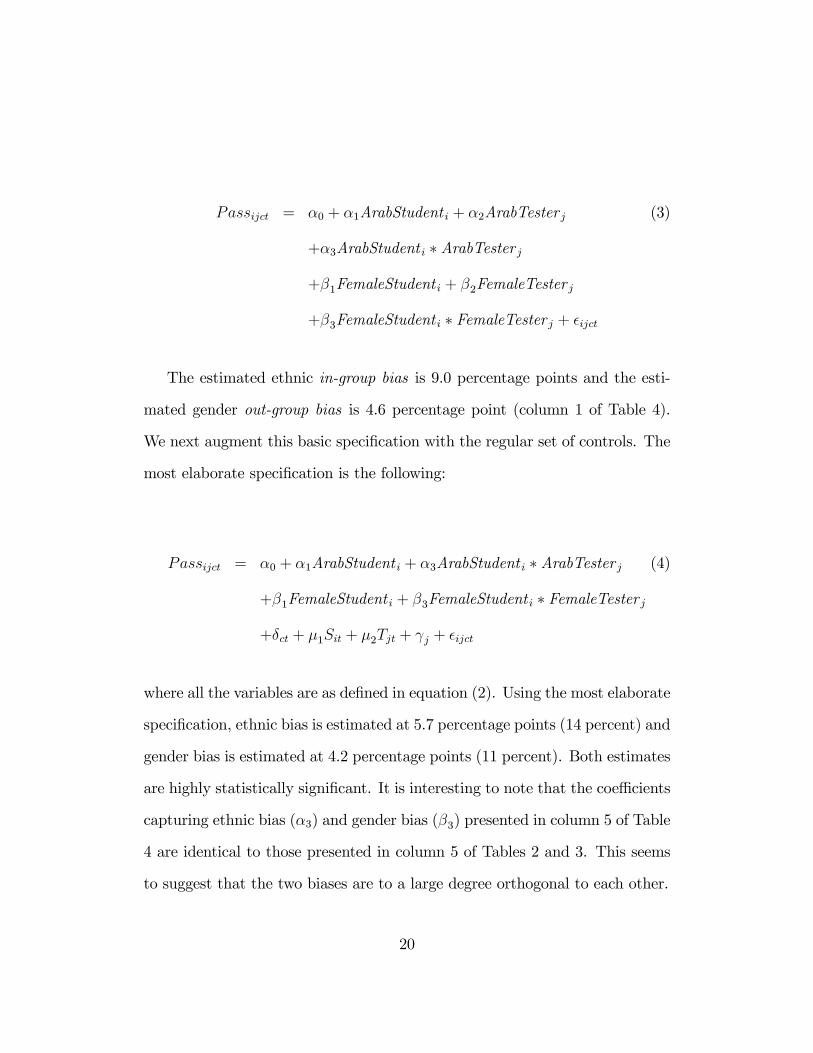
Passijct = �0 + �1ArabStudent i + �2ArabTester j (3)
+�3ArabStudent i � ArabTester j
+�1FemaleStudent i + �2FemaleTester j
+�3FemaleStudent i � FemaleTester j + �ijct
The estimated ethnic in-group bias is 9.0 percentage points and the esti-
mated gender out-group bias is 4.6 percentage point (column 1 of Table 4).
We next augment this basic speci�cation with the regular set of controls. The
most elaborate speci�cation is the following:
Passijct = �0 + �1ArabStudent i + �3ArabStudent i � ArabTester j (4)
+�1FemaleStudent i + �3FemaleStudent i � FemaleTester j
+�ct + �1Sit + �2Tjt + j + �ijct
where all the variables are as de�ned in equation (2). Using the most elaborate
speci�cation, ethnic bias is estimated at 5.7 percentage points (14 percent) and
gender bias is estimated at 4.2 percentage points (11 percent). Both estimates
are highly statistically signi�cant. It is interesting to note that the coe¢ cients
capturing ethnic bias (�3) and gender bias (�3) presented in column 5 of Table
4 are identical to those presented in column 5 of Tables 2 and 3. This seems
to suggest that the two biases are to a large degree orthogonal to each other.
20
[Table 4]
5 Confounds and robustness
5.1 Potential confounds
In this subsection, we address three potential confounds.
5.1.1 Endogenous student behavior?
So far we have interpreted the observed patterns as re�ecting tester behav-
ior. A potential confounding factor �which is shared by many studies in the
relevant literature � is the possibility that student behavior during the test
is endogenous to the ethnicity or gender of the tester. For example, students
may objectively perform better in the test when assigned a tester from the
opposite gender.6
To address this concern, we rely �rst on a survey we conducted among the
general population that focused on public perceptions regarding the determi-
nants of driving test outcomes (details are in online Appendix F; summary
statistics are provided in online Appendix Table F1). Some of the questions
speci�cally addressed the issue of endogenous student behavior. In particular,
with respect to gender we asked participants �In your opinion, is the objec-
tive quality of driving demonstrated by a male (female) student during the
6In a recent paper, Glover, Pallais and Pariente (2017) provide evidence of endogenousreaction to discrimination. They examine the performance of cashiers in a French gro-cery store chain and �nd that manager bias negatively a¤ects the performance of minorityworkers.
21
test a¤ected by the tester�s gender identity?�. For those who answered in
the a¢ rmative, we followed up with the question �A male (female) student
drives better when the tester is: Male/Female�. The results (online Appen-
dix Table F2) indicate that roughly 40 percent of participants expect student
performance to be in�uenced by tester gender. Of these participants, about
two thirds expect students to perform better when assigned a tester from their
own gender. To the extent that these perceptions re�ect reality, they suggest
that the di¤erences in test outcomes that we document with respect to gender
cannot be accounted for exclusively by endogenous student behavior. If stu-
dents do in fact drive objectively better when assigned testers from their own
gender, gender out-group bias must be even stronger than when assuming �
as we have done so far �that student behavior is exogenous to the identity of
the tester.
One of the main factors that might in�uence students�objective perfor-
mance is their expectation of bias. That is, students might not drive as well
when assigned testers whom they think are biased against them. In fact, we
�nd that participants tend to believe that there is gender in-group bias in
tester subjective decisions (online Appendix F3). This is consistent with ex-
pectations of bias a¤ecting objective student performance, but not with the
patterns we observe in actual test outcomes.
When asking similar questions with respect to ethnicity, we �nd that
roughly 35 percent of participants expect student performance to be in�u-
enced by tester ethnicity (online Appendix F4). Of these participants, almost
90 percent expect students to perform better when assigned a tester from their
22
own ethnicity. Consistent with that, participants also expect ethnic in-group
bias in subjective tester decisions (online Appendix F5). These results suggest
that endogenous student behavior may account for some of the di¤erences in
test outcomes that we document with respect to ethnicity.
In an attempt to disentangle tester bias from endogenous student behavior
with respect to ethnicity, we rely on the following insight. While students
may react to the ethnicity of the tester, they are not likely to react to tester
characteristics that are not observed by them. At the same time, some of
these characteristics may in�uence tester behavior with respect to students
from di¤erent ethnic groups. A notable example for such a characteristic in
our context is whether the tester resides in an integrated locality. It is very
unlikely that a student would be able to infer during the test in which type
of locality the tester resides, but there is reason to believe that residence
in integrated localities may be correlated with views concerning Arab-Jewish
relations that in turn may in�uence test outcomes. Speci�cally, according to
the well-known �contact hypothesis� (Allport, 1954), cross-group contact �
which in the current context is inherent to residence in integrated localities �
would work to reduce prejudice.
To explore this issue, we compare outcomes in tests conducted by testers
from integrated versus non-integrated localities. Because in our data only two
Arab testers reside in integrated localities and one of the two conducted only
11 tests, we limit the analysis to the 216 Jewish testers. We start by estimating
the following basic model:
23

Passijct = �0 + �1ArabStudent i + �2TesterInt j (5)
+�3ArabStudent i � TesterInt j + �ijat
where TesterInt is an indicator for Jewish testers residing in integrated locali-
ties.7 The other variables are de�ned as before. In the next step we gradually
augment this speci�cation with the regular set of controls. Our interest is
in the coe¢ cient �3, which captures the di¤erence in outcomes for Arab stu-
dents when they are tested by Jewish testers residing in integrated rather than
non-integrated (Jewish) localities.
Results of the analysis suggest that, consistent with our original interpreta-
tion, test outcomes are signi�cantly in�uenced by the type of locality the tester
resides in: we �nd that Arab students are more likely to pass the test when
tested by Jewish testers residing in integrated rather than all-Jewish localities
(online Appendix Table G1). This result is consistent with the predictions of
the �contact hypothesis�.8
An additional test of endogenous student behavior also relates to the �con-
tact hypothesis�. If student behavior is endogenous, one would expect students
from integrated localities to feel more comfortable with opposite-ethnicity
7According to the Israeli Central Bureau of Statistics�de�nition, which we rely on here,an integrated locality is a locality where the share of Arabs in total population is between2 and 50 percent. There are currently 8 such localities (out of more than 1,200), includingIsrael�s three largest cities: Jerusalem, Tel Aviv and Haifa.
8Admittedly, our analysis does not completely rule out a possible role for endogenousstudent behavior. For example, it is possible that Jewish testers from integrated localitiesbehave in a way that makes Arab students feel more comfortable during the test. In ourview, this also constitutes a form of tester bias.
24
testers than students from non-integrated localities. Our measure of ethnic
in-group bias should therefore be smaller for students from integrated locali-
ties. The analysis presented in online Appendix Table G2 indicates that this
is not the case.
In sum, the analyses concerning endogenous student behavior suggest that
(1) our estimate of gender out-group bias may be downward biased and (2)
our estimate of ethnic in-group bias re�ects, at least in part, subjective tester
decisions rather than endogenous student behavior.
5.1.2 Language barriers?
Driving tests are conducted in Hebrew. This might generate di¢ culties in
communication between testers and students who do not share the same native
language. We believe that this is not a major concern. First, given that all
testers pass a rigorous training and selection process in Hebrew, Arab testers
must speak the language �uently. While Arab students may not be as �uent in
Hebrew as Arab testers, given the simplicity of driving instructions provided
by the testers, this is not likely to create a serious barrier.9 Second, one
would expect students residing in integrated localities to be more �uent in
the opposite-ethnicity language than students from segregated localities. If
language barriers were important, we would thus expect a smaller estimate of
ethnic in-group bias in tests performed by students from integrated localities.
The analysis presented in online Appendix Table G2 indicates that this is not
9In fact, from our conversations with the head of the MOT�s licensing division, we learnedthat language di¢ culties were never mentioned in an appeal on test outcome submitted bya student.
25

the case. Third, in Section 6 we show that the extent of ethnic bias in driving
tests varies over time. Since language barriers between Jews and Arabs are
stable, they cannot account for this variation.
5.1.3 Bias or the in�uence of other tester characteristics?
As documented in online Appendix Table C2, Arab testers di¤er from their
Jewish colleagues in their characteristics (for example, Arab testers are on av-
erage 5 years younger). This may confound interpretation of the results if, for
example, regardless of tester ethnicity, older testers treat Arab students dif-
ferently than their younger colleagues. We address this concern by adding to
equation (2) interactions between the ArabStudent indicator and tester char-
acteristics other than ethnicity. Results are in online Appendix Table G3.
To facilitate comparison, in column 1 we replicate the results from column
5 of Table 2. Columns 2 to 4 show that two out of the three additional inter-
action terms are statistically insigni�cant. More importantly, the estimate of
ethnic in-group bias maintains its size and statistical signi�cance. This pattern
remains when including in the regression all the interactions simultaneously
(column 5).
We perform an analogous exercise to rule out the possibility that our esti-
mate of gender out-group bias is driven by di¤erences in mean characteristics
between male and female testers (for example, female testers are on average 6
years younger than male testers). Results, presented in online Appendix Table
G4, show that the estimate of gender out-group bias maintains its approximate
size and remains statistically signi�cant throughout.
26
5.2 Robustness
We next provide several tests for the robustness of our results. One concern
might be that the results are driven by a single tester or a single test center. To
address this concern, we repeatedly estimate equation (4), each time dropping
one tester or one test center. Our estimates of ethnic bias and gender bias
barely change (the estimate of ethnic bias varies between 0.048 and 0.068, and
the estimate of gender bias varies between -0.047 and -0.037. In all cases the
estimates remain highly statistically signi�cant).
Online Appendix Figures H1 and H2 further illustrate that there are no in-
dividual testers whose biases are particularly notable. Online Appendix Figure
H1 displays the coe¢ cient for ArabStudent obtained when regressing, for each
tester separately, test outcome on an ArabStudent indicator and the regular set
of controls. Testers are ordered from left to right based on the size of the coef-
�cient. The �gure illustrates that the value of the coe¢ cient varies smoothly
across testers, with Arab testers concentrated on the right side. Online Ap-
pendix Figure H2 similarly shows that the coe¢ cient for FemaleStudent varies
smoothly across testers, with female testers concentrated on the left side.
As detailed in online Appendix B, to identify the ethnicity of both students
and testers, we �rst rely on names and then on place of residence. We identify
a name as Arab if it is at least twice as popular among Arabs than it is among
Jews, and as Jewish if it is at least twice as popular among Jews than it is
among Arabs. We conduct two robustness checks of this procedure. In the
�rst, we replicate the analysis of ethnic bias (column 5 of Table 2) using a
stricter criterion: we identify a name as Arab (Jewish) if it is at least three
27
times as popular among Arabs (Jews) than it is among Jews (Arabs). In the
second check, we identify ethnicity �rst by place of residence and then by
name. Results are robust to both changes (online Appendix Table H1).
Students�performance in the test may re�ect di¤erences in teaching styles
and other characteristics of driving teachers. To control for these di¤erences,
we augment equation (4) with a driving teacher �xed-e¤ect (the driving teacher
identi�er is missing for about 90,000 tests). Adding these �xed-e¤ects raises
the explanatory power of the regression by about a third, but does not a¤ect
the coe¢ cients of interest (online Appendix Table H2).
The performance of students in the test may obviously also depend on a
host of unobserved student characteristics (e.g. visual perception). To control
for such factors, we leverage the fact that many students need to take more
than one test to obtain their driving license and add student �xed-e¤ects to
equation (4). In this analysis, identi�cation of ethnic bias comes from students
who were tested by testers from di¤erent ethnic groups (these students took
about half a million tests) and identi�cation of gender bias comes from students
who were tested by testers from di¤erent genders (these students took about
600 thousand tests). Results are presented in online Appendix Table H3. We
�nd that the addition of student �xed-e¤ects has no material in�uence on our
estimates of ethnic and gender bias.
28

6 Interpretation
In this section we examine possible sources for the observed biases. Like most
of the literature in economics, we focus on the distinction between the two
leading models of discrimination: statistical and taste-based.10
6.1 Statistical discrimination
Statistical discrimination means that when assessing attributes of speci�c
agents from di¤erent groups, decision makers take into account cross-group
di¤erences in the distributions of those attributes. The canonical example
of statistical discrimination describes a hiring situation in which an employer
uses information about di¤erences in the average productivity levels of di¤er-
ent racial groups when evaluating individual job candidates from these groups.
In the current context, statistical discrimination would imply that when eval-
uating the driving abilities of individual students, testers might be in�uenced
by perceptions regarding the driving skills of, for example, Arab versus Jewish
students.
We argue that in-group bias and out-group bias are inconsistent with clas-
sical models of statistical discrimination. This is because these models are
based on rational and accurate inference and assume no cross-evaluator vari-
ation in statistical perceptions. In our context, classical models of statistical
discrimination would assume, for example, that Arab and Jewish testers have10For reviews of the empirical literature that tries to distinguish between the di¤erent
models see Guryan and Charles (2013), Rich (2014), Bertrand and Du�o (2017) and Neu-mark (forthcoming). Recent examples from this literature include Agan and Starr (2018),Bar and Zussman (2017), Edelman, Luca, and Svirsky (2017), Glover, Pallais, and Pariente(2017) and Hedegaard and Tyran (2018).
29
the same statistical perceptions concerning the driving abilities of Arab and
Jewish students, ruling out the patterns we observe in the data.
Several analyses provide empirical support for the claim that the observed
biases are not driven by statistical discrimination.
6.1.1 Tester experience and bias
The �rst test relies on the assumption that the ability to accurately assess
the driving skills of students increases with tester experience. This implies
that the need to rely on perceptions of group averages �i.e. to statistically
discriminate �would be diminished for more experienced testers.11
In online Appendix Table I1 we test this hypothesis. Since our dataset
does not contain information about experience (or tenure), we use age as
a proxy. Assuming that all testers start working around the same age and
perform a similar number of tests per year, age should be a good proxy for
experience. For the sake of comparison, column 1 replicates the results from
estimating equation (4). In column 2 we add interactions between tester age
and the following variables: ArabStudent, ArabTester and the interaction term
ArabStudent�ArabTester. In column 3 we redo this analysis using interactions
between tester age and the variables FemaleStudent, FemaleTester and the
interaction term FemaleStudent�FemaleTester. Column 4 includes both sets of
interactions simultaneously. The results suggest that neither ethnic nor gender
bias diminishes with tester experience (although given that the coe¢ cients of
interest are not tightly estimated, we cannot rule out this possibility).
11For a similar argument �in the context of racial pro�ling by the police in the UnitedStates �see Antonovics and Knight (2009).
30
We further explore the association between bias and experience by focusing
on the 86 testers whom we observe for the �rst time in the dataset in 2007
or later. The advantage of focusing on these testers is that, in all likelihood,
they became testers only then and thus we can measure their exact tenure on
the job. In online Appendix Table I2 we examine whether bias decreases after
the tester�s �rst year on the job by replicating the analysis described in the
previous paragraph, but replacing age with an indicator for �tenured�testers
�those who have more than one year of experience. Results indicate that bias
does not decrease with tenure (similar results are obtained when using two
years instead of one as the tenure cuto¤).
One may argue that bias toward students from a certain group may decline
not with overall tester experience but with tester experience with members of
this group (for an argument along these lines, see Cornell and Welch (1996)).
In our context, this possibility is especially relevant for Jewish testers, some
of whom test Arab students infrequently. To explore this possibility, we focus
on the 72 Jewish testers who started working since 2007 and compute for each
of them and for each test the cumulative number of tests performed by all
students, by Jewish students and by Arab students. Results suggest that both
overall tester experience and tester experience with speci�c groups are not
associated with the extent of ethnic bias (online Appendix Table I3).
6.1.2 Statistical perceptions and bias
In this sub-section, we report what is, to our knowledge, one of the �rst at-
tempts to directly examine the association between professional evaluators�
31
statistical perceptions and their actual decision making in a real life context.
With the aid of the MOT, we carried out a survey of testers (online Ap-
pendix J contains the text of the survey).The �rst part of the survey focused
on socio-demographic characteristics of the testers (see online Appendix Ta-
ble J1). In the second part, we asked the testers about di¤erent factors that
may in�uence test outcomes. The key question was the following: �we ask
you to evaluate, based on your own experience as a driving tester, the average
driving skills exhibited during the test by students from di¤erent groups. For
each group, please indicate a number between 0 and 10, where 0 refers to very
poor driving skills and 10 refers to excellent driving skills�. The testers were
asked to provide this mark for each of the following four groups of students:
Jewish males, Arab males, Jewish females and Arab females. The 17 testers
who answered this question ranked the driving skills of Jewish males most
highly (6.82 on average), followed by Arab males (6.76), Jewish females (6.65)
and Arab females (5.59).
To examine whether these statistical perceptions are associated with actual
decision making, we merged the survey responses with data on the roughly
300 thousand tests conducted by the testers who participated in the survey.
Using Jewish male students as the baseline group, we explored whether tester
perceptions regarding the relative driving skills of other groups (e.g. Jewish
females) are associated with actual relative test outcomes of members of these
groups. We �nd that cross-tester variation in statistical perceptions is not
signi�cantly correlated with di¤erential test outcomes across groups of students
(online Appendix Table J2). However, standard errors are large, so we cannot
32
reject that statistical perceptions have some e¤ect on test outcomes.
While the number of survey participants is small and their stated beliefs
may not re�ect their actual beliefs, we think that the results of this exercise
are revealing. They cast further doubt on the possibility that the patterns we
observe in the data are driven by statistical discrimination.12
6.2 Taste-based discrimination
The leading alternative to statistical discrimination is Becker�s taste-based dis-
crimination model. The key element in this model is that some agents incur
di¤erent levels of utility from contact with members of di¤erent groups. Re-
turning to the canonical hiring situation described above, a white employer
facing two equally-productive job candidates, one black and the other white,
would prefer to hire the latter because he incurs a disutility from interacting
with the former. As noted in the introduction, in his 1957 book The Eco-
nomics of Discrimination, Becker mentioned gender discrimination only in
passing. Using the Beckerian logic, however, would naturally imply that a
male employer facing two equally-productive job candidates, one female and
the other male, might prefer to hire the former because he derives utility from
interacting with her.
We argue that our results of ethnic in-group bias and gender out-group12In the traditional models of statistical discrimination that we focus on, there are di¤er-
ences in the expected quality of applicants of each group, but not in the information whichis available to evaluators of di¤erent groups. Alternative models of statistical discrimination(e.g. Cornell and Welch, 1996), allow evaluators to observe more accurately the quality ofapplicants of their own group. This might generate either an in-group bias or an out-groupbias, depending on how selective is the context.An additional alternative �statistical� theory is that evaluators di¤er in their objective
functions: it might be that not everybody agrees on what �good driving´ means.
33
bias in driving tests are consistent with such a utility-based model: testers
are more likely to pass students whose company they enjoy. We provide three
pieces of evidence as further support for this interpretation. The �rst two
focus on ethnic bias while the third focuses on gender bias.
6.2.1 Prejudice and bias
The �rst piece of evidence supporting a utility-based interpretation relates
variation in the extent of bias in driving tests to measures of prejudice. We
focus on ethnic bias and capitalize on the fact that inter-ethnic relations in
Israel vary considerably over space and time. To measure prejudicial attitudes,
we follow the approach taken by Charles and Guryan (2008). Using US data
on wages and on attitudes �the latter taken from the General Social Survey �
they provide evidence consistent with Becker�s employer discrimination model.
Speci�cally, Charles and Guryan (2008) show that the black-white wage gap is
larger in areas characterized by stronger prejudicial views (or racial animus).
Their main measure of such views is the extent of public support for laws
banning inter-racial marriages.
In Israel, no o¢ cial survey asks questions of this sort. However, Zussman
(2013) conducted a large scale survey to measure the attitudes of Jews towards
Israeli Arabs. Among other things, the survey asked participants to report
their degree of support for laws banning inter-ethnic marriages. The survey
spanned the period from August 2009 to April 2011 and included about 3,600
participants. Our measure of ethnic bias is thus the share of participants who
support (strongly or otherwise) a ban on inter-ethnic marriages.
34
To conduct the spatial analysis, we �rst assign to each test the sub-district
in which the tester performing it resides. We then run equation (2) separately
for each sub-district (the analysis is limited to the seven out of �fteen sub-
districts that have testers and students from both ethnic groups). In Figure
3 we plot the estimated bias in driving tests against the share supporting
a ban on inter-ethnic marriages in each sub-district. We �nd that ethnic
bias is positively (although insigni�cantly) correlated with prejudicial attitudes
(r = 0:63).
[Figure 3]
To measure temporal variation in ethnic bias, we apply a rolling regression
technique. Speci�cally, we estimate equation (2) using moving seven-quarter
windows.13 Figure 4 shows the estimated coe¢ cients together with 95 percent
con�dence intervals. Ethnic bias varies considerably over time but is always
positive and statistically signi�cant.
[Figure 4]
For the seven quarters for which we have the survey data, Figure 5 plots
ethnic bias in driving tests against the share supporting a marriage ban.
Consistent with the hypothesis that bias is driven by prejudice, the associ-
ation between the two variables is positive and highly statistically signi�cant
13To illustrate, the regression centered on quarter t covers tests conducted from quartert�3 through quarter t+3; the following regressions are centered around quarters t+1, t+2etcetera. We note that at the beginning and at the end of the period analyzed, windows areby necessity shorter than seven quarters.
35
(r = 0:85).14
[Figure 5]
6.2.2 Physical proximity
In the context we study, testers sit next to students in the car and inter-
act with them. Our claim is that this interaction might a¤ect test outcomes
by in�uencing, either consciously or unconsciously, the utility enjoyed by the
tester during the test. In particular, we argue that testers reward members of
groups whose company they enjoy, i.e. members from their own ethnic group
and from the opposite gender.
If indeed bias is driven by the di¤erent levels of utility testers derive from
the company of members of di¤erent groups, it seems natural to assume that
this e¤ect would depend on the physical distance between testers and students.
Speci�cally, we argue that the (relative) disutility incurred by testers from
being in the company of members of a �disliked� group would decline with
physical distance.15
To test this hypothesis, we replicate our analysis of bias using data on mo-
torcycle tests. The institutional context of motorcycle tests is almost identical
14Following Shayo and Zussman (2011), it may seem natural to leverage spatial andtemporal variation in fatalities from Palestinian terrorism to estimate the e¤ect of inter-ethnic tensions on the extent of bias in driving tests. Using this approach is not feasiblein the current context, however, because the period analyzed here was characterized by fewsuch fatalities.15In a recent paper, Edelman, Luca, and Svirsky (2017) study racial discrimination in
Airbnb, a popular online marketplace for short-term rentals. Among other things, theyexplore how proximity between host and guest a¤ects discrimination by comparing the racegap exhibited by hosts who o¤er entire units and those who o¤er shared properties (a roomwithin a unit or a shared room). They �nd that the race gap is roughly the same whetheror not the property is shared.
36
to that of private vehicle tests (online Appendix K provides details about the
institutional context, summary statistics and balancing checks). Importantly,
as in the case of private vehicle tests, testers are not able to choose whom to
test and students are not able to choose whom to be tested by. The key di¤er-
ence between the two types of tests is that in motorcycle tests, the student and
the tester drive di¤erent vehicles and are thus not in close proximity.16 Since
there is only one female tester conducting motorcycle tests, we focus again on
ethnic bias.
In Appendix Table K5 we compare the extent of bias in private vehicle tests
and in motorcycle tests. Column 1 replicates the results obtained previously
from estimating equation (2) for private vehicle tests (column 5 of Table 4).
It is important to note that some testers conduct only private vehicle tests
while others conduct both private vehicle tests and motorcycle tests (i.e. none
of the testers conduct only motorcycle tests). To make sure that we compare
the extent of bias across vehicle types for the same group of testers, in column
2 we restrict the analysis of ethnic bias in private vehicle tests to the 70
testers who conducted both types of tests. The estimated bias is slightly
smaller than that estimated for all testers (4.7 vs. 5.7 percentage points) but
is still highly signi�cant. Column 3 shows the results from estimating bias in
motorcycle tests. Consistent with the physical proximity hypothesis, we do
not �nd evidence of ethnic in-group bias in motorcycle tests.17
16An additional di¤erence is that in motorcycle tests testers and students wear helmets,thus further lowering the salience of ethnicity.17However, given that only 3 of the 70 testers who conducted both types of tests are Arab,
this result should be taken with a grain of salt. To overcome this di¢ culty, we focus on the53 Jewish testers who conducted at least 100 tests of each of the four student ethnicity xvehicle type combinations and regress, for each separately, test outcome on an ArabStudent
37
6.2.3 Salience of gender identity
As noted in the introduction, while our result of ethnic in-group bias is in
line with the typical �nding in the relevant literature, to our knowledge, this
paper is the �rst to provide evidence of what seems to be taste-based gender
out-group bias in evaluations made by professional decision makers operating
under a strong non-discriminatory norm. One simple and intuitive mechanism
that may account for this pattern is physical attraction between members
of di¤erent genders. If this mechanism is indeed at play, one might expect
students to react to it. Speci�cally, since most driving testers are male, female
students may stand to bene�t from emphasizing their gender identity. Indeed,
the belief that such behavior exists is considered �conventional wisdom� in
Israel. In fact, our informal conversations with MOT o¢ cials reveal that they
too believe that female students emphasize their gender identity and that this
a¤ects testers�decisions.
Empirical evidence supporting the existence of such behavior comes from
our survey of public perceptions regarding the determinants of driving test out-
comes (online Appendix F). To minimize demand e¤ects, we �rst addressed
the issue of possible manipulation of gender identity by asking survey par-
ticipants the following general open-ended question: �In your opinion, do
students attempt to in�uence the tester�s subjective pass/fail decision? If
so, please specify examples for how this is done.�More than 40 percent of
indicator and the regular set of controls. We �nd evidence of bias (i.e. a negative andsigni�cant coe¢ cient on the Arab student indicator) for 34 testers when examining privatevehicle tests but only for 16 testers when focusing on motorcycle tests. This provides furthersupport for the claim that physical proximity matters for bias.
38
participants thought that students attempt to in�uence testers�subjective de-
cisions. Among these participants, the most popular response was that female
students do so by increasing the salience of gender identity, e.g. by dressing
provocatively or wearing make-up.
The next question in the survey speci�cally asked participants whether
they agree with the following statement �There is a claim that since most
driving testers are male, some female students emphasize their gender identity
(e.g. by dressing provocatively) in order to increase their likelihood of passing
the test.� About 82 percent of male participants and 72 percent of female
participants agreed with this statement.
Increasing the salience of gender identity in such a way could possibly
improve the likelihood of passing the test by a¤ecting testers�subjective de-
cisions, by improving objective performance (e.g. by raising self con�dence)
or both. It is also possible that this behavior has no e¤ect on test outcomes.
We asked participants who thought that female students increase the salience
of their gender identity to choose one of these possibilities. About 30 percent
chose the last option, i.e. believed that the manipulation of gender identity is
futile. Of the rest, 90 percent thought that the manipulation works exclusively
by in�uencing testers�subjective decisions.
In sum, both anecdotal and survey evidence suggest that some students
emphasize their gender identity and that this a¤ects testers�decisions. This,
in turn, implies that physical attraction may play a role in generating the
observed gender out-group bias.
39
7 Conclusion
This paper studies the role of identity in the evaluation of others. The analysis
utilizes data on the universe of practical driving tests conducted in Israel
between 2006 and 2015 and leverages the e¤ectively random assignment of
testers and students to tests. The context we study not only facilitates credible
identi�cation of bias but also allows us to tease out the role of tastes in decision
making.
The key contribution of this paper to the literature on discrimination and
bias rests on these advantages and on the fact that we study ethnic and gender
bias simultaneously. We �nd evidence of both ethnic in-group bias and gender
out-group bias: a student is 14 percent more likely to pass a test when assigned
a tester from the same ethnic group and 11 percent more likely to pass a test
when assigned a tester from the opposite gender.
The result of ethnic in-group bias is in line with the typical �nding in
the relevant literature. However, while intuitive, to our knowledge, this pa-
per is the �rst to provide evidence of gender out-group bias in evaluations
made by individual professional decision makers operating under a strong non-
discriminatory norm. Admittedly, the context we study di¤ers in various ways
from the ones economists typically focus on. Nevertheless, it stands to reason
that the utility considerations we highlight are present in many everyday inter-
actions and may in�uence evaluation decisions, including in purely economic
contexts.
40
8 References
Abrevaya, Jason, and Daniel S. Hamermesh. 2012. �Charity and Fa-
voritism in the Field: Are Female Economists Nicer (to Each Other)?�Review
of Economics and Statistics, 94(1): 202�207.
Agan, Amanda and Sonja Starr. 2018. �Ban the Box, Criminal
Records, and Racial Discrimination: A Field Experiment.�Quarterly Jour-
nal of Economics, 133(1): 191�235.
Allport, Gordon W. 1954. The Nature of Prejudice. MA: Addison-
Wesley.
Antonovics, Kate, and Brian G. Knight. 2009. �A New Look at
Racial Pro�ling: Evidence from the Boston Police Department.�Review of
Economics and Statistics, 91(1): 163-177.
Anwar, Shamena, Patrick Bayer, and Randi Hjalmarsson. 2012.
�The Impact of Jury Race in Criminal Trials.� Quarterly Journal of Eco-
nomics, 127(2): 1017-1055.
Anwar, Shamena, and Hanming Fang. 2006. �An Alternative Test of
Racial Prejudice in Motor Vehicle Searches: Theory and Evidence.�American
Economic Review, 96(1): 127-151.
Arrow, Kenneth J. 1972. �Some Mathematical Models of Race in the
Labor Market.�In Racial Discrimination in Economic Life, ed. Anthony H.
Pascal, 187-204. Lexington, MA: Lexington Books.
Bagues, Manuel F., and Berta Esteve-Volart. 2010. �Can Gen-
der Parity Break the Glass Ceiling? Evidence from a Repeated Randomized
Experiment.�Review of Economic Studies, 77(4): 1301-1328.
41
Bagues, Manuel, Mauro Sylos-Labini, and Natalia Zinovyeva.
2017. �Does the Gender Composition of Scienti�c Committees Matter?�Amer-
ican Economic Review, 107(4): 1207-1238.
Bar, Revital, and Asaf Zussman. 2017. �Customer Discrimination:
Evidence from Israel.�Journal of Labor Economics, 35(4): 1031-1059.
Bar, Talia, and Asaf Zussman. 2012. �Partisan Grading.�American
Economic Journal: Applied Economics, 4(1): 30-48.
Beck, Thorsten, Patrick Behr, and Andreas Madestam. Forthcom-
ing. �Sex and Credit: Is there a Gender Bias in Lending?�Journal of Banking
and Finance.
Becker, Gary S. 1957. The Economics of Discrimination. Chicago: The
University of Chicago Press.
Bertrand, Marianne, and Esther Du�o. 2017. �Field Experiments
on Discrimination.� In Handbook of Field Experiments, Vol. 1, eds. Abhijit
V. Banerjee and Esther Du�o, 309-394. Amsterdam: North-Holland.
Boring, Anne. 2017. �Gender Biases in Student Evaluations of Teach-
ing.�Journal of Public Economics, 145: 27-41.
Charles, Kerwin K., and Jonathan Guryan. 2008. �Prejudice and
Wages: An Empirical Assessment of Becker�s The Economics of Discrimina-
tion.�Journal of Political Economy, 116(5): 773-809.
Cornell, Bradford, and Ivo Welch. 1996. �Culture, Information, and
Screening Discrimination.�Journal of Political Economy, 104(3): 542-571.
Dee, Thomas S. 2005. �A Teacher Like Me: Does Race, Ethnicity, or
Gender Matter?.�American Economic Review, 95(2): 158-165.
42
Depew, Briggs, Ozkan Eren, and Naci Mocan. Forthcoming. �Judges,
Juveniles and In-group Bias.�Journal of Law and Economics.
Edelman, Benjamin, Michael Luca, and Dan Svirsky. 2017. �Racial
Discrimination in the Sharing Economy: Evidence from a Field Experiment.�
American Economic Journal: Applied Economics, 9(2): 1-22.
Feld, Jan, Nicolas Salamanca, and Daniel S. Hamermesh. 2016.
�Endophilia or Exophobia: Beyond Discrimination.�Economic Journal, 126(594):
1503-1527.
Fisman, Raymond, Daniel Paravisini, and Vikrant Vig. 2017.
�Cultural Proximity and Loan Outcomes.�American Economic Review, 107(2):
457�492.
Glover, Dylan, Amanda Pallais, and William Pariente. 2017.
�Discrimination as a Self-Ful�lling Prophecy: Evidence from French Grocery
Stores.�Quarterly Journal of Economics, 132 (3): 1219-1260.
Guryan, Jonathan, and Kerwin K. Charles. 2013. �Taste-based or
Statistical Discrimination: The Economics of Discrimination Returns to its
Roots.�Economic Journal, 123(572): F417-F432.
Hedegaard, Morten Størling, and Jean-Robert Tyran. 2018. �The
Price of Prejudice.�American Economic Journal: Applied Economics, 10(1):
40-63.
Hjort, Jonas. 2014. �Ethnic Divisions and Production in Firms.�Quar-
terly Journal of Economics, 129(4): 1899-1946.
Jannati, Sima, Alok Kumar, Alexandra Niessen-Ruenzi, and Justin
Wolfers. 2016. �In-Group Bias in Financial Markets.�Working paper.
43
Mengel, Friederike, Jan Sauermann, and Ulf Zolitz. Forthcoming.
�Gender Bias in Teaching Evaluations.� Journal of the European Economic
Association.
Neumark, David. Forthcoming. �Experimental Research on Labor Mar-
ket Discrimination.�Journal of Economic Literature.
Parsons, Christopher A., Johan Sulaeman, Michael C. Yates, and
Daniel S. Hamermesh. 2011. �Strike Three: Discrimination, Incentives,
and Evaluation.�American Economic Review, 101(4): 1410-1435.
Phelps, Edmund S. 1972. �The Statistical Theory of Racism and Sex-
ism.�American Economic Review, 62(4): 659-661.
Price, Joseph, and Justin Wolfers. 2010. �Racial Discrimination
among NBA Referees.�Quarterly Journal of Economics, 125(4): 1859-1887.
Rich, Judith. 2014. �What Do Field Experiments of Discrimination in
Markets Tell Us? A Meta-Analysis of Studies Conducted Since 2000.� IZA,
Discussion Paper no. 8584.
Sandberg, Anna. Forthcoming. �Competing Identities: A Field Study
of In-Group Bias Among Professional Evaluators.�Economic Journal.
Shayo, Moses, and Asaf Zussman. 2011. �Judicial Ingroup Bias in the
Shadow of Terrorism.�Quarterly Journal of Economics, 126(3): 1447-1484.
Shayo, Moses, and Asaf Zussman. 2017. �Con�ict and the Persistence
of Ethnic Bias.�American Economic Journal: Applied Economics, 9(4): 137-
165.
West, Jeremy. 2016. �Racial Bias in Police Investigations.�Working
Paper.
44

Zussman, Asaf. 2013. �Ethnic Discrimination: Lessons from the Israeli
Online Market for Used Cars.�Economic Journal, 123(572): F433�F468.
45
46
Table 1 Ethnic and Gender Distribution of Driving Tests, by Region
Panel A: Tester and Student Ethnicity
Region Number of test centers
Tester: Student:
Jewish Jewish
Jewish Arab
Arab Jewish
Arab Arab Tests
Tel Aviv and Center 14 80.09 15.34 3.10 1.48 1,072,687 Haifa and North 14 42.02 43.47 6.75 7.75 820,404 Be'er Sheba and the Negev 10 74.15 22.54 2.58 0.74 221,382 Jerusalem and South 5 76.26 23.03 0.53 0.18 501,448 Countrywide 43 66.91 26.24 3.71 3.13 2,615,921
Panel B: Tester and Student Gender
Region Number of test centers
Tester: Student:
Male Male
Male Female
Female Male
Female Female Tests
Tel Aviv and Center 14 41.54 47.88 4.92 5.66 1,072,687
Haifa and North 14 36.68 55.06 3.31 4.96 820,404
Be'er Sheba and the Negev 10 44.42 52.66 1.30 1.62 221,382 Jerusalem and South 5 45.29 50.29 2.10 2.32 501,448
Countrywide 43 40.98 51.00 3.57 4.46 2,615,921 Source: Israeli Ministry of Transport and Road Safety (MOT). Notes: The table shows, for each MOT region, the share (in %) of driving tests in each combination of student and tester ethnicities (panel A) and genders (panel B).
47
Table 2 Ethnic Bias
Dependent Variable: Test Outcome (Pass=1) (1) (2) (3) (4) (5)
Arab student -0.098*** -0.054*** -0.035*** -0.035*** -0.034*** (0.007) (0.004) (0.004) (0.004) (0.004)
Arab tester -0.089*** -0.037*** -0.037*** -0.021 (0.019) (0.013) (0.013) (0.014)
Arab student x Arab tester 0.092*** 0.069*** 0.067*** 0.066*** 0.057*** (0.014) (0.011) (0.011) (0.011) (0.012)
Test center x test date fixed effects No Yes Yes Yes Yes Student characteristics No No Yes Yes Yes Tester characteristics No No No Yes Yes Tester fixed effects No No No No Yes Observations 2,615,921 2,615,921 2,615,921 2,615,921 2,615,921 R-squared 0.009 0.094 0.105 0.109 0.129 Source: Israeli Ministry of Transport and Road Safety. Notes: Student characteristics include a female indicator, age, current driving test number and number of theory tests. Tester characteristics include a female indicator (columns 1-4), age and total number of same day tests. Estimated using OLS. Standard errors, clustered by tester, are in parentheses. *, **, *** represent statistical significance at the 10%, 5%, and 1% levels.
48
Table 3 Gender Bias
Dependent Variable: Test Outcome (Pass=1) (1) (2) (3) (4) (5)
Female student -0.083*** -0.072*** -0.073*** -0.073*** -0.073*** (0.006) (0.006) (0.006) (0.006) (0.006)
Female tester 0.007 0.006 0.006 0.023 (0.037) (0.024) (0.024) (0.023)
Female student x Female tester -0.045*** -0.043*** -0.043*** -0.044*** -0.042*** (0.014) (0.012) (0.012) (0.012) (0.012)
Test center x test date fixed effects No Yes Yes Yes Yes Student characteristics No No Yes Yes Yes Tester characteristics No No No Yes Yes Tester fixed effects No No No No Yes Observations 2,615,921 2,615,921 2,615,921 2,615,921 2,615,921 R-squared 0.008 0.098 0.105 0.109 0.129 Source: Israeli Ministry of Transport and Road Safety. Notes: Student characteristics include an Arab indicator, age, current driving test number and number of theory tests. Tester characteristics include an Arab indicator (columns 1-4), age and total number of same day tests. Estimated using OLS. Standard errors, clustered by tester, are in parentheses. *, **, *** represent statistical significance at the 10%, 5%, and 1% levels.
49
Table 4 Ethnic and Gender Biases
Dependent Variable: Test Outcome (Pass=1) (1) (2) (3) (4) (5)
Arab student x Arab tester 0.090*** 0.067*** 0.067*** 0.065*** 0.057*** (0.014) (0.011) (0.011) (0.011) (0.012)
Female student x Female tester -0.046*** -0.043*** -0.043*** -0.044*** -0.042*** (0.014) (0.012) (0.012) (0.012) (0.012)
Test center x test date fixed effects No Yes Yes Yes Yes Student characteristics No No Yes Yes Yes Tester characteristics No No No Yes Yes Tester fixed effects No No No No Yes Observations 2,615,921 2,615,921 2,615,921 2,615,921 2,615,921 R-squared 0.015 0.099 0.105 0.109 0.130 Source: Israeli Ministry of Transport and Road Safety. Notes: Student characteristics include a female indicator, an Arab indicator, age, current driving test number and number of theory tests. Tester characteristics include a female indicator (columns 1-4), an Arab indicator (columns 1-4), age and total number of same day tests. Estimated using OLS. Standard errors, clustered by tester, are in parentheses. *, **, *** represent statistical significance at the 10%, 5%, and 1% levels.
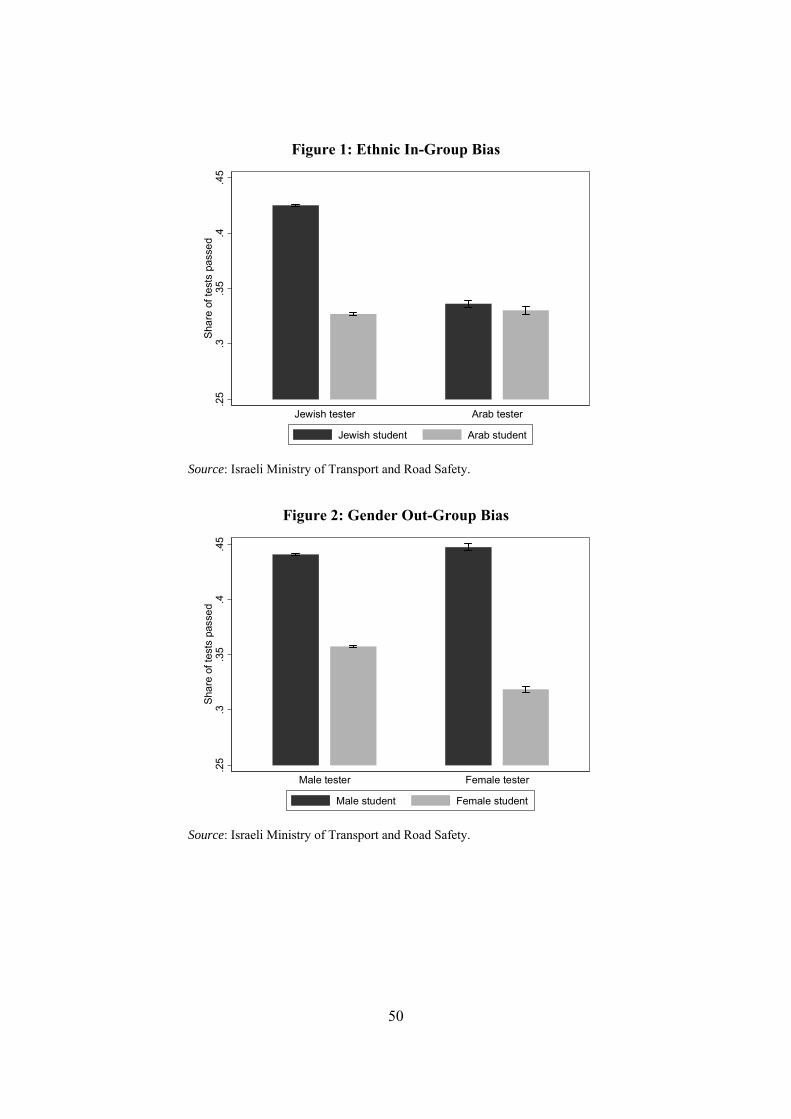
50
Figure 1: Ethnic In-Group Bias
Source: Israeli Ministry of Transport and Road Safety.
Figure 2: Gender Out-Group Bias
Source: Israeli Ministry of Transport and Road Safety.
.25
.3.3
5.4
.45
Sha
re o
f tes
ts p
asse
d
Jewish tester Arab tester
Jewish student Arab student
.25
.3.3
5.4
.45
Sha
re o
f tes
ts p
asse
d
Male tester Female tester
Male student Female student
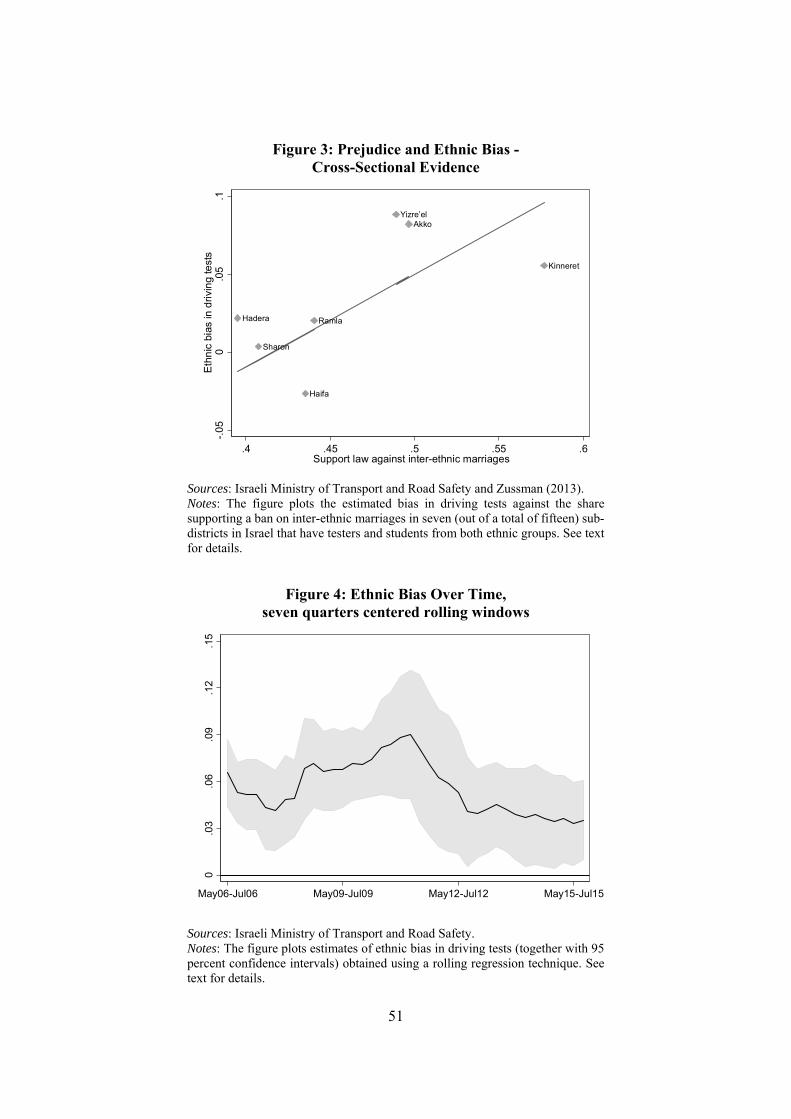
51
Figure 3: Prejudice and Ethnic Bias - Cross-Sectional Evidence
Sources: Israeli Ministry of Transport and Road Safety and Zussman (2013). Notes: The figure plots the estimated bias in driving tests against the share supporting a ban on inter-ethnic marriages in seven (out of a total of fifteen) sub-districts in Israel that have testers and students from both ethnic groups. See text for details.
Figure 4: Ethnic Bias Over Time, seven quarters centered rolling windows
Sources: Israeli Ministry of Transport and Road Safety. Notes: The figure plots estimates of ethnic bias in driving tests (together with 95 percent confidence intervals) obtained using a rolling regression technique. See text for details.
Kinneret
Yizre’elAkko
Haifa
Hadera
Sharon
Ramla
-.05
0.0
5.1
Eth
nic
bia
s in
dri
vin
g te
sts
.4 .45 .5 .55 .6Support law against inter-ethnic marriages
0.0
3.0
6.0
9.1
2.1
5
May06-Jul06 May09-Jul09 May12-Jul12 May15-Jul15
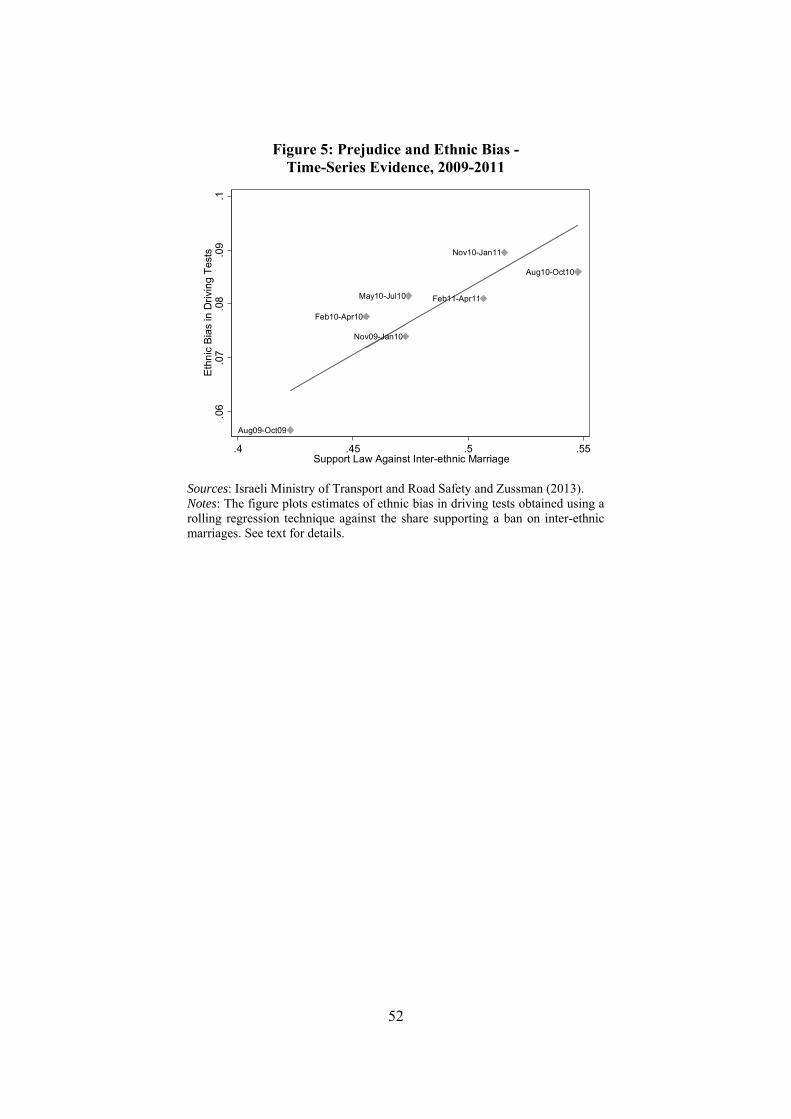
52
Figure 5: Prejudice and Ethnic Bias - Time-Series Evidence, 2009-2011
Sources: Israeli Ministry of Transport and Road Safety and Zussman (2013). Notes: The figure plots estimates of ethnic bias in driving tests obtained using a rolling regression technique against the share supporting a ban on inter-ethnic marriages. See text for details.
Aug09-Oct09
Nov09-Jan10
Feb10-Apr10
May10-Jul10
Aug10-Oct10
Nov10-Jan11
Feb11-Apr11
.06
.07
.08
.09
.1E
thn
ic B
ias
in D
rivi
ng T
ests
.4 .45 .5 .55Support Law Against Inter-ethnic Marriage
1
ONLINE APPENDIX
Identity and Bias: Insights from Driving Tests
Revital Bar and Asaf Zussman

2
Appendix A: Driving Tests in Israel – Institutional Details
This appendix describes in detail the institutional context in which driving tests are conducted, focusing on private vehicle tests.
Geographical Structure
The MOT divides the country into 4 regions: (1) Tel Aviv and Center; (2) Haifa and North; (3) Be'er Sheba and the Negev; and (4) Jerusalem and South. Each of these regions contains several testing centers; overall, there are 43 centers. Each MOT tester and each driving school – and through it each driving teacher and student – is associated with one of these regions.1
Students
The first step in the journey to obtain a driving license starts when the student arrives at an MOT‐certified facility and is issued an official form (called the “green form”). The form, which is specific to the type of driving license the student wishes to obtain (e.g. private vehicle or motorcycle), initially includes the student's photograph and personal details. Students must later have the form signed by an optometrist and a family doctor certifying that they are physically fit to drive. Students then have to pass a driving theory test and take lessons in an MOT‐certified driving school.
Students can first take the theory test when they turn 16 and 3 months old. The theory test can be taken in six different languages, including Hebrew and Arabic. The 40 minute long test is comprised of 30 multiple choice questions. Students must answer at least 26 correctly in order to pass the test. They may retake the test as many times as they need to.
When students are 16 and 6 months old, they can start taking driving lessons. Students must take at least 28 driving lessons – each lasting 40 minutes – before they can take the MOT practical driving test. This requirement may be reduced by the teacher to 20 lessons under special circumstances, e.g. in case the student already holds a driving license for a different type of vehicle. Our conversations with MOT officials indicate, however, that most students take more than the required minimum number of lessons.2
When the teacher believes that the student is prepared to take the MOT driving test, she first assigns him to an “internal test”. Internal tests are conducted by the professional manager of the driving school (driving schools usually have several teachers but may also have only one, in which case the teacher is also the manager of the school). If the student fails the internal test, he needs
1 It is important to emphasize that MOT driving tests are taken by citizens and permanent residents of Israel. This includes Israelis residing in Jewish West Bank settlements and Arab residents of East Jerusalem, but excludes Palestinians residing in the West Bank. 2 The price of one 40‐minute long driving lesson varies between NIS 100 and NIS 150 (approximately $US 30‐45).
3
to take additional driving lessons. Once the student passes the internal test, he is eligible to take the MOT driving test (the minimum age for taking the MOT driving test is 16 and 9 months). The student must be tested in the same region to which his driving school belongs.
Teachers
In order to become an MOT‐certified driving teacher, one must be at least 21 years old, have completed 12 years of education, hold a driving license for at least 3 years and have no criminal record. As a first step in the selection and training process of driving teachers, eligible candidates undergo rigorous assessment by an external human resources firm. Only about 20 percent of candidates obtain a passing score in this assessment. These candidates have to then take a practical driving test, where they are expected to exhibit outstanding driving skills. The next step is attending a 680 hours driving teacher course (this takes approximately 2 years). The vast majority of those who start the course complete it successfully and receive a driving teacher certificate from the MOT. This certificate is relevant for teaching only for a private vehicle license. Teachers who wish to teach driving for other types of licenses, need to undergo additional training.
Testers
The minimum requirements for becoming an MOT driving tester are similar to those for becoming a teacher, except that testers must be at least 25 years old. Candidates undergo assessment by the same human resources firm as teachers and, like them, also need to pass a driving test. The professional course for testers is somewhat longer than that of teachers. Certified driving teachers who want to become testers need to take a shorter version of the tester course. The MOT uses a competitive tender process to recruit the most suitable candidates out of those who have successfully completed the course. The recruitment process is region‐specific. Selected candidates undergo additional training, where they join experienced testers in conducting actual tests. Once this additional training period is over, the candidates are tested by the head tester in their region. Upon passing this last hurdle, they receive their tester certificate and can start testing.
Testers typically work 21 days per month. On weekdays (Sunday‐Thursday), testers work from 7 am to 4 pm and conduct 14 tests for private vehicle licenses. In addition, testers may elect to work on Fridays. Testers are are paid by the hour and their salary does not depend in any way on their average pass rate. Since they are government employees, it is impossible to fire them for professional reasons (they may only be fired in cases of misconduct).
4
Assignment
The assignment of testers to tests is based on computerized, region‐specific, waiting lists. Students enter these lists once they pass the theory test. Those who pass the driving test drop out of the list, while those who fail remain in it.
Before the beginning of each month, the MOT compares – for each region separately – the number of students waiting to be tested to the number of available tests (the latter figure is based on the availability of testers in that month). This yields region‐specific ratios which are then used to allocate a specific number of tests to each teacher. Thus, for example, if the region‐specific ratio is 4, a teacher in this region with 20 students in the waiting list will be allocated 5 slots. A test slot is defined by a test center, date and time. Crucially, the MOT does not inform the teachers about the identity of the tester in each slot.
The four MOT region offices construct a weekly work plan for each tester, detailing in which test centers they will work each day. For example, in a certain week, a specific tester from the Be'er Sheba and the Negev region might be assigned to work in Be'er Sheba on Sunday and Tuesday, in Netivot on Monday and in Sderot on Wednesday through Friday. These assignments are revealed to the testers a week in advance. Only when the tester shows up for work in the morning, is he provided with a work schedule for that day specifying the name of the driving school for each time slot. Under no circumstances are testers allowed to deviate from this schedule.3 With this work schedule in hand, the tester approaches a designated parking area and locates the vehicle of the specific driving school assigned to him (the name of the school appears on the car). The test vehicle is the one in which the student took his driving lessons and it belongs to the driving teacher. The identity of the student is revealed to the tester (and vice versa) only when the tester enters the car.
The main objective of the MOT assignment procedure is to make sure that testers will not be able to choose whom to test and students (and their teachers) will not be able to choose whom to be tested by. This implies that the assignment of students and testers to tests is effectively random. In other words, on a given day, within a test center, the likelihood of being assigned a tester of a certain ethnicity or gender is the same for all students. Below we use balancing tests to show that assignment is indeed effectively random.
3 The only exception occurs when a student is assigned a tester who has already failed him at least 3 times in the past. In this (extremely rare) case, the student can ask to be assigned to a different tester.
5
Tests
A test begins when the tester enters the car. On the dashboard are waiting for him the student's identification card and green form as well as a receipt for payment for the test.4 The tester fills the student's details in his daily schedule form, wishes her good luck and instructs her to start driving.
Tests are allocated between 25 and 30 minutes. During the test, testers provide students with simple driving directions (e.g. “turn left”, “continue straight ahead”); testers are forbidden from talking to students about subjects unrelated to the test. At the end of the test, after leaving the car, the tester fills out a detailed test evaluation form. The form is divided into three main sections, each containing more than a dozen criteria: (1) control of the vehicle (e.g. control of the steering wheel); (2) traffic (e.g. merging into traffic); and (3) the road (e.g. turning right or left). The tester marks only those criteria where the student demonstrated poor performance. Based on these marks, the tester decides whether the student passed or failed, writes a short explanation for the decision in the evaluation form and records the decision in the green form. The tester then returns the evaluation form and the green form to the MOT test center office. The forms are later distributed back to the teachers and, through them, to the students.
How do testers decide whether to pass or fail a student? Although testers are well trained and have detailed testing guidelines, assessing the driving skills of students based on dozens of criteria is very much subjective. Moreover, there is no official formula for aggregating the separate marks into a single outcome. Taken together, these facts imply that testers have a lot of discretion in making the pass/fail decision.5 In fact, in our data the average pass rate per tester – for testers who conducted at least 1,000 tests – varies greatly: it is 26 percent at the 5th percentile and 62 percent at the 95th percentile.6
4 Payment for the test has two components. The first is a fee paid to the MOT while the second compensates the driving teacher for the use of his vehicle in the test. During the period examined here, the total payment amounted to about $US 100. 5 We further note that students' ability to successfully appeal testers' decisions is very limited. Based on our conversations with MOT officials, only 2‐3 percent of failures are appealed, and out of these, 90 percent are rejected after a conversation between the tester who conducted the test and the regional head tester. In the remaining cases, students are allowed to retake the test with the head tester (with no additional costs to them). 6 The large variability in pass rates across testers was noted in an October 2016 report by the State Comptroller of Israel on the operation of the MOT's Licensing Division. The report recommended that measures would be taken to reduce testers' discretion and increase uniformity in pass rates.
6
Appendix B: Coding Ethnicity
To deduce the ethnicity of students and testers we use the following two‐step procedure. The first step uses first names to assign ethnicity, building on the fact that Arabs and Jews in Israel have very different naming conventions. This approach has been used in previous research dealing with ethnicity in Israel, e.g. Shayo and Zussman (2011) and Zussman (2013). Specifically, we utilize a dataset derived from the Israeli Population Registry which provides, separately for each gender, the probability that a given first name belongs to an Arab citizen. We identify a name as Arab if it is at least twice as popular among Arabs than it is among Jews, and as Jewish if it is at least twice as popular among Jews than it is among Arabs. This first step enables us to assign ethnicity to 91 percent of students and 93 percent of testers.
To assign ethnicity to the remaining students and testers, in the second step we rely on the fact that there is a very high degree of residential ethnic segregation in Israel. The population of most localities is either all‐Arab or all‐Jewish and the population of integrated localities, such as Jerusalem and Tel Aviv, is ethnically segregated by neighborhood. To code ethnicity based on place of residence, we use three datasets from the Israeli Central Bureau of Statistics. The first classifies localities as either Arab, Jewish or integrated. The second provides, for each statistical area (sub‐neighborhood), the ethnicity to which the majority of residents belong. The third maps zip codes into statistical areas.7 Thus, we first classify students and testers as Arab if they reside in Arab localities, and as Jews if they reside in Jewish localities. This assigns ethnicity to 90 percent of those whose ethnicity we were not able to ascertain using first names. We use the data on the main ethnicity in each statistical area to assign ethnicity to the remaining students and testers (who live in ethnically‐integrated localities). Overall, our two‐step procedure enables us to assign ethnicity to all testers and to 99 percent of students; the remaining students are excluded from the analysis.8
7 There are more zip codes than statistical areas. In most cases, a zip code is entirely contained in a single statistical area. In some cases, however, a zip code is divided by two statistical areas. In those cases, we follow a "majority rule": we assign the zip code to the statistical area that has most addresses. 8 The main reason we assign ethnicity first using names and only then by relying on locality and zip code is that we have the names of all students and testers while information on residence is missing for some students and testers. In sub‐section 5.2 we show that our results are robust to reversing the order of the ethnicity identification procedure.
7
Appendix C: Summary Statistics
Appendix Table C1 provides summary statistics for students. Column 1 shows means (and standard deviations) for all students while columns 2‐3 and 5‐6 provide means (and standard deviations) for different ethnic groups and genders. About 25 percent of students are Arab and roughly 50 percent are female (column 1). Students are young: the average age is about 23 (the median, not reported in the table, is 19). The average number of driving tests is 1.9 for Arab students and 1.6 for Jewish students; the corresponding figures are 1.8 for female students and 1.6 for male students. Arab students take on average 3.1 theory tests while Jewish students take only 1.9. Both male and female students take about 2.2 theory tests on average.
Summary statistics for testers are provided in Appendix Table C2. About 9 percent of testers are Arab and roughly the same share of testers is female. The average age of testers is 54, with Arab testers being 5 years younger than their Jewish colleagues; female testers are on average about 6 years younger than male testers. To capture the possibility that workload might influence testers' decisions, in the regression analyses we control for the number of tests each tester conducted on the day of the test. Testers in the different groups conduct on average between 9 and 12 tests per day.
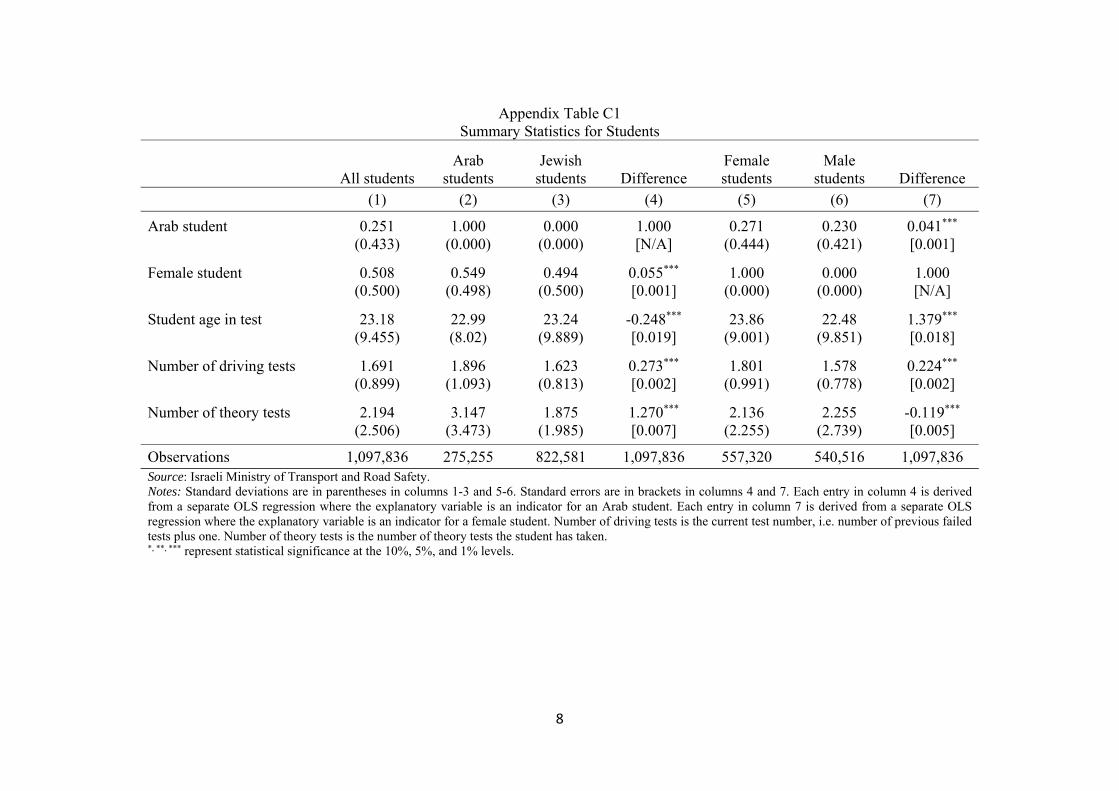
8
Appendix Table C1 Summary Statistics for Students
All students
Arab students
Jewish students Difference
Female students
Male students Difference
(1) (2) (3) (4) (5) (6) (7)
Arab student 0.251 1.000 0.000 1.000 0.271 0.230 0.041*** (0.433) (0.000) (0.000) [N/A] (0.444) (0.421) [0.001]
Female student 0.508 0.549 0.494 0.055*** 1.000 0.000 1.000 (0.500) (0.498) (0.500) [0.001] (0.000) (0.000) [N/A]
Student age in test 23.18 22.99 23.24 -0.248*** 23.86 22.48 1.379*** (9.455) (8.02) (9.889) [0.019] (9.001) (9.851) [0.018]
Number of driving tests 1.691 1.896 1.623 0.273*** 1.801 1.578 0.224*** (0.899) (1.093) (0.813) [0.002] (0.991) (0.778) [0.002]
Number of theory tests 2.194 3.147 1.875 1.270*** 2.136 2.255 -0.119*** (2.506) (3.473) (1.985) [0.007] (2.255) (2.739) [0.005]
Observations 1,097,836 275,255 822,581 1,097,836 557,320 540,516 1,097,836 Source: Israeli Ministry of Transport and Road Safety. Notes: Standard deviations are in parentheses in columns 1-3 and 6-5 . Standard errors are in brackets in columns 4 and 7. Each entry in column 4 is derived from a separate OLS regression where the explanatory variable is an indicator for an Arab student. Each entry in column 7 is derived from a separate OLS regression where the explanatory variable is an indicator for a female student. Number of driving tests is the current test number, i.e. number of previous failed tests plus one. Number of theory tests is the number of theory tests the student has taken. *, **, *** represent statistical significance at the 10%, 5%, and 1% levels.
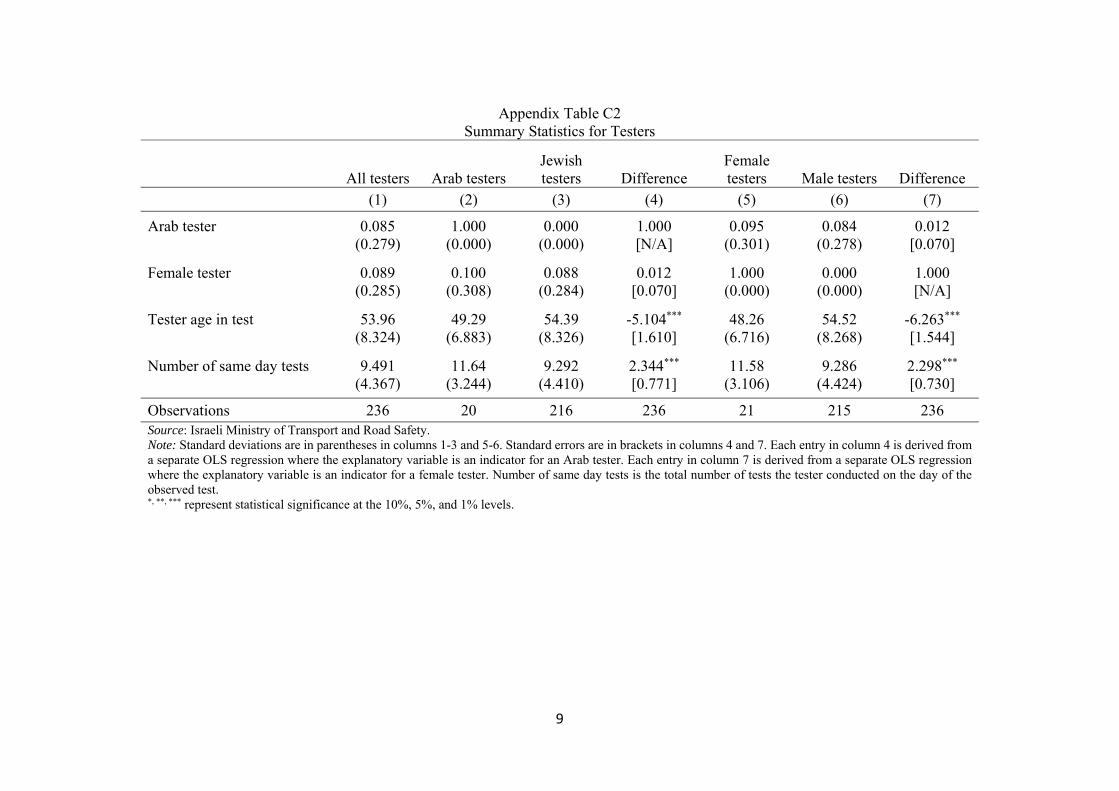
9
Appendix Table C2 Summary Statistics for Testers
All testers Arab testers
Jewish testers Difference
Female testers Male testers Difference
(1) (2) (3) (4) (5) (6) (7)
Arab tester 0.085 1.000 0.000 1.000 0.095 0.084 0.012 (0.279) (0.000) (0.000) [N/A] (0.301) (0.278) [0.070]
Female tester 0.089 0.100 0.088 0.012 1.000 0.000 1.000 (0.285) (0.308) (0.284) [0.070] (0.000) (0.000) [N/A]
Tester age in test 53.96 49.29 54.39 -5.104*** 48.26 54.52 -6.263*** (8.324) (6.883) (8.326) [1.610] (6.716) (8.268) [1.544]
Number of same day tests 9.491 11.64 9.292 2.344*** 11.58 9.286 2.298*** (4.367) (3.244) (4.410) [0.771] (3.106) (4.424) [0.730]
Observations 236 20 216 236 21 215 236 Source: Israeli Ministry of Transport and Road Safety. Note: Standard deviations are in parentheses in columns 1-3 and 6-5 . Standard errors are in brackets in columns 4 and 7. Each entry in column 4 is derived from a separate OLS regression where the explanatory variable is an indicator for an Arab tester. Each entry in column 7 is derived from a separate OLS regression where the explanatory variable is an indicator for a female tester. Number of same day tests is the total number of tests the tester conducted on the day of the observed test. *, **, *** represent statistical significance at the 10%, 5%, and 1% levels.
10
Appendix D: Balancing Tests
Appendix Table D1 shows the results of balancing tests examining whether the assignment of students and testers to tests is effectively random.
We first analyze balance with respect to tester ethnicity. For each student characteristic, column 1 reports the mean and standard deviation of this characteristic for students assigned to Arab testers, column 2 shows the corresponding statistics of this characteristic for students assigned to Jewish testers and column 3 tests whether the means are equal.
Results in the first row indicate that the share of students who are Arab is 45.8 percent when the tester is Arab and only 28.2 percent when the tester is Jewish, yielding a large and statistically significant difference in means of 17.6 percentage points. This difference is not surprising given the fact that, as mentioned in conjunction with Table 1, Arabs tend to live in specific areas of the country. Indeed, when we test for the equality of means while controlling for (test center x test date) fixed‐effects (column 4, first row), the difference declines to 0.1 percentage points and becomes statistically insignificant. The next rows replicate this analysis for student gender, age, and the number of driving and theory tests. While the differences in means for some of these characteristics are statistically significant, their magnitudes are generally miniscule.9
In columns 5‐8 of Appendix Table D1 we conduct balancing tests with respect to tester gender. In this case, the raw means of all characteristics of students assigned to male and female testers are quite similar (columns 5‐7). After adjusting for (test center x test date) fixed‐effects (column 8), the differences in means, while statistically significant in most cases, are again extremely small.
9 To gain perspective, the results of these balancing tests can be compared to those performed by Shayo and Zussman (2011), who explore whether the assignment of cases to judges in Israeli small claims courts is balanced with respect to judge ethnicity. While none of the differences in observable case characteristics they test for turns out to be statistically significant, the magnitude of some of the differences in means is non‐negligible. For example, after adjusting for court fixed‐effects, the difference between the share of Arabs among plaintiffs assigned to Arab judges and the share of Arabs among plaintiffs assigned to Jewish judges is 1.3 percentage points. This difference is an order of magnitude larger than the one we report above for the assignment of Arab students to Arab and Jewish testers. A major difference between the current paper and Shayo and Zussman (2011), which leads us to reject the null hypothesis of equality of means for some of the characteristics, is that the number of observations is more than 1,500 times larger in the current study.
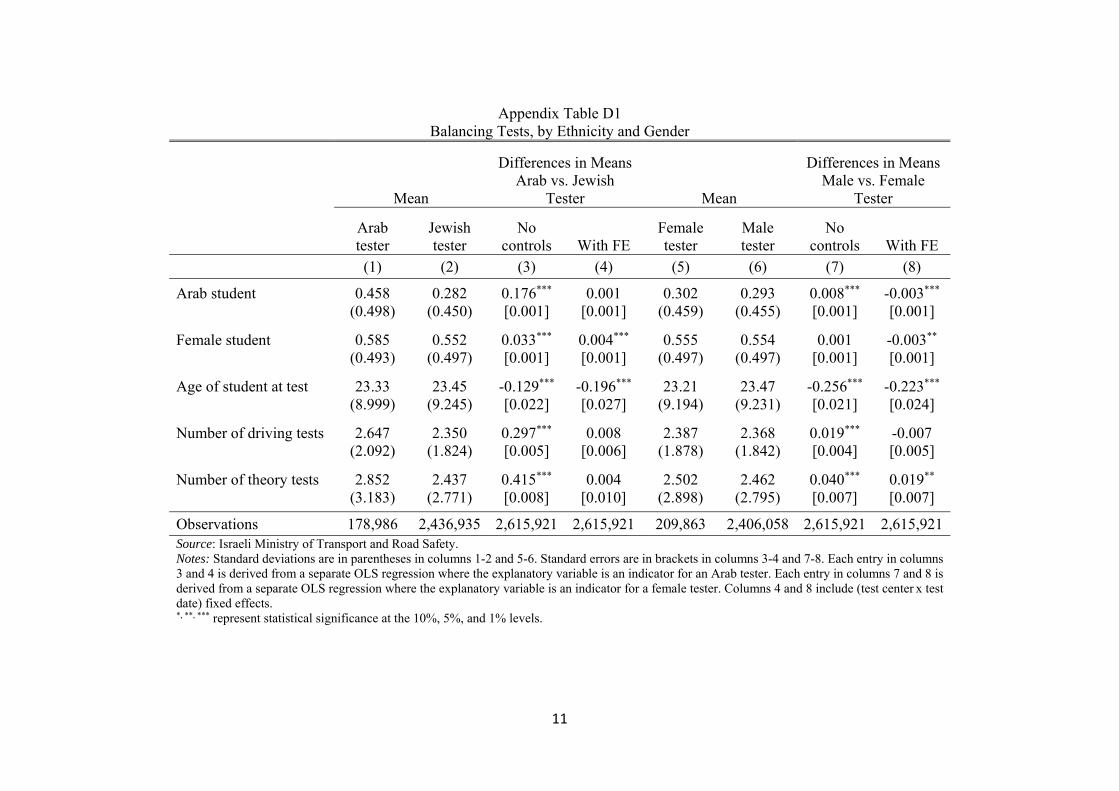
11
Appendix Table D1 Balancing Tests, by Ethnicity and Gender
Mean
Differences in Means Arab vs. Jewish
Tester Mean
Differences in Means Male vs. Female
Tester
Arab tester
Jewish tester
No controls With FE
Female tester
Male tester
No controls With FE
(1) (2) (3) (4) (5) (6) (7) (8)
Arab student 0.458 0.282 0.176*** 0.001 0.302 0.293 0.008*** -0.003*** (0.498) (0.450) [0.001] [0.001] (0.459) (0.455) [0.001] [0.001]
Female student 0.585 0.552 0.033*** 0.004*** 0.555 0.554 0.001 -0.003** (0.493) (0.497) [0.001] [0.001] (0.497) (0.497) [0.001] [0.001]
Age of student at test 23.33 23.45 -0.129*** -0.196*** 23.21 23.47 -0.256*** -0.223*** (8.999) (9.245) [0.022] [0.027] (9.194) (9.231) [0.021] [0.024]
Number of driving tests 2.647 2.350 0.297*** 0.008 2.387 2.368 0.019*** -0.007 (2.092) (1.824) [0.005] [0.006] (1.878) (1.842) [0.004] [0.005]
Number of theory tests 2.852 2.437 0.415*** 0.004 2.502 2.462 0.040*** 0.019** (3.183) (2.771) [0.008] [0.010] (2.898) (2.795) [0.007] [0.007]
Observations 178,986 2,436,935 2,615,921 2,615,921 209,863 2,406,058 2,615,921 2,615,921 Source: Israeli Ministry of Transport and Road Safety. Notes: Standard deviations are in parentheses in columns 1-2 and 5-6. Standard errors are in brackets in columns 3-4 and 7-8. Each entry in columns 3 and 4 is derived from a separate OLS regression where the explanatory variable is an indicator for an Arab tester. Each entry in columns 7 and 8 is derived from a separate OLS regression where the explanatory variable is an indicator for a female tester. Columns 4 and 8 include (test center x test date) fixed effects. *, **, *** represent statistical significance at the 10%, 5%, and 1% levels.
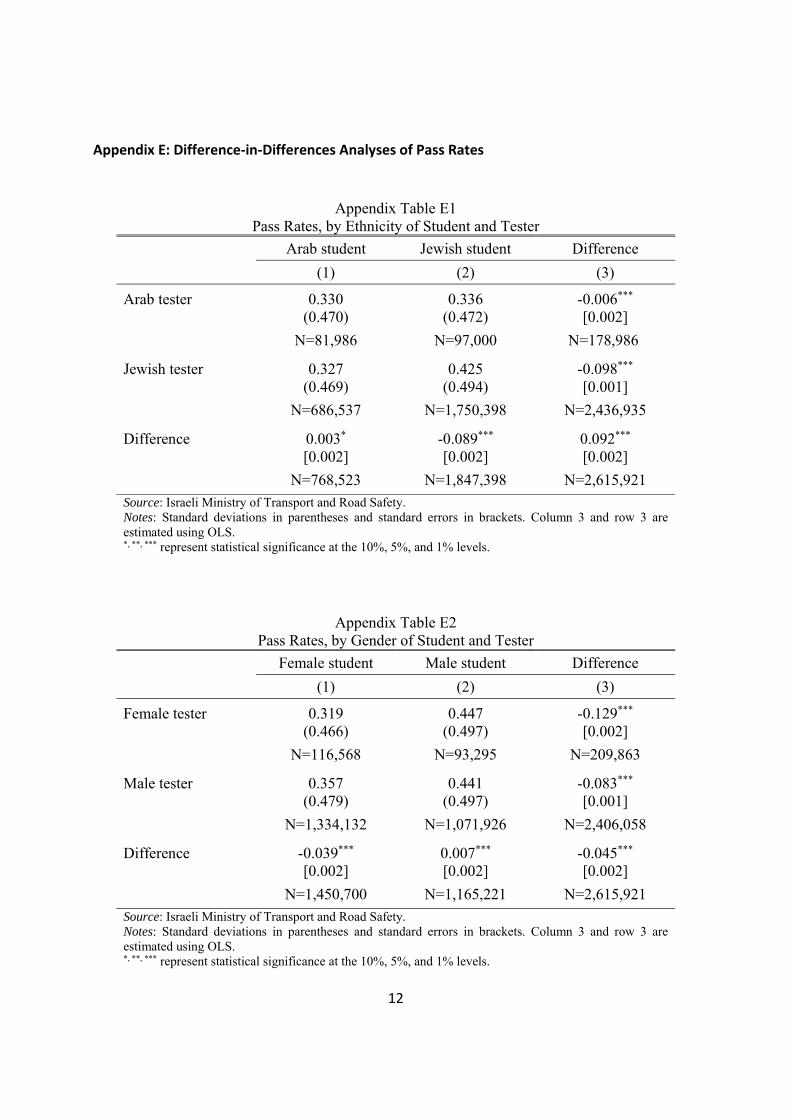
12
Appendix E: Difference‐in‐Differences Analyses of Pass Rates
Appendix Table E1 Pass Rates, by Ethnicity of Student and Tester
Arab student Jewish student Difference (1) (2) (3)
Arab tester 0.330 0.336 -0.006*** (0.470) (0.472) [0.002]
N=81,986 N=97,000 N= 986,178
Jewish tester 0.327 0.425 -0.098*** (0.469) (0.494) [0.001]
N=686,537 N=1,750,398 N=2,436,935
Difference 0.003* -0.089*** 0.092*** [0.002] [0.002] [0.002]
N=768,523 N=1,847,398 N=2,615,921 Source: Israeli Ministry of Transport and Road Safety. Notes: Standard deviations in parentheses and standard errors in brackets. Column 3 and row 3 are estimated using OLS. *, **, *** represent statistical significance at the 10%, 5%, and 1% levels.
Appendix Table E2 Pass Rates, by Gender of Student and Tester
Female student Male student Difference (1) (2) (3)
Female tester 0.319 0.447 -0.129*** (0.466) (0.497) [0.002]
N=116,568 N=93,295 N=209,863
Male tester 0.357 0.441 -0.083*** (0.479) (0.497) [0.001]
N=1,334,132 N=1,071,926 N=2,406,058
Difference -0.039*** 0.007*** -0.045*** [0.002] [0.002] [0.002]
N=1,450,700 N=1,165,221 N=2,615,921 Source: Israeli Ministry of Transport and Road Safety. Notes: Standard deviations in parentheses and standard errors in brackets. Column 3 and row 3 are estimated using OLS. *, **, *** represent statistical significance at the 10%, 5%, and 1% levels.
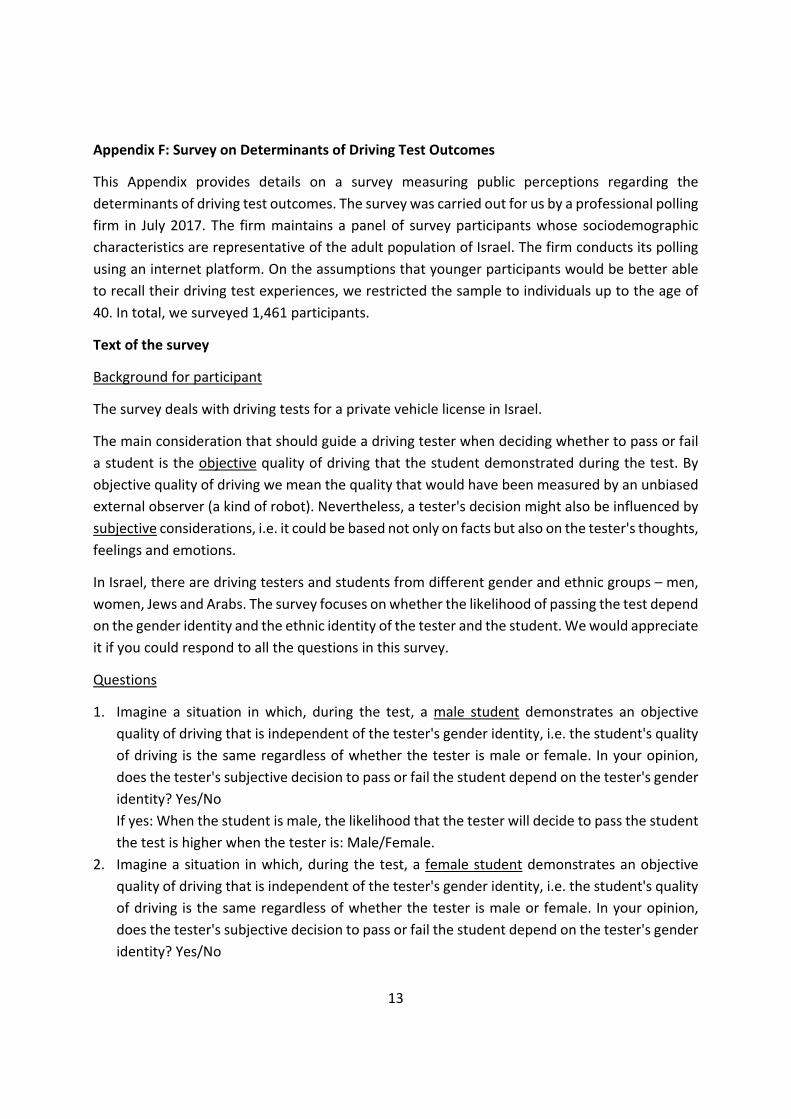
13
Appendix F: Survey on Determinants of Driving Test Outcomes
This Appendix provides details on a survey measuring public perceptions regarding the determinants of driving test outcomes. The survey was carried out for us by a professional polling firm in July 2017. The firm maintains a panel of survey participants whose sociodemographic characteristics are representative of the adult population of Israel. The firm conducts its polling using an internet platform. On the assumptions that younger participants would be better able to recall their driving test experiences, we restricted the sample to individuals up to the age of 40. In total, we surveyed 1,461 participants.
Text of the survey
Background for participant
The survey deals with driving tests for a private vehicle license in Israel.
The main consideration that should guide a driving tester when deciding whether to pass or fail a student is the objective quality of driving that the student demonstrated during the test. By objective quality of driving we mean the quality that would have been measured by an unbiased external observer (a kind of robot). Nevertheless, a tester's decision might also be influenced by subjective considerations, i.e. it could be based not only on facts but also on the tester's thoughts, feelings and emotions.
In Israel, there are driving testers and students from different gender and ethnic groups – men, women, Jews and Arabs. The survey focuses on whether the likelihood of passing the test depend on the gender identity and the ethnic identity of the tester and the student. We would appreciate it if you could respond to all the questions in this survey.
Questions
1. Imagine a situation in which, during the test, a male student demonstrates an objective quality of driving that is independent of the tester's gender identity, i.e. the student's quality of driving is the same regardless of whether the tester is male or female. In your opinion, does the tester's subjective decision to pass or fail the student depend on the tester's gender identity? Yes/No If yes: When the student is male, the likelihood that the tester will decide to pass the student the test is higher when the tester is: Male/Female.
2. Imagine a situation in which, during the test, a female student demonstrates an objective quality of driving that is independent of the tester's gender identity, i.e. the student's quality of driving is the same regardless of whether the tester is male or female. In your opinion, does the tester's subjective decision to pass or fail the student depend on the tester's gender identity? Yes/No
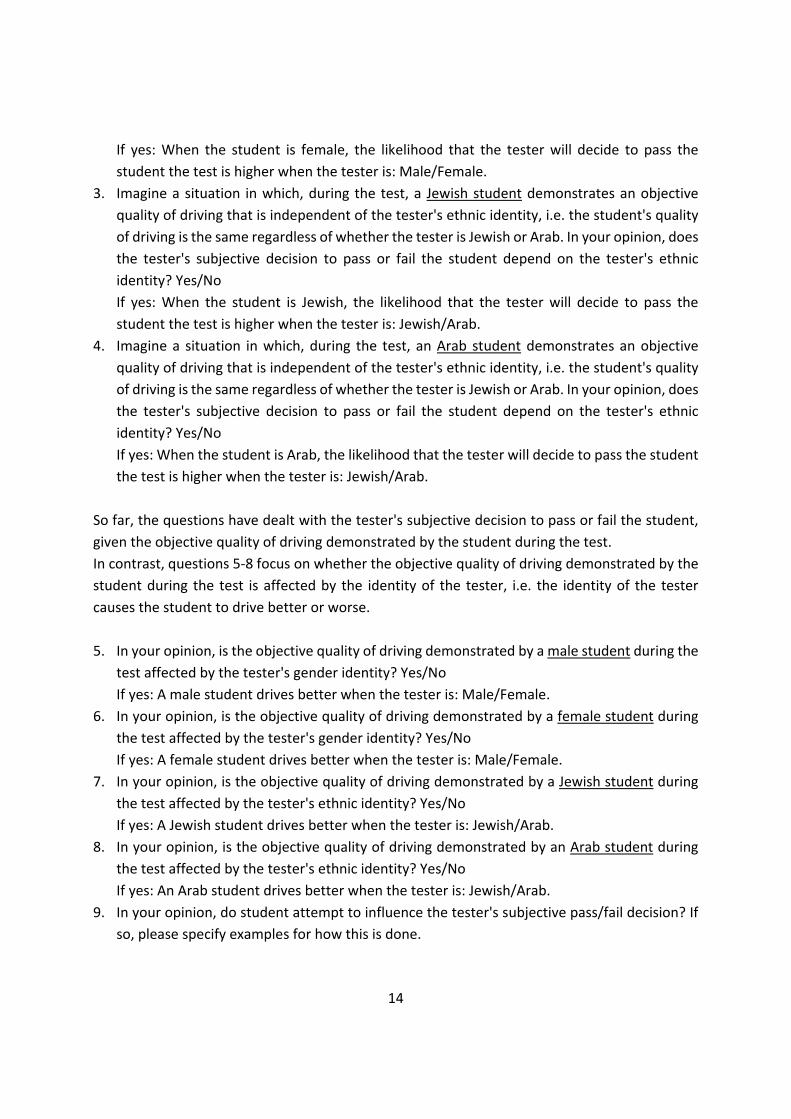
14
If yes: When the student is female, the likelihood that the tester will decide to pass the student the test is higher when the tester is: Male/Female.
3. Imagine a situation in which, during the test, a Jewish student demonstrates an objective quality of driving that is independent of the tester's ethnic identity, i.e. the student's quality of driving is the same regardless of whether the tester is Jewish or Arab. In your opinion, does the tester's subjective decision to pass or fail the student depend on the tester's ethnic identity? Yes/No If yes: When the student is Jewish, the likelihood that the tester will decide to pass the student the test is higher when the tester is: Jewish/Arab.
4. Imagine a situation in which, during the test, an Arab student demonstrates an objective quality of driving that is independent of the tester's ethnic identity, i.e. the student's quality of driving is the same regardless of whether the tester is Jewish or Arab. In your opinion, does the tester's subjective decision to pass or fail the student depend on the tester's ethnic identity? Yes/No If yes: When the student is Arab, the likelihood that the tester will decide to pass the student the test is higher when the tester is: Jewish/Arab.
So far, the questions have dealt with the tester's subjective decision to pass or fail the student, given the objective quality of driving demonstrated by the student during the test. In contrast, questions 5‐8 focus on whether the objective quality of driving demonstrated by the student during the test is affected by the identity of the tester, i.e. the identity of the tester causes the student to drive better or worse.
5. In your opinion, is the objective quality of driving demonstrated by a male student during the
test affected by the tester's gender identity? Yes/No If yes: A male student drives better when the tester is: Male/Female.
6. In your opinion, is the objective quality of driving demonstrated by a female student during the test affected by the tester's gender identity? Yes/No If yes: A female student drives better when the tester is: Male/Female.
7. In your opinion, is the objective quality of driving demonstrated by a Jewish student during the test affected by the tester's ethnic identity? Yes/No If yes: A Jewish student drives better when the tester is: Jewish/Arab.
8. In your opinion, is the objective quality of driving demonstrated by an Arab student during the test affected by the tester's ethnic identity? Yes/No If yes: An Arab student drives better when the tester is: Jewish/Arab.
9. In your opinion, do student attempt to influence the tester's subjective pass/fail decision? If so, please specify examples for how this is done.
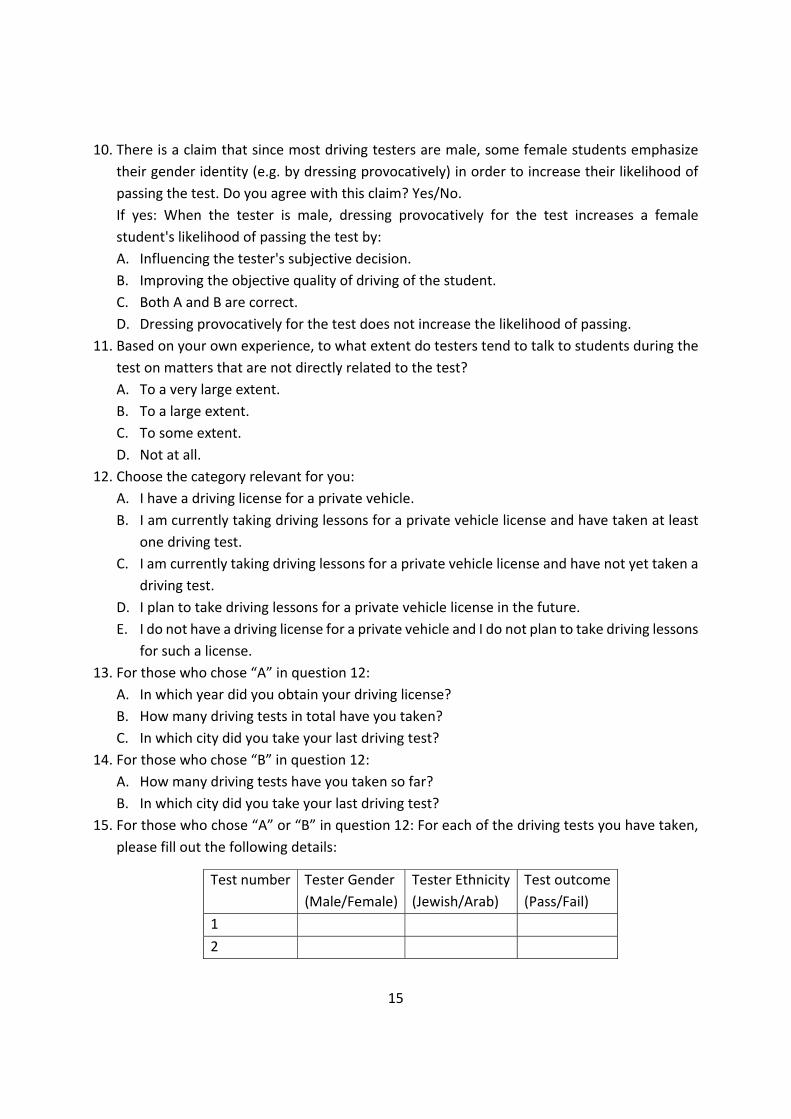
15
10. There is a claim that since most driving testers are male, some female students emphasize their gender identity (e.g. by dressing provocatively) in order to increase their likelihood of passing the test. Do you agree with this claim? Yes/No. If yes: When the tester is male, dressing provocatively for the test increases a female student's likelihood of passing the test by: A. Influencing the tester's subjective decision. B. Improving the objective quality of driving of the student. C. Both A and B are correct. D. Dressing provocatively for the test does not increase the likelihood of passing.
11. Based on your own experience, to what extent do testers tend to talk to students during the test on matters that are not directly related to the test? A. To a very large extent. B. To a large extent. C. To some extent. D. Not at all.
12. Choose the category relevant for you: A. I have a driving license for a private vehicle. B. I am currently taking driving lessons for a private vehicle license and have taken at least
one driving test. C. I am currently taking driving lessons for a private vehicle license and have not yet taken a
driving test. D. I plan to take driving lessons for a private vehicle license in the future. E. I do not have a driving license for a private vehicle and I do not plan to take driving lessons
for such a license. 13. For those who chose “A” in question 12:
A. In which year did you obtain your driving license? B. How many driving tests in total have you taken? C. In which city did you take your last driving test?
14. For those who chose “B” in question 12: A. How many driving tests have you taken so far? B. In which city did you take your last driving test?
15. For those who chose “A” or “B” in question 12: For each of the driving tests you have taken, please fill out the following details:
Test number Tester Gender (Male/Female)
Tester Ethnicity (Jewish/Arab)
Test outcome (Pass/Fail)
1 2

16
3 4 5 6
16. Please share with us any other thoughts or remarks you might have about driving tests in Israel and testers' decision making.
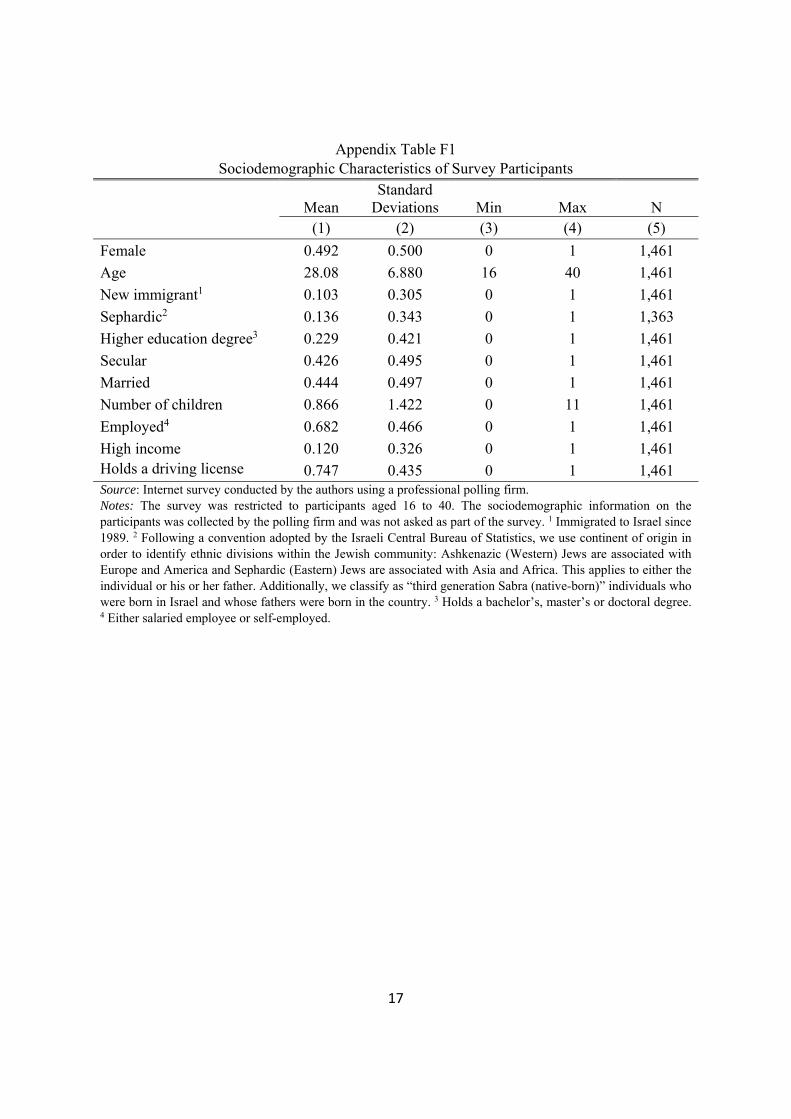
17
Appendix Table F1 Sociodemographic Characteristics of Survey Participants
Mean Standard
Deviations Min Max N (1) (2) (3) (4) (5)
Female 0.492 0.500 0 1 1,461 Age 28.08 6.880 16 40 1,461 New immigrant1 0.103 0.305 0 1 1,461 Sephardic2 0.136 0.343 0 1 1,363 Higher education degree3 0.229 0.421 0 1 1,461 Secular 0.426 0.495 0 1 1,461 Married 0.444 0.497 0 1 1,461 Number of children 0.866 1.422 0 11 1,461 Employed4 0.682 0.466 0 1 1,461 High income 0.120 0.326 0 1 1,461 Holds a driving license 0.747 0.435 0 1 1,461 Source: Internet survey conducted by the authors using a professional polling firm. Notes: The survey was restricted to participants aged 16 to 40. The sociodemographic information on the participants was collected by the polling firm and was not asked as part of the survey. 1 Immigrated to Israel since 1989. 2 Following a convention adopted by the Israeli Central Bureau of Statistics, we use continent of origin in order to identify ethnic divisions within the Jewish community: Ashkenazic (Western) Jews are associated with Europe and America and Sephardic (Eastern) Jews are associated with Asia and Africa. This applies to either the individual or his or her father. Additionally, we classify as “third generation Sabra (native-born)” individuals who were born in Israel and whose fathers were born in the country. 3 Holds a bachelor’s, master’s or doctoral degree. 4 Either salaried employee or self-employed.

18
Appendix Table F2 Expected Student Objective Performance, by Tester and Student Gender
Male student Female student Difference (1) (2) (3)
Male tester 0.273 0.136 0.137*** (0.446) (0.343) [0.013] Same 0.608 0.548 0.060*** (0.488) (0.498) [0.013] Female tester 0.119 0.315 -0.197*** (0.324) (0.465) [0.014] Difference 0.154*** -0.179*** 0.333*** [0.016] [0.017] [0.024] Observations 1,455 1,455 1,455 Source: Internet survey conducted by the authors using a professional polling firm. Notes: The table reports responses of survey participants to questions about how the objective performance of students in their driving tests depends on their gender and the gender of the testers. Column 1 (2) reports responses to the question “In your opinion, is the objective quality of driving demonstrated by a male (female) student during the test affected by the tester's gender identity? Yes/No If yes: A male (female) student drives better when the tester is: Male/Female.” The row “Male tester” reports the share of participants who answered that a student will perform objectively better when tested by a male rather than a female tester. The row “Same” reports the share of participants who answered that a student will perform objectively equally well when tested by a male or a female tester. The row “Female tester” reports the share of participants who answered that a student will perform objectively better when tested by a female rather than a male tester. Standard deviations in parentheses and standard errors in brackets. *, **, *** represent statistical significance at the 10%, 5%, and 1% levels.
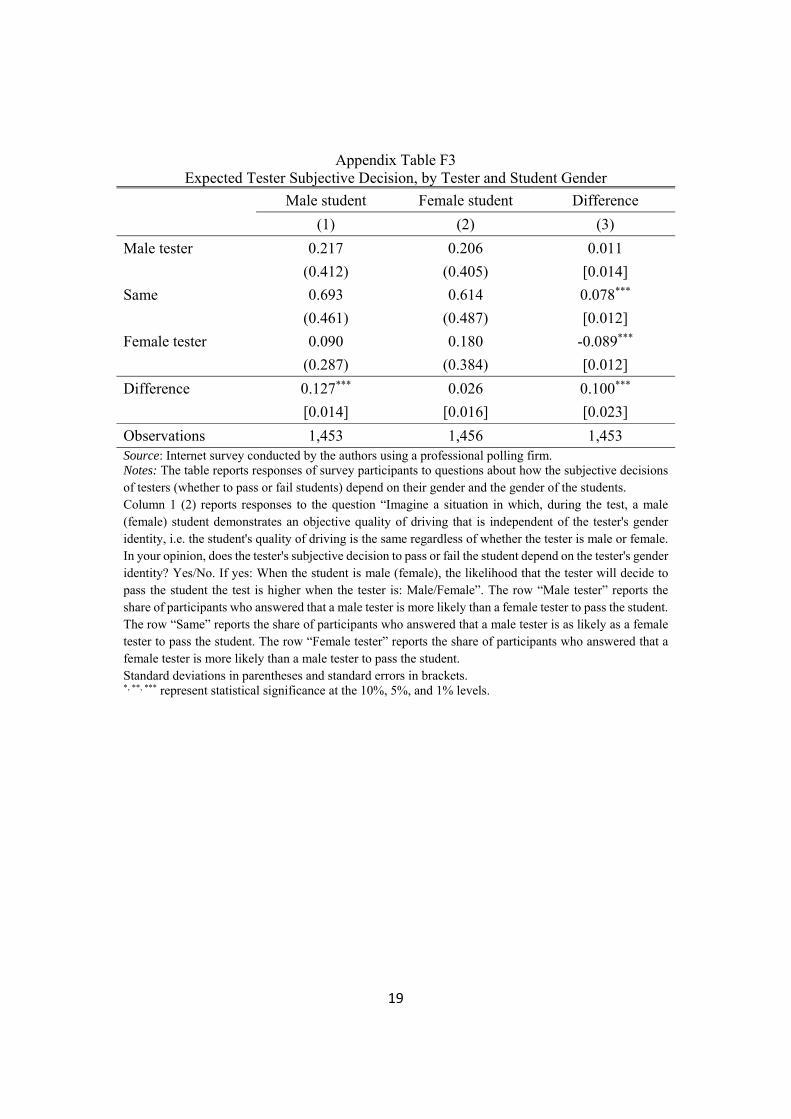
19
Appendix Table F3 Expected Tester Subjective Decision, by Tester and Student Gender Male student Female student Difference (1) (2) (3)
Male tester 0.217 0.206 0.011 (0.412) (0.405) [0.014] Same 0.693 0.614 0.078*** (0.461) (0.487) [0.012] Female tester 0.090 0.180 -0.089*** (0.287) (0.384) [0.012] Difference 0.127*** 0.026 0.100*** [0.014] [0.016] [0.023] Observations 1,453 1,456 1,453 Source: Internet survey conducted by the authors using a professional polling firm. Notes: The table reports responses of survey participants to questions about how the subjective decisions of testers (whether to pass or fail students) depend on their gender and the gender of the students. Column 1 (2) reports responses to the question “Imagine a situation in which, during the test, a male (female) student demonstrates an objective quality of driving that is independent of the tester's gender identity, i.e. the student's quality of driving is the same regardless of whether the tester is male or female. In your opinion, does the tester's subjective decision to pass or fail the student depend on the tester's gender identity? Yes/No. If yes: When the student is male (female), the likelihood that the tester will decide to pass the student the test is higher when the tester is: Male/Female”. The row “Male tester” reports the share of participants who answered that a male tester is more likely than a female tester to pass the student. The row “Same” reports the share of participants who answered that a male tester is as likely as a female tester to pass the student. The row “Female tester” reports the share of participants who answered that a female tester is more likely than a male tester to pass the student. Standard deviations in parentheses and standard errors in brackets. *, **, *** represent statistical significance at the 10%, 5%, and 1% levels.
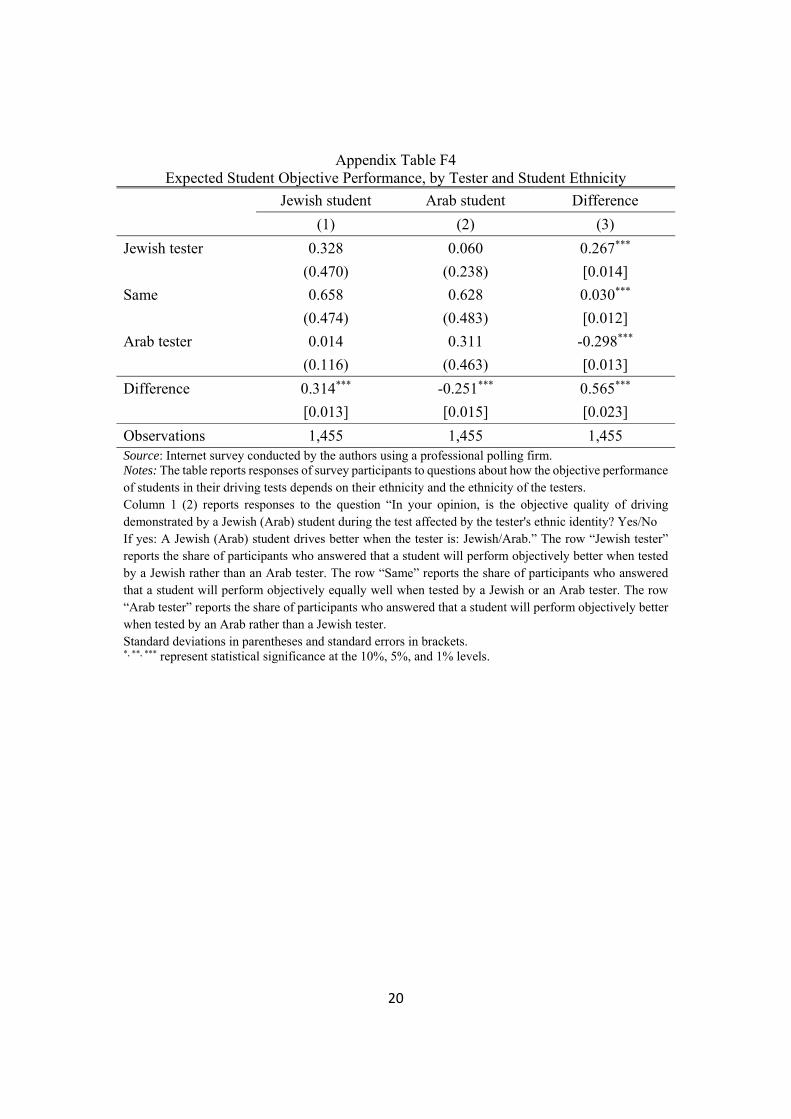
20
Appendix Table F4 Expected Student Objective Performance, by Tester and Student Ethnicity
Jewish student Arab student Difference (1) (2) (3)
Jewish tester 0.328 0.060 0.267*** (0.470) (0.238) [0.014] Same 0.658 0.628 0.030*** (0.474) (0.483) [0.012] Arab tester 0.014 0.311 -0.298*** (0.116) (0.463) [0.013] Difference 0.314*** -0.251*** 0.565*** [0.013] [0.015] [0.023] Observations 1,455 1,455 1,455 Source: Internet survey conducted by the authors using a professional polling firm. Notes: The table reports responses of survey participants to questions about how the objective performance of students in their driving tests depends on their ethnicity and the ethnicity of the testers. Column 1 (2) reports responses to the question “In your opinion, is the objective quality of driving demonstrated by a Jewish (Arab) student during the test affected by the tester's ethnic identity? Yes/No If yes: A Jewish (Arab) student drives better when the tester is: Jewish/Arab.” The row “Jewish tester” reports the share of participants who answered that a student will perform objectively better when tested by a Jewish rather than an Arab tester. The row “Same” reports the share of participants who answered that a student will perform objectively equally well when tested by a Jewish or an Arab tester. The row “Arab tester” reports the share of participants who answered that a student will perform objectively better when tested by an Arab rather than a Jewish tester. Standard deviations in parentheses and standard errors in brackets. *, **, *** represent statistical significance at the 10%, 5%, and 1% levels.
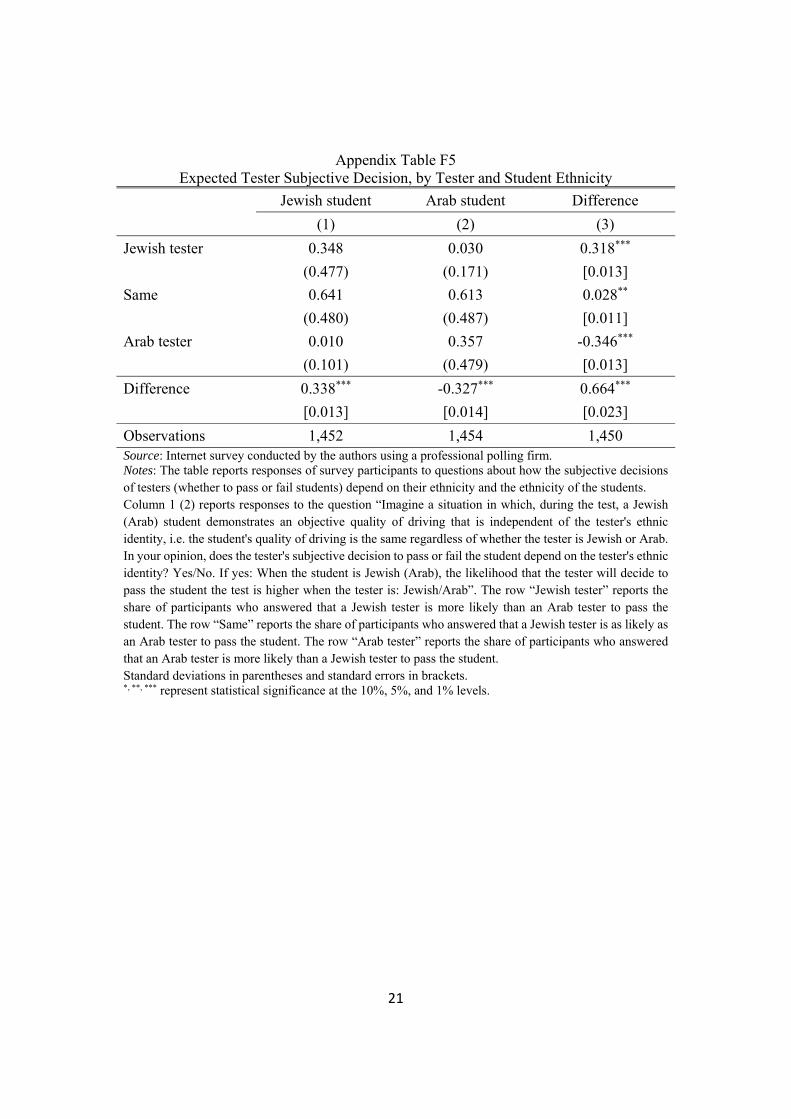
21
Appendix Table F5 Expected Tester Subjective Decision, by Tester and Student Ethnicity Jewish student Arab student Difference (1) (2) (3)
Jewish tester 0.348 0.030 0.318*** (0.477) (0.171) [0.013] Same 0.641 0.613 0.028** (0.480) (0.487) [0.011] Arab tester 0.010 0.357 -0.346*** (0.101) (0.479) [0.013] Difference 0.338*** -0.327*** 0.664*** [0.013] [0.014] [0.023] Observations 1,452 1,454 1,450 Source: Internet survey conducted by the authors using a professional polling firm. Notes: The table reports responses of survey participants to questions about how the subjective decisions of testers (whether to pass or fail students) depend on their ethnicity and the ethnicity of the students. Column 1 (2) reports responses to the question “Imagine a situation in which, during the test, a Jewish (Arab) student demonstrates an objective quality of driving that is independent of the tester's ethnic identity, i.e. the student's quality of driving is the same regardless of whether the tester is Jewish or Arab. In your opinion, does the tester's subjective decision to pass or fail the student depend on the tester's ethnic identity? Yes/No. If yes: When the student is Jewish (Arab), the likelihood that the tester will decide to pass the student the test is higher when the tester is: Jewish/Arab”. The row “Jewish tester” reports the share of participants who answered that a Jewish tester is more likely than an Arab tester to pass the student. The row “Same” reports the share of participants who answered that a Jewish tester is as likely as an Arab tester to pass the student. The row “Arab tester” reports the share of participants who answered that an Arab tester is more likely than a Jewish tester to pass the student. Standard deviations in parentheses and standard errors in brackets. *, **, *** represent statistical significance at the 10%, 5%, and 1% levels.
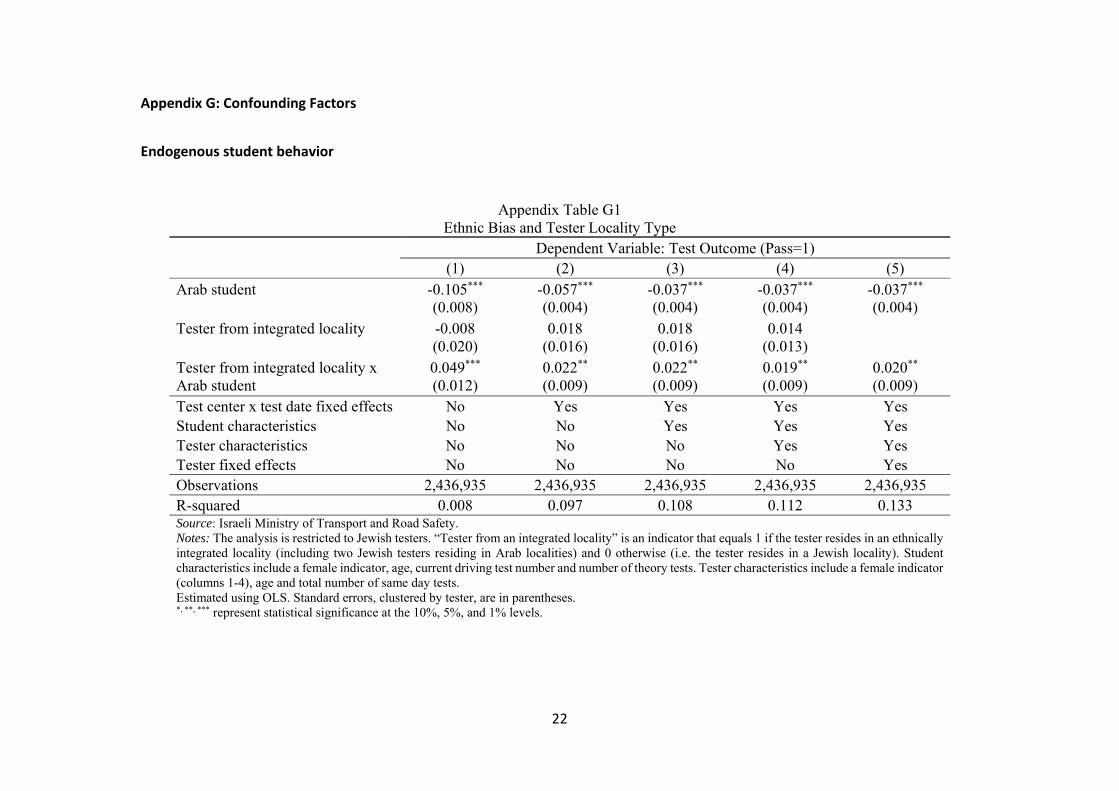
22
Appendix G: Confounding Factors
Endogenous student behavior
Appendix Table G1 Ethnic Bias and Tester Locality Type
Dependent Variable: Test Outcome (Pass=1) (1) (2) (3) (4) (5)
Arab student -0.105*** -0.057*** -0.037*** -0.037*** -0.037*** (0.008) (0.004) (0.004) (0.004) (0.004)
Tester from integrated locality -0.008 0.018 0.018 0.014 (0.020) (0.016) (0.016) (0.013)
Tester from integrated locality x Arab student
0.049*** 0.022** 0.022** 0.019** 0.020** (0.012) (0.009) (0.009) (0.009) (0.009)
Test center x test date fixed effects No Yes Yes Yes Yes Student characteristics No No Yes Yes Yes Tester characteristics No No No Yes Yes Tester fixed effects No No No No Yes Observations 2,436,935 2,436,935 2,436,935 2,436,935 2,436,935 R-squared 0.008 0.097 0.108 0.112 0.133 Source: Israeli Ministry of Transport and Road Safety. Notes: The analysis is restricted to Jewish testers. “Tester from an integrated locality” is an indicator that equals 1 if the tester resides in an ethnically integrated locality (including two Jewish testers residing in Arab localities) and 0 otherwise (i.e. the tester resides in a Jewish locality). Student characteristics include a female indicator, age, current driving test number and number of theory tests. Tester characteristics include a female indicator (columns 1-4), age and total number of same day tests. Estimated using OLS. Standard errors, clustered by tester, are in parentheses. *, **, *** represent statistical significance at the 10%, 5%, and 1% levels.

23
Appendix Table G2 Ethnic Bias and Student Locality Type
Dependent Variable: Test Outcome (Pass=1) (1) (2) (3) (4) (5)
Arab student -0.116*** -0.064*** -0.042*** -0.044*** -0.044*** (0.009) (0.005) (0.005) (0.005) (0.005)
Arab tester x Arab student 0.019 0.042*** 0.041*** 0.053*** 0.063*** (0.015) (0.013) (0.013) (0.013) (0.014)
Student from integrated locality x Arab tester x Arab student
0.053** 0.020 0.013 0.004 -0.006 (0.024) (0.019) (0.019) (0.020) (0.016)
Additional controls Yes Yes Yes Yes Yes Test center x test date fixed effects No Yes Yes Yes Yes Student characteristics No No Yes Yes Yes Tester characteristics No No No Yes Yes Tester fixed effects No No No No Yes Observations 2,614,813 2,614,813 2,614,813 2,614,813 2,614,813 R-squared 0.009 0.094 0.105 0.109 0.130 Source: Israeli Ministry of Transport and Road Safety. Notes: “Student from an integrated locality” is an indicator that equals 1 if the student resides in an ethnically integrated locality (including a small number of Jewish (Arab) students residing in Arab (Jewish) localities) and 0 otherwise (i.e. if the Jewish (Arab) student resides in a Jewish (Arab) locality). Student characteristics include a female indicator, age, current driving test number and number of theory tests. Tester characteristics include a female indicator (columns 1-4), age and total number of same day tests. Additional controls include an indicator for the student residing in an ethnically integrated locality and its interactions with indicators for Arab student and Arab tester. Estimated using OLS. Standard errors, clustered by tester, are in parentheses. *, **, *** represent statistical significance at the 10%, 5%, and 1% levels.
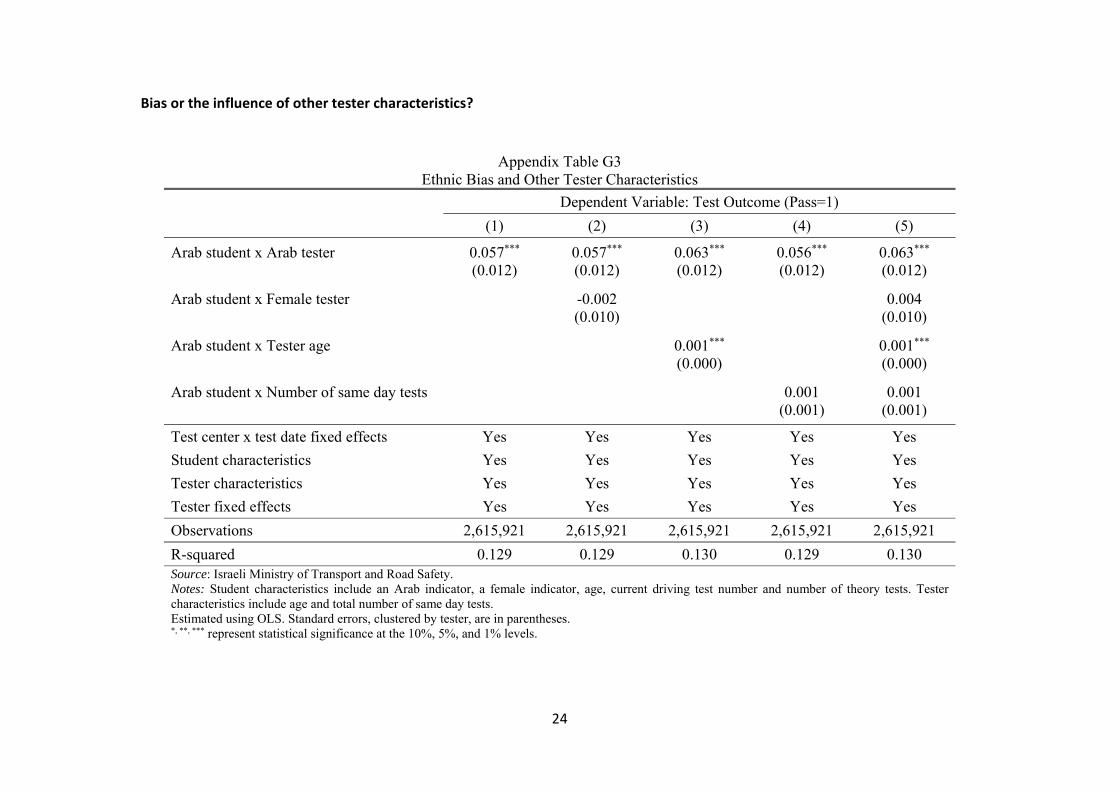
24
Bias or the influence of other tester characteristics?
Appendix Table G3 Ethnic Bias and Other Tester Characteristics
Dependent Variable: Test Outcome (Pass=1) (1) (2) (3) (4) (5)
Arab student x Arab tester 0.057*** 0.057*** 0.063*** 0.056*** 0.063*** (0.012) (0.012) (0.012) (0.012) (0.012)
Arab student x Female tester -0.002 0.004 (0.010) (0.010)
Arab student x Tester age 0.001*** 0.001*** (0.000) (0.000)
Arab student x Number of same day tests 0.001 0.001 (0.001) (0.001)
Test center x test date fixed effects Yes Yes Yes Yes Yes Student characteristics Yes Yes Yes Yes Yes Tester characteristics Yes Yes Yes Yes Yes Tester fixed effects Yes Yes Yes Yes Yes Observations 2,615,921 2,615,921 2,615,921 2,615,921 2,615,921 R-squared 0.129 0.129 0.130 0.129 0.130 Source: Israeli Ministry of Transport and Road Safety. Notes: Student characteristics include an Arab indicator, a female indicator, age, current driving test number and number of theory tests. Tester characteristics include age and total number of same day tests. Estimated using OLS. Standard errors, clustered by tester, are in parentheses. *, **, *** represent statistical significance at the 10%, 5%, and 1% levels.
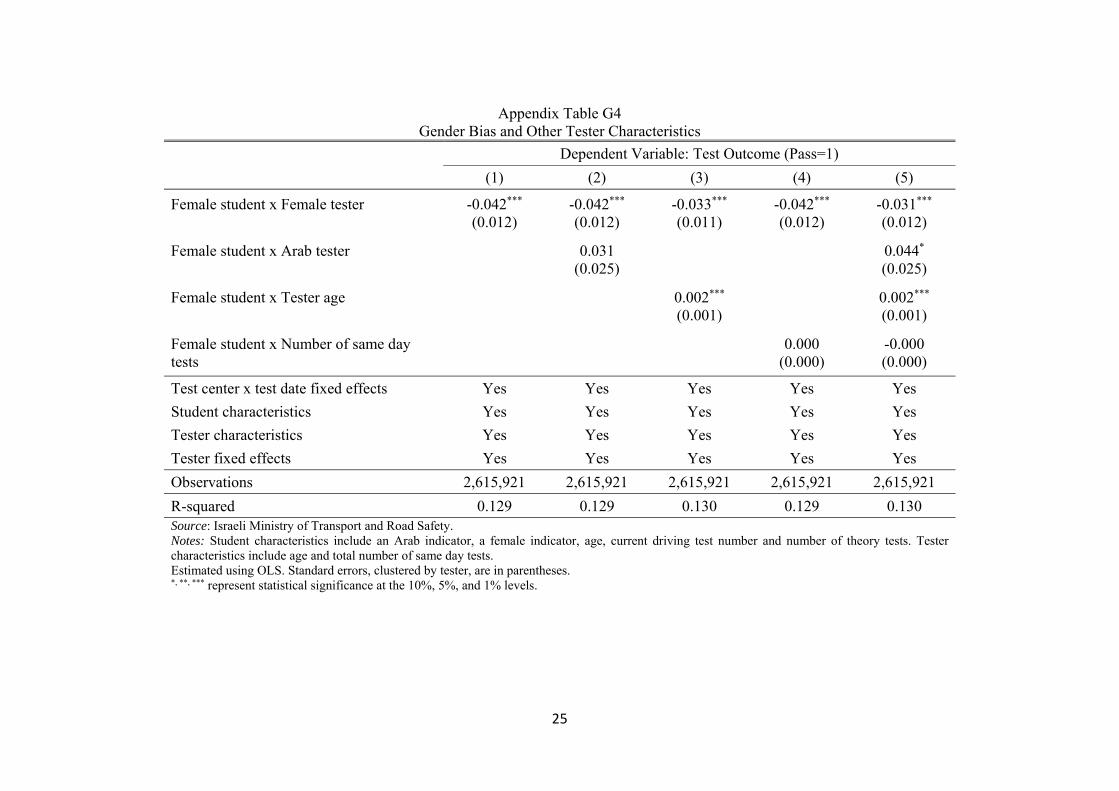
25
Appendix Table G4 Gender Bias and Other Tester Characteristics
Dependent Variable: Test Outcome (Pass=1) (1) (2) (3) (4) (5)
Female student x Female tester -0.042*** -0.042*** -0.033*** -0.042*** -0.031*** (0.012) (0.012) (0.011) (0.012) (0.012)
Female student x Arab tester 0.031 0.044* (0.025) (0.025)
Female student x Tester age 0.002*** 0.002*** (0.001) (0.001)
Female student x Number of same day tests
0.000 -0.000 (0.000) (0.000)
Test center x test date fixed effects Yes Yes Yes Yes Yes Student characteristics Yes Yes Yes Yes Yes Tester characteristics Yes Yes Yes Yes Yes Tester fixed effects Yes Yes Yes Yes Yes Observations 2,615,921 2,615,921 2,615,921 2,615,921 2,615,921 R-squared 0.129 0.129 0.130 0.129 0.130 Source: Israeli Ministry of Transport and Road Safety. Notes: Student characteristics include an Arab indicator, a female indicator, age, current driving test number and number of theory tests. Tester characteristics include age and total number of same day tests. Estimated using OLS. Standard errors, clustered by tester, are in parentheses. *, **, *** represent statistical significance at the 10%, 5%, and 1% levels.
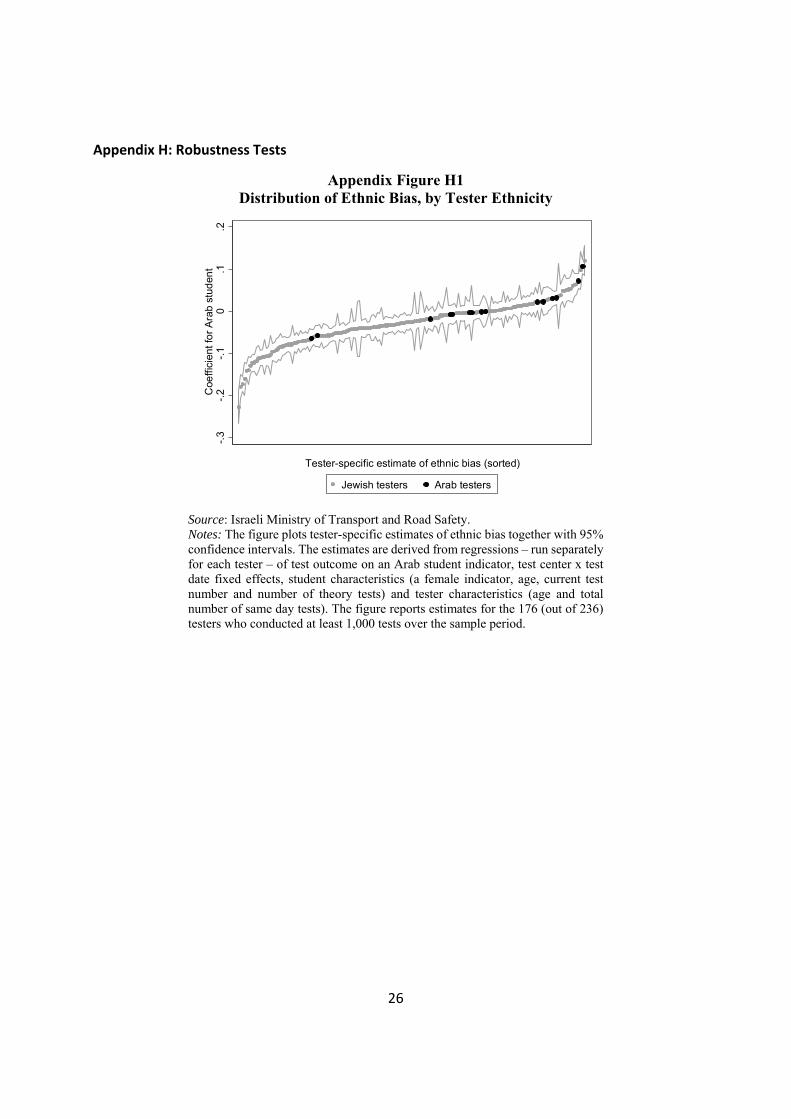
26
Appendix H: Robustness Tests
Appendix Figure H1 Distribution of Ethnic Bias, by Tester Ethnicity
Source: Israeli Ministry of Transport and Road Safety. Notes: The figure plots tester-specific estimates of ethnic bias together with 95% confidence intervals. The estimates are derived from regressions – run separately for each tester – of test outcome on an Arab student indicator, test center x test date fixed effects, student characteristics (a female indicator, age, current test number and number of theory tests) and tester characteristics (age and total number of same day tests). The figure reports estimates for the 176 (out of 236) testers who conducted at least 1,000 tests over the sample period.
-.3
-.2
-.1
0.1
.2C
oeffi
cien
t fo
r A
rab
stu
den
t
Tester-specific estimate of ethnic bias (sorted)
Jewish testers Arab testers

27
Appendix Figure H2 Distribution of Gender Bias, by Tester Gender
Source: Israeli Ministry of Transport and Road Safety. Notes: The figure plots tester-specific estimates of gender bias together with 95% confidence intervals. The estimates are derived from regressions – run separately for each tester – of test outcome on a female student indicator, test center x test date fixed effects, student characteristics (an Arab indicator, age, current test number and number of theory tests) and tester characteristics (age and total number of same day tests). The figure reports estimates for the 176 (out of 236) testers who conducted at least 1,000 tests over the sample period.
-.4
-.2
0.2
.4C
oeffi
cien
t fo
r F
em
ale
stu
dent
Tester-specific estimate of gender bias (sorted)
Male testers Female testers
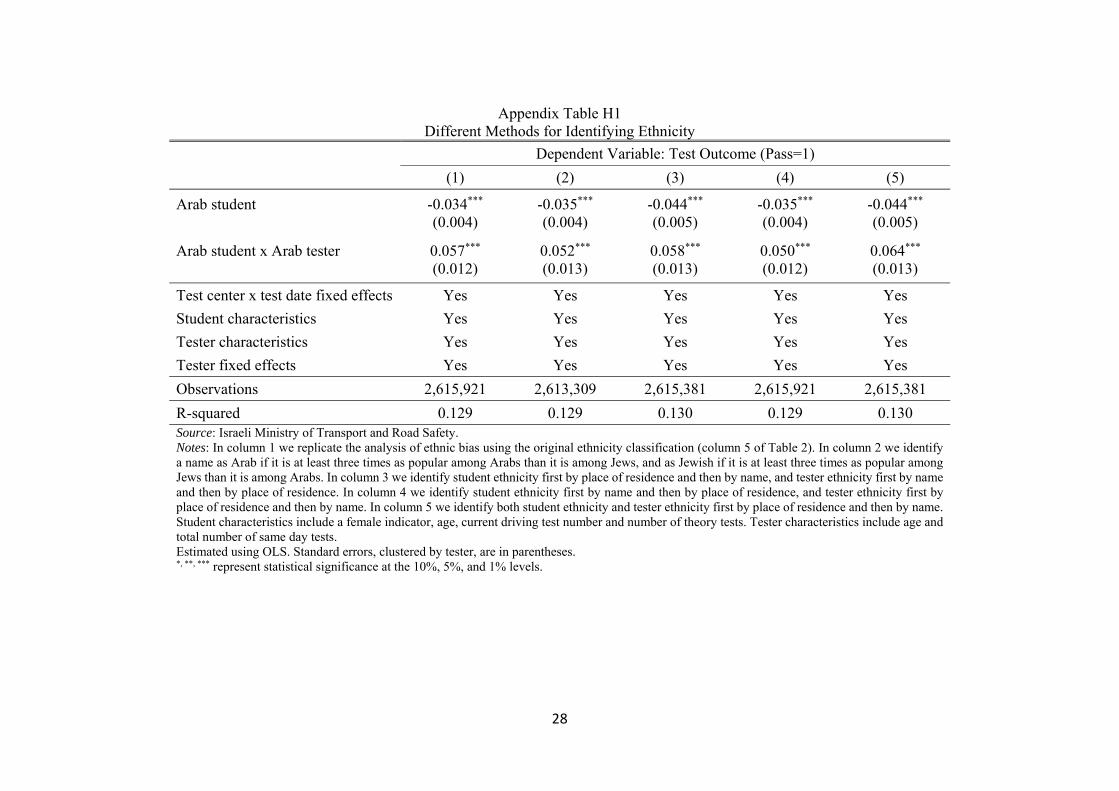
28
Appendix Table H1 Different Methods for Identifying Ethnicity
Dependent Variable: Test Outcome (Pass=1) (1) (2) (3) (4) (5)
Arab student -0.034*** -0.035*** -0.044*** -0.035*** -0.044*** (0.004) (0.004) (0.005) (0.004) (0.005)
Arab student x Arab tester 0.057*** 0.052*** 0.058*** 0.050*** 0.064*** (0.012) (0.013) (0.013) (0.012) (0.013)
Test center x test date fixed effects Yes Yes Yes Yes Yes Student characteristics Yes Yes Yes Yes Yes Tester characteristics Yes Yes Yes Yes Yes Tester fixed effects Yes Yes Yes Yes Yes Observations 2,615,921 2,613,309 2,615,381 2,615,921 2,615,381 R-squared 0.129 0.129 0.130 0.129 0.130 Source: Israeli Ministry of Transport and Road Safety. Notes: In column 1 we replicate the analysis of ethnic bias using the original ethnicity classification (column 5 of Table 2). In column 2 we identify a name as Arab if it is at least three times as popular among Arabs than it is among Jews, and as Jewish if it is at least three times as popular among Jews than it is among Arabs. In column 3 we identify student ethnicity first by place of residence and then by name, and tester ethnicity first by name and then by place of residence. In column 4 we identify student ethnicity first by name and then by place of residence, and tester ethnicity first by place of residence and then by name. In column 5 we identify both student ethnicity and tester ethnicity first by place of residence and then by name. Student characteristics include a female indicator, age, current driving test number and number of theory tests. Tester characteristics include age and total number of same day tests. Estimated using OLS. Standard errors, clustered by tester, are in parentheses. *, **, *** represent statistical significance at the 10%, 5%, and 1% levels.
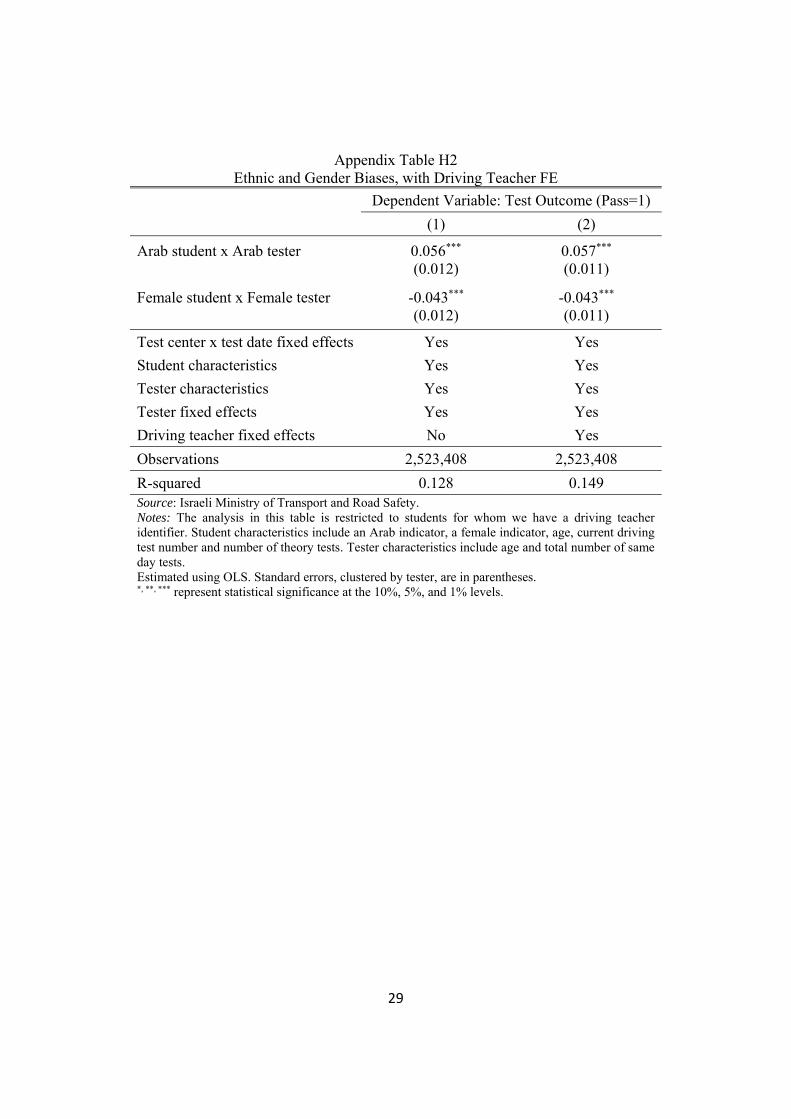
29
Appendix Table H2 Ethnic and Gender Biases, with Driving Teacher FE
Dependent Variable: Test Outcome (Pass=1) (1) (2)
Arab student x Arab tester 0.056*** 0.057*** (0.012) (0.011)
Female student x Female tester -0.043*** -0.043*** (0.012) (0.011)
Test center x test date fixed effects Yes Yes Student characteristics Yes Yes Tester characteristics Yes Yes Tester fixed effects Yes Yes Driving teacher fixed effects No Yes Observations 2,523,408 2,523,408 R-squared 0.128 0.149 Source: Israeli Ministry of Transport and Road Safety. Notes: The analysis in this table is restricted to students for whom we have a driving teacher identifier. Student characteristics include an Arab indicator, a female indicator, age, current driving test number and number of theory tests. Tester characteristics include age and total number of same day tests. Estimated using OLS. Standard errors, clustered by tester, are in parentheses. *, **, *** represent statistical significance at the 10%, 5%, and 1% levels.
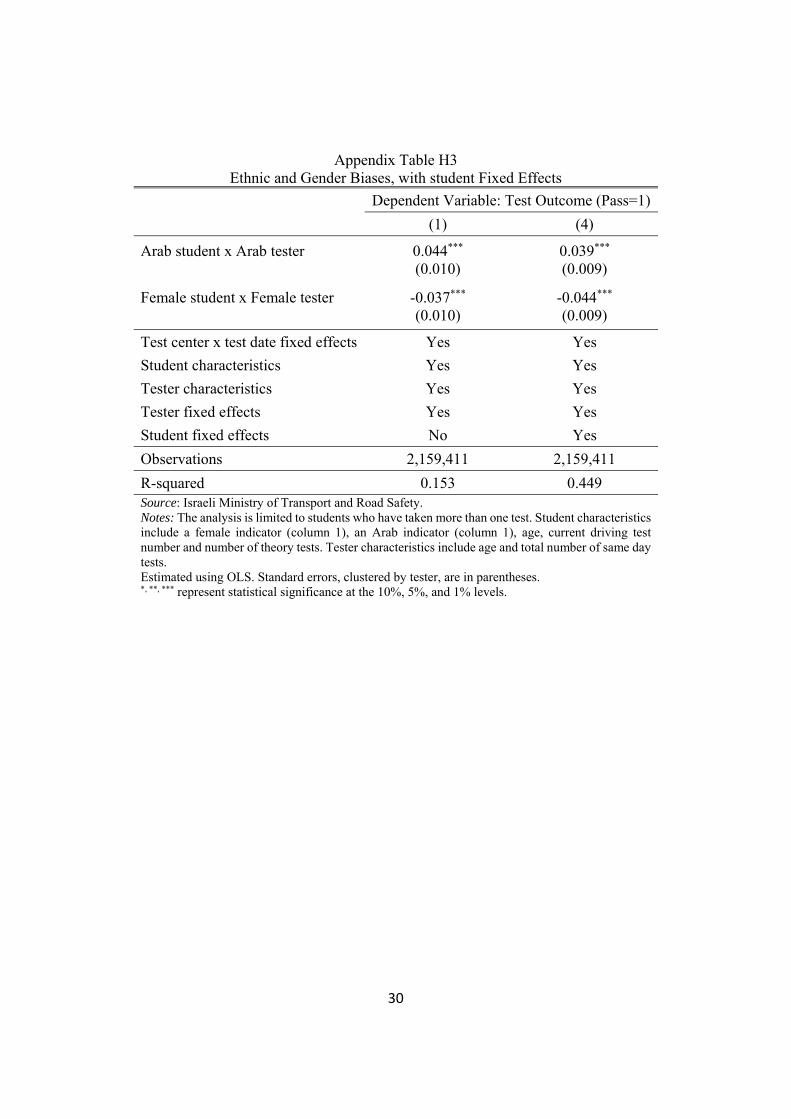
30
Appendix Table H3 Ethnic and Gender Biases, with student Fixed Effects
Dependent Variable: Test Outcome (Pass=1) (1) (4)
Arab student x Arab tester 0.044*** 0.039*** (0.010) (0.009)
Female student x Female tester -0.037*** -0.044*** (0.010) (0.009)
Test center x test date fixed effects Yes Yes Student characteristics Yes Yes Tester characteristics Yes Yes Tester fixed effects Yes Yes Student fixed effects No Yes Observations 2,159,411 2,159,411 R-squared 0.153 0.449 Source: Israeli Ministry of Transport and Road Safety. Notes: The analysis is limited to students who have taken more than one test. Student characteristics include a female indicator (column 1), an Arab indicator (column 1), age, current driving test number and number of theory tests. Tester characteristics include age and total number of same day tests. Estimated using OLS. Standard errors, clustered by tester, are in parentheses. *, **, *** represent statistical significance at the 10%, 5%, and 1% levels.
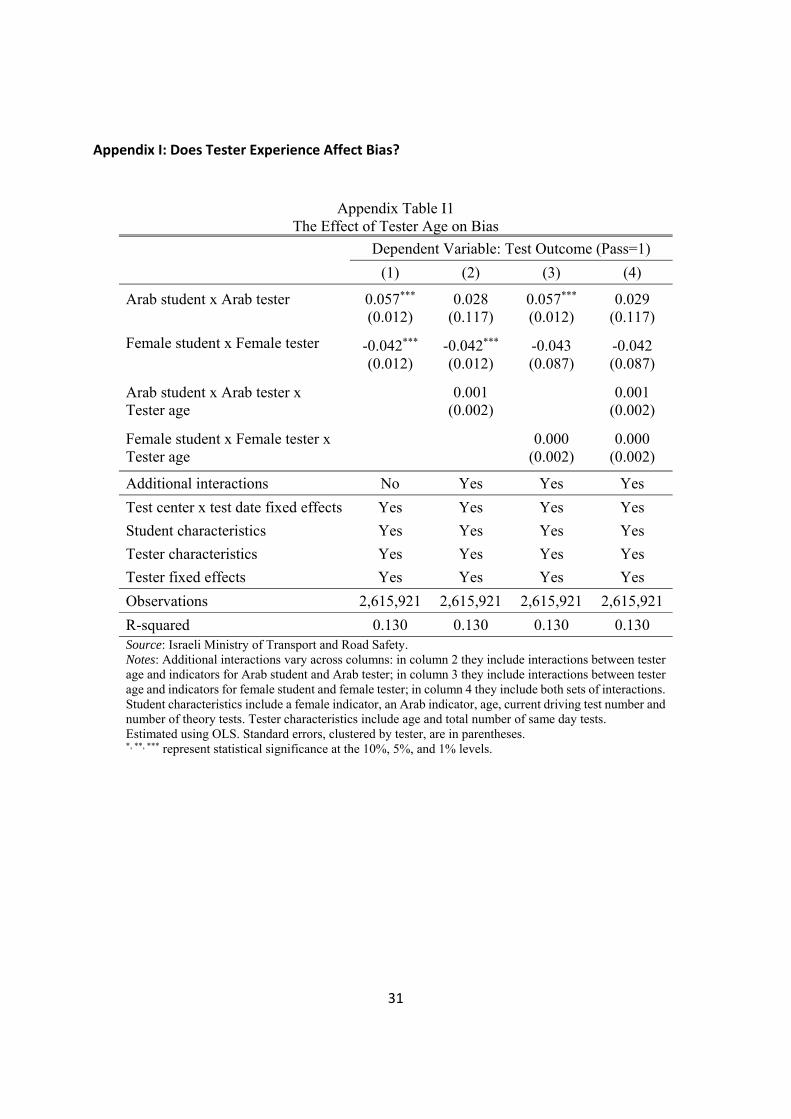
31
Appendix I: Does Tester Experience Affect Bias?
Appendix Table I1 The Effect of Tester Age on Bias
Dependent Variable: Test Outcome (Pass=1) (1) (2) (3) (4)
Arab student x Arab tester 0.057*** 0.028 0.057*** 0.029 (0.012) (0.117) (0.012) (0.117)
Female student x Female tester -0.042*** -0.042*** -0.043 -0.042 (0.012) (0.012) (0.087) (0.087)
Arab student x Arab tester x Tester age
0.001 0.001 (0.002) (0.002)
Female student x Female tester x Tester age
0.000 0.000 (0.002) (0.002)
Additional interactions No Yes Yes Yes Test center x test date fixed effects Yes Yes Yes Yes Student characteristics Yes Yes Yes Yes Tester characteristics Yes Yes Yes Yes Tester fixed effects Yes Yes Yes Yes Observations 2,615,921 2,615,921 2,615,921 2,615,921 R-squared 0.130 0.130 0.130 0.130 Source: Israeli Ministry of Transport and Road Safety. Notes: Additional interactions vary across columns: in column 2 they include interactions between tester age and indicators for Arab student and Arab tester; in column 3 they include interactions between tester age and indicators for female student and female tester; in column 4 they include both sets of interactions. Student characteristics include a female indicator, an Arab indicator, age, current driving test number and number of theory tests. Tester characteristics include age and total number of same day tests. Estimated using OLS. Standard errors, clustered by tester, are in parentheses. *, **, *** represent statistical significance at the 10%, 5%, and 1% levels.
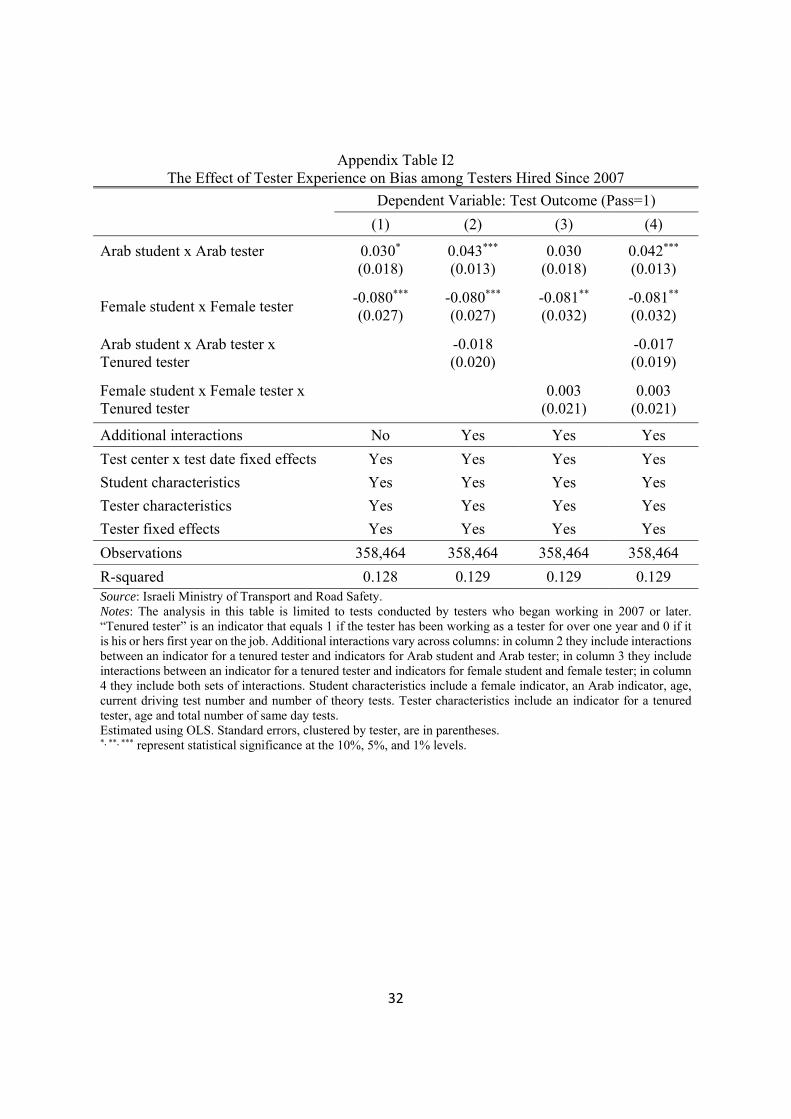
32
Appendix Table I2 The Effect of Tester Experience on Bias among Testers Hired Since 2007
Dependent Variable: Test Outcome (Pass=1) (1) (2) (3) (4)
Arab student x Arab tester 0.030* 0.043*** 0.030 0.042*** (0.018) (0.013) (0.018) (0.013)
Female student x Female tester -0.080*** -0.080*** -0.081** -0.081** (0.027) (0.027) (0.032) (0.032)
Arab student x Arab tester x Tenured tester
-0.018 -0.017 (0.020) (0.019)
Female student x Female tester x Tenured tester
0.003 0.003 (0.021) (0.021)
Additional interactions No Yes Yes Yes Test center x test date fixed effects Yes Yes Yes Yes Student characteristics Yes Yes Yes Yes Tester characteristics Yes Yes Yes Yes Tester fixed effects Yes Yes Yes Yes Observations 358,464 358,464 358,464 358,464 R-squared 0.128 0.129 0.129 0.129 Source: Israeli Ministry of Transport and Road Safety. Notes: The analysis in this table is limited to tests conducted by testers who began working in 2007 or later. “Tenured tester” is an indicator that equals 1 if the tester has been working as a tester for over one year and 0 if it is his or hers first year on the job. Additional interactions vary across columns: in column 2 they include interactions between an indicator for a tenured tester and indicators for Arab student and Arab tester; in column 3 they include interactions between an indicator for a tenured tester and indicators for female student and female tester; in column 4 they include both sets of interactions. Student characteristics include a female indicator, an Arab indicator, age, current driving test number and number of theory tests. Tester characteristics include an indicator for a tenured tester, age and total number of same day tests. Estimated using OLS. Standard errors, clustered by tester, are in parentheses. *, **, *** represent statistical significance at the 10%, 5%, and 1% levels.
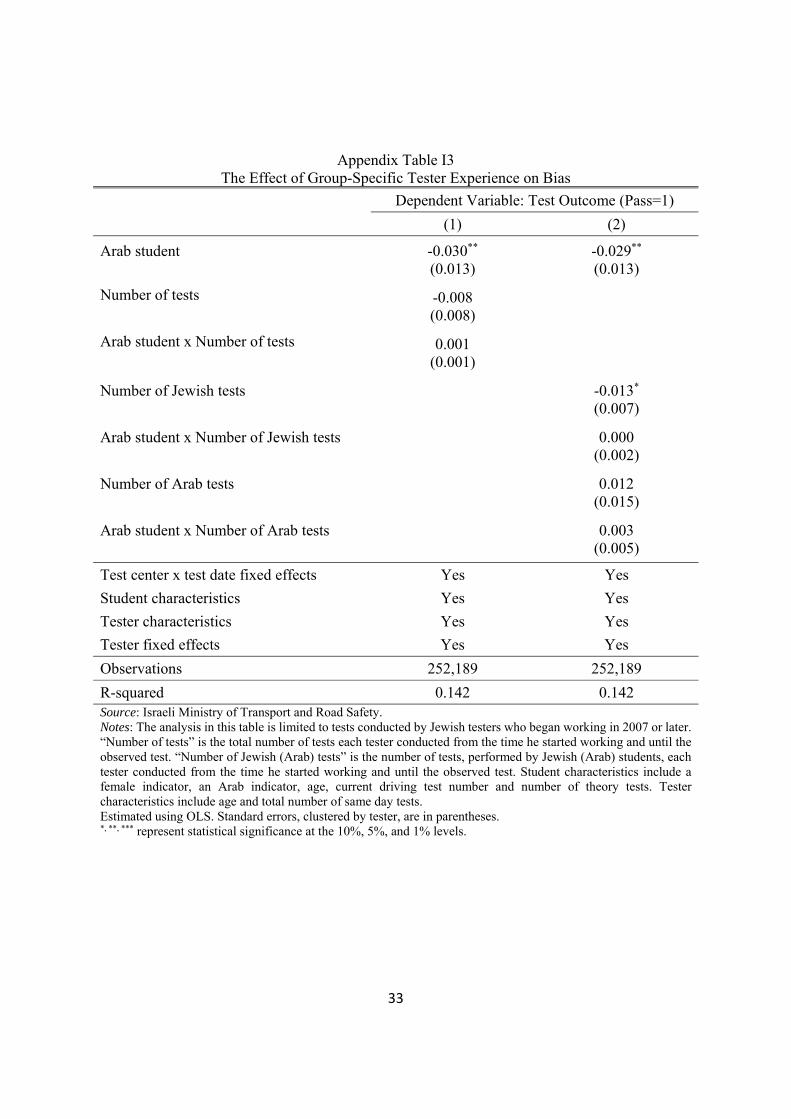
33
Appendix Table I3 The Effect of Group-Specific Tester Experience on Bias
Dependent Variable: Test Outcome (Pass=1) (1) (2)
Arab student -0.030** -0.029** (0.013) (0.013)
Number of tests -0.008 (0.008)
Arab student x Number of tests 0.001 (0.001)
Number of Jewish tests -0.013* (0.007)
Arab student x Number of Jewish tests 0.000 (0.002)
Number of Arab tests 0.012 (0.015)
Arab student x Number of Arab tests 0.003 (0.005)
Test center x test date fixed effects Yes Yes Student characteristics Yes Yes Tester characteristics Yes Yes Tester fixed effects Yes Yes Observations 252,189 252,189 R-squared 0.142 0.142 Source: Israeli Ministry of Transport and Road Safety. Notes: The analysis in this table is limited to tests conducted by Jewish testers who began working in 2007 or later. “Number of tests” is the total number of tests each tester conducted from the time he started working and until the observed test. “Number of Jewish (Arab) tests” is the number of tests, performed by Jewish (Arab) students, each tester conducted from the time he started working and until the observed test. Student characteristics include a female indicator, an Arab indicator, age, current driving test number and number of theory tests. Tester characteristics include age and total number of same day tests. Estimated using OLS. Standard errors, clustered by tester, are in parentheses. *, **, *** represent statistical significance at the 10%, 5%, and 1% levels.
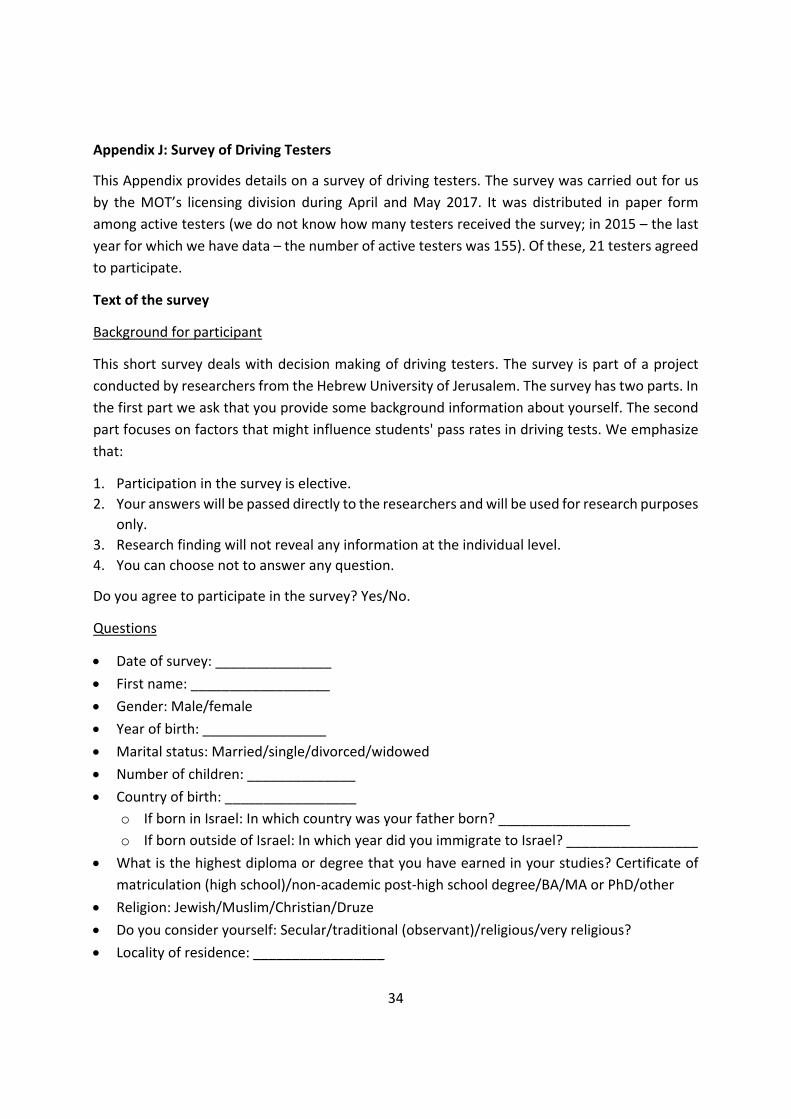
34
Appendix J: Survey of Driving Testers
This Appendix provides details on a survey of driving testers. The survey was carried out for us by the MOT’s licensing division during April and May 2017. It was distributed in paper form among active testers (we do not know how many testers received the survey; in 2015 – the last year for which we have data – the number of active testers was 155). Of these, 21 testers agreed to participate.
Text of the survey
Background for participant
This short survey deals with decision making of driving testers. The survey is part of a project conducted by researchers from the Hebrew University of Jerusalem. The survey has two parts. In the first part we ask that you provide some background information about yourself. The second part focuses on factors that might influence students' pass rates in driving tests. We emphasize that:
1. Participation in the survey is elective. 2. Your answers will be passed directly to the researchers and will be used for research purposes
only. 3. Research finding will not reveal any information at the individual level. 4. You can choose not to answer any question.
Do you agree to participate in the survey? Yes/No.
Questions
Date of survey: _______________ First name: __________________ Gender: Male/female Year of birth: ________________ Marital status: Married/single/divorced/widowed Number of children: ______________ Country of birth: _________________
o If born in Israel: In which country was your father born? _________________ o If born outside of Israel: In which year did you immigrate to Israel? _________________
What is the highest diploma or degree that you have earned in your studies? Certificate of matriculation (high school)/non‐academic post‐high school degree/BA/MA or PhD/other
Religion: Jewish/Muslim/Christian/Druze Do you consider yourself: Secular/traditional (observant)/religious/very religious? Locality of residence: _________________

35
The mean net income of a family in Israel is NIS 15,000 per month. Is your family's income: higher than NIS 15,000/about NIS 15,000/lower than NIS 15,000?
In which year did you start working as a driving tester? _________________ In what Ministry of Transport region/s do you currently work or have worked in the past?
North/Center/Be'er Sehva and Negev/Jerusalem and South. The test form filled by the tester during the test consists of three categories: “control of the
vehicle”, “traffic” and “the road”. As far as you are concerned, which of the categories is most important for passing the test? Control of the vehicle/traffic/the road/all are equally important.
Below is a list of other factors related to the test. For each of these factors, please indicate whether and how this factor influences the likelihood of success in the test.
The season in which the test is held o The likelihood of success is highest in tests held in the: Winter (Dec‐Feb)/ Spring (Mar‐
May)/ Summer (Jun‐Aug)/ Fall (Sep‐Nov)/ there is no difference in the likelihood of success across the seasons.
The day of week in which the test is held o The likelihood of success is highest in tests held on: Sunday/ Monday/ Tuesday/
Wednesday/ Thursday/ Friday/ there is no difference in the likelihood of success across the days of the week.
Test number o The likelihood of success is highest in the: First test/ second test/ third test/ fourth
test/ there is no difference in the likelihood of success across the tests.
Next we ask you to evaluate, based on your own experience as a driving tester, the average driving skills exhibited during the test by students from different groups. For each group, please indicate a number between 0 and 10, where 0 refers to very poor driving skills and 10 refers to excellent driving skills.
The average driving skills exhibited by Jewish males is:________________ The average driving skills exhibited by Arab males is:_________________ The average driving skills exhibited by Jewish females is:______________ The average driving skills exhibited by Arab females is:________________
Please share with us any other thoughts or remarks you might have about the driving tests.
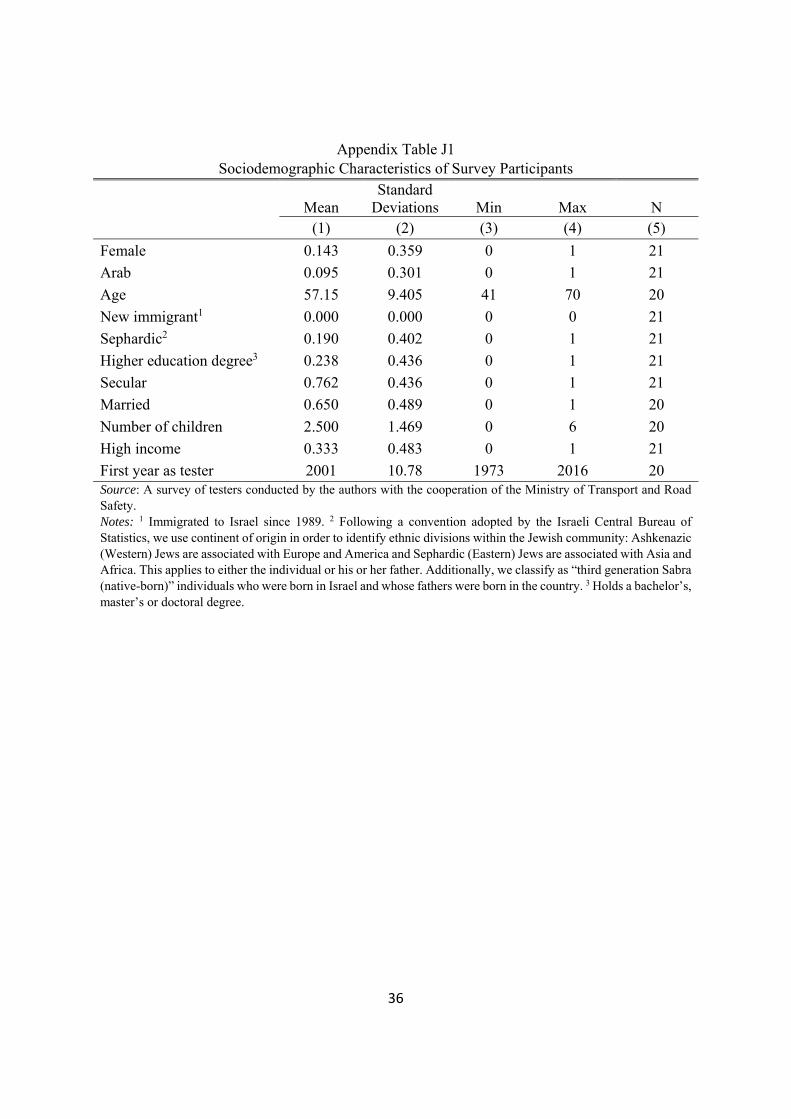
36
Appendix Table J1 Sociodemographic Characteristics of Survey Participants
Mean Standard
Deviations Min Max N (1) (2) (3) (4) (5)
Female 0.143 0.359 0 1 21 Arab 0.095 0.301 0 1 21 Age 57.15 9.405 41 70 20 New immigrant1 0.000 0.000 0 0 21 Sephardic2 0.190 0.402 0 1 21 Higher education degree3 0.238 0.436 0 1 21 Secular 0.762 0.436 0 1 21 Married 0.650 0.489 0 1 20 Number of children 2.500 1.469 0 6 20 High income 0.333 0.483 0 1 21 First year as tester 2001 10.78 1973 2016 20 Source: A survey of testers conducted by the authors with the cooperation of the Ministry of Transport and Road Safety. Notes: 1 Immigrated to Israel since 1989. 2 Following a convention adopted by the Israeli Central Bureau of Statistics, we use continent of origin in order to identify ethnic divisions within the Jewish community: Ashkenazic (Western) Jews are associated with Europe and America and Sephardic (Eastern) Jews are associated with Asia and Africa. This applies to either the individual or his or her father. Additionally, we classify as “third generation Sabra (native-born)” individuals who were born in Israel and whose fathers were born in the country. 3 Holds a bachelor’s, master’s or doctoral degree.
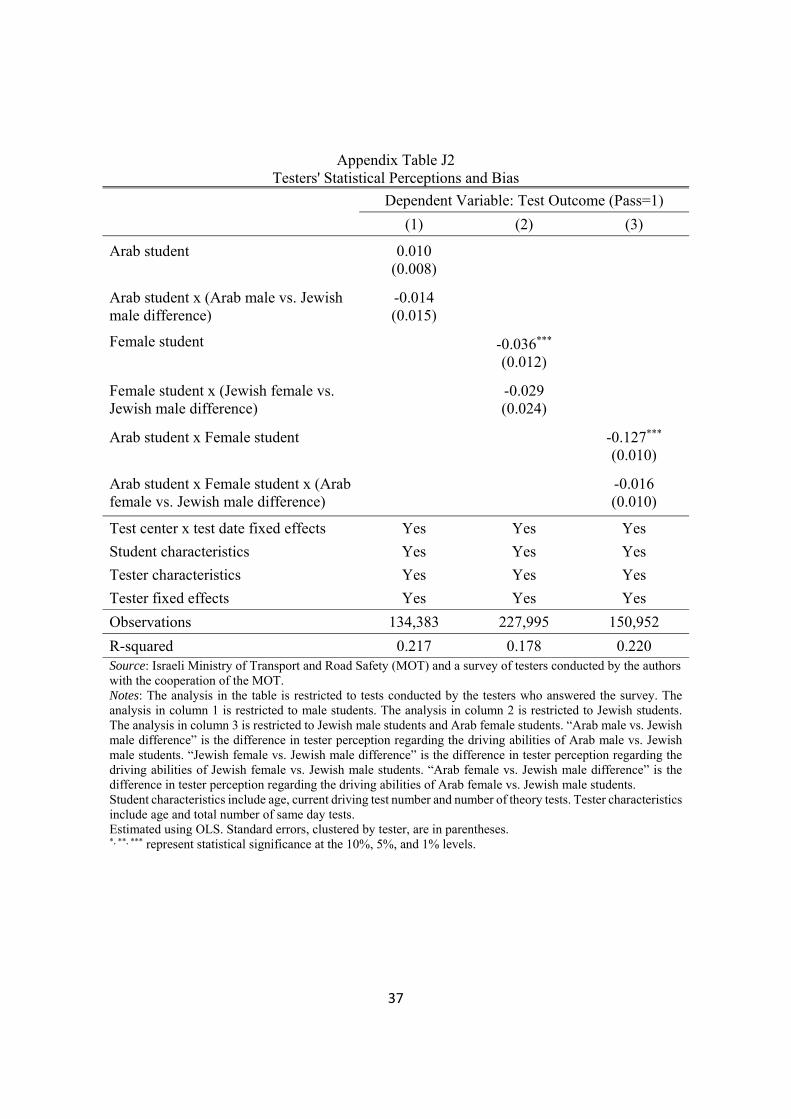
37
Appendix Table J2 Testers' Statistical Perceptions and Bias
Dependent Variable: Test Outcome (Pass=1) (1) (2) (3)
Arab student 0.010 (0.008)
Arab student x (Arab male vs. Jewish male difference)
-0.014 (0.015)
Female student -0.036*** (0.012)
Female student x (Jewish female vs. Jewish male difference)
-0.029 (0.024)
Arab student x Female student -0.127*** (0.010)
Arab student x Female student x (Arab female vs. Jewish male difference)
-0.016 (0.010)
Test center x test date fixed effects Yes Yes Yes Student characteristics Yes Yes Yes Tester characteristics Yes Yes Yes Tester fixed effects Yes Yes Yes Observations 134,383 227,995 150,952 R-squared 0.217 0.178 0.220 Source: Israeli Ministry of Transport and Road Safety (MOT) and a survey of testers conducted by the authors with the cooperation of the MOT. Notes: The analysis in the table is restricted to tests conducted by the testers who answered the survey. The analysis in column 1 is restricted to male students. The analysis in column 2 is restricted to Jewish students. The analysis in column 3 is restricted to Jewish male students and Arab female students. “Arab male vs. Jewish male difference” is the difference in tester perception regarding the driving abilities of Arab male vs. Jewish male students. “Jewish female vs. Jewish male difference” is the difference in tester perception regarding the driving abilities of Jewish female vs. Jewish male students. “Arab female vs. Jewish male difference” is the difference in tester perception regarding the driving abilities of Arab female vs. Jewish male students. Student characteristics include age, current driving test number and number of theory tests. Tester characteristics include age and total number of same day tests. Estimated using OLS. Standard errors, clustered by tester, are in parentheses. *, **, *** represent statistical significance at the 10%, 5%, and 1% levels.

38
Appendix K: Motorcycle Tests
Institutional Details
The institutional details concerning motorcycle tests are almost identical to those concerning private vehicle tests, including in terms of the assignment procedure. The motorcycle test has two parts. In the first part, a few dozen students (each with his teacher’s motorcycle) and a tester gather in a large parking lot. The tester stands at the edge of the parking lot with a list of the students assigned to be tested on that day. He goes down the list and asks each student in turn to perform the following tasks: (1) driving slowly along a straight line; (2) stopping using the front and rear brakes; (3) zigzagging between obstacles and (4) driving in circles. Since the tester observes the students and knows their names, he is aware of their ethnicity and gender.
Those students who passed the first part of the test, continue to the second, which is conducted on city streets outside of the test center. The tester drives his own motorcycle, followed by three students at a time on their motorcycles. It is important to note that the tester is aware at all times which student is driving which motorcycle (so that he can correctly evaluate his driving). Overall, the two parts of the test last for about an hour.
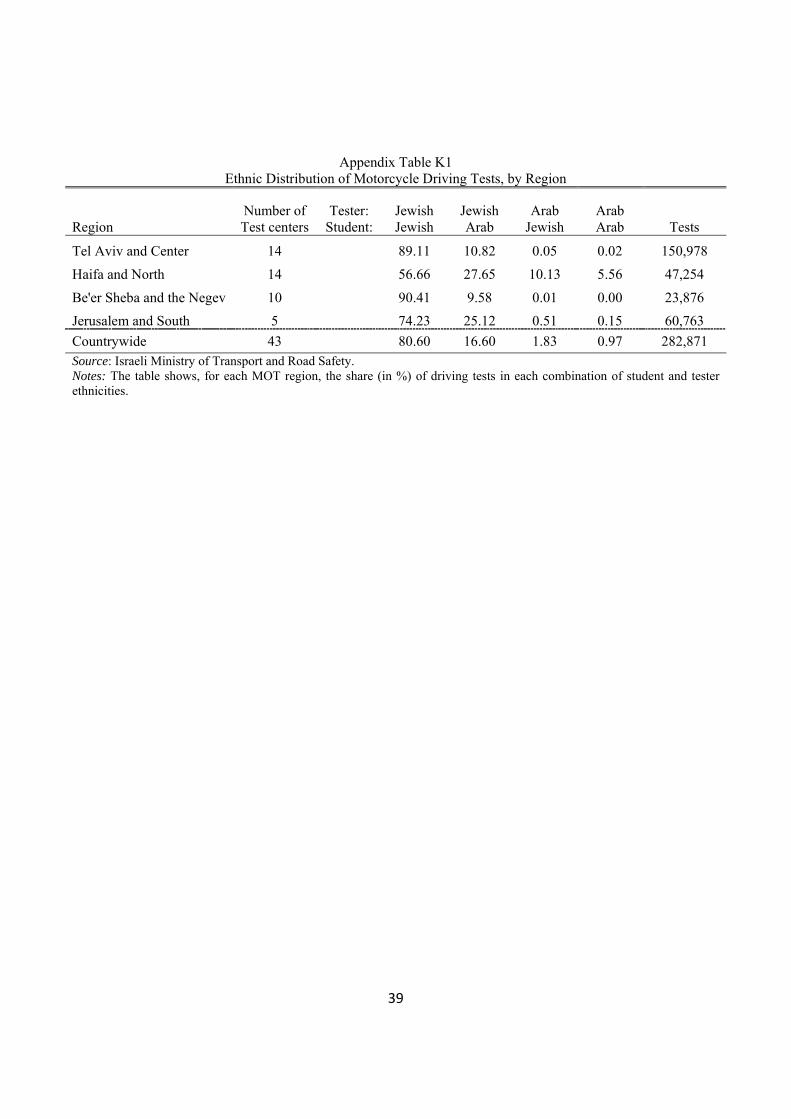
39
Appendix Table K1 Ethnic Distribution of Motorcycle Driving Tests, by Region
Region Number of Test centers
Tester: Student:
Jewish Jewish
Jewish Arab
Arab Jewish
Arab Arab Tests
Tel Aviv and Center 14 89.11 10.82 0.05 0.02 150,978
Haifa and North 14 56.66 27.65 10.13 5.56 47,254
Be'er Sheba and the Negev 10 90.41 9.58 0.01 0.00 23,876 Jerusalem and South 5 74.23 25.12 0.51 0.15 60,763 Countrywide 43 80.60 16.60 1.83 0.97 282,871 Source: Israeli Ministry of Transport and Road Safety. Notes: The table shows, for each MOT region, the share (in %) of driving tests in each combination of student and tester ethnicities.
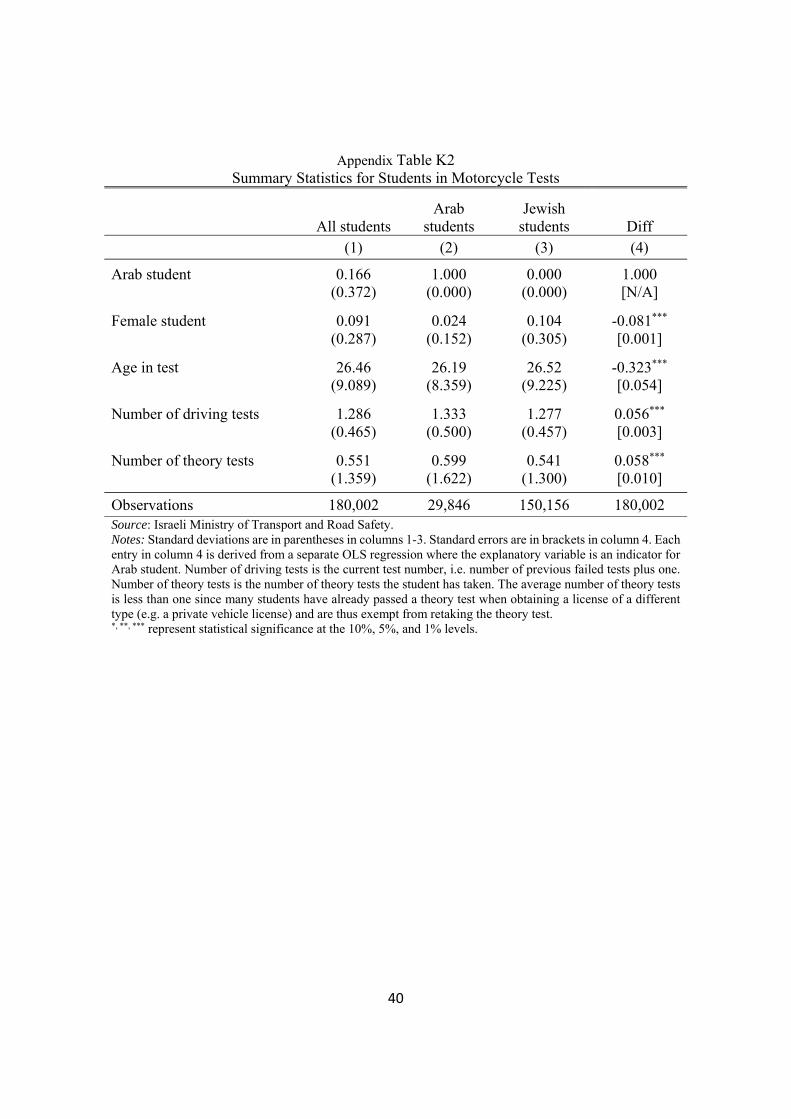
40
Appendix Table K2 Summary Statistics for Students in Motorcycle Tests
All students
Arab students
Jewish students Diff
(1) (2) (3) (4)
Arab student 0.166 1.000 0.000 1.000 (0.372) (0.000) (0.000) [N/A]
Female student 0.091 0.024 0.104 -0.081*** (0.287) (0.152) (0.305) [0.001]
Age in test 26.46 26.19 26.52 -0.323*** (9.089) (8.359) (9.225) [0.054]
Number of driving tests 1.286 1.333 1.277 0.056*** (0.465) (0.500) (0.457) [0.003]
Number of theory tests 0.551 0.599 0.541 0.058*** (1.359) (1.622) (1.300) [0.010]
Observations 180,002 29,846 150,156 180,002 Source: Israeli Ministry of Transport and Road Safety. Notes: Standard deviations are in parentheses in columns 1-3. Standard errors are in brackets in column 4. Each entry in column 4 is derived from a separate OLS regression where the explanatory variable is an indicator for Arab student. Number of driving tests is the current test number, i.e. number of previous failed tests plus one. Number of theory tests is the number of theory tests the student has taken. The average number of theory tests is less than one since many students have already passed a theory test when obtaining a license of a different type (e.g. a private vehicle license) and are thus exempt from retaking the theory test. *, **, *** represent statistical significance at the 10%, 5%, and 1% levels.
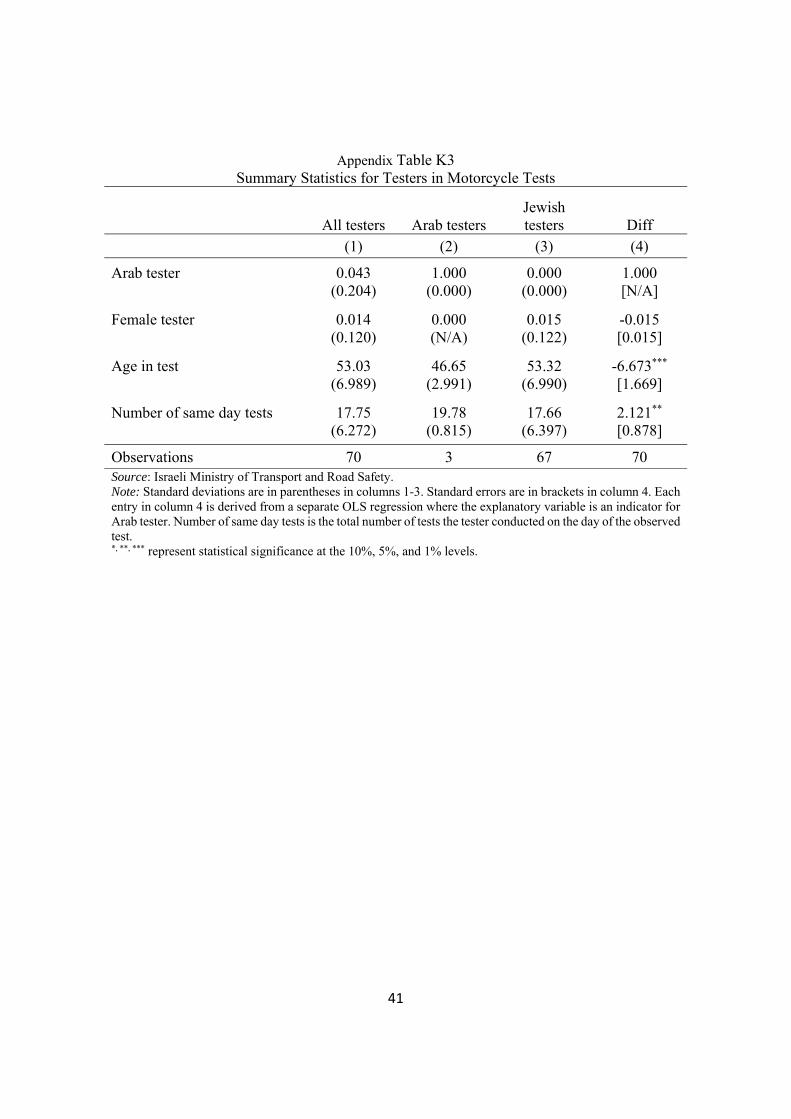
41
Appendix Table K3 Summary Statistics for Testers in Motorcycle Tests
All testers Arab testers Jewish testers Diff
(1) (2) (3) (4)
Arab tester 0.043 1.000 0.000 1.000 (0.204) (0.000) (0.000) [N/A]
Female tester 0.014 0.000 0.015 -0.015 (0.120) (N/A) (0.122) [0.015]
Age in test 53.03 46.65 53.32 -6.673*** (6.989) (2.991) (6.990) [1.669]
Number of same day tests 17.75 19.78 17.66 2.121** (6.272) (0.815) (6.397) [0.878]
Observations 70 3 67 70 Source: Israeli Ministry of Transport and Road Safety. Note: Standard deviations are in parentheses in columns 1-3. Standard errors are in brackets in column 4. Each entry in column 4 is derived from a separate OLS regression where the explanatory variable is an indicator for Arab tester. Number of same day tests is the total number of tests the tester conducted on the day of the observed test. *, **, *** represent statistical significance at the 10%, 5%, and 1% levels.

42
Appendix Table K4 Balancing Tests for Motorcycle Tests, By Ethnicity
Mean
Differences in Means Arab vs. Jewish Tester
Arab Tester Jewish Tester No controls With FE (1) (2) (3) (4)
Arab student 0.347 0.171 0.176*** 0.015*** (0.476) (0.376) [0.005] [0.005]
Female student 0.033 0.078 -0.045*** -0.009*** (0.180) (0.269) [0.002] [0.002]
Age of student at test 25.84 26.07 -0.233** -0.560*** (9.499) (9.150) [0.108] [0.117]
Number of driving tests 1.674 1.557 0.117*** 0.114*** (0.994) (0.922) [0.011] [0.012]
Number of theory tests 0.618 0.633 -0.015 -0.046** (1.441) (1.469) [0.016] [0.018]
Observations 7,915 274,956 282,871 282,871 Source: Israeli Ministry of Transport and Road Safety. Notes: Standard deviations are in parentheses in columns 1-2. Standard errors are in brackets in columns 3-4. Each entry in columns 3 and 4 is derived from a separate OLS regression where the explanatory variable is an indicator for Arab tester. Column 4 includes test center fixed effects. Note that in the case of motorcycle tests, it is impossible to use (test center x test date) fixed effects, as we have done in the balancing checks for private vehicle tests. This is because in a given test center and test date there is usually only one tester conducting motorcycle tests, and in the days with more than one tester there is no variation in tester ethnic identity. *, **, *** represent statistical significance at the 10%, 5%, and 1% levels.
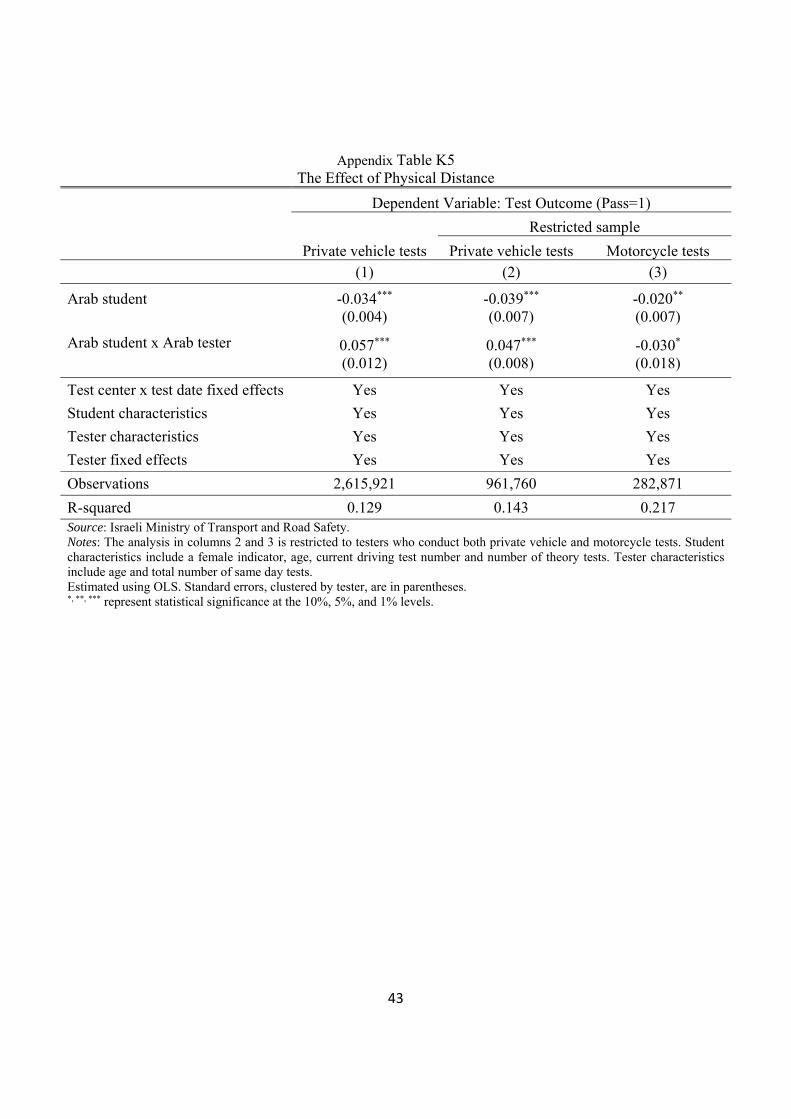
43
Appendix Table K5 The Effect of Physical Distance
Dependent Variable: Test Outcome (Pass=1) Restricted sample Private vehicle tests Private vehicle tests Motorcycle tests (1) (2) (3)
Arab student -0.034*** -0.039*** -0.020** (0.004) (0.007) (0.007)
Arab student x Arab tester 0.057*** 0.047*** -0.030* (0.012) (0.008) (0.018)
Test center x test date fixed effects Yes Yes Yes Student characteristics Yes Yes Yes Tester characteristics Yes Yes Yes Tester fixed effects Yes Yes Yes Observations 2,615,921 961,760 282,871 R-squared 0.129 0.143 0.217 Source: Israeli Ministry of Transport and Road Safety. Notes: The analysis in columns 2 and 3 is restricted to testers who conduct both private vehicle and motorcycle tests. Student characteristics include a female indicator, age, current driving test number and number of theory tests. Tester characteristics include age and total number of same day tests. Estimated using OLS. Standard errors, clustered by tester, are in parentheses. *, **, *** represent statistical significance at the 10%, 5%, and 1% levels.