Embed Size (px)
Citation preview
Idiosyncratic Risk and Expected Return: Evidence from
Non-Financial Sector of Pakistan
Kashif Saleem* Sajid Rahman Khattak
† and Kashif Amin
‡
Abstract The central theme of this research paper is about the role of
idiosyncratic risk in stock returns of non-financial sector of Pakistan
Stock Exchange. In the framework of asset pricing model, literature
suggests that idiosyncratic risk is independent to the specific assets
therefore it has no role in explaining the returns. However, modern
portfolio theory suggests that in an under diversified portfolio,
idiosyncratic risk has positive relationship with stock returns, while the
negative association of idiosyncratic risk has also been reported by
different scholars. To settle this issue in the context of Pakistan, the
present study investigates the role of idiosyncratic risk empirically in
non-financial sector of Pakistan. The daily and monthly data are taken
from January 2005 to 2016 for analysis. Various types of statistical
tools are applied to examine the association between idiosyncratic risk
and stocks returns. Cross sectional regression is used for testing the
association between expected conditional idiosyncratic risk and
returns. Conditional idiosyncratic risk is estimated through EGARCH
model. The empirical results showed that conditional idiosyncratic risk
and return of non-financial, firms has significant positive relationship
after controlling different factors such as value, momentum and size,
whereas the lag idiosyncratic risk has no relationship with stock
returns. The empirical evidence confirms the prediction of previous
studies. At the end it is suggested that investors can develop profitable
portfolio after considering the idiosyncratic risk.
Keywords: Idiosyncratic Risk, Stock Returns, Non-Financial Sector,
EGARCH, Cross Sectional Regression
Introduction
Modern era is using the latest techniques and operational methods in the
business industry where various factors are combined and studied jointly.
Portfolio investment is one of the hottest concepts in the present research
* Kashif Saleem, PhD Scholar Qurtuba University of Science and Technology
Peshawar. Email: [email protected] † Dr. Sajid Rahman Khattak, Assistant Professor, IBMS, Agriculture University
Peshawar. ‡ Dr. Kashif Ameen, Assistant Professor, Qurtuba University of Science and
Technology Peshawar.
Idiosyncratic Risk and Expected Return… Saleem, Khattak and Amin
Journal of Managerial Sciences 2 Volume XII Number 02
era. It has turned out to be a very demanding concept that has been
studied, altered, devised and implemented by different business
organizations from time to time in order to maximize their profit.
Institutional investors as well as individual investors both take part in
observing the market behavior and design portfolio accordingly. But due
to lack of knowledge, investors fail, to make a perfect investment
portfolio which finally leads towards businesses losses. Thus, the
purpose of portfolio investment is to achieve optimal expected return
from number of assets (Pástor, 2000).
Literature Review
Prior studies suggest that only systematic risk is a potential
predictor of expected returns Ohlson and Rosenberg (1982); Rosenberg
and Guy (1976). Incase of asset protfolio many investors take systemetic
risk into consideration and think that the idiosyncratic risk minimizes
itself. However, Merton (1987) discusses that idiosyncratic risk is more
useful predictor for expected returns if portfolio is under-diversified. He
argued that stock returns have a positive relationship with idiosyncratic
risk. Miller (1977) contradicting the theory of Merton (1987) with more
robust results, suggested that there exists a negative relationship between
idiosyncratic risk and expected return.
Modern Portfolio Theory suggested that through vast
diversification the stock portfolio minimizes the idiosyncratic risk. The
CAPM being an extension of the portfolio theory proposes that
equilibrium is maintained by investors in a market portfolio. The capital
asset pricing model (CAPM) which was founded based on portfolio
theory predicts that equilibrium is held by all investors. Thus, empirical
evidence of the idiosyncratic risk provides mixed results in finance
literature in recent years. Hence the consequences are found to be far
beyond the consensus. Ang, Hodrick, Xing, and Zhang (2006) extended
the work on CAPM and found a positive relationship between risk and
returns at firm level. On the other hand, Ang et al. (2006) analyzed a
strong negative relationship between idiosyncratic risk and expected
return. While Bali and Cakici (2008) found no significant relationship
between expected return and idiosyncratic risk. Fu (2009) based on
Fama and French three factor model proposed that conditional
idiosyncratic risk had a positive relationship with expected return by
using E-GARCH model. The findings of these research studies differ
from country to country. Pakistan being an emerging economy of South
Asia and an ideal market for investment, has investors who are preferring
to invest in non-financial sectors for making a profitable portfolio.
However, a state of pessimism persuades these investors to back off to
Idiosyncratic Risk and Expected Return… Saleem, Khattak and Amin
Journal of Managerial Sciences 3 Volume XII Number 02
minimize the risk of making losses. To diversify the risk, investors make
portfolio investments. Further, investors are more attentive to market risk
and think it to be a potential predictor of returns. Whereas, according to
Goetzmann and Kumar (2004) investors undermine the idiosyncratic risk
and think that such risk is not necessary to be diversified in portfolio
investment. A lot of literature is available about this relationship but
opinions obtained vary from case to case. There exists a vast gap in
literature where separate analysis in these two sectors has not been made.
Thus, the study in hand attempts to answer the research question that
whether idiosyncratic risk impact expected return of nonfinancial firms
listed on Pakistan Stock Exchange or not?
Research Methodology
Population and Sample
The population of this research comprises of registered companies of
Pakistan Stock Exchange (PSX). Out of these 554 companies, there are
91 financial companies and 463 are non-financial companies (PSX,
2016). The most renowned characteristic of non-financial companies is
that it is totally distinguished from its owners.
Simple random sampling technique has been used for selecting
the total sample size. The total sample size contains the daily data as well
as monthly data of stock prices of non-financial companies. According to
the criteria, out of 416 non-financial firms, 210 firms have been selected.
In this study, researcher used secondary data to test the proposed
hypothesis. Daily closing value and balance sheets of the companies for
the period 1st Jan 2005 to 31st December 2016 has been used.
The six portfolios have been developed on this process. The
study labels theses portfolios with different names. Firms having highest
size and highest book to market ratio is labeled BHNFC, which stands for
Big high from non-financial companies. The firms having big size and
medium book to market ratio is labeled as BMNFC big medium for non-
financial companies. The firms having big size and lowest book to
market ratio have been labeled as BLNFC big low for non-financial
companies. As said earlier, firms having small market capitalization are
called Small size firms. Firms having lowest size and highest book to
market ratio have been labeled as SHNFC small high for non-financial
companies. The firms having small size and medium book to market
ratio have been labeled as SMNFC Small medium for non-financial
companies. The firms having small size and lowest book to market ratio
have been labeled as S/LNFC Small low for non-financial companies.
Because of the above portfolios, two more variables such as SMBNFC and
HMLNFC are for non-financial companies have been developed. The
Idiosyncratic Risk and Expected Return… Saleem, Khattak and Amin
Journal of Managerial Sciences 4 Volume XII Number 02
returns of SMBNFC factor are considered as size of the firm, while the
returns of HMLNFC factor is considered as value of the firm. SMBNFC can
be calculated by subtracting the small size weighted average market
capitalization returns from the weighted average portfolio of big size
market capitalization firms.
Mathematically it can be written as:
SMBNFC = (S/LNFC+S/MNFC+S/HNFC)/3 - (B/LNFC+B/MNFC+B/LNFC)/3….1
Similarly, the HML factor can be obtained by subtracting the return of
portfolio of Low book to market ratio from returns of high book to
market ratio.
Mathematically it can be written as:
HMLNFC = [S/HNFC + B/HNFC]/2 – [S/LNFC + B/LNFC]/2 …………….2
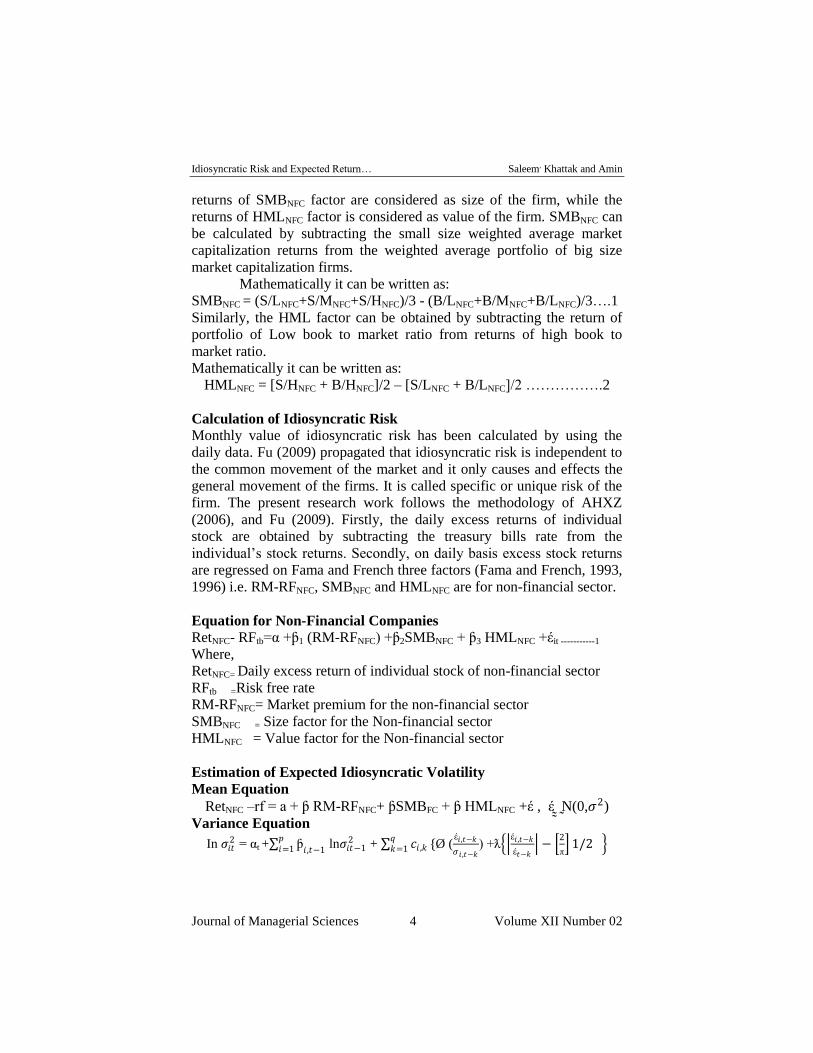
Calculation of Idiosyncratic Risk
Monthly value of idiosyncratic risk has been calculated by using the
daily data. Fu (2009) propagated that idiosyncratic risk is independent to
the common movement of the market and it only causes and effects the
general movement of the firms. It is called specific or unique risk of the
firm. The present research work follows the methodology of AHXZ
(2006), and Fu (2009). Firstly, the daily excess returns of individual
stock are obtained by subtracting the treasury bills rate from the
individual’s stock returns. Secondly, on daily basis excess stock returns
are regressed on Fama and French three factors (Fama and French, 1993,
1996) i.e. RM-RFNFC, SMBNFC and HMLNFC are for non-financial sector.
Equation for Non-Financial Companies
RetNFC- RFtb=α +ƥ1 (RM-RFNFC) +ƥ2SMBNFC + ƥ3 HMLNFC +έit -----------1
Where,
RetNFC= Daily excess return of individual stock of non-financial sector
RFtb =Risk free rate
RM-RFNFC= Market premium for the non-financial sector
SMBNFC = Size factor for the Non-financial sector
HMLNFC = Value factor for the Non-financial sector
Estimation of Expected Idiosyncratic Volatility
Mean Equation
RetNFC –rf = a + ƥ RM-RFNFC+ ƥSMBFC + ƥ HMLNFC +έ , έ̰̰̰̰ ̰̰N(0,𝜎2)
Variance Equation
In 𝜎𝑖𝑡2 = αt + ƥ
𝑖 ,𝑡−1
𝑝𝑖=1 ln𝜎𝑖𝑡−1
2 + 𝑐𝑖 ,𝑘𝑞𝑘=1 {Ø (
έ𝑖 ,𝑡−𝑘
𝜎𝑖 ,𝑡−𝑘) +ƛ
έ𝑖 ,𝑡−𝑘
έ𝑡−𝑘 −
2
π 1/2
Idiosyncratic Risk and Expected Return… Saleem, Khattak and Amin
Journal of Managerial Sciences 5 Volume XII Number 02
Cross Sectional Regression of Individual Stock
Finally, the study replicates the empirical analysis of the main
result which was produced by Fama and French (1992). The study of
Fama and French (1992) was very influential in the literature of cross
sectional returns.
RetNFCit=ɣ0t + ƛ𝑘𝑘=1 𝐻𝑏𝑖𝑡 +έ𝑟𝑡 , i=1, 2,…,Nt, t=1,2……T
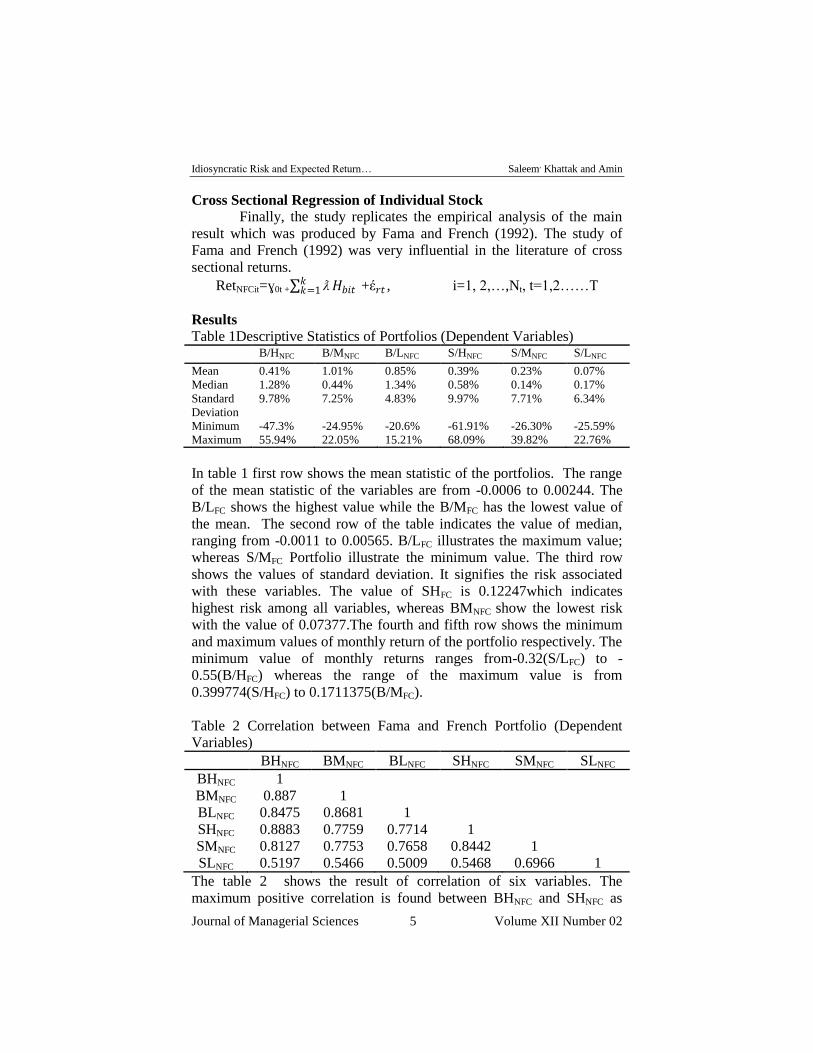
Results
Table 1Descriptive Statistics of Portfolios (Dependent Variables)
B/HNFC B/MNFC B/LNFC S/HNFC S/MNFC S/LNFC
Mean 0.41% 1.01% 0.85% 0.39% 0.23% 0.07% Median 1.28% 0.44% 1.34% 0.58% 0.14% 0.17% Standard
Deviation 9.78% 7.25% 4.83% 9.97% 7.71% 6.34%
Minimum -47.3% -24.95% -20.6% -61.91% -26.30% -25.59% Maximum 55.94% 22.05% 15.21% 68.09% 39.82% 22.76%
In table 1 first row shows the mean statistic of the portfolios. The range
of the mean statistic of the variables are from -0.0006 to 0.00244. The
B/LFC shows the highest value while the B/MFC has the lowest value of
the mean. The second row of the table indicates the value of median,
ranging from -0.0011 to 0.00565. B/LFC illustrates the maximum value;
whereas S/MFC Portfolio illustrate the minimum value. The third row
shows the values of standard deviation. It signifies the risk associated
with these variables. The value of SHFC is 0.12247which indicates
highest risk among all variables, whereas BMNFC show the lowest risk
with the value of 0.07377.The fourth and fifth row shows the minimum
and maximum values of monthly return of the portfolio respectively. The
minimum value of monthly returns ranges from-0.32(S/LFC) to -
0.55(B/HFC) whereas the range of the maximum value is from
0.399774(S/HFC) to 0.1711375(B/MFC).
Table 2 Correlation between Fama and French Portfolio (Dependent
Variables)
BHNFC BMNFC BLNFC SHNFC SMNFC SLNFC
BHNFC 1
BMNFC 0.887 1
BLNFC 0.8475 0.8681 1
SHNFC 0.8883 0.7759 0.7714 1
SMNFC 0.8127 0.7753 0.7658 0.8442 1
SLNFC 0.5197 0.5466 0.5009 0.5468 0.6966 1
The table 2 shows the result of correlation of six variables. The
maximum positive correlation is found between BHNFC and SHNFC as
Idiosyncratic Risk and Expected Return… Saleem, Khattak and Amin
Journal of Managerial Sciences 6 Volume XII Number 02
0.8883whereas the minimum correlation is found between S/L and B/L
as 0.5009.
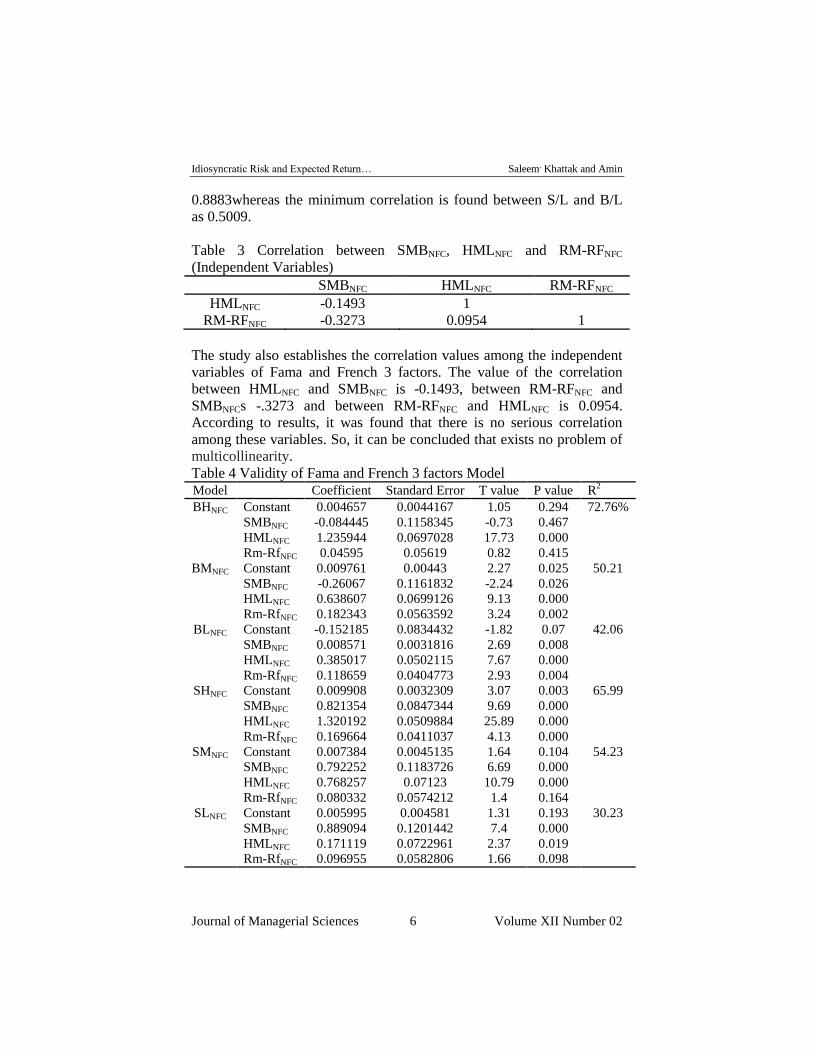
Table 3 Correlation between SMBNFC, HMLNFC and RM-RFNFC
(Independent Variables)
SMBNFC HMLNFC RM-RFNFC
HMLNFC -0.1493 1
RM-RFNFC -0.3273 0.0954 1
The study also establishes the correlation values among the independent
variables of Fama and French 3 factors. The value of the correlation
between HMLNFC and SMBNFC is -0.1493, between RM-RFNFC and
SMBNFCs -.3273 and between RM-RFNFC and HMLNFC is 0.0954.
According to results, it was found that there is no serious correlation
among these variables. So, it can be concluded that exists no problem of
multicollinearity.
Table 4 Validity of Fama and French 3 factors Model
Model Coefficient Standard Error T value P value R2
BHNFC Constant 0.004657 0.0044167 1.05 0.294 72.76%
SMBNFC -0.084445 0.1158345 -0.73 0.467
HMLNFC 1.235944 0.0697028 17.73 0.000
Rm-RfNFC 0.04595 0.05619 0.82 0.415
BMNFC Constant 0.009761 0.00443 2.27 0.025 50.21
SMBNFC -0.26067 0.1161832 -2.24 0.026
HMLNFC 0.638607 0.0699126 9.13 0.000
Rm-RfNFC 0.182343 0.0563592 3.24 0.002
BLNFC Constant -0.152185 0.0834432 -1.82 0.07 42.06
SMBNFC 0.008571 0.0031816 2.69 0.008
HMLNFC 0.385017 0.0502115 7.67 0.000
Rm-RfNFC 0.118659 0.0404773 2.93 0.004
SHNFC Constant 0.009908 0.0032309 3.07 0.003 65.99
SMBNFC 0.821354 0.0847344 9.69 0.000
HMLNFC 1.320192 0.0509884 25.89 0.000
Rm-RfNFC 0.169664 0.0411037 4.13 0.000
SMNFC Constant 0.007384 0.0045135 1.64 0.104 54.23
SMBNFC 0.792252 0.1183726 6.69 0.000
HMLNFC 0.768257 0.07123 10.79 0.000
Rm-RfNFC 0.080332 0.0574212 1.4 0.164
SLNFC Constant 0.005995 0.004581 1.31 0.193 30.23
SMBNFC 0.889094 0.1201442 7.4 0.000
HMLNFC 0.171119 0.0722961 2.37 0.019
Rm-RfNFC 0.096955 0.0582806 1.66 0.098
Idiosyncratic Risk and Expected Return… Saleem, Khattak and Amin
Journal of Managerial Sciences 7 Volume XII Number 02
The basic purpose of Fama and French model serves as a good predictor
for explaining asset returns. The model is valid in a sense that when the
value of intercept of the t- statistic is insignificant then the model is
valid. The table 4 result shows that all the values of intercepts are
insignificant whereas, the intercepts values of S/HNFC and B/MNFC
portfolios are significant. The result further shows that at 95% of
confidence interval, three portfolios i.e. S/HNFC, B/LNFC and B/MNFC
explain the market risk premium. These findings are in consistence with
the findings of (Rafi, Kazmi, & Haslim, 2014; Shah, Abdullah, Khan, &
Khan, 2011). The study also examines that return behavior of B/MNFC,
S/LNFC, S/MNFC, S/HNFC and B/LNFCare explained through size premium.
And that the behavior of B/HNFC, B/MNFC, B/LNFC, S/HNFC, S/MNFC,
S/LNFC are explained by value premium. This supports the result of
(Fama & French, 1993). Besides this B/MNFC, B/LNFC and S/HNFC are the
only portfolios which show presence of all factors such as value, size and
market risk premium. Also results of these portfolios are supported by R
square values i.e.65%, 50% and 42% respectively.
Estimation of Monthly Idiosyncratic Risk from Daily Data
Here the idiosyncratic risk value is calculated from daily data. Daily
excess returns of the individual securities of each month is run on daily
Fama and French three factors i.e. SMBNFC, HMLNFC and Rm-RfNFC.
Follow the procedure of Fu (2009)Monthly idiosyncratic risk value is
analyzed by taking the standard deviation of the regression residual and
then by dividing it on the number of trading days in that month. The
average mean value of the idiosyncratic risk is 0.00330 and with standard
deviation value as 0.04278.
Idiosyncratic Risk and Expected Return… Saleem, Khattak and Amin
Journal of Managerial Sciences 8 Volume XII Number 02
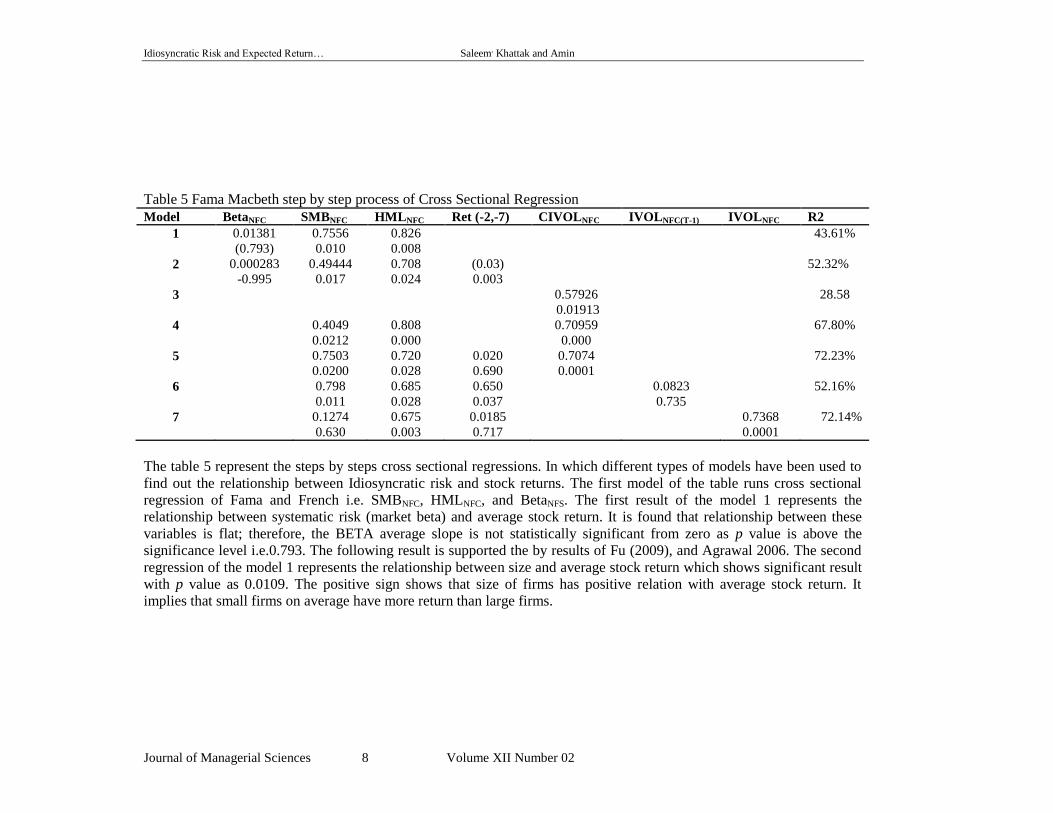
Table 5 Fama Macbeth step by step process of Cross Sectional Regression
Model BetaNFC SMBNFC HMLNFC Ret (-2,-7) CIVOLNFC IVOLNFC(T-1) IVOLNFC R2
1 0.01381
(0.793)
0.7556
0.010
0.826
0.008
43.61%
2 0.000283
-0.995
0.49444
0.017
0.708
0.024
(0.03)
0.003
52.32%
3 0.57926
0.01913
28.58
4 0.4049
0.0212
0.808
0.000
0.70959
0.000
67.80%
5 0.7503
0.0200
0.720
0.028
0.020
0.690
0.7074
0.0001
72.23%
6 0.798
0.011
0.685
0.028
0.650
0.037
0.0823
0.735
52.16%
7 0.1274
0.630
0.675
0.003
0.0185
0.717
0.7368
0.0001
72.14%
The table 5 represent the steps by steps cross sectional regressions. In which different types of models have been used to
find out the relationship between Idiosyncratic risk and stock returns. The first model of the table runs cross sectional
regression of Fama and French i.e. SMBNFC, HMLNFC, and BetaNFS. The first result of the model 1 represents the
relationship between systematic risk (market beta) and average stock return. It is found that relationship between these
variables is flat; therefore, the BETA average slope is not statistically significant from zero as p value is above the
significance level i.e.0.793. The following result is supported the by results of Fu (2009), and Agrawal 2006. The second
regression of the model 1 represents the relationship between size and average stock return which shows significant result
with p value as 0.0109. The positive sign shows that size of firms has positive relation with average stock return. It
implies that small firms on average have more return than large firms.
Idiosyncratic Risk and Expected Return… Saleem, Khattak and Amin
Journal of Managerial Sciences 9 Volume XII Number 02
In third regression of the model, HMLNFC is also positively related to
stock return with the significant p value as 0.008. It indicates that value
firms with higher book to market ratio have higher return than growth
firms with low book to market ratio. The R2 of the model is 43.61%. In
the second model of the table momentum variable has been included i.e.
RETNFC (t-2, -7). The result indicates that coefficient of momentum gives
negative result as the value of t statistic is -2.4451 with the p value of
0.03. SMBNFC and HMLNFC both show positive significant result with the
p values of 0.024 and 0.017483. The R2 of the model is 52.32%. The R
2
value has increased after adding the momentum factor. In the 3rd
model,
univariate regression between conditional idiosyncratic risk and stock
returns is run. The result indicates that expected idiosyncratic risk is
positively related to average returns with the p value of 0.019 which
means that there exists positive relationship between idiosyncratic risks
and expected stock return. The R2 value is 28.58%. To further confirm
this relationship, the research study develops some other models.
The 4th model of the table is about cross-sectional regression of
SMBNFC HMLNFC and conditional idiosyncratic risk in a non-financial
sector of Pakistan Stock Exchange. The result indicates that expected
idiosyncratic risk has positive significant relation with stock return as p
value of 0.000. The addition of these two variables is interesting in a
sense, that the value of the R2substantially becomes very high from last
univariate regression. The value of R2 in this model is 67.80%. Finally, it
can conclude that expected idiosyncratic risk is a good predictor for
stock return.
In the model 5 of the table, Momentum variable was added to
confirm the true relationship between Conditional idiosyncratic risk and
average stock return. The result of this model also gave evidence that
unsystematic risk and return has positive relationship. The R2value is
72.23% being very high and supports relationship between these two
variables.
In the model 6 of the table, the relationship between lag
idiosyncratic risk and stock returns is analyzed. The aim of the model is
to check the direction of the relationship, as various research studies
highlight the negative relationship between these two (Fu 2009; AHXZ’S
2006). The result from this study gives a different result from the
previous literatures. The result of recent study indicates that there does
not exist any relationship between these two variables. Consequently, it
can be conveyed that, one-month lag idiosyncratic risk has no
relationship with stock return.
In the model 7, the idiosyncratic volatility is included and one-
month lag idiosyncratic risk is excluded. After analysis the result shows
Idiosyncratic Risk and Expected Return… Saleem, Khattak and Amin
Journal of Managerial Sciences 10 Volume XII Number 02
full support for the previous models except model 6. The R2
is also
substantially very high confirms the result. The value of the R2 is
72.41%. The evidence gives more fruitful result and solidifies the idea in
case of non-financial sector of Pakistan stock market. The result of this
study is in consistent with the research work of Merton (1987), Fu (2009)
and many more.
Conclusion
Many empirical studies have been conducted about the relationship of
idiosyncratic risk and stock return in various stock markets of the world.
Based on these studies, the role of idiosyncratic risk has been determined
in explaining the stock return. Idiosyncratic risk has been identified by
many researchers in the past from time to time and opinions obtained
vary from case to case. For example if investors do not keep perfect
diversification then the idiosyncratic risk has positive relationship with
the expected stock return (Bali & Cakici, 2008; Fu, 2009; Levy, 1978;
Merton, 1987) whereas (Ang et al., 2006; Huang, Liu, Rhee, & Zhang,
2009) reported a negative relationship. So, this study focuses on the
relationship of idiosyncratic risk with a stock return in the context of
Pakistan. Non-financial sector gives the results that time-varying
properties of idiosyncratic risk have a positive relationship with expected
stock returns. For this purpose, different types of cross-sectional
regressions have been applied which control the size, value and
momentum factors to verify the relationship. Both findings give similar
results that idiosyncratic risk has a positive effect on the stock return.
These findings also reject the previous finding, “that one month ahead
idiosyncratic risk has a negative relation with stock return”. The result
signifies, “that one month ahead idiosyncratic risk has no relationship
with stock returns”.
The study verifies the validity of Fama and French by using
daily and monthly data of nonfinancial sector and financial sector
companies of Pakistan stock market. The result signified that Fama and
French 3 factor model is fully applicable in these sectors. Besides, this
the study follows the methodology adopted by (Bali & Cakici, 2008; Fu,
2009) by using EGARCH model for the purpose of finding value of
expected idiosyncratic risk. Further, it was observed that there exists a
positive relationship relation among expected idiosyncratic risk and stock
return.
Future Research Directions
The focus of the current research was to investigate the relationship
between idiosyncratic risk and stock return of non-financial sector of

Idiosyncratic Risk and Expected Return… Saleem, Khattak and Amin
Journal of Managerial Sciences 11 Volume XII Number 02
Pakistan. Although the current study gives good insight but it would be
better if we select both financial and non-financial sector of PSE. So
future researchers may also select financial sector to further nourish the
relationship between idiosyncratic risk and stock return. Similarly,
researchers may also select commodity market as well to verify whether
idiosyncratic risk effect stock return in this market.
Idiosyncratic Risk and Expected Return… Saleem, Khattak and Amin
Journal of Managerial Sciences 12 Volume XII Number 02
References
Ang, A., Hodrick, R. J., Xing, Y., & Zhang, X. (2006). The cross‐section
of volatility and expected returns. The Journal of Finance, 61(1),
259-299.
Bali, T. G., & Cakici, N. (2008). Idiosyncratic volatility and the cross
section of expected returns. Journal of Financial and
Quantitative Analysis, 43(1), 29-58.
Fama, E. F., & French, K. R. (1993). Common risk factors in the returns
on stocks and bonds. Journal of financial Economics, 33(1), 3-
56.
Fu, F. (2009). Idiosyncratic risk and the cross-section of expected stock
returns. Journal of financial economics, 91(1), 24-37.
Goetzmann, W. N., & Kumar, A. (2004). Diversification decisions of
individual investors and asset prices. Yale School of
Management Working Papers (Yale School of Management.).
Huang, W., Liu, Q., Rhee, S. G., & Zhang, L. (2009). Another look at
idiosyncratic volatility and expected returns.
Levy, H. (1978). Equilibrium in an Imperfect Market: A Constraint on
the Number of Securities in the Portfolio. The American
economic review, 68(4), 643-658.
Merton, R. C. (1987). A simple model of capital market equilibrium with
incomplete information. the Journal of Finance, 42(3), 483-510.
Miller, E. M. (1977). Risk, uncertainty, and divergence of opinion. the
Journal of Finance, 32(4), 1151-1168.
Ohlson, J., & Rosenberg, B. (1982). Systematic risk of the CRSP equal-
weighted common stock index: A history estimated by
stochastic-parameter regression. Journal of business, 121-145.
Pástor, Ľ. (2000). Portfolio selection and asset pricing models. The
Journal of Finance, 55(1), 179-223.
Rafi, B., Kazmi, S., & Haslim, M. (2014). Validity of FAMA and French
Model: Evidence from KSE-100 index. International Journal of
Management Science, 1(3), 52-57.
Rosenberg, B., & Guy, J. (1976). Prediction of Beta from Investment
Fundamentals: Part One. Financial Analysts Journal, 32(3), 60-
72.
Shah, A., Abdullah, F., Khan, T., & Khan, S. (2011). Simplicity vs
accuracy: The case of CAPM and Fama and French model.
Australian Journal of Basic and Applied Sciences, 5(10), 520-
535.


![Implied Idiosyncratic Volatility and Stock Return ...idiosyncratic risk and stock returns. [10] explores the stock returns prediction by the information content of im-plied volatility](https://img.pdfslide.net/doc/110x75/610f45a94ae9581c7d4444f9/implied-idiosyncratic-volatility-and-stock-return-idiosyncratic-risk-and-stock.jpg)