Embed Size (px)
Citation preview
INTERNATIONAL FEDERATION OF AGRICULTURAL PRODUCERS (IFAPIFAP)
Philippe Jachnik
PresidentInternational Dairy Federation (IDF)
4th IFAP COMMODITIES CONFERENCE
DAIRY PRODUCTS GROUP
PRETORIA, 10.05.2003
WORLD MARKET SITUATION AND WORLD MARKET SITUATION AND OUTLOOK FOR DAIRY PRODUCTSOUTLOOK FOR DAIRY PRODUCTSWORLD MARKET SITUATION AND WORLD MARKET SITUATION AND OUTLOOK FOR DAIRY PRODUCTSOUTLOOK FOR DAIRY PRODUCTS
TABLE OF CONTENTS
1. WORLD DAIRY ECONOMY: MAIN DATA AND TRENDS
2. IDF WDS 2003 FIRST PREVIEW
1. WORLD DAIRY ECONOMY: MAIN DATA AND TRENDS
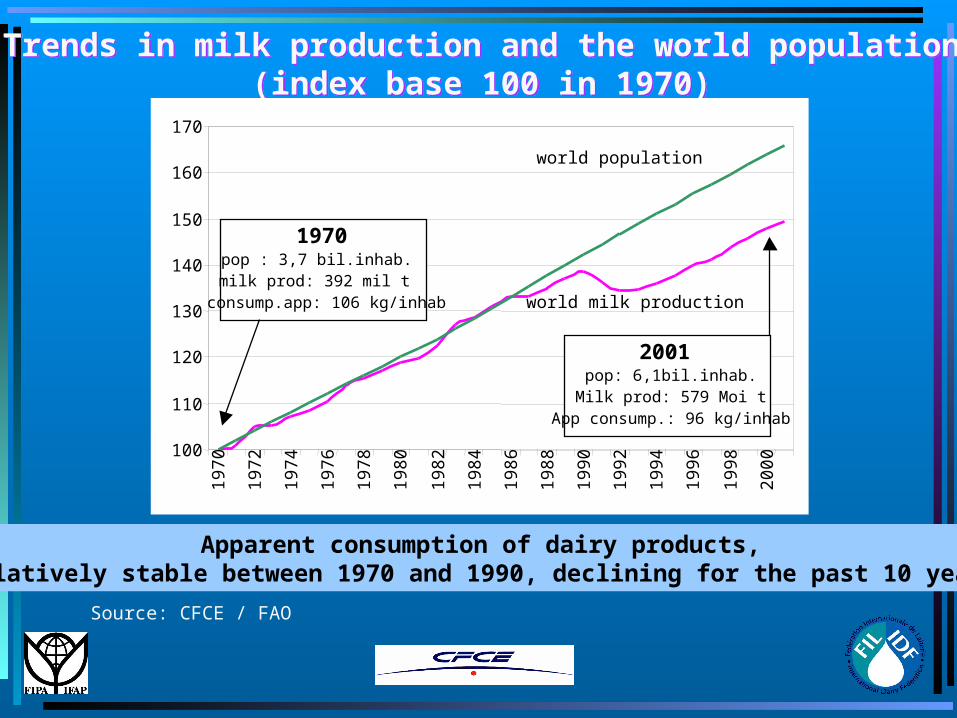
Trends in milk production and the world population(index base 100 in 1970)
Trends in milk production and the world population(index base 100 in 1970)
Apparent consumption of dairy products,Relatively stable between 1970 and 1990, declining for the past 10 years
Source: CFCE / FAO
100
110
120
130
140
150
160
170
1970
1972
1974
1976
1978
1980
1982
1984
1986
1988
1990
1992
1994
1996
1998
2000
world population
world milk production
1970pop : 3,7 bil.inhab.milk prod: 392 mil t
consump.app: 106 kg/inhab
2001pop: 6,1bil.inhab.
Milk prod: 579 Moi tApp consump.: 96 kg/inhab
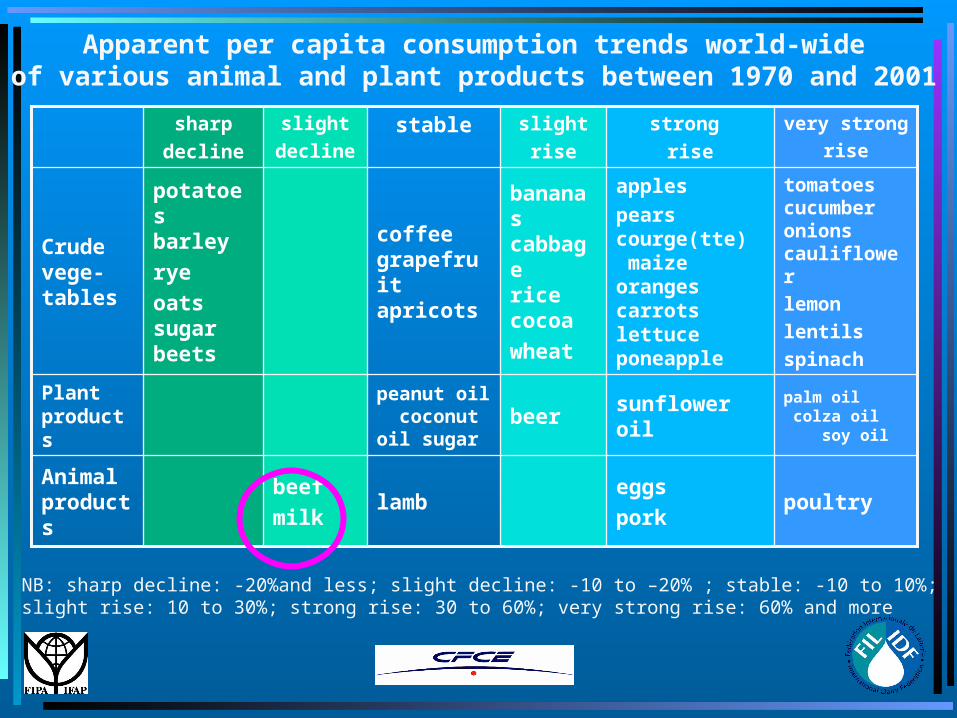
Apparent per capita consumption trends world-wideof various animal and plant products between 1970 and 2001
poultryeggs
porklamb
beef
milkAnimal products
palm oil colza oil soy oil
sunflower oilbeerpeanut oil coconut oil sugar
Plant products
tomatoes cucumber onions cauliflower
lemon
lentils
spinach
apples
pears courge(tte) maize oranges carrots lettuce poneapple
bananas cabbage rice cocoa
wheat
coffee grapefruit apricots
potatoes barley
rye
oats sugar beets
Crude vege-tables
very strong
rise
strong
rise
slight
risestableslight
decline
sharp
decline
NB: sharp decline: -20%and less; slight decline: -10 to –20% ; stable: -10 to 10%;slight rise: 10 to 30%; strong rise: 30 to 60%; very strong rise: 60% and more
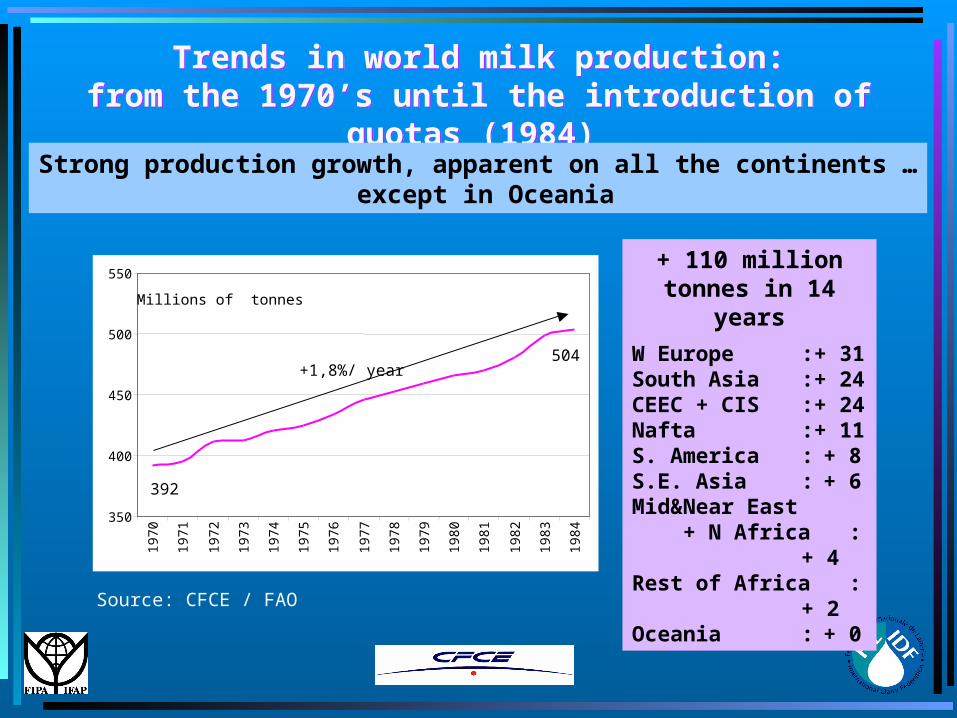
Trends in world milk production:from the 1970’s until the introduction of quotas
(1984)
Trends in world milk production:from the 1970’s until the introduction of quotas
(1984) Strong production growth, apparent on all the continents …
except in Oceania
W Europe :+ 31South Asia :+ 24CEEC + CIS :+ 24Nafta :+ 11S. America : + 8S.E. Asia : + 6Mid&Near East + N Africa : + 4Rest of Africa : + 2Oceania : + 0
+ 110 million tonnes in 14
years
Source: CFCE / FAO
350
400
450
500
550
1970
1971
1972
1973
1974
1975
1976
1977
1978
1979
1980
1981
1982
1983
1984
392
Millions of tonnes
504 +1,8%/ year
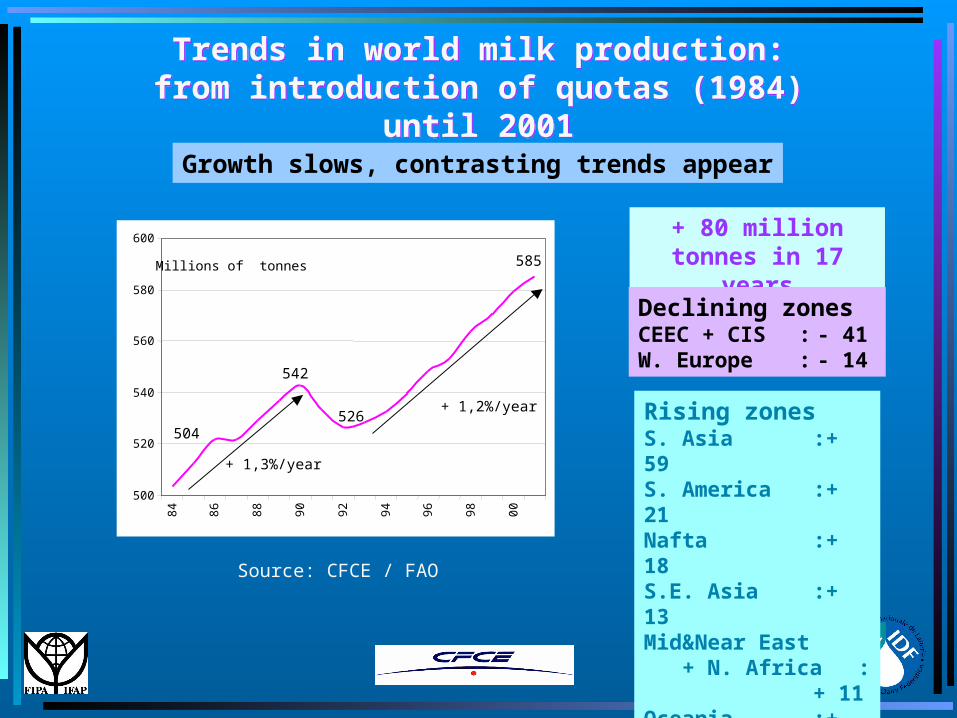
Trends in world milk production:from introduction of quotas (1984) until
2001
Trends in world milk production:from introduction of quotas (1984) until
2001Growth slows, contrasting trends appear
+ 80 million tonnes in 17
yearsDeclining zonesCEEC + CIS : - 41W. Europe : - 14
Rising zonesS. Asia :+ 59S. America :+ 21Nafta :+ 18S.E. Asia :+ 13Mid&Near East + N. Africa :+ 11Oceania :+ 11
Source: CFCE / FAO
500
520
540
560
580
600
84
86
88
90
92
94
96
98
00
585
504
Millions of tonnes
526
542
+ 1,3%/year
+ 1,2%/year
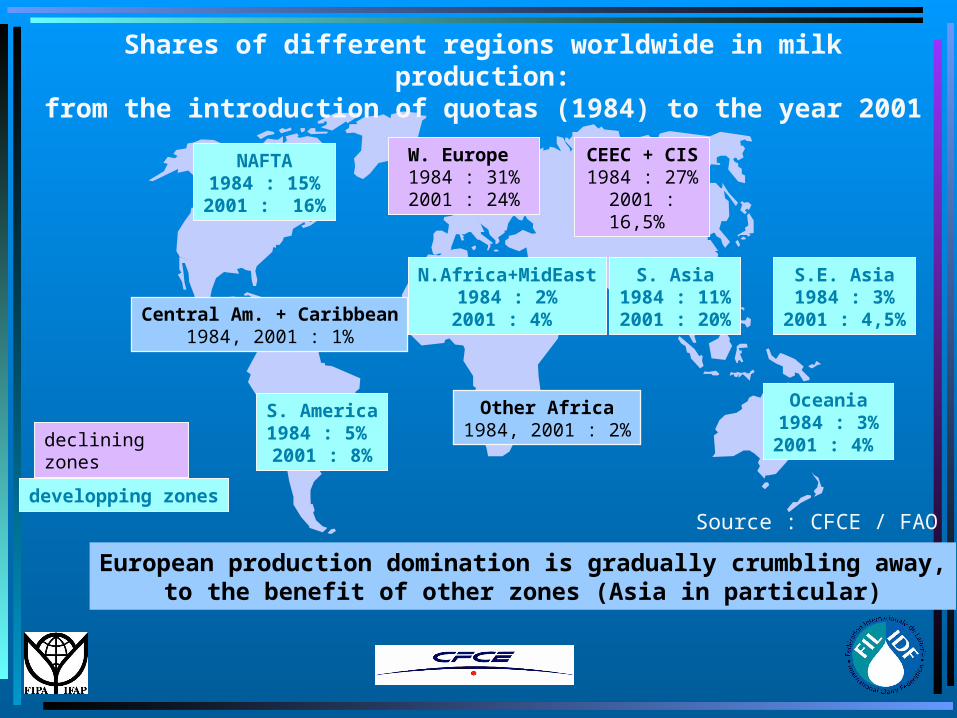
S. Asia1984 : 11%2001 : 20%
Source : CFCE / FAO
W. Europe 1984 : 31%2001 : 24%
CEEC + CIS1984 : 27%
2001 : 16,5%
N.Africa+MidEast1984 : 2%2001 : 4%
NAFTA1984 : 15%2001 : 16%
Central Am. + Caribbean1984, 2001 : 1%
S. America1984 : 5% 2001 : 8%
Other Africa1984, 2001 : 2%
Oceania1984 : 3%2001 : 4%
Shares of different regions worldwide in milk production:from the introduction of quotas (1984) to the year 2001
declining zones
developping zones
European production domination is gradually crumbling away,to the benefit of other zones (Asia in particular)
S.E. Asia1984 : 3%
2001 : 4,5%
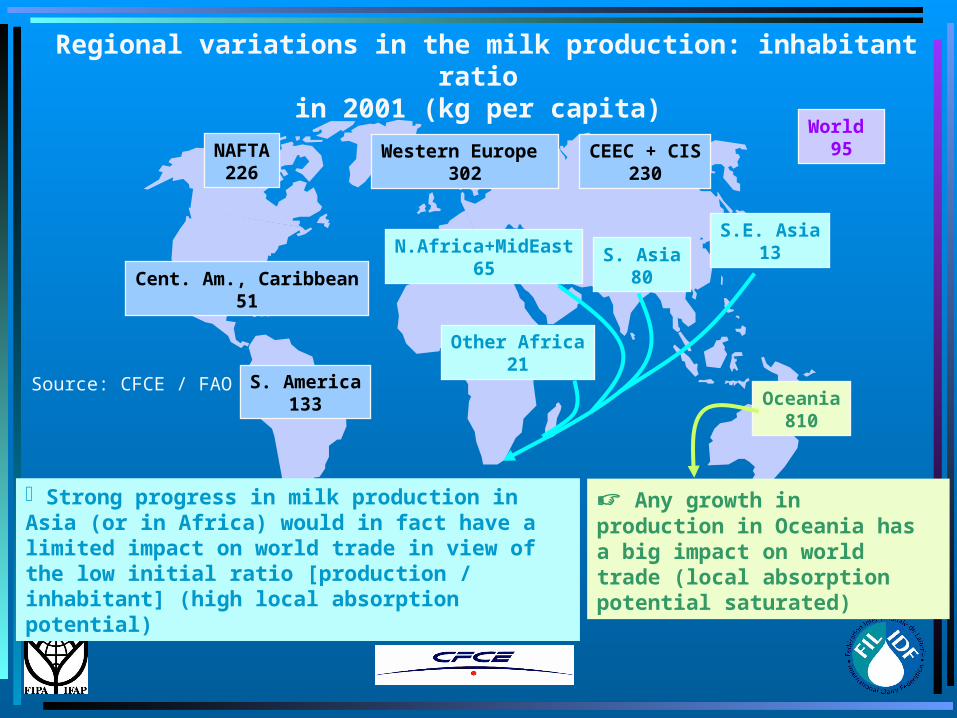
Western Europe 302
CEEC + CIS230
N.Africa+MidEast65
NAFTA226
S. America133
Other Africa21
S. Asia80
Oceania810
World 95
Source: CFCE / FAO
Regional variations in the milk production: inhabitant ratio
in 2001 (kg per capita)
Any growth in production in Oceania has a big impact on world trade (local absorption potential saturated)
S.E. Asia13
Cent. Am., Caribbean51
Strong progress in milk production in Asia (or in Africa) would in fact have a limited impact on world trade in view of the low initial ratio [production / inhabitant] (high local absorption potential)
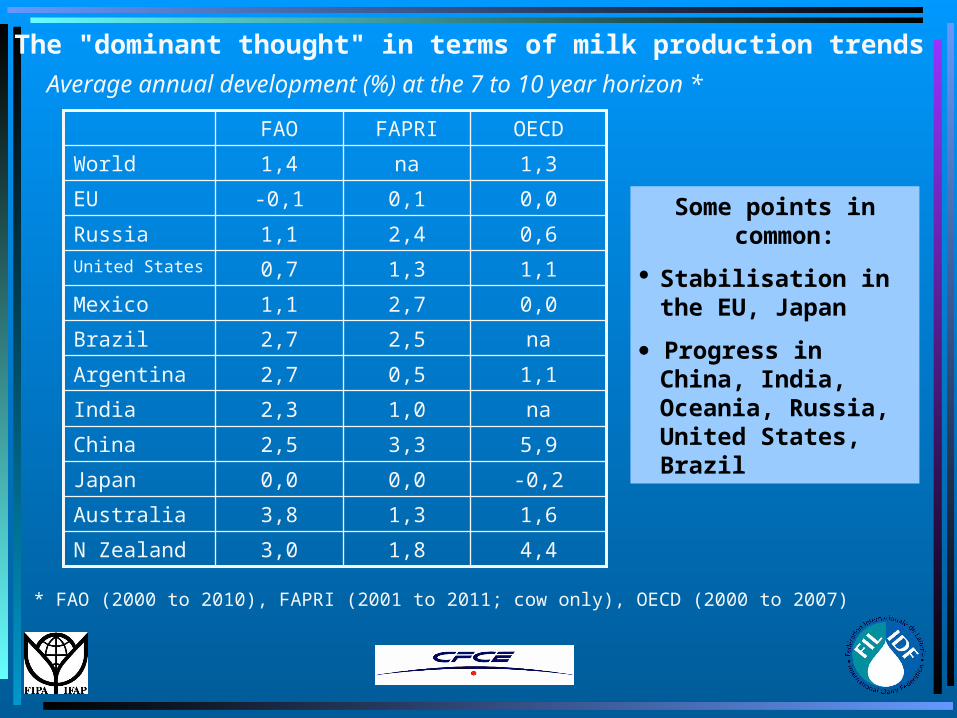
The "dominant thought" in terms of milk production trends
-0,20,00,0Japan
1,61,33,8Australia
na1,02,3India
5,93,32,5China
na2,52,7Brazil
1,10,52,7Argentina
4,41,83,0N Zealand
0,02,71,1Mexico
1,11,30,7United States
0,62,41,1Russia
0,00,1-0,1EU
1,3na1,4World
OECDFAPRIFAO
Average annual development (%) at the 7 to 10 year horizon *
* FAO (2000 to 2010), FAPRI (2001 to 2011; cow only), OECD (2000 to 2007)
Some points in common:
Stabilisation in the EU, Japan
Progress in China, India, Oceania, Russia, United States, Brazil
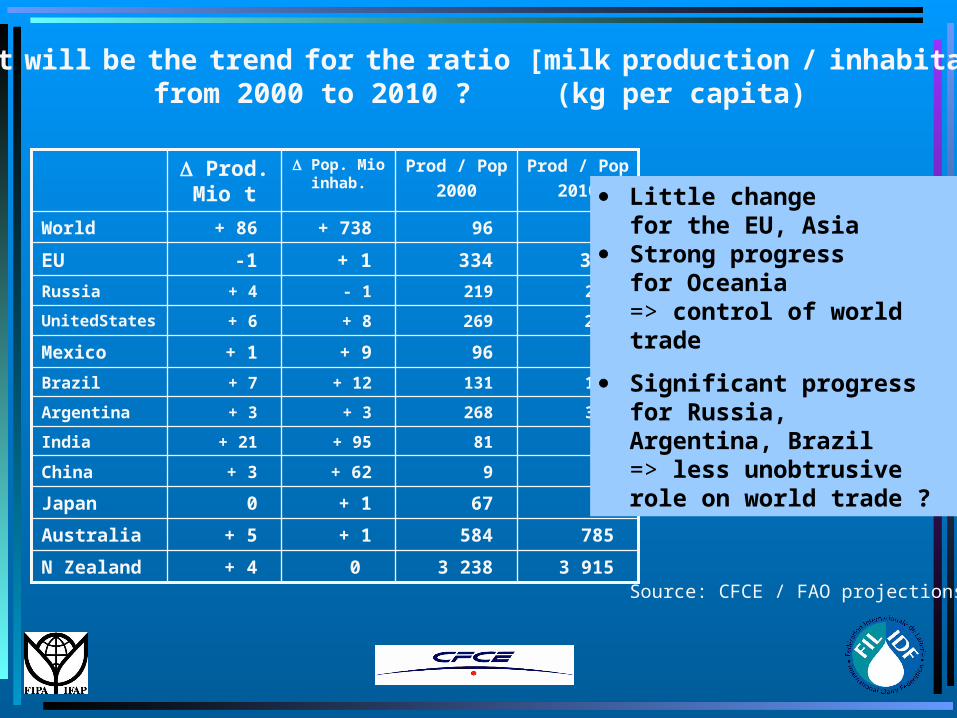
What will be the trend for the ratio [milk production / inhabitant]from 2000 to 2010 ? (kg per capita)
3 238
584
67
9
81
268
131
96
269
219
334
96
Prod / Pop
2000
67+ 10Japan
785+ 1+ 5Australia
89+ 95+ 21India
11+ 62+ 3China
153+ 12+ 7Brazil
313+ 3+ 3Argentina
3 9150 + 4N Zealand
93+ 9+ 1Mexico
275+ 8+ 6UnitedStates
246- 1+ 4Russia
333+ 1-1EU
98+ 738+ 86World
Prod / Pop
2010
Pop. Mio inhab.
Prod. Mio t
Source: CFCE / FAO projections
Little changefor the EU, Asia
Strong progressfor Oceania
=> control of world trade
Significant progress for Russia, Argentina, Brazil=> less unobtrusive role on world trade ?
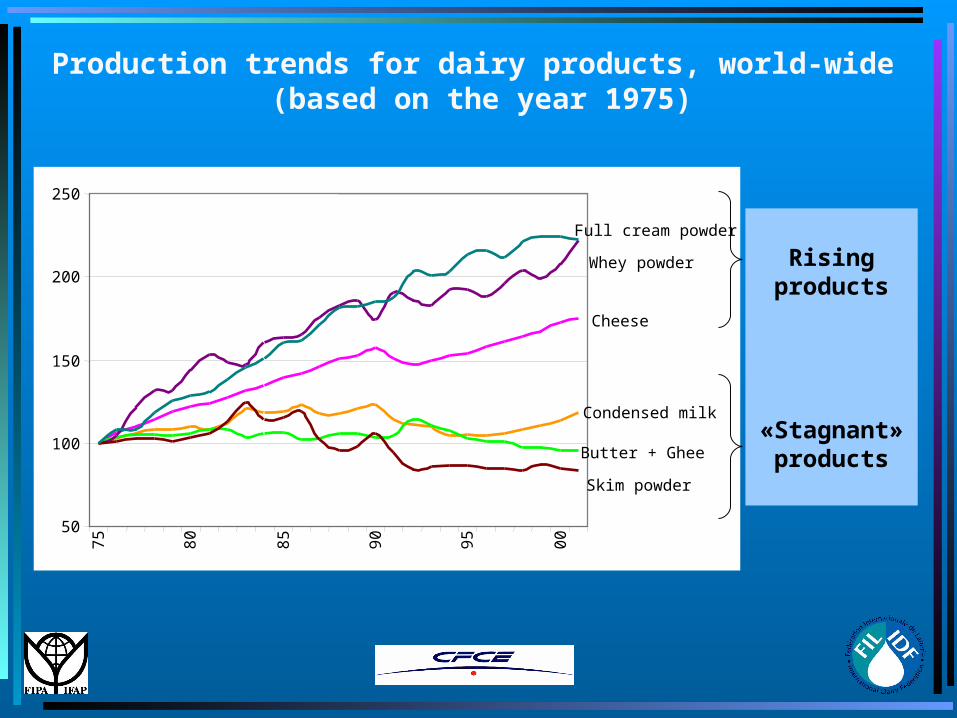
50
100
150
200
250
75
80
85
90
95
00
Whey powder
Full cream powder
Cheese
Condensed milk
Butter + Ghee
Skim powder
Production trends for dairy products, world-wide (based on the year 1975)
Rising products
«Stagnant» products
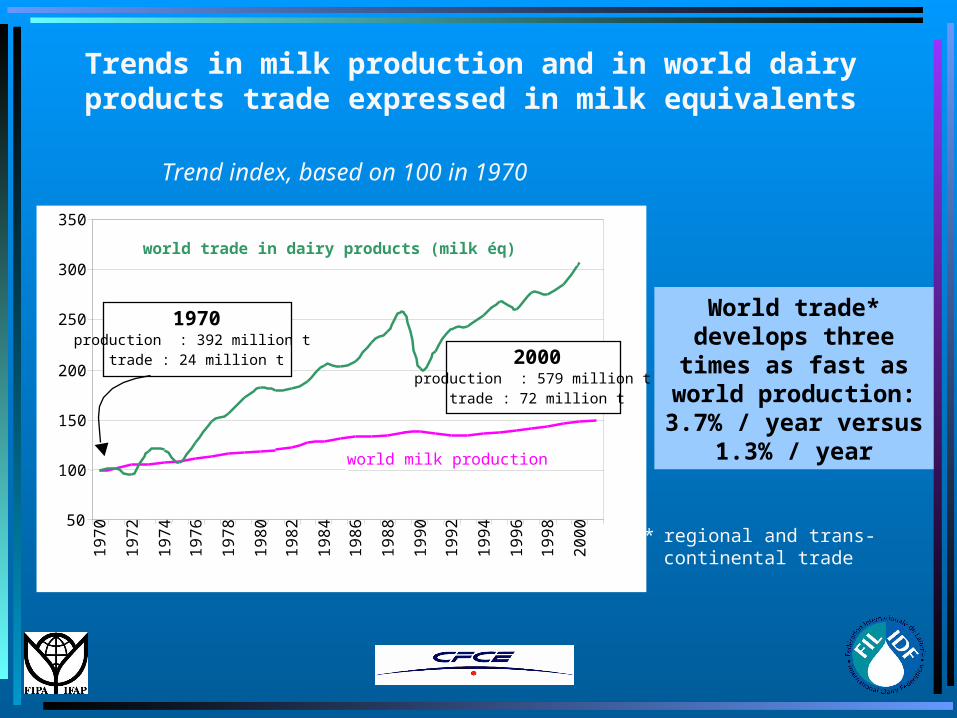
Trends in milk production and in world dairyproducts trade expressed in milk equivalents
Trend index, based on 100 in 1970
World trade* develops three times as fast as
world production:3.7% / year versus
1.3% / year
50
100
150
200
250
300
350
19
70
19
72
19
74
19
76
19
78
19
80
19
82
19
84
19
86
19
88
19
90
19
92
19
94
19
96
19
98
20
00
world trade in dairy products (milk éq)
world milk production
1970production : 392 million t
trade : 24 million t 2000production : 579 million t
trade : 72 million t
* regional and trans-continental trade
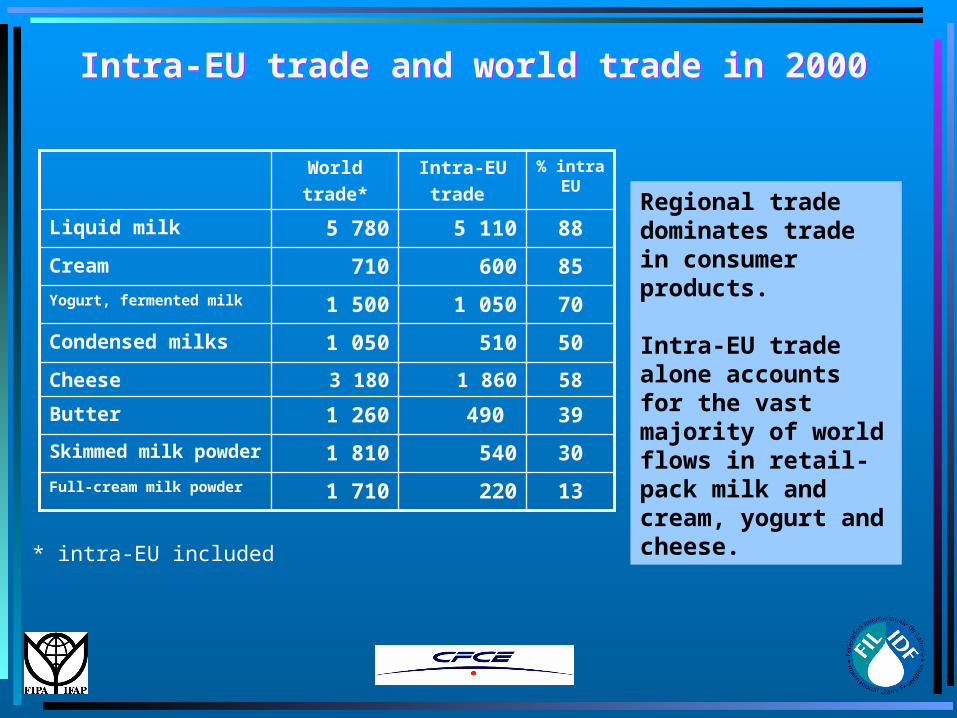
Intra-EU trade and world trade in 2000Intra-EU trade and world trade in 2000
Regional trade dominates trade in consumer products.
Intra-EU trade alone accounts for the vast majority of world flows in retail-pack milk and cream, yogurt and cheese.
132201 710Full-cream milk powder
305401 810Skimmed milk powder
39490 1 260Butter
581 8603 180Cheese
505101 050Condensed milks
701 0501 500Yogurt, fermented milk
85600710Cream
885 1105 780Liquid milk
% intra EU
Intra-EU
trade
World
trade*
* intra-EU included
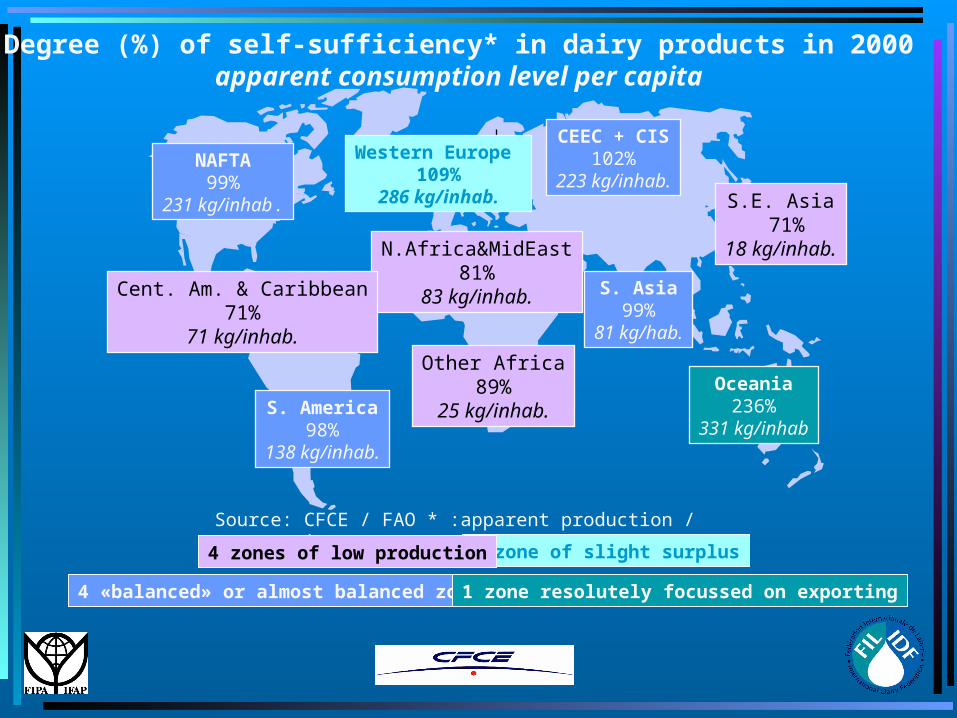
1 zone of slight surplus
CEEC + CIS102%
223 kg/inhab.S.E. Asia
71%18 kg/inhab.N.Africa&MidEast
81%83 kg/inhab.
NAFTA99%
231 kg/inhab.
Cent. Am. & Caribbean71%
71 kg/inhab.
S. America98%
138 kg/inhab.
Other Africa89%
25 kg/inhab.
S. Asia99%
81 kg/hab.
Oceania236%
331 kg/inhab
Source: CFCE / FAO * :apparent production / consumption
Degree (%) of self-sufficiency* in dairy products in 2000apparent consumption level per capita
4 zones of low production
4 «balanced» or almost balanced zones1 zone resolutely focussed on exporting
Western Europe 109%
286 kg/inhab.
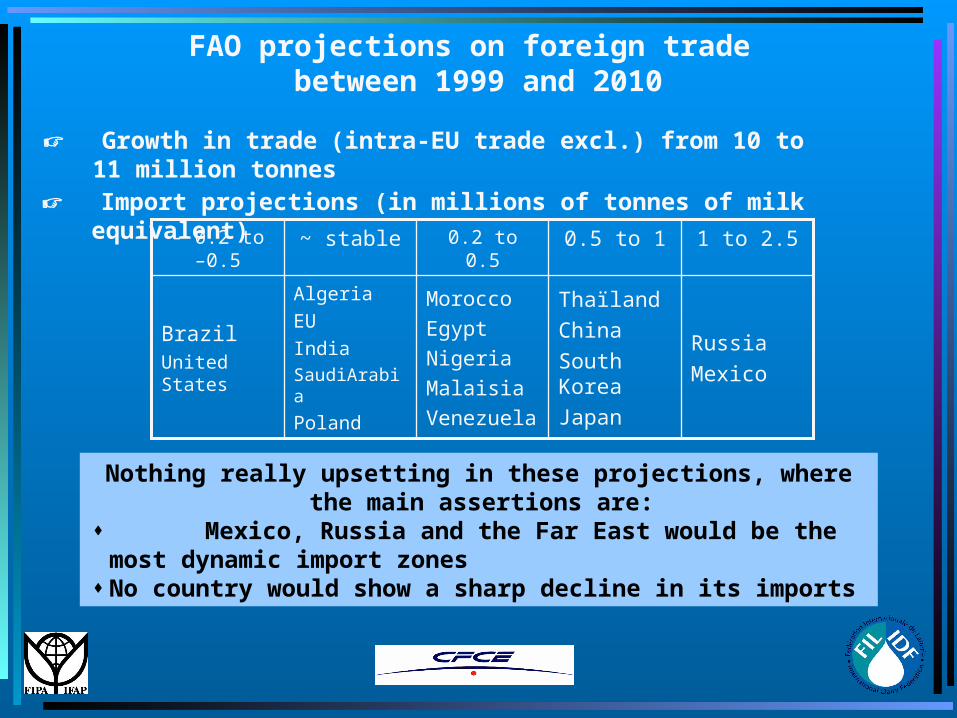
FAO projections on foreign trade between 1999 and 2010
Growth in trade (intra-EU trade excl.) from 10 to 11 million tonnes
Russia
Mexico
Thaïland
China
South Korea
Japan
Morocco
Egypt
Nigeria
Malaisia
Venezuela
Algeria
EU
IndiaSaudiArabia
Poland
BrazilUnited States
1 to 2.50.5 to 10.2 to 0.5~ stable- 0.2 to –0.5
Import projections (in millions of tonnes of milk equivalent)
Nothing really upsetting in these projections, where the main assertions are:
Mexico, Russia and the Far East would be the most dynamic import zones
No country would show a sharp decline in its imports
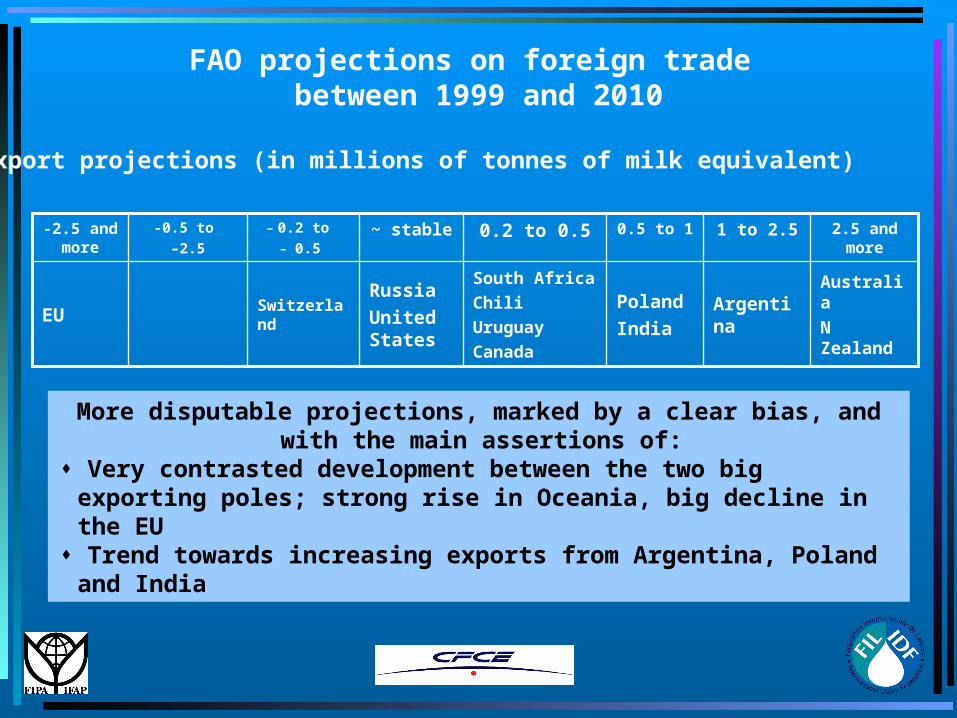
FAO projections on foreign trade between 1999 and 2010
-0.5 to
–2.5
EU
-2.5 and more
Argentina
1 to 2.5
Australia
N Zealand
Poland
India
South Africa
Chili
Uruguay
Canada
Russia
United States
Switzerland
2.5 and more
0.5 to 10.2 to 0.5~ stable- 0.2 to
- 0.5
Export projections (in millions of tonnes of milk equivalent)
More disputable projections, marked by a clear bias, and with the main assertions of:
Very contrasted development between the two big exporting poles; strong rise in Oceania, big decline in the EU
Trend towards increasing exports from Argentina, Poland and India
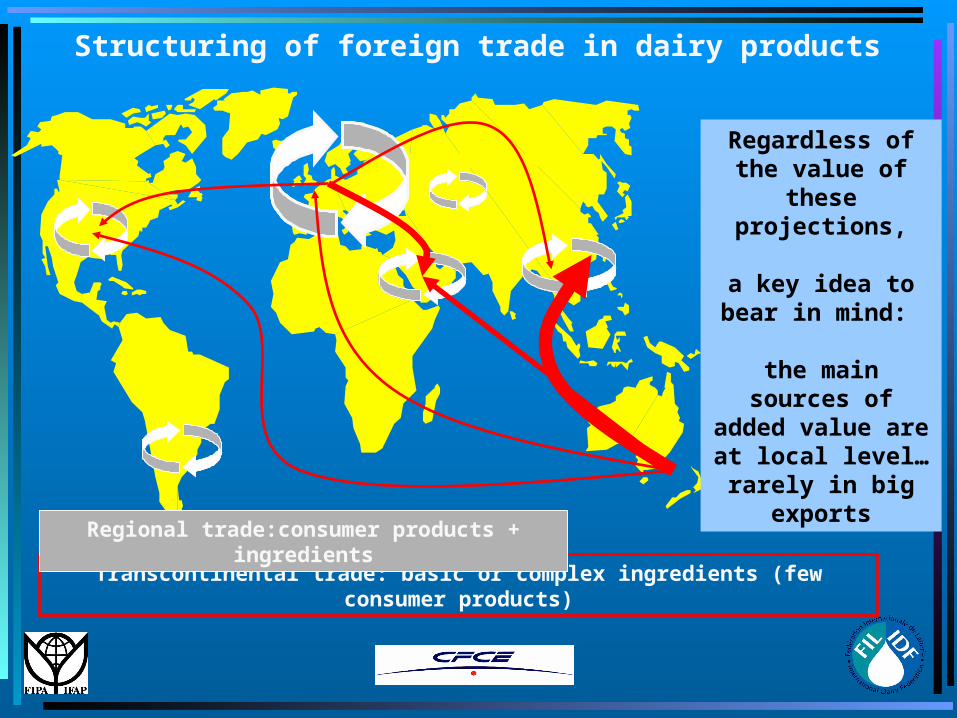
Transcontinental trade: basic or complex ingredients (few consumer products)
Regional trade:consumer products + ingredients
Structuring of foreign trade in dairy products
Regardless of the value of
these projections,
a key idea to bear in mind:
the main sources of
added value are at local level…
rarely in big exports
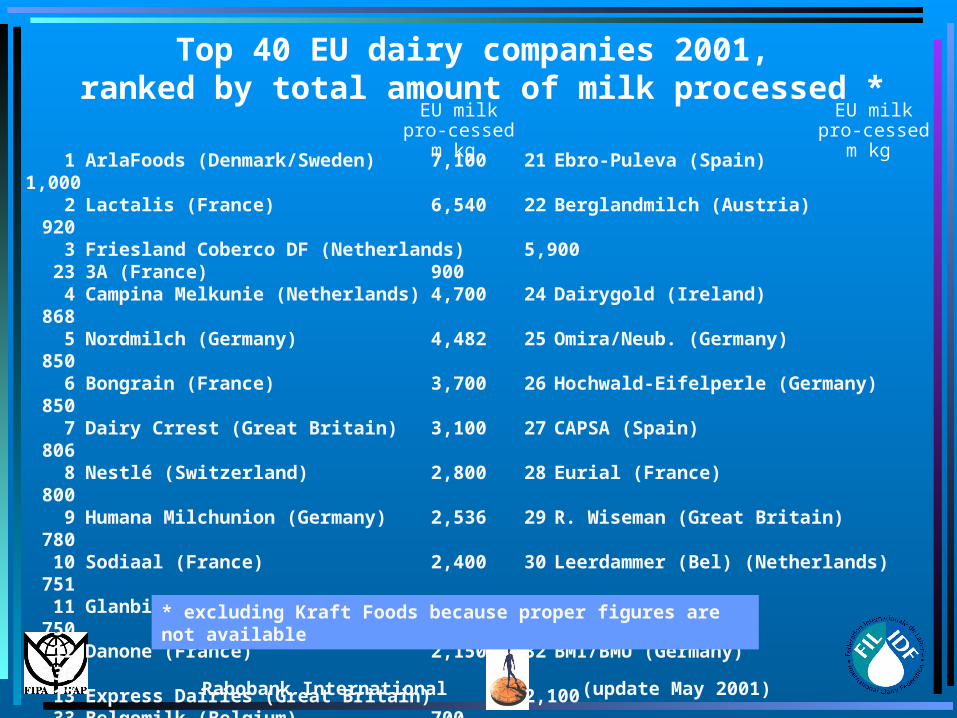
Top 40 EU dairy companies 2001, ranked by total amount of milk processed *
Rabobank International (update May 2001)
EU milk pro-cessed m kg
1 ArlaFoods (Denmark/Sweden) 7,100 21 Ebro-Puleva (Spain)1,000
2 Lactalis (France) 6,540 22 Berglandmilch (Austria)920
3 Friesland Coberco DF (Netherlands) 5,90023 3A (France) 9004 Campina Melkunie (Netherlands) 4,700
24 Dairygold (Ireland) 8685 Nordmilch (Germany) 4,482 25 Omira/Neub. (Germany)
8506 Bongrain (France) 3,700 26 Hochwald-Eifelperle (Germany)
8507 Dairy Crrest (Great Britain) 3,100 27 CAPSA (Spain)
8068 Nestlé (Switzerland) 2,800 28 Eurial (France)
8009 Humana Milchunion (Germany) 2,536 29 R. Wiseman (Great Britain)
78010 Sodiaal (France) 2,400 30 Leerdammer (Bel) (Netherlands)
75111 Glanbia (Ireland) 2,150 31 Galbani (Italy)
75012 Danone (France) 2,150 32 BMI/BMU (Germany)
73613 Express Dairies (Great Britain) 2,100 33 Belgomilk (Belgium)
70014 Entremont (France) 1,900 34 Unicopa (France)
70015 Valio (Finland) 1,660 35 ACC (Great Britain)
70016 Laïta (France) 1,650 36 Goldsteig (Germany)
60017 Aloïs Müller (Germany) 1,517 37 Golden Vale (Kerry) (Ireland)
59018 Parmalat (Italy) 1,270 38 D.O.C. (Netherlands)
58019 Lactogal (Portugal) 1,100 39 Milchunion Hocheiffel (Germany)
57020 Fromageries Bel (France) 1,000 40 Hansa Milch (Germany)
569
EU milk pro-cessed m kg
* excluding Kraft Foods because proper figures are not available
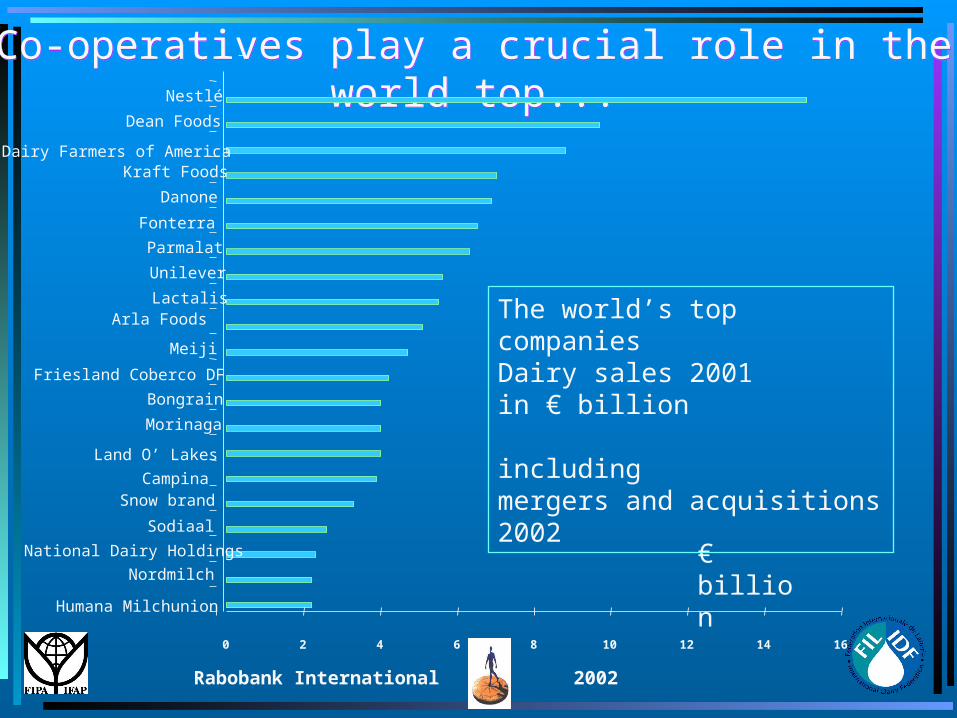
Co-operatives play a crucial role in the world top...
Co-operatives play a crucial role in the world top...
0 2 4 6 8 10 12 14 16
National Dairy Holdings
Snow brand
Morinaga
Bongrain
Meiji
Lactalis
Unilever
Parmalat
Danone
Kraft Foods
Dean Foods
Nestlé
€ billion
The world’s top companiesDairy sales 2001in € billion
including mergers and acquisitions 2002
Friesland Coberco DF
Dairy Farmers of America
Fonterra
Arla Foods
Sodiaal
Nordmilch
Land O’ Lakes
Humana Milchunion
Campina
Rabobank International 2002
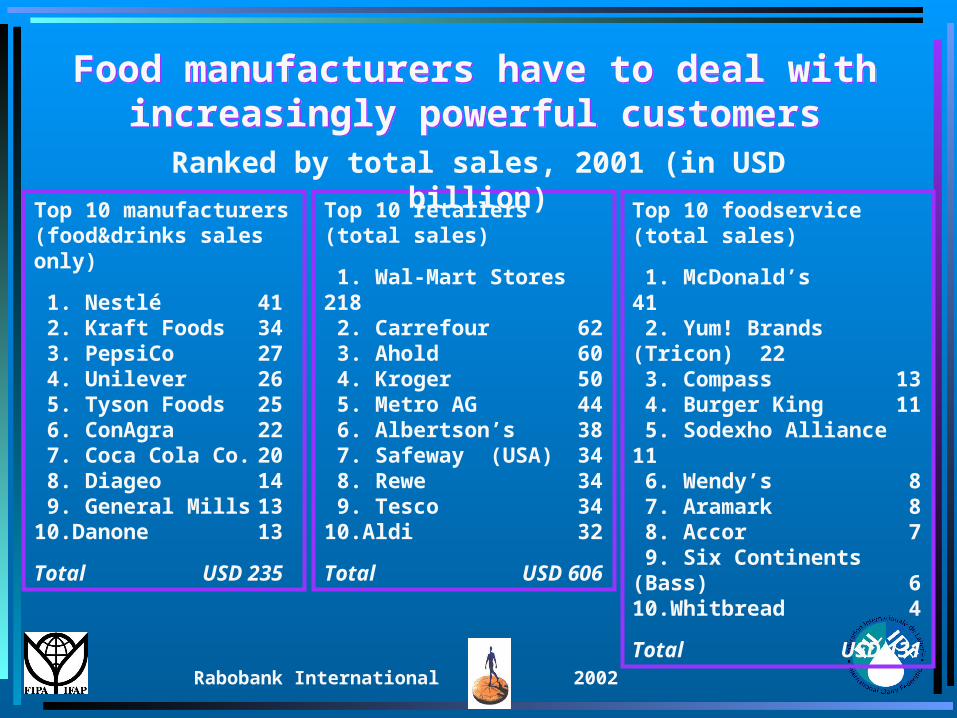
Top 10 retailers(total sales)
1. Wal-Mart Stores 218 2. Carrefour 62 3. Ahold 60 4. Kroger 50 5. Metro AG 44 6. Albertson’s 38 7. Safeway (USA) 34 8. Rewe 34 9. Tesco 3410.Aldi 32
Total USD 606
Top 10 foodservice (total sales)
1. McDonald’s 41 2. Yum! Brands (Tricon) 22 3. Compass 13 4. Burger King 11 5. Sodexho Alliance 11 6. Wendy’s 8 7. Aramark 8 8. Accor 7 9. Six Continents (Bass) 610.Whitbread 4
Total USD 131
Ranked by total sales, 2001 (in USD billion)
Top 10 manufacturers(food&drinks sales only)
1. Nestlé 41 2. Kraft Foods 34 3. PepsiCo 27 4. Unilever 26 5. Tyson Foods 25 6. ConAgra 22 7. Coca Cola Co. 20 8. Diageo 14 9. General Mills 1310.Danone 13
Total USD 235
Food manufacturers have to deal with increasingly powerful customers
Food manufacturers have to deal with increasingly powerful customers
Rabobank International 2002

2. IDF WORLD DAIRY SITUATION 2003 FIRST PREVIEW
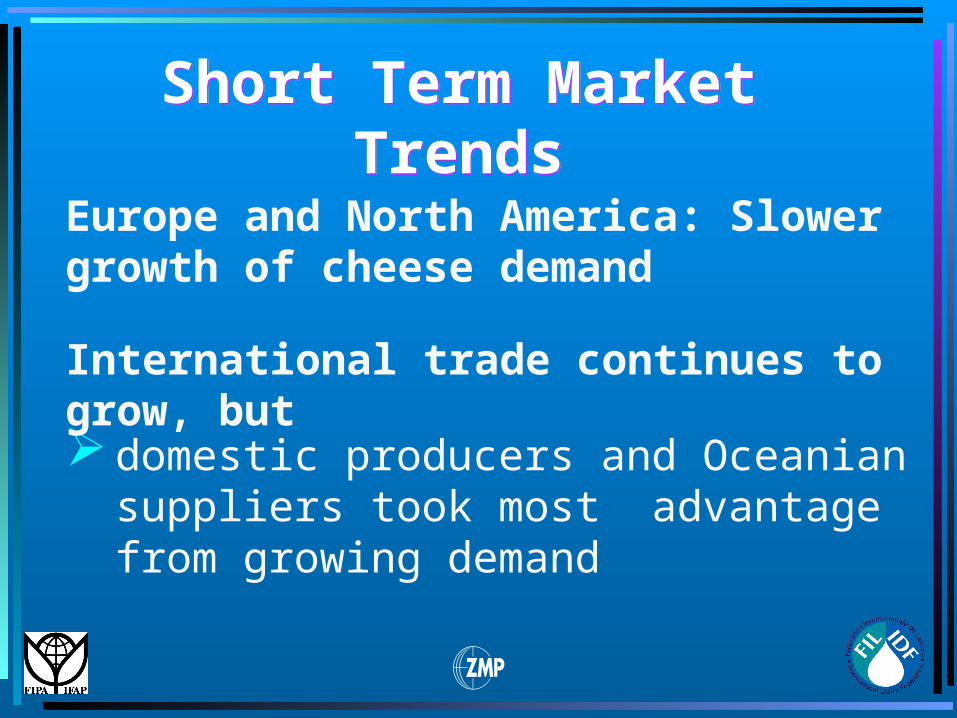
Short Term Market TrendsShort Term Market Trends
domestic producers and Oceanian suppliers took most advantage from growing demand
Europe and North America: Slower growth of cheese demand
International trade continues to grow, but
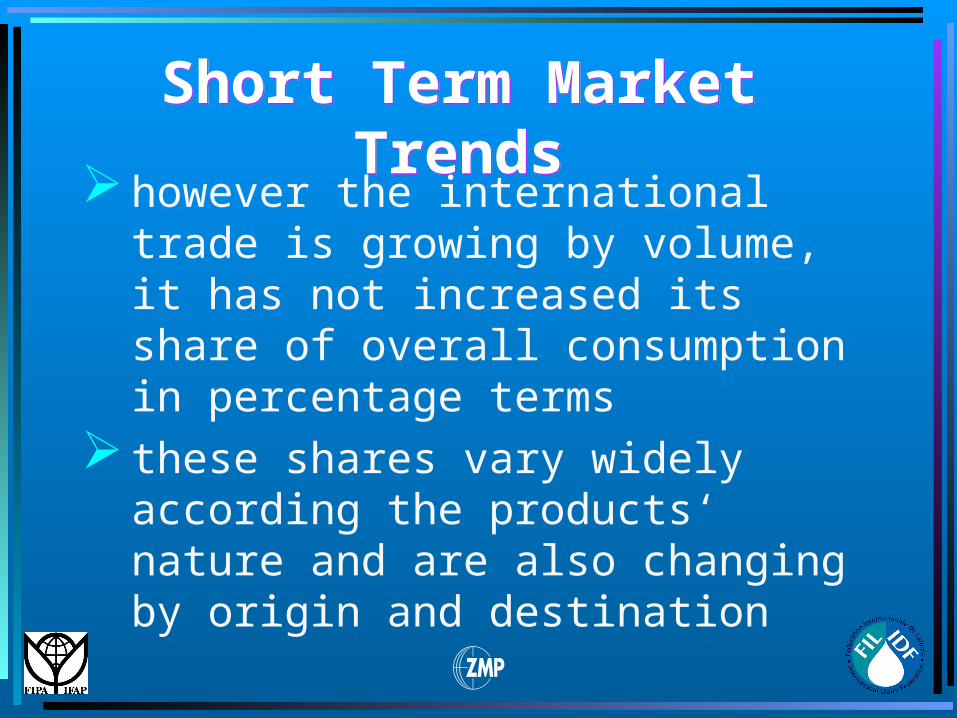
Short Term Market TrendsShort Term Market Trends
however the international trade is growing by volume, it has not increased its share of overall consumption in percentage terms
these shares vary widely according the products‘ nature and are also changing by origin and destination
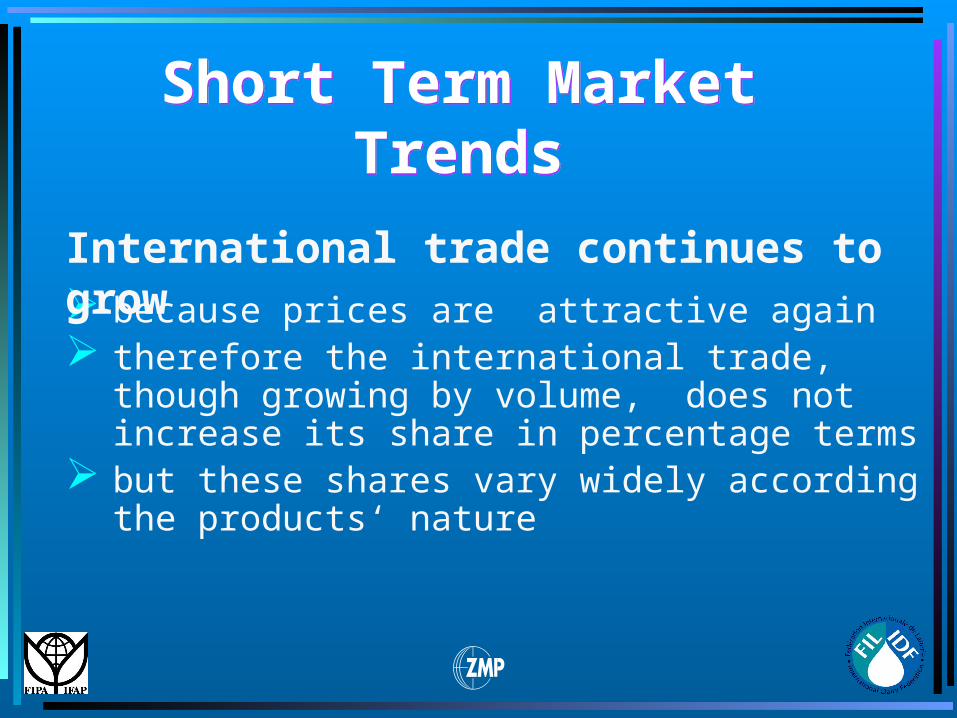
Short Term Market TrendsShort Term Market Trends
because prices are attractive again therefore the international trade, though growing
by volume, does not increase its share in percentage terms
but these shares vary widely according the products‘ nature
International trade continues to grow
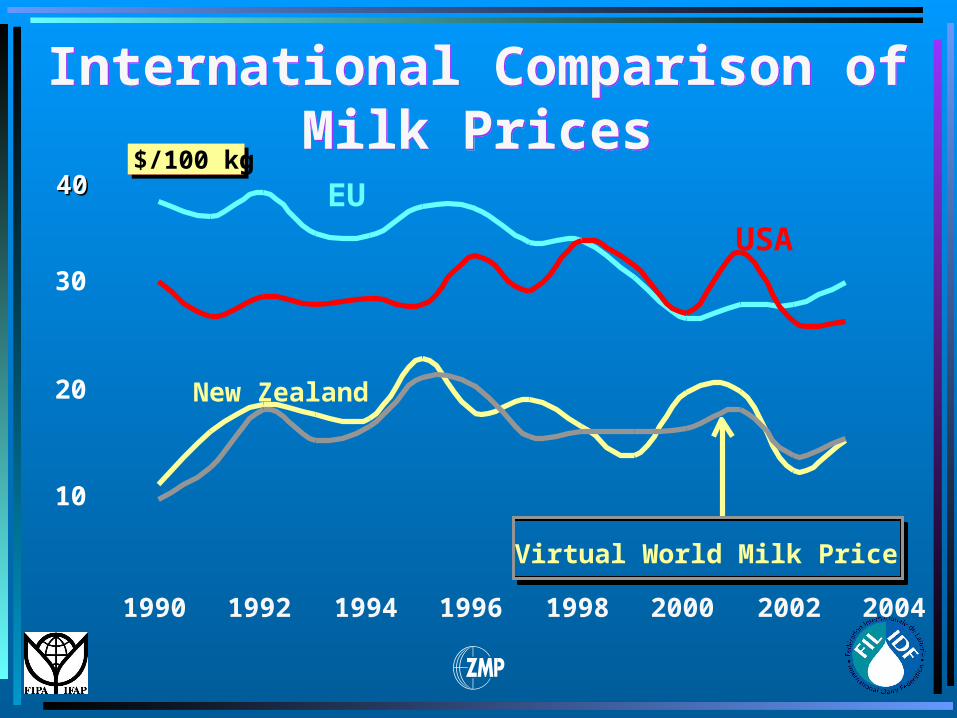
International Comparison of
Milk Prices International Comparison of
Milk Prices
4040$/100 kg
10
20
30
1990 1992 1994 1996 1998 2000 2002 2004
EUUSA
New Zealand
Virtual World Milk Price
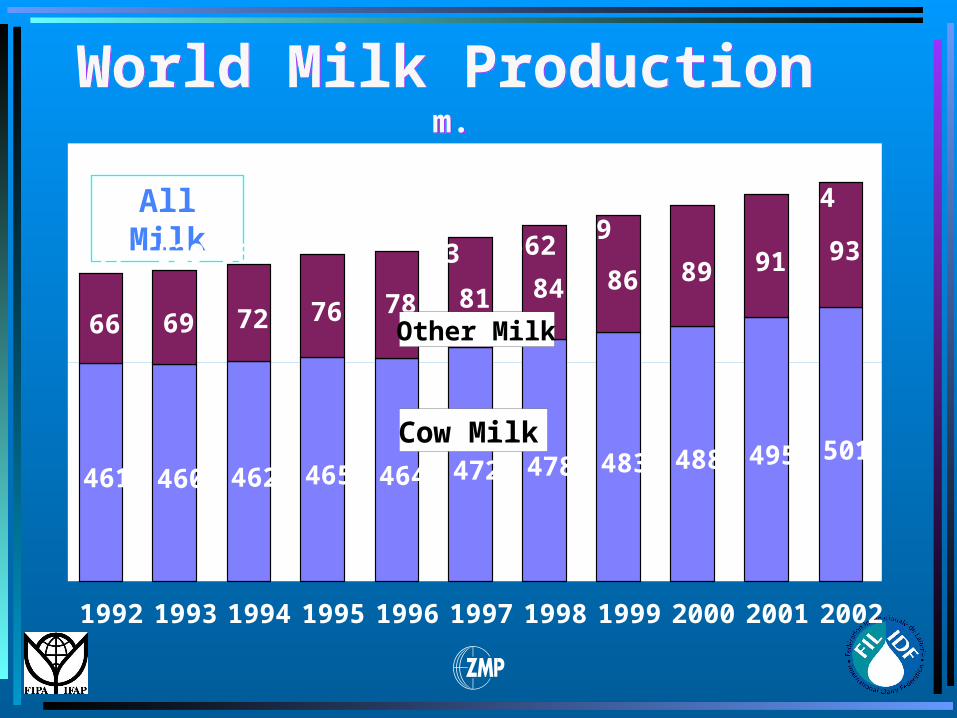
World Milk ProductionWorld Milk Productionm. t.m. t.
461 460 462 465 464 472 478 483 488 495 501
66 69 72 76 81 84 86 89 91 93
78
1992 1993 1994 1995 1996 1997 1998 1999 2000 2001 2002
Cow Milk
Other Milk
All Milk
527 529 534541 543
553 562569 577
585 594
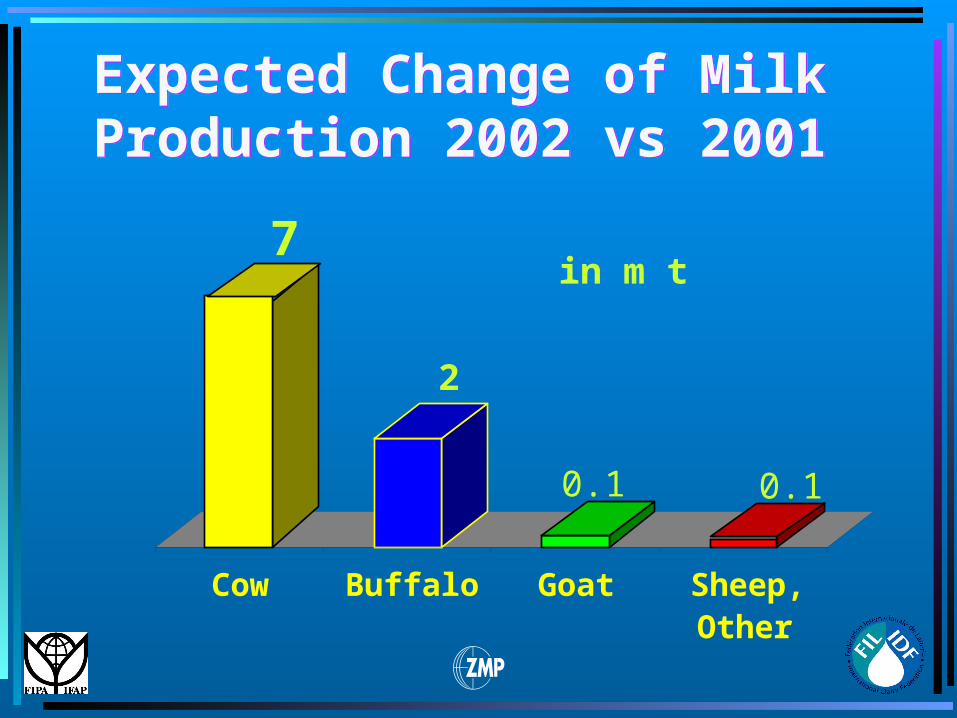
7
2
0.1 0.1
Cow Buffalo Goat Sheep,Other
Expected Change of Milk Production 2002 vs 2001 Expected Change of Milk Production 2002 vs 2001
in m t
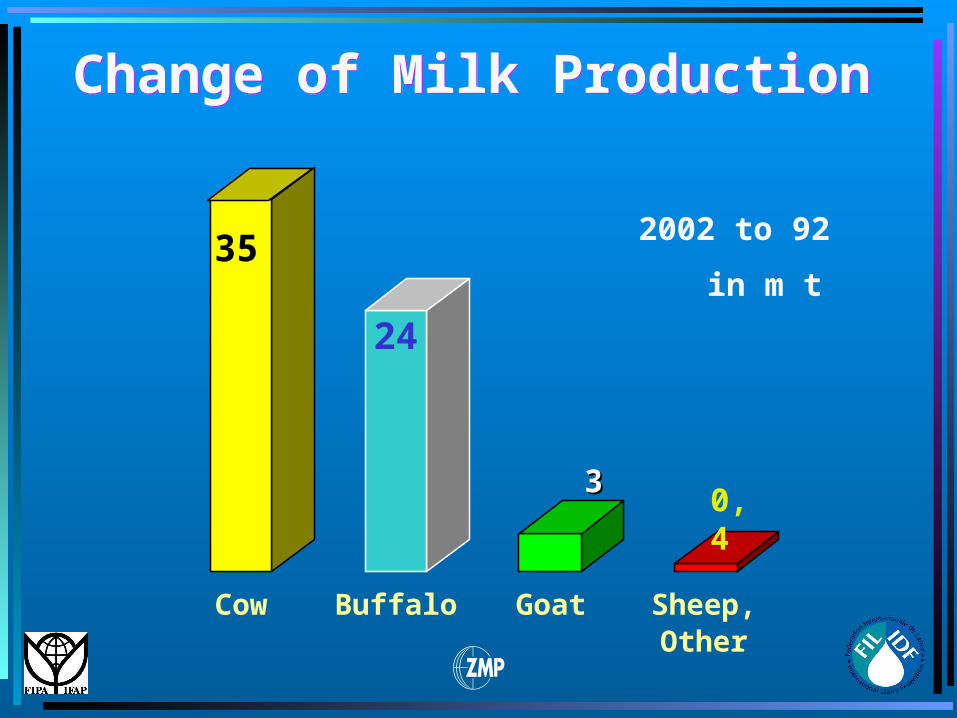
35
24
0,4
Cow Buffalo Goat Sheep,Other
Change of Milk Production Change of Milk Production
2002 to 92
in m t
33
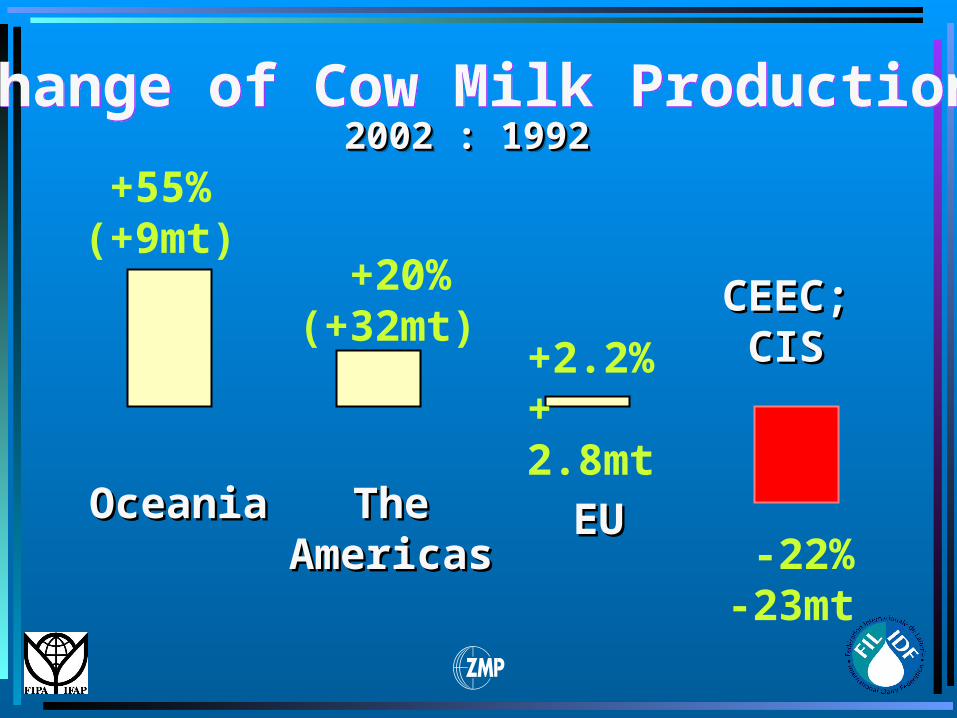
Change of Cow Milk Production Change of Cow Milk Production 2002 : 19922002 : 19922002 : 19922002 : 1992
-22%-23mt
+2.2%+ 2.8mt
+20%(+32mt)
+55%(+9mt)
OceaniaOceania The The AmericasAmericas
EUEU
CEEC; CEEC; CISCIS
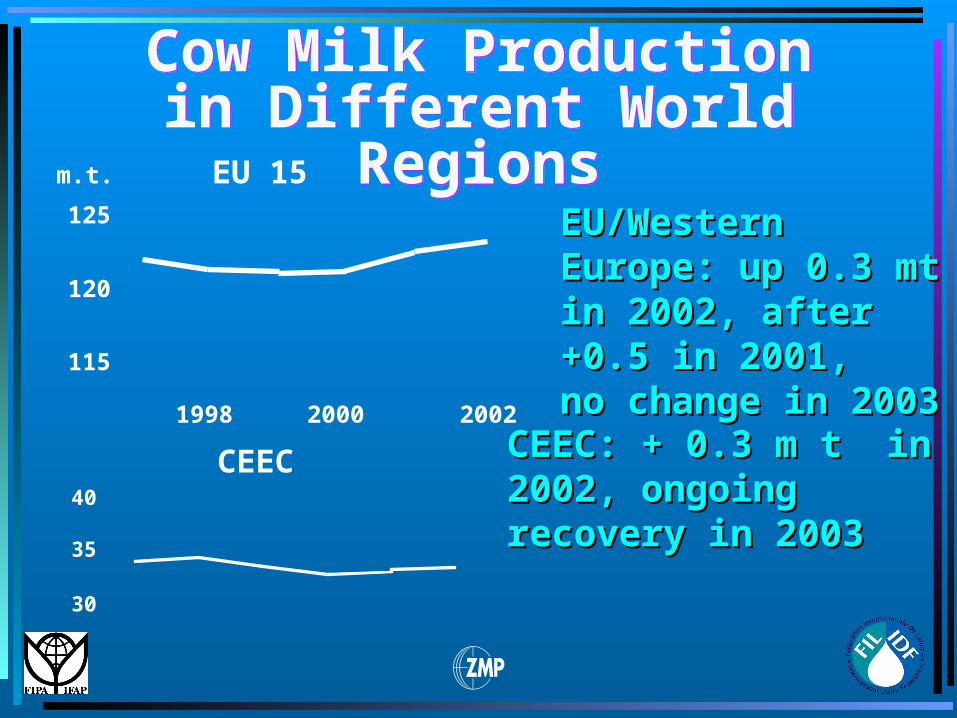
EU 15
115
120
125
m.t.
Cow Milk Production in Different World RegionsCow Milk Production in Different World Regions
EU/Western Europe: EU/Western Europe: up 0.3 mt in 2002, up 0.3 mt in 2002, after +0.5 in 2001,after +0.5 in 2001,no change in 2003no change in 2003
CEEC
30
35
40
CEEC: + 0.3 m t in CEEC: + 0.3 m t in 2002, ongoing 2002, ongoing recovery in 2003 recovery in 2003
1998 2000 2002
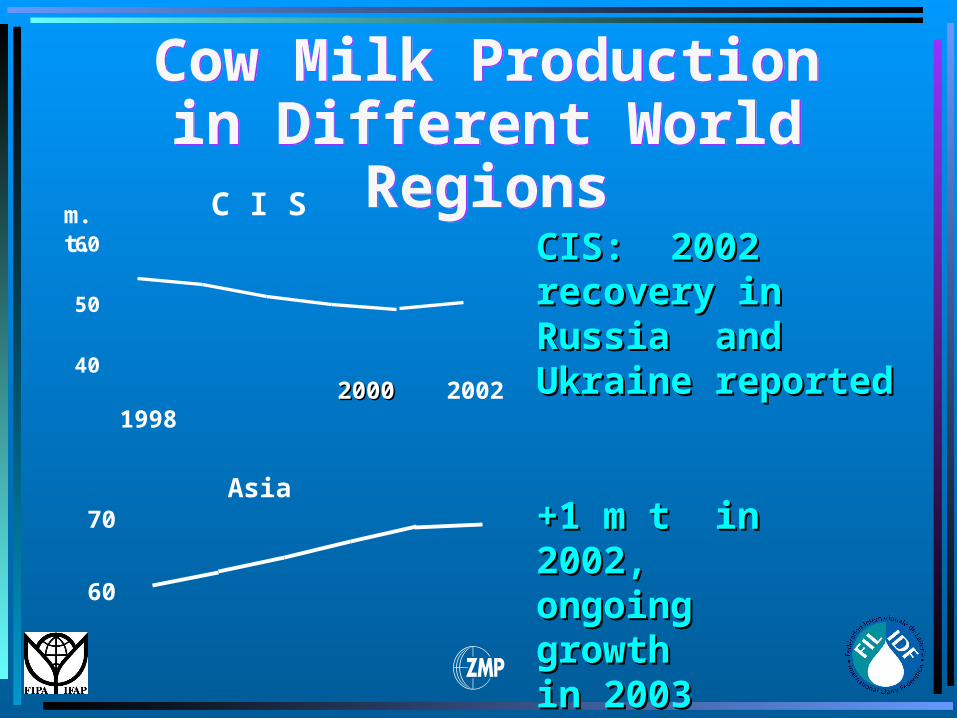
Cow Milk Production in Different World RegionsCow Milk Production in Different World Regions
C I S
40
50
60 CIS: 2002 recovery CIS: 2002 recovery in Russia and in Russia and Ukraine reportedUkraine reported
Asia
60
70
1998 20002000 2002
+1 m t in 2002,+1 m t in 2002,ongoing growthongoing growthin 2003 likelyin 2003 likely
m.t.
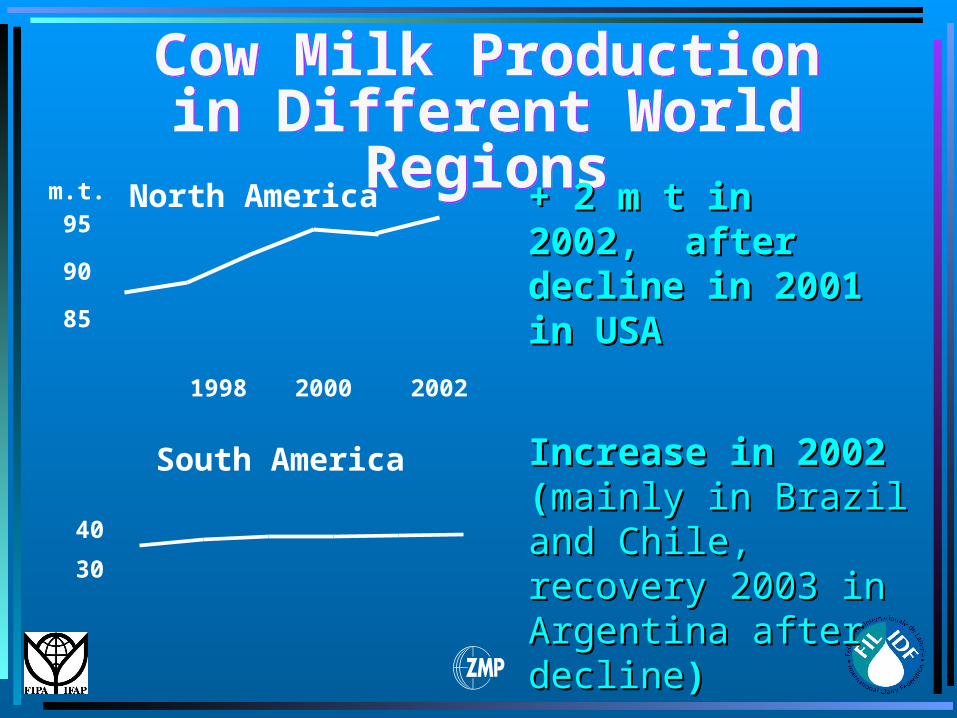
North America
85
90
95
1998 2000 2002
m.t.
Cow Milk Production in Different World RegionsCow Milk Production in Different World Regions
+ 2 m t in 2002, + 2 m t in 2002, after decline in after decline in 2001 in USA2001 in USA
South America
30
40
Increase in 2002 Increase in 2002 ((mainly in Brazil and mainly in Brazil and Chile, recovery 2003 Chile, recovery 2003 in Argentina after in Argentina after declinedecline))
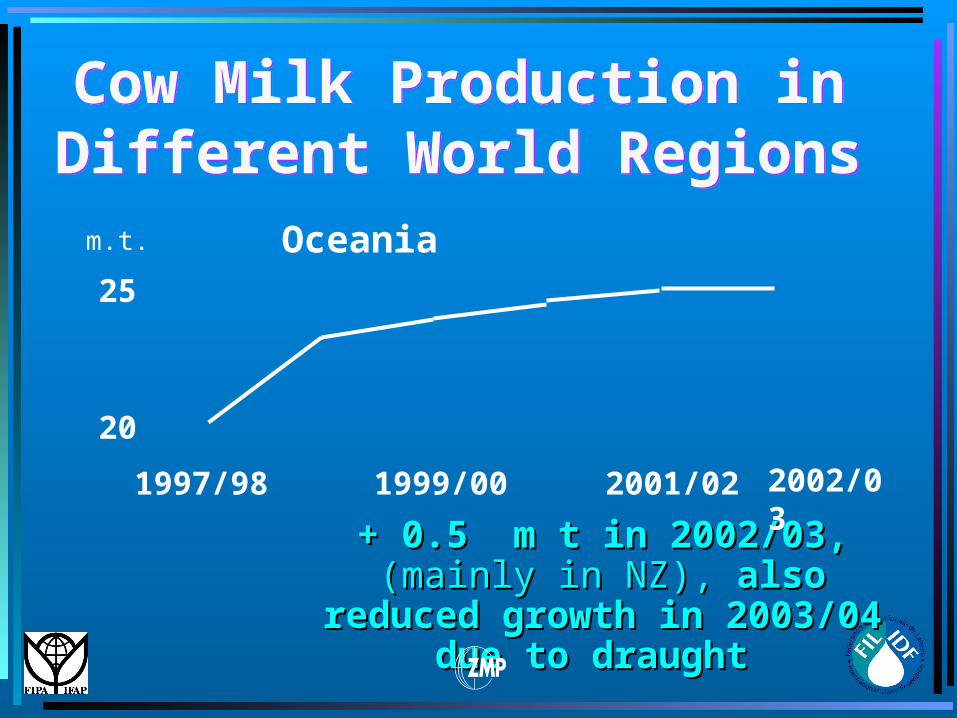
Cow Milk Production in Different World RegionsCow Milk Production in Different World Regions
+ 0.5 m t in 2002/03, + 0.5 m t in 2002/03, (mainly in (mainly in NZ), NZ), also reduced growth in also reduced growth in
2003/04 due to draught 2003/04 due to draught
Oceania
20
25
1997/98 1999/00 2001/02
m.t.
2002/03
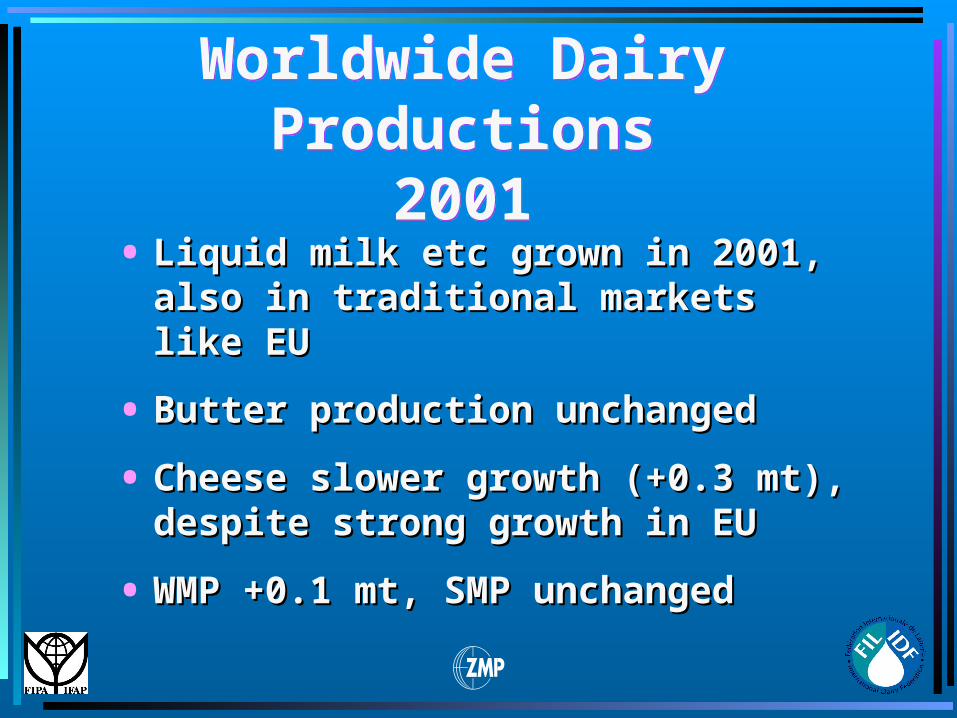
Worldwide Dairy Productions2001
Worldwide Dairy Productions2001
• Liquid milk etc grown in 2001, also in Liquid milk etc grown in 2001, also in traditional markets like EUtraditional markets like EU
• Butter production unchangedButter production unchanged
• Cheese slower growth (+0.3 mt), Cheese slower growth (+0.3 mt), despite strong growth in EUdespite strong growth in EU
• WMP +0.1 mt, SMP unchangedWMP +0.1 mt, SMP unchanged
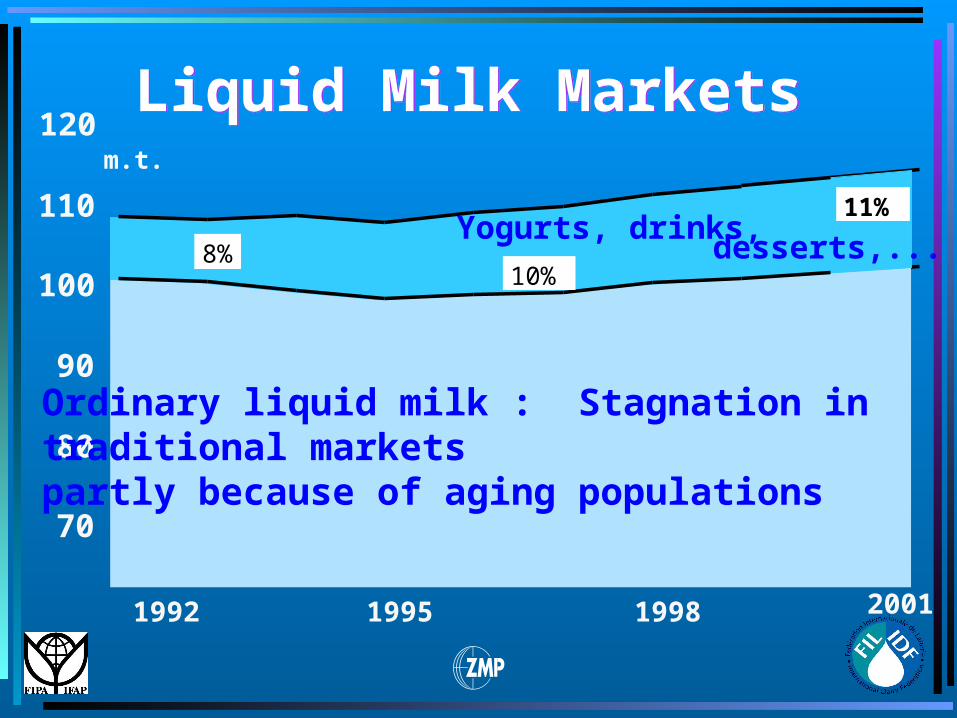
Liquid Milk Markets Liquid Milk Markets
70
80
90
100
110
120
1992 1995 1998 2001
m.t.
Yogurts, drinks, desserts,...
Ordinary liquid milk : Stagnation in traditional marketspartly because of aging populations
8%10%
11%
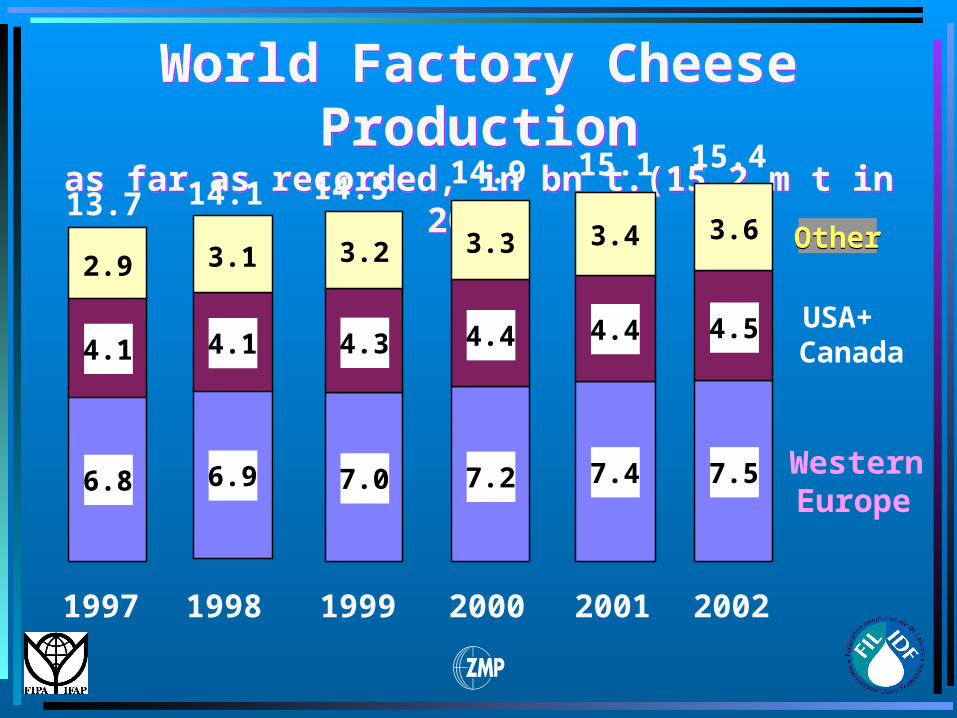
World Factory Cheese Productionas far as recorded, in bn t.(15.2 m t in 2002)
World Factory Cheese Productionas far as recorded, in bn t.(15.2 m t in 2002)
Western Europe
USA+Canada
OtherOther
1997
13.7
6.8
4.1
2.9
1999
14.5
7.0
4.3
3.2
2001
15.1
7.4
4.4
3.4
2002
15.4
7.5
4.5
3.6
2000
14.9
4.4
3.3
7.2
14.1
6.9
4.1
3.1
1998
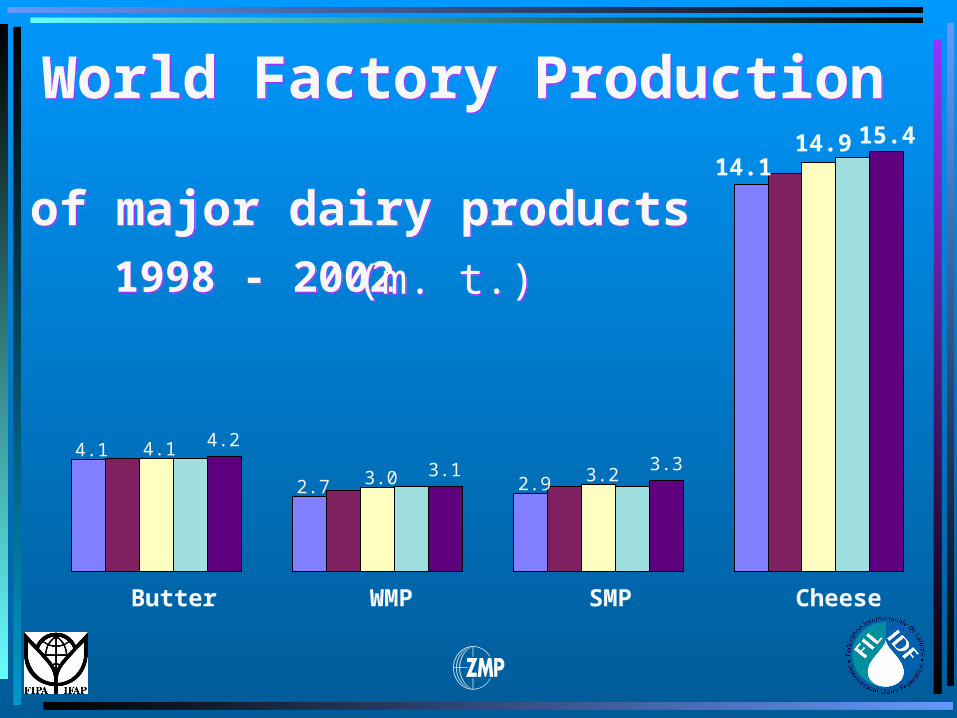
World Factory ProductionWorld Factory Production
of major dairy products of major dairy products
1998 - 2002 1998 - 2002 (m. t.)(m. t.)
4.1
2.7 2.9
14.1
4.1
3.0 3.2
14.9
4.2
3.1 3.3
15.4
Butter WMP SMP Cheese
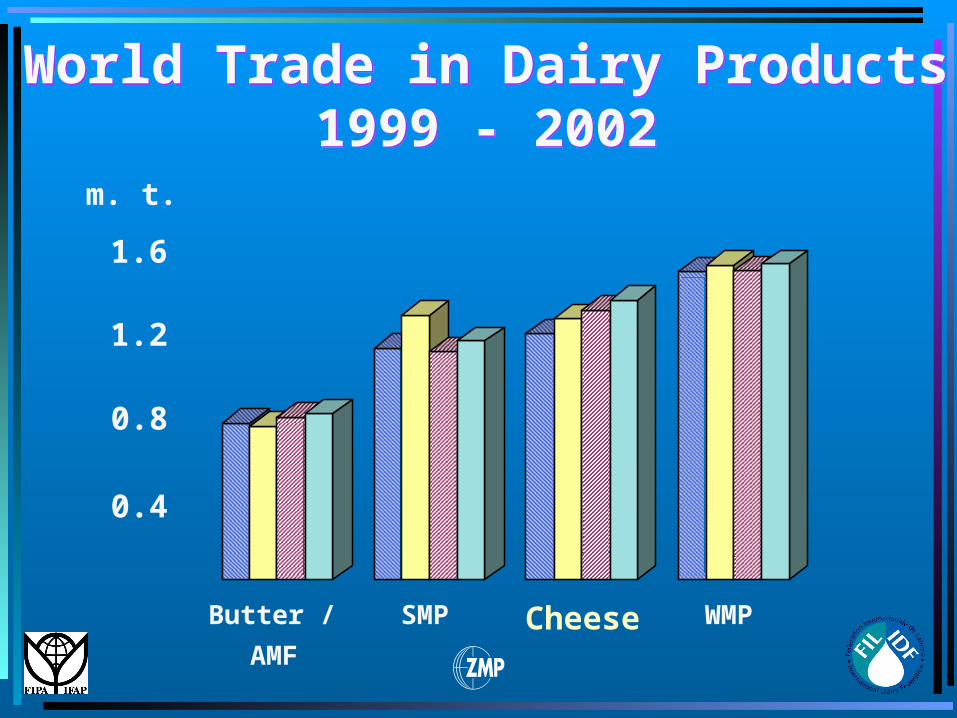
World Trade in Dairy ProductsWorld Trade in Dairy Products1999 - 20021999 - 2002
0.4
0.8
1.2
1.6
Butter /
AMF
SMP Cheese WMP
m. t.
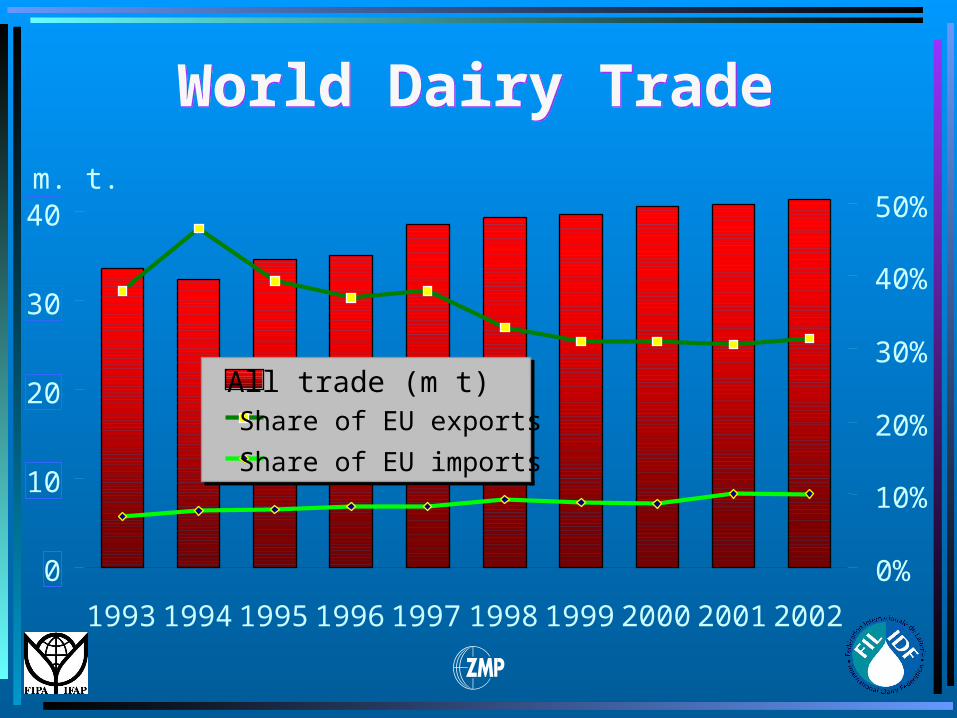
World Dairy Trade World Dairy Trade
0
10
20
30
40
1993 1994 1995 1996 1997 1998 1999 2000 2001 2002
0%
10%
20%
30%
40%
50%
All trade (m t)Share of EU exports
Share of EU imports
m. t.
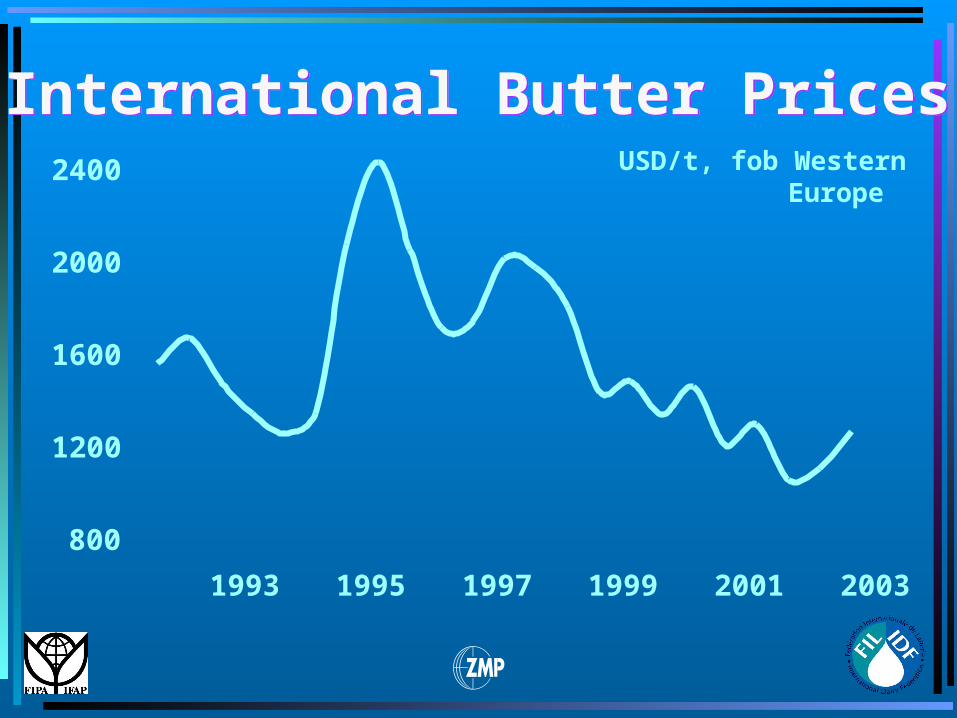
International Butter PricesInternational Butter Prices
800
1200
1600
2000
2400
1993 1995 1997 1999 2001 2003
USD/t, fob Western Europe
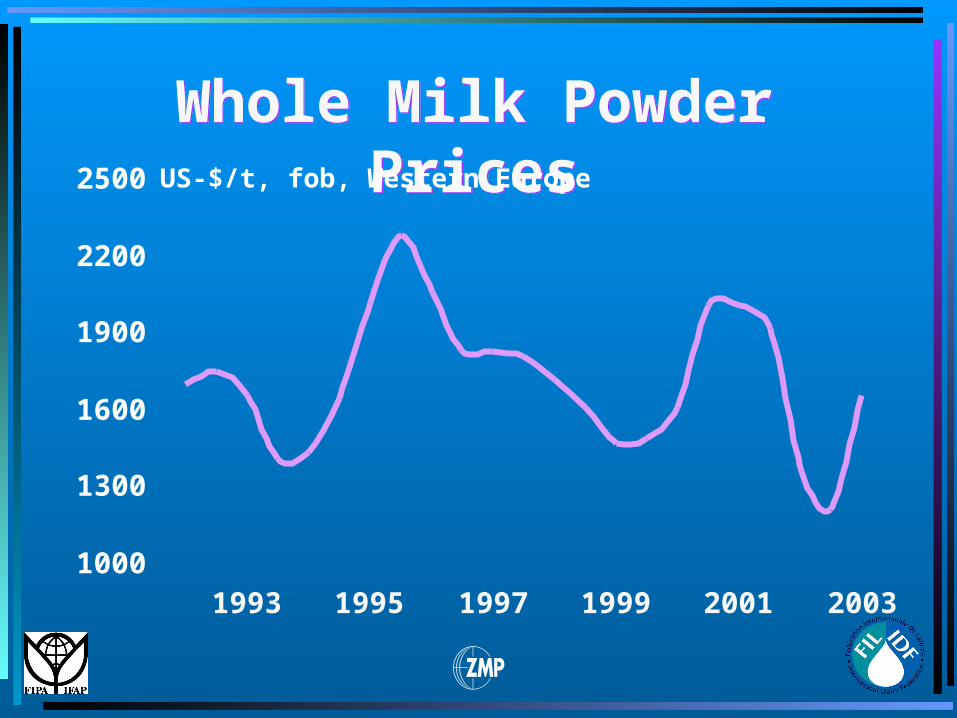
Whole Milk Powder PricesWhole Milk Powder Prices
1000
1300
1600
1900
2200
2500
1993 1995 1997 1999 2001 2003
US-$/t, fob, Western Europe
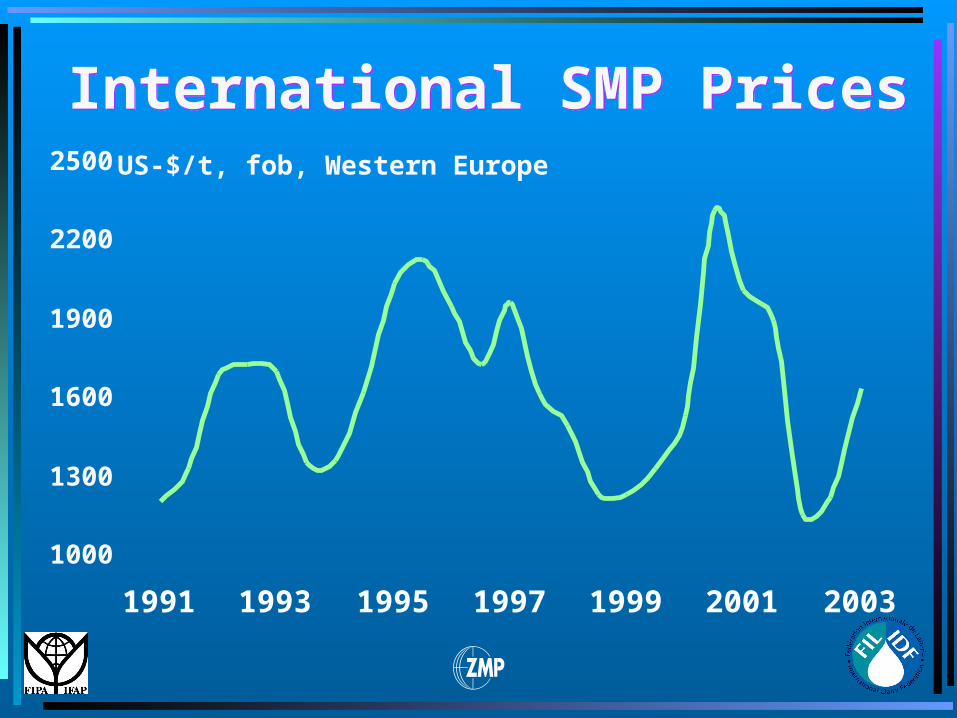
International SMP PricesInternational SMP Prices
1000
1300
1600
1900
2200
2500
1991 1993 1995 1997 1999 2001 2003
US-$/t, fob, Western Europe
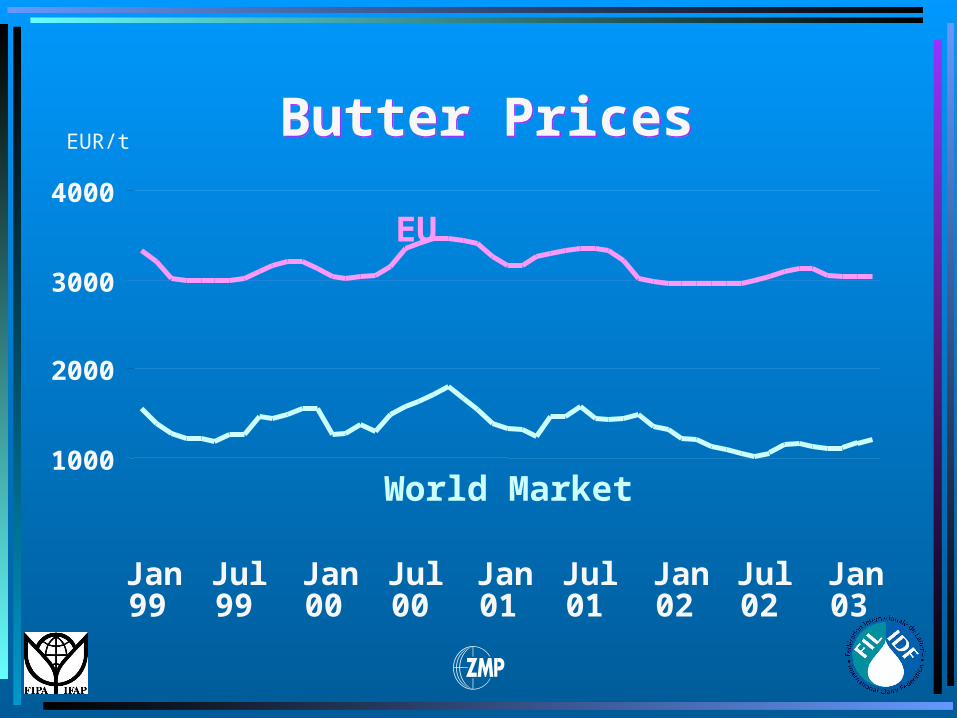
1000
2000
3000
4000
Jan99
Jul99
Jan00
Jul00
Jan01
Jul01
Jan02
Jul02
Jan03
Butter PricesButter PricesEUR/t
EU
World Market
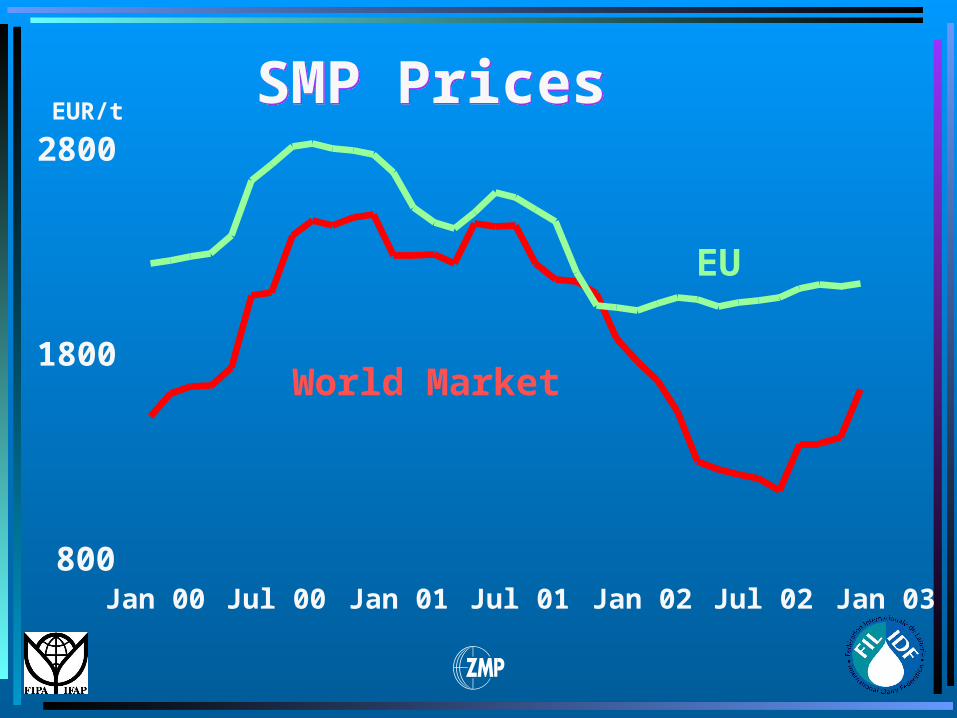
SMP Prices SMP Prices
800
1800
2800
Jan 00 Jul 00 Jan 01 Jul 01 Jan 02 Jul 02 Jan 03
EUR/t
EU
World Market
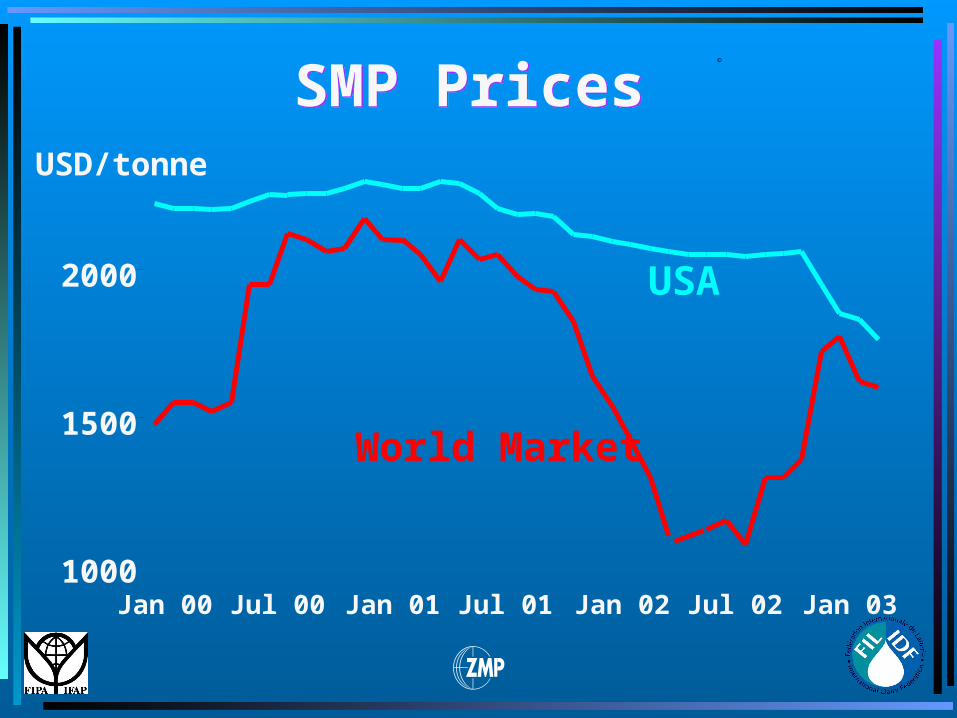
1000
1500
2000
Jan 00 Jul 00 Jan 01 Jul 01 Jan 02 Jul 02 Jan 03
SMP Prices SMP Prices USD/tonne
©
USA
World Market
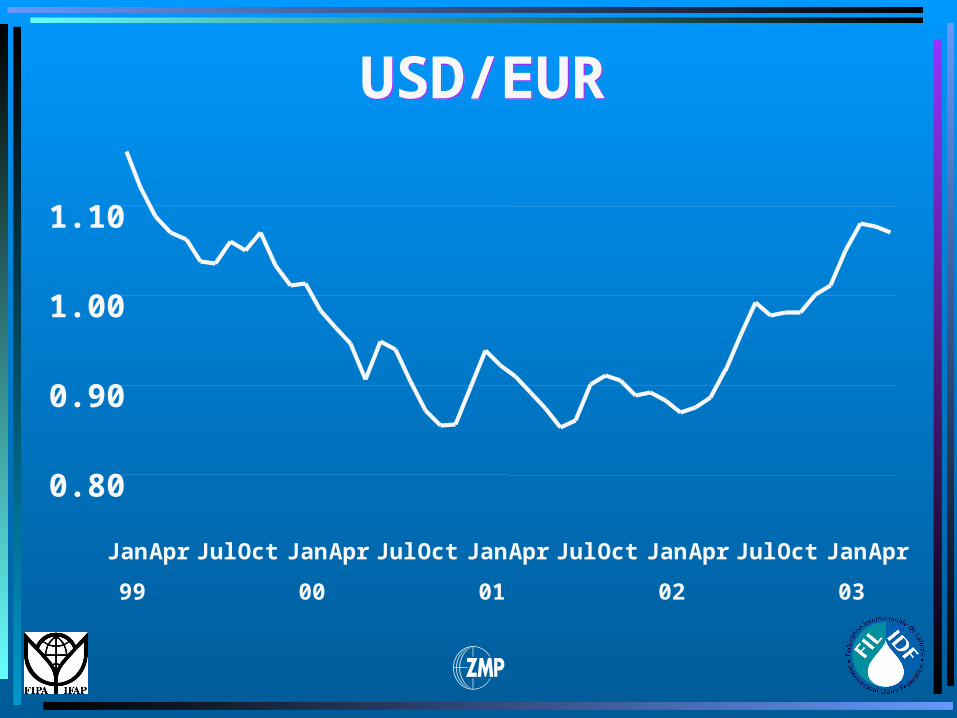
0.80
0.90
1.00
1.10
Jan
99
Apr JulOct Jan
00
Apr JulOct Jan
01
Apr JulOct Jan
02
Apr JulOct Jan
03
Apr
USD/EURUSD/EUR

World Dairy Situation 2003First Preview
World Dairy Situation 2003First Preview
Thank You For Thank You For
Your AttentionYour Attention
World Dairy Situation 2003World Dairy Situation 2003
This new issue will be presented in greater detail at the IDF Centenary in Bruges in September 2003. It will be published as an IDF Bulletin and will
be made available through IDF