Embed Size (px)
Citation preview
Fund FactsheetIFSL Sinfonia Risk Targeted Fund Range
Performance to 30th April 2018
INVESTMENT AREA: Multi-Asset Risk-Targeted
OEIC: Fund of Funds
IFSL Sinfonia OEIC Portfolios Performance to 30th April 2018
Investment Commentary
The month began with a war of words between the United States and China, raising fears of an escalation in trade tensions. The announcements of sanctions against Chinese products and threats of reprisals by Beijing, with further mention of a ‘trade war’ by the US Treasury Secretary did little to help soothe nerves. The Chinese president then appeared to offer some goodwill gestures, hinting that customs tariffs could be reduced on vehicles and other imports and raising the issue of intellectual property, comments welcomed by President Trump. We saw similar sentiment easing on the geopolitical front, with the month starting with strikes against military sites in Syria and ending with a historic handshake between the leaders of North and South Korea. It is too early to say how trade negotiations and diplomatic rapprochements will play out, but this clear relaxation in the international environment allowed investors to focus more on macroeconomic and microeconomic fundamentals, which overall were deemed favourable.
After two consecutive months of declines, the MSCI AC World index gained 0.6% in April, but that was not enough to claw back its year-to-date losses (-0.7%). Emerging markets underperformed, due to declines in Russian shares and the drop in the rouble triggered by new US sanctions. The MSCI Emerging Markets index thus lost 0.6% in dollar terms. In local currency terms, the major markets achieved the following gains: just 0.3% by the S&P 500, 4.7% by the Nikkei 225, 5.2% by the EuroStoxx 50 and an impressive 6.42% gain by the FTSE100.
The shifts in monetary policy expectations had a large effect on Sterling and UK government bond yields during the month. The Bank of England’s comments in March had convinced investors that key rates were likely to be raised at the 10 May meeting. But some doubt was cast in April by disappointing economic indicators, such as very modest growth in first quarter GDP
(+0.1%) and a statement from Governor Carney. The EUR/GBP fell in mid-April to a low since May 2017 but recovered to end the month at 0.8774, almost unchanged versus the end of March. Amidst general USD strength Sterling lost 1.9% to the dollar falling to 1.3760, partly helping buoy the local equity market.
In the bond market, Gilts initially sold off as yields moved up above 1.55% before rate hike expectations were pushed out and the upward trend reversed in the final week. Despite this late move, yields were still up on the month from 1.35% to 1.42%. Also very much in focus was the 10 year US treasury surpassing the 3% level in April. This is the highest level seen since late 2013, ending the month just below the mark at 2.95%, up by 21bp on the month and by 54bp in the year to date. This reflects the accumulation of solid economic data, the acceleration of inflation and expectations of higher key rates. Higher oil prices (+5.6% in April to USD 68.5/bbl. for WTI) contributed to an increase in inflation break-even points, although pressures on wages and costs do not seem to be any cause for concern.
April 2018 will likely be seen as a transition month during which international equities were driven by disruptive news on the US’s trade policy and the reactions of its partners without anyone taking this poker game too seriously. Even so, investors cheered the headway that was announced, such as Xi Jinping’s promise at the Boao Forum for Asia of a further opening of the Chinese economy, and an apparent easing of tensions between North and South Korea. Not all issues have been resolved, particularly on the trade front, but this calmer international environment gave investors an opportunity to focus once again on fundamentals. Beyond the recurring questions on how long this expansion can last (given that in July it will enter its 10th year in the US), the scenario of robust growth and moderate inflation looks safe.
Market Overview
INVESTMENT AREA: Multi-Asset Risk-Targeted
OEIC: Fund of Funds
IFSL Sinfonia OEIC Portfolios Performance to 30th April 2018
Sinfonia Adventurous GrowthAfter a rather eventful first quarter of 2018, the portfolio was well positioned for the more stabilised risk recovery we saw in April. Our key asset allocation views have not materially changed over the month; the fund remains long European equities, where we see more attractive valuations and good earnings fundamentals, long Emerging versus US Equity and slightly underweight Fixed Income assets. On the cusp of what we expected to be a positive company reporting season, we extended our long position in US bank equities versus the overall US market. This relative value trade should perform as banks typically benefit as yields rises enhance profitability and margins. Moreover on the horizon we see a shift to a more market friendly regulatory environment in the US which again should favour this exposure. Equity was clearly the main driver to fund returns this month with very strong contribution coming from the UK and Europe positions. Sterling weakness also had a positive impact on the portfolio this month.
Sinfonia Balanced ManagedAfter a rather eventful first quarter of 2018, the portfolio was well positioned for the more stabilised risk recovery we saw in April. Our key asset allocation views have not materially changed over the month; the fund remains long European equities, where we see more attractive valuations and good earnings fundamentals, long Emerging versus US Equity and slightly underweight Fixed Income assets. On the cusp of what we expected to be a positive company reporting season, we extended our long position in US bank equities versus the overall US market. This relative value trade should perform as banks typically benefit as yields rises enhance profitability and margins. Moreover on the horizon we see a shift to a more market friendly regulatory environment in the US which again should favour this exposure. Equity was clearly the main driver to fund returns this month with very strong contribution coming from the UK and Europe positions. Sterling weakness also had a positive impact on the portfolio this month.
Sinfonia Income & GrowthAfter a rather eventful first quarter of 2018, the portfolio was well positioned for the more stabilised risk recovery we saw in April. Our key asset allocation views have not materially changed over the month; the fund remains long European equities, where we see more attractive valuations and good earnings fundamentals, long Emerging versus US Equity and slightly underweight Fixed Income assets. On the cusp of what we expected to be a positive company reporting season, we extended our long position in US bank equities versus the overall US market. This relative value trade should perform as banks typically benefit as yields rises enhance profitability and margins. Moreover on the horizon we see a shift to a more market friendly regulatory environment in the US which again should favour this exposure. Equity was clearly the main driver to fund returns this month with very strong contribution coming from the UK and Europe positions. Sterling weakness also had a positive impact on the portfolio this month.
Sinfonia Cautious ManagedAfter a rather eventful first quarter of 2018, the portfolio was well positioned for the more stabilised risk recovery we saw in April. Our key asset allocation views have not materially changed over the month; the fund remains long European equities, where we see more attractive valuations and good earnings fundamentals, long Emerging versus US Equity and underweight Duration. On the cusp of what we expected to be a positive company reporting season, we extended our long position in US bank equities versus the overall US market. This relative value trade should perform as banks typically benefit as yields rises enhance profitability and margins. Equity was clearly the main driver to fund returns this month with very strong contribution coming from the UK and Europe positions. UK Government bonds detracted for most of the month until diminishing expectations of any BoE action to come in May helped the asset class rally in the closing week. Our underweight duration position benefitted the portfolio during April.
Sinfonia IncomeAfter a rather eventful first quarter of 2018, the portfolio was well positioned for the more stabilised risk recovery we saw in April. Our key asset allocation views have not materially changed over the month; the fund remains long European equities, where we see more attractive valuations and good earnings fundamentals, long Emerging versus US Equity and underweight Duration. On the cusp of what we expected to be a positive company reporting season, we extended our long position in US bank equities versus the overall US market. This relative value trade should perform as banks typically benefit as yields rises enhance profitability and margins. Equity was clearly the main driver to fund returns this month with very strong contribution coming from the UK and Europe positions. UK Government bonds detracted for most of the month until diminishing expectations of any BoE action to come in May helped the asset class rally in the closing week. Our underweight duration position benefitted the portfolio during April.
Portfolio Updates
INVESTMENT AREA: Multi-Asset Risk-Targeted
OEIC: Fund of Funds
Fund Type Fund Value Currency Minimum investment Deal closing time Daily valuation point Launch date Unit Type Sponsor Investment Manager ACD Yield OCF (share class A) XD Date Payment date
Fund Facts
IFSL Sinfonia Income Portfolio April 2018
BlackRock UK Credit Screened Fund 17.34%
Vanguard UK Government Bond UCITS ETF 15.05%
Legal & General All Stocks Gilt Index Trust 12.98%
Parvest Bond World X Cap 9.24%
Amundi Bond Global Aggregate IHE C 8.03%
TOTAL 62.64%
Risk Warning – Past performance is not a guide to the future performance. Investments can go down as well as up and investors may not get back the amount originally invested. This can be as a result of market movements and exchange rates between currencies. The Fund may invest in fixed interest funds, which are subject to market and credit risk and will be impacted by interest rates. The Fund’s underlying investments may include emerging markets which may be less liquid and more volatile than more developed markets. Important Information – Copies of the Prospectus and Key Investor Information Documents are available from www.ifslfunds.com or can be requested as a paper copy by calling 0808 178 9322 or writing to IFSL Sinfonia, Marlborough House, 59 Chorley New Road, Bolton BL1 4QP.
IFSL Sinfonia Income Portfolio
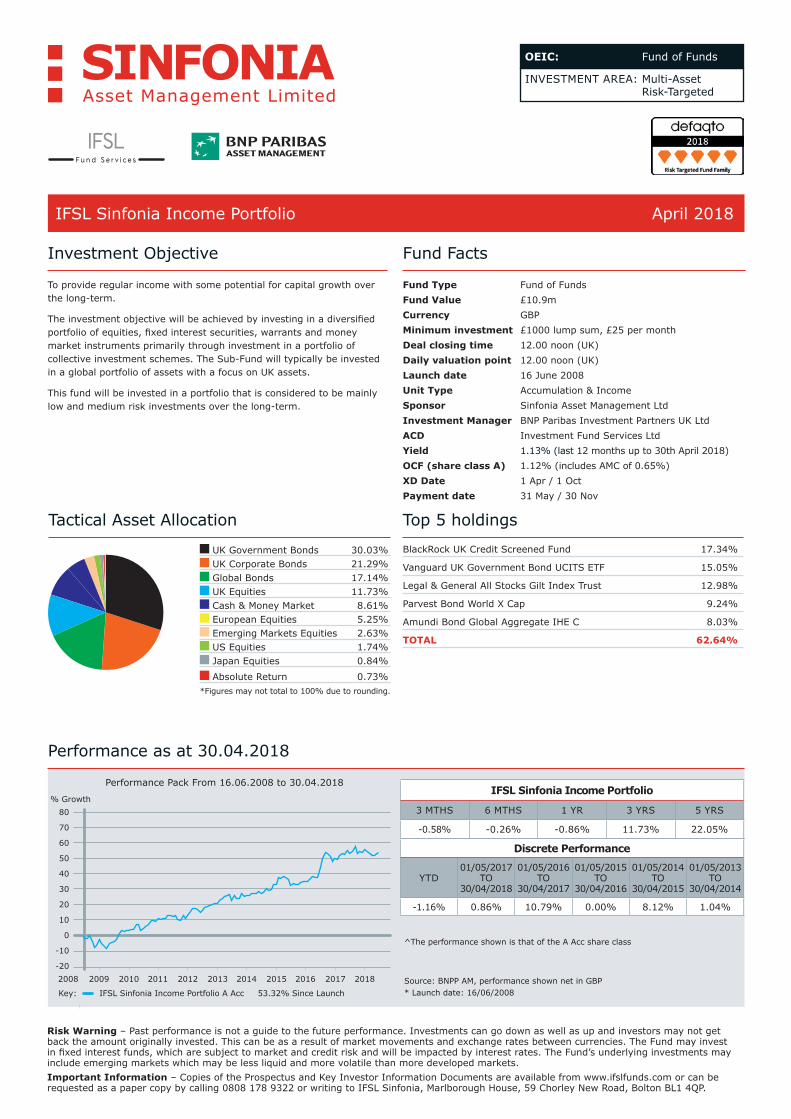
UK Government Bonds 33.66% UK Corporate Bonds 20.98% Global Bonds 16.88% UK Equities 10.78% Cash & Money Market 6.94% European Equities 5.02% Emerging Markets Equities 2.57% US Equities 1.66% Japan Equities 0.81% Absolute Return 0.71%
*Figures may not total to 100% due to rounding.
Investment Objective
To provide regular income with some potential for capital growth over the long-term.
The investment objective will be achieved by investing in a diversified portfolio of equities, fixed interest securities, warrants and money market instruments primarily through investment in a portfolio of collective investment schemes. The Sub-Fund will typically be invested in a global portfolio of assets with a focus on UK assets.
This fund will be invested in a portfolio that is considered to be mainly low and medium risk investments over the long-term.
Fund of Funds £10.9mGBP £1000 lump sum, £25 per month 12.00 noon (UK) 12.00 noon (UK) 16 June 2008 Accumulation & Income Sinfonia Asset Management Ltd BNP Paribas Investment Partners UK Ltd Investment Fund Services Ltd 1.13% (last 12 months up to 30th April 2018)1.12% (includes AMC of 0.65%)1 Apr / 1 Oct31 May / 30 Nov
UK Government Bonds 30.03% UK Corporate Bonds 21.29% Global Bonds 17.14% UK Equities 11.73% Cash & Money Market 8.61% European Equities 5.25% Emerging Markets Equities 2.63% US Equities 1.74% Japan Equities 0.84% Absolute Return 0.73%
*Figures may not total to 100% due to rounding.
Top 5 holdings Tactical Asset Allocation
Performance as at 30.04.2018
% Growth
Performance Pack From 16.06.2008 to 30.04.2018
0
10
-10
20
-20
30
40
50
60
70
80
IFSL Sinfonia Income Portfolio A Acc 53.32% Since Launch
2008
Key:
2009 2010 2011 2012 2013 2014 2015 2016 2017 2018
^The performance shown is that of the A Acc share class
Source: BNPP AM, performance shown net in GBP* Launch date: 16/06/2008
Discrete Performance
YTD01/05/2017
TO 30/04/2018
01/05/2016 TO
30/04/2017
01/05/2015 TO
30/04/2016
01/05/2014 TO
30/04/2015
01/05/2013 TO
30/04/2014
-1.16% 0.86% 10.79% 0.00% 8.12% 1.04%
IFSL Sinfonia Income Portfolio
3 MTHS 6 MTHS 1 YR 3 YRS 5 YRS
-0.58% -0.26% -0.86% 11.73% 22.05%
INVESTMENT AREA: Multi-Asset Risk-Targeted
OEIC: Fund of Funds
Fund Type Fund Value Currency Minimum investment Deal closing time Daily valuation point Launch date Unit Type Sponsor Investment Manager ACD Yield OCF (share class A) XD Date Payment date
Fund Facts
IFSL Sinfonia Cautious Managed Portfolio April 2018
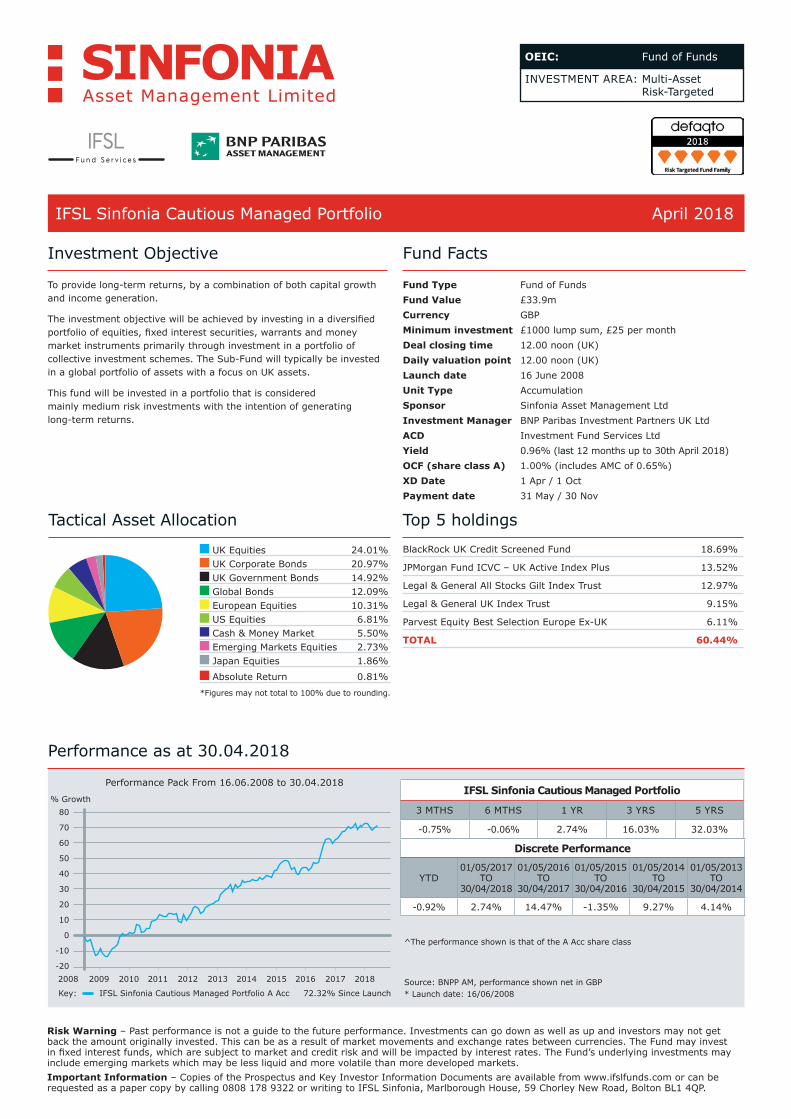
BlackRock UK Credit Screened Fund 18.69%
JPMorgan Fund ICVC – UK Active Index Plus 13.52%
Legal & General All Stocks Gilt Index Trust 12.97%
Legal & General UK Index Trust 9.15%
Parvest Equity Best Selection Europe Ex-UK 6.11%
TOTAL 60.44%
IFSL Sinfonia Cautious Managed Portfolio
UK Equities 22.96% UK Corporate Bonds 21.40% UK Government Bonds 18.64% Global Bonds 12.19% European Equities 10.17% US Equities 6.55% Emerging Markets Equities 2.76% Cash & Money Market 2.67% Japan Equities 1.85% Absolute Return 0.81%
*Figures may not total to 100% due to rounding.
Investment Objective
To provide long-term returns, by a combination of both capital growth and income generation.
The investment objective will be achieved by investing in a diversified portfolio of equities, fixed interest securities, warrants and money market instruments primarily through investment in a portfolio of collective investment schemes. The Sub-Fund will typically be invested in a global portfolio of assets with a focus on UK assets.
This fund will be invested in a portfolio that is considered mainly medium risk investments with the intention of generating long-term returns.
Fund of Funds £33.9m GBP £1000 lump sum, £25 per month 12.00 noon (UK) 12.00 noon (UK) 16 June 2008 Accumulation Sinfonia Asset Management Ltd BNP Paribas Investment Partners UK Ltd Investment Fund Services Ltd 0.96% (last 12 months up to 30th April 2018)1.00% (includes AMC of 0.65%)1 Apr / 1 Oct31 May / 30 Nov
UK Equities 24.01% UK Corporate Bonds 20.97% UK Government Bonds 14.92% Global Bonds 12.09% European Equities 10.31% US Equities 6.81% Cash & Money Market 5.50% Emerging Markets Equities 2.73% Japan Equities 1.86% Absolute Return 0.81%
*Figures may not total to 100% due to rounding.
Top 5 holdings Tactical Asset Allocation
Performance as at 30.04.2018
% Growth
Performance Pack From 16.06.2008 to 30.04.2018
0
10
-10
20
-20
30
40
50
60
70
80
IFSL Sinfonia Cautious Managed Portfolio A Acc 72.32% Since Launch
2008
Key:Source: BNPP AM, performance shown net in GBP* Launch date: 16/06/2008
Risk Warning – Past performance is not a guide to the future performance. Investments can go down as well as up and investors may not get back the amount originally invested. This can be as a result of market movements and exchange rates between currencies. The Fund may invest in fixed interest funds, which are subject to market and credit risk and will be impacted by interest rates. The Fund’s underlying investments may include emerging markets which may be less liquid and more volatile than more developed markets. Important Information – Copies of the Prospectus and Key Investor Information Documents are available from www.ifslfunds.com or can be requested as a paper copy by calling 0808 178 9322 or writing to IFSL Sinfonia, Marlborough House, 59 Chorley New Road, Bolton BL1 4QP.
Discrete Performance
YTD01/05/2017
TO 30/04/2018
01/05/2016 TO
30/04/2017
01/05/2015 TO
30/04/2016
01/05/2014 TO
30/04/2015
01/05/2013 TO
30/04/2014
-0.92% 2.74% 14.47% -1.35% 9.27% 4.14%
IFSL Sinfonia Cautious Managed Portfolio
3 MTHS 6 MTHS 1 YR 3 YRS 5 YRS
-0.75% -0.06% 2.74% 16.03% 32.03%
2009 2010 2011 2012 2013 2014 2015 2016 2017 2018
^The performance shown is that of the A Acc share class
INVESTMENT AREA: Multi-Asset Risk-Targeted
OEIC: Fund of Funds
Fund Type Fund Value Currency Minimum investment Deal closing time Daily valuation point Launch date Unit Type Sponsor Investment Manager ACD Yield OCF (share class A) XD Date Payment date
Fund Facts
IFSL Sinfonia Income & Growth Portfolio April 2018
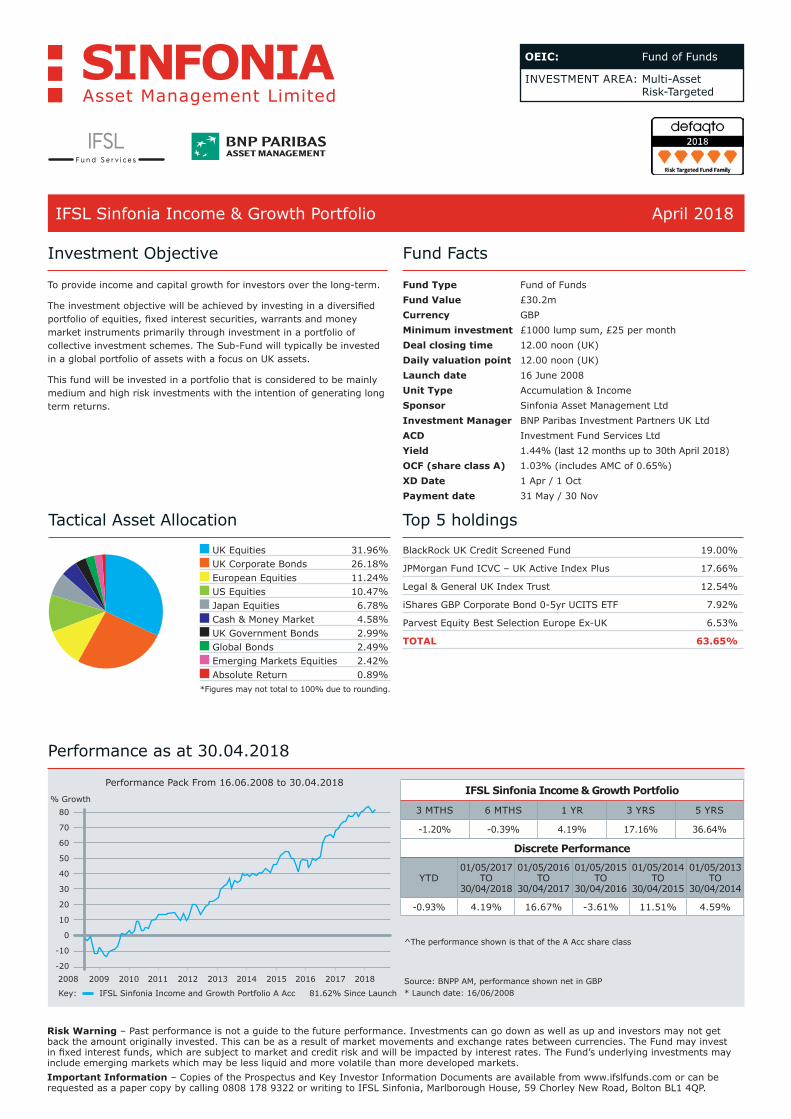
BlackRock UK Credit Screened Fund 19.00%
JPMorgan Fund ICVC – UK Active Index Plus 17.66%
Legal & General UK Index Trust 12.54%
iShares GBP Corporate Bond 0-5yr UCITS ETF 7.92%
Parvest Equity Best Selection Europe Ex-UK 6.53%
TOTAL 63.65%
IFSL Sinfonia Income & Growth Portfolio
UK Equities 30.99% UK Corporate Bonds 26.97% European Equities 11.30% US Equities 10.38% Japan Equities 6.85% UK Government Bonds 5.09% Cash & Money Market 2.75% Emerging Markets Equities 2.49% Global Bonds 2.25% Absolute Return 0.91%
*Figures may not total to 100% due to rounding.
Investment Objective
To provide income and capital growth for investors over the long-term.
The investment objective will be achieved by investing in a diversified portfolio of equities, fixed interest securities, warrants and money market instruments primarily through investment in a portfolio of collective investment schemes. The Sub-Fund will typically be invested in a global portfolio of assets with a focus on UK assets.
This fund will be invested in a portfolio that is considered to be mainly medium and high risk investments with the intention of generating long term returns.
Fund of Funds £30.2m GBP £1000 lump sum, £25 per month 12.00 noon (UK) 12.00 noon (UK) 16 June 2008 Accumulation & Income Sinfonia Asset Management Ltd BNP Paribas Investment Partners UK Ltd Investment Fund Services Ltd 1.44% (last 12 months up to 30th April 2018)1.03% (includes AMC of 0.65%)1 Apr / 1 Oct31 May / 30 Nov
UK Equities 31.96% UK Corporate Bonds 26.18% European Equities 11.24% US Equities 10.47% Japan Equities 6.78% Cash & Money Market 4.58% UK Government Bonds 2.99% Global Bonds 2.49% Emerging Markets Equities 2.42% Absolute Return 0.89%
*Figures may not total to 100% due to rounding.
Top 5 holdings Tactical Asset Allocation
Performance as at 30.04.2018
% Growth
Performance Pack From 16.06.2008 to 30.04.2018
0
10
-10
20
-20
30
40
50
60
70
80
2008
IFSL Sinfonia Income and Growth Portfolio A Acc 81.62% Since Launch Key:Source: BNPP AM, performance shown net in GBP* Launch date: 16/06/2008
Risk Warning – Past performance is not a guide to the future performance. Investments can go down as well as up and investors may not get back the amount originally invested. This can be as a result of market movements and exchange rates between currencies. The Fund may invest in fixed interest funds, which are subject to market and credit risk and will be impacted by interest rates. The Fund’s underlying investments may include emerging markets which may be less liquid and more volatile than more developed markets. Important Information – Copies of the Prospectus and Key Investor Information Documents are available from www.ifslfunds.com or can be requested as a paper copy by calling 0808 178 9322 or writing to IFSL Sinfonia, Marlborough House, 59 Chorley New Road, Bolton BL1 4QP.
Discrete Performance
YTD01/05/2017
TO 30/04/2018
01/05/2016 TO
30/04/2017
01/05/2015 TO
30/04/2016
01/05/2014 TO
30/04/2015
01/05/2013 TO
30/04/2014
-0.93% 4.19% 16.67% -3.61% 11.51% 4.59%
IFSL Sinfonia Income & Growth Portfolio
3 MTHS 6 MTHS 1 YR 3 YRS 5 YRS
-1.20% -0.39% 4.19% 17.16% 36.64%
2009 2010 2011 2012 2013 2014 2015 2016 2017 2018
^The performance shown is that of the A Acc share class
INVESTMENT AREA: Multi-Asset Risk-Targeted
OEIC: Fund of Funds
September 2015IFSL Sinfonia Balanced Managed Portfolio
UK Equities 32.64% UK Corporate Bonds 22.08% European Equities 11.08% US Equities 10.82% Emerging Markets Equities 7.84% Japan Equities 6.85% Asian Equities ex Japan 4.67% Cash & Money Market 3.01% Absolute Return 1.01%
*Figures may not total to 100% due to rounding.
Fund Type Fund Value Currency Minimum investment Deal closing time Daily valuation point Launch date Unit Type Sponsor Investment Manager ACD Yield OCF (share class A) XD Date Payment date
Fund Facts
IFSL Sinfonia Balanced Managed Portfolio April 2018
Top 5 holdings
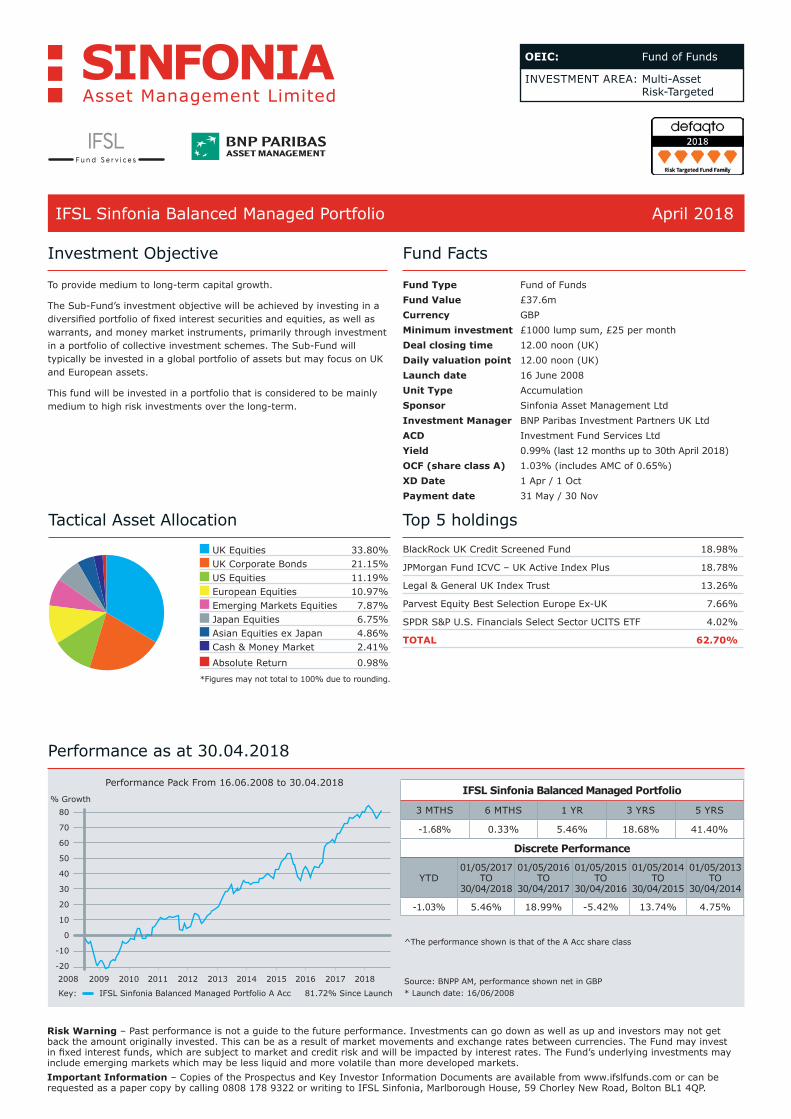
BlackRock UK Credit Screened Fund 18.98%
JPMorgan Fund ICVC – UK Active Index Plus 18.78%
Legal & General UK Index Trust 13.26%
Parvest Equity Best Selection Europe Ex-UK 7.66%
SPDR S&P U.S. Financials Select Sector UCITS ETF 4.02%
TOTAL 62.70%
Tactical Asset Allocation
UK Equities 33.80% UK Corporate Bonds 21.15% US Equities 11.19% European Equities 10.97% Emerging Markets Equities 7.87% Japan Equities 6.75% Asian Equities ex Japan 4.86% Cash & Money Market 2.41% Absolute Return 0.98%
*Figures may not total to 100% due to rounding.
Investment Objective
To provide medium to long-term capital growth.
The Sub-Fund’s investment objective will be achieved by investing in a diversified portfolio of fixed interest securities and equities, as well as warrants, and money market instruments, primarily through investment in a portfolio of collective investment schemes. The Sub-Fund will typically be invested in a global portfolio of assets but may focus on UK and European assets.
This fund will be invested in a portfolio that is considered to be mainly medium to high risk investments over the long-term.
Fund of Funds £37.6m GBP £1000 lump sum, £25 per month 12.00 noon (UK) 12.00 noon (UK) 16 June 2008 Accumulation Sinfonia Asset Management Ltd BNP Paribas Investment Partners UK Ltd Investment Fund Services Ltd 0.99% (last 12 months up to 30th April 2018)1.03% (includes AMC of 0.65%)1 Apr / 1 Oct31 May / 30 Nov
Performance as at 30.04.2018
% Growth
Performance Pack From 16.06.2008 to 30.04.2018
0
10
-10
20
-20
30
40
50
60
70
80
2008
IFSL Sinfonia Balanced Managed Portfolio A Acc 81.72% Since Launch Key:Source: BNPP AM, performance shown net in GBP* Launch date: 16/06/2008
Risk Warning – Past performance is not a guide to the future performance. Investments can go down as well as up and investors may not get back the amount originally invested. This can be as a result of market movements and exchange rates between currencies. The Fund may invest in fixed interest funds, which are subject to market and credit risk and will be impacted by interest rates. The Fund’s underlying investments may include emerging markets which may be less liquid and more volatile than more developed markets. Important Information – Copies of the Prospectus and Key Investor Information Documents are available from www.ifslfunds.com or can be requested as a paper copy by calling 0808 178 9322 or writing to IFSL Sinfonia, Marlborough House, 59 Chorley New Road, Bolton BL1 4QP.
Discrete Performance
YTD01/05/2017
TO 30/04/2018
01/05/2016 TO
30/04/2017
01/05/2015 TO
30/04/2016
01/05/2014 TO
30/04/2015
01/05/2013 TO
30/04/2014
-1.03% 5.46% 18.99% -5.42% 13.74% 4.75%
IFSL Sinfonia Balanced Managed Portfolio
3 MTHS 6 MTHS 1 YR 3 YRS 5 YRS
-1.68% 0.33% 5.46% 18.68% 41.40%
2009 2010 2011 2012 2013 2014 2015 2016 2017 2018
^The performance shown is that of the A Acc share class
INVESTMENT AREA: Multi-Asset Risk-Targeted
OEIC: Fund of Funds
Fund Type Fund Value Currency Minimum investment Deal closing time Daily valuation point Launch date Unit Type Sponsor Investment Manager ACD Yield OCF (share class A) XD Date Payment date
Fund Facts
IFSL Sinfonia Adventurous Growth Portfolio April 2018
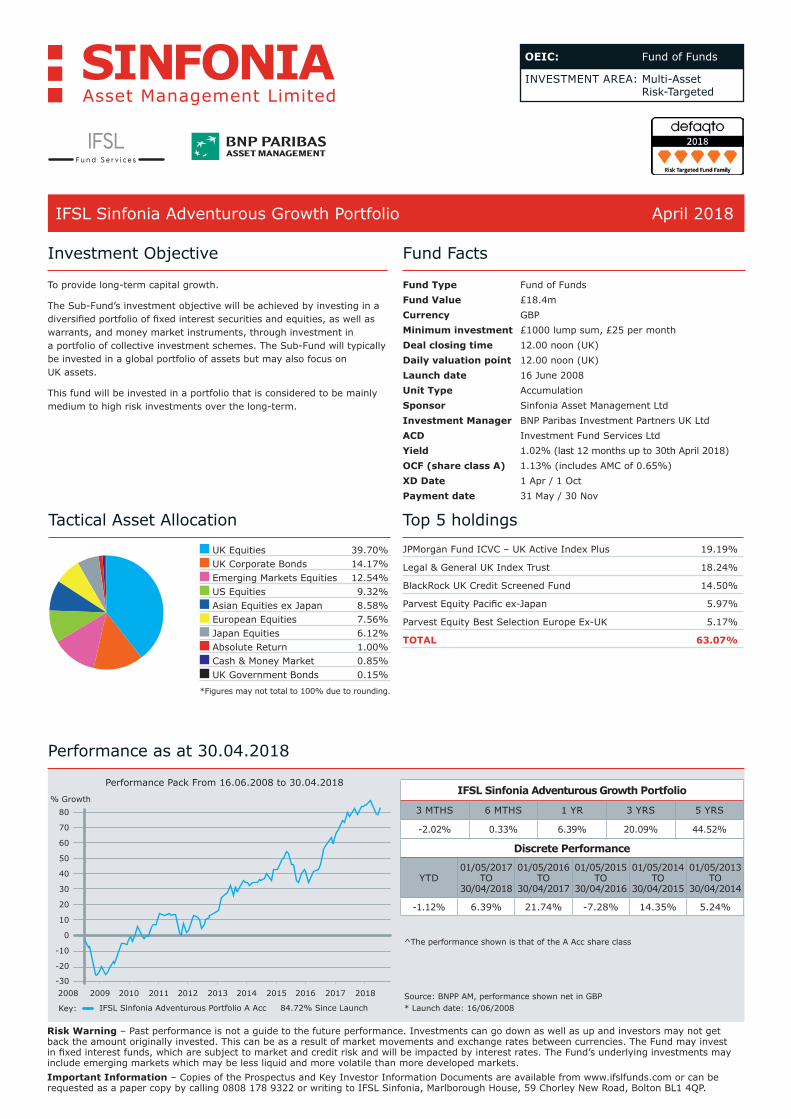
JPMorgan Fund ICVC – UK Active Index Plus 19.19%
Legal & General UK Index Trust 18.24%
BlackRock UK Credit Screened Fund 14.50%
Parvest Equity Pacific ex-Japan 5.97%
Parvest Equity Best Selection Europe Ex-UK 5.17%
TOTAL 63.07%
IFSL Sinfonia Adventurous Growth Portfolio
UK Equities 39.31% UK Corporate Bonds 13.12% Emerging Markets Equities 12.88% US Equities 9.19% Asian Equities ex Japan 8.49% European Equities 7.61% Japan Equities 6.19% Cash & Money Market 2.02% Absolute Return 1.03% UK Government Bonds 0.16%
*Figures may not total to 100% due to rounding.
Investment Objective
To provide long-term capital growth.
The Sub-Fund’s investment objective will be achieved by investing in a diversified portfolio of fixed interest securities and equities, as well as warrants, and money market instruments, through investment in a portfolio of collective investment schemes. The Sub-Fund will typically be invested in a global portfolio of assets but may also focus on UK assets.
This fund will be invested in a portfolio that is considered to be mainly medium to high risk investments over the long-term.
Fund of Funds £18.4m GBP £1000 lump sum, £25 per month 12.00 noon (UK) 12.00 noon (UK) 16 June 2008 Accumulation Sinfonia Asset Management Ltd BNP Paribas Investment Partners UK Ltd Investment Fund Services Ltd 1.02% (last 12 months up to 30th April 2018)1.13% (includes AMC of 0.65%)1 Apr / 1 Oct31 May / 30 Nov
Top 5 holdings Tactical Asset Allocation
UK Equities 39.70% UK Corporate Bonds 14.17% Emerging Markets Equities 12.54% US Equities 9.32% Asian Equities ex Japan 8.58% European Equities 7.56% Japan Equities 6.12% Absolute Return 1.00% Cash & Money Market 0.85% UK Government Bonds 0.15%
*Figures may not total to 100% due to rounding.
% Growth
Performance Pack From 16.06.2008 to 30.04.2018
0
10
-10
20
-20
-30
30
40
50
60
70
80
2008 2010 2011 2012 2013 2014 2015 2016 2017 20182009
IFSL Sinfonia Adventurous Portfolio A Acc 84.72% Since LaunchKey:Source: BNPP AM, performance shown net in GBP* Launch date: 16/06/2008
Risk Warning – Past performance is not a guide to the future performance. Investments can go down as well as up and investors may not get back the amount originally invested. This can be as a result of market movements and exchange rates between currencies. The Fund may invest in fixed interest funds, which are subject to market and credit risk and will be impacted by interest rates. The Fund’s underlying investments may include emerging markets which may be less liquid and more volatile than more developed markets. Important Information – Copies of the Prospectus and Key Investor Information Documents are available from www.ifslfunds.com or can be requested as a paper copy by calling 0808 178 9322 or writing to IFSL Sinfonia, Marlborough House, 59 Chorley New Road, Bolton BL1 4QP.
Performance as at 30.04.2018
Discrete Performance
YTD01/05/2017
TO 30/04/2018
01/05/2016 TO
30/04/2017
01/05/2015 TO
30/04/2016
01/05/2014 TO
30/04/2015
01/05/2013 TO
30/04/2014
-1.12% 6.39% 21.74% -7.28% 14.35% 5.24%
IFSL Sinfonia Adventurous Growth Portfolio
3 MTHS 6 MTHS 1 YR 3 YRS 5 YRS
-2.02% 0.33% 6.39% 20.09% 44.52%
^The performance shown is that of the A Acc share class
IFSL Sinfonia OEIC Portfolios April 2018
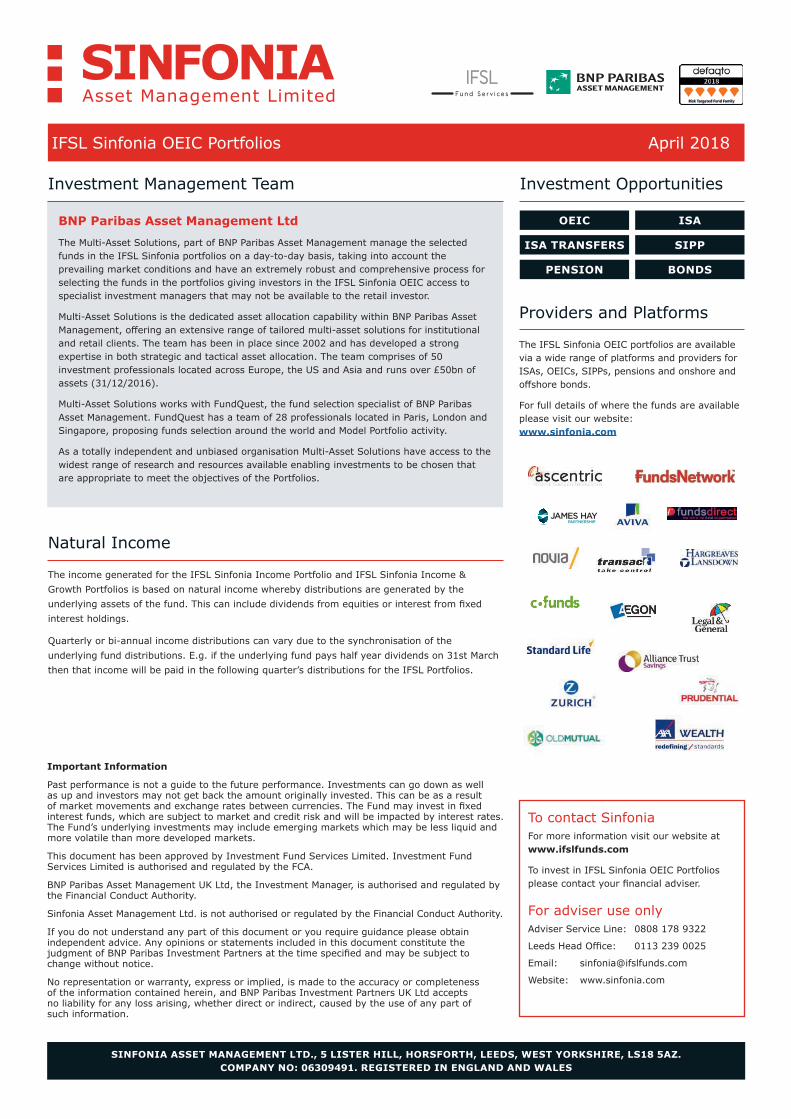
BNP Paribas Asset Management Ltd
The Multi-Asset Solutions, part of BNP Paribas Asset Management manage the selected funds in the IFSL Sinfonia portfolios on a day-to-day basis, taking into account the prevailing market conditions and have an extremely robust and comprehensive process for selecting the funds in the portfolios giving investors in the IFSL Sinfonia OEIC access to specialist investment managers that may not be available to the retail investor.
Multi-Asset Solutions is the dedicated asset allocation capability within BNP Paribas Asset Management, offering an extensive range of tailored multi-asset solutions for institutional and retail clients. The team has been in place since 2002 and has developed a strong expertise in both strategic and tactical asset allocation. The team comprises of 50 investment professionals located across Europe, the US and Asia and runs over £50bn of assets (31/12/2016).
Multi-Asset Solutions works with FundQuest, the fund selection specialist of BNP Paribas Asset Management. FundQuest has a team of 28 professionals located in Paris, London and Singapore, proposing funds selection around the world and Model Portfolio activity.
As a totally independent and unbiased organisation Multi-Asset Solutions have access to the widest range of research and resources available enabling investments to be chosen that are appropriate to meet the objectives of the Portfolios.
Investment Management Team
The IFSL Sinfonia OEIC portfolios are available via a wide range of platforms and providers for ISAs, OEICs, SIPPs, pensions and onshore and offshore bonds.
For full details of where the funds are available please visit our website: www.sinfonia.com
The income generated for the IFSL Sinfonia Income Portfolio and IFSL Sinfonia Income & Growth Portfolios is based on natural income whereby distributions are generated by the underlying assets of the fund. This can include dividends from equities or interest from fixed interest holdings.
Quarterly or bi-annual income distributions can vary due to the synchronisation of the underlying fund distributions. E.g. if the underlying fund pays half year dividends on 31st March then that income will be paid in the following quarter’s distributions for the IFSL Portfolios.
Important Information
Past performance is not a guide to the future performance. Investments can go down as well as up and investors may not get back the amount originally invested. This can be as a result of market movements and exchange rates between currencies. The Fund may invest in fixed interest funds, which are subject to market and credit risk and will be impacted by interest rates. The Fund’s underlying investments may include emerging markets which may be less liquid and more volatile than more developed markets.
This document has been approved by Investment Fund Services Limited. Investment Fund Services Limited is authorised and regulated by the FCA.
BNP Paribas Asset Management UK Ltd, the Investment Manager, is authorised and regulated by the Financial Conduct Authority.
Sinfonia Asset Management Ltd. is not authorised or regulated by the Financial Conduct Authority.
If you do not understand any part of this document or you require guidance please obtain independent advice. Any opinions or statements included in this document constitute the judgment of BNP Paribas Investment Partners at the time specified and may be subject to change without notice.
No representation or warranty, express or implied, is made to the accuracy or completeness of the information contained herein, and BNP Paribas Investment Partners UK Ltd accepts no liability for any loss arising, whether direct or indirect, caused by the use of any part of such information.
SINFONIA ASSET MANAGEMENT LTD., 5 LISTER HILL, HORSFORTH, LEEDS, WEST YORKSHIRE, LS18 5AZ. COMPANY NO: 06309491. REGISTERED IN ENGLAND AND WALES
Investment Opportunities
Providers and Platforms
Natural Income
OEIC
ISA TRANSFERS
PENSION
ISA
SIPP
BONDS
To contact SinfoniaFor more information visit our website at www.ifslfunds.com
To invest in IFSL Sinfonia OEIC Portfolios please contact your financial adviser.
For adviser use onlyAdviser Service Line: 0808 178 9322
Leeds Head Office: 0113 239 0025
Email: [email protected]
Website: www.sinfonia.com
IFSL Sinfonia OEIC Portfolios April 2018
Asset Class Returns
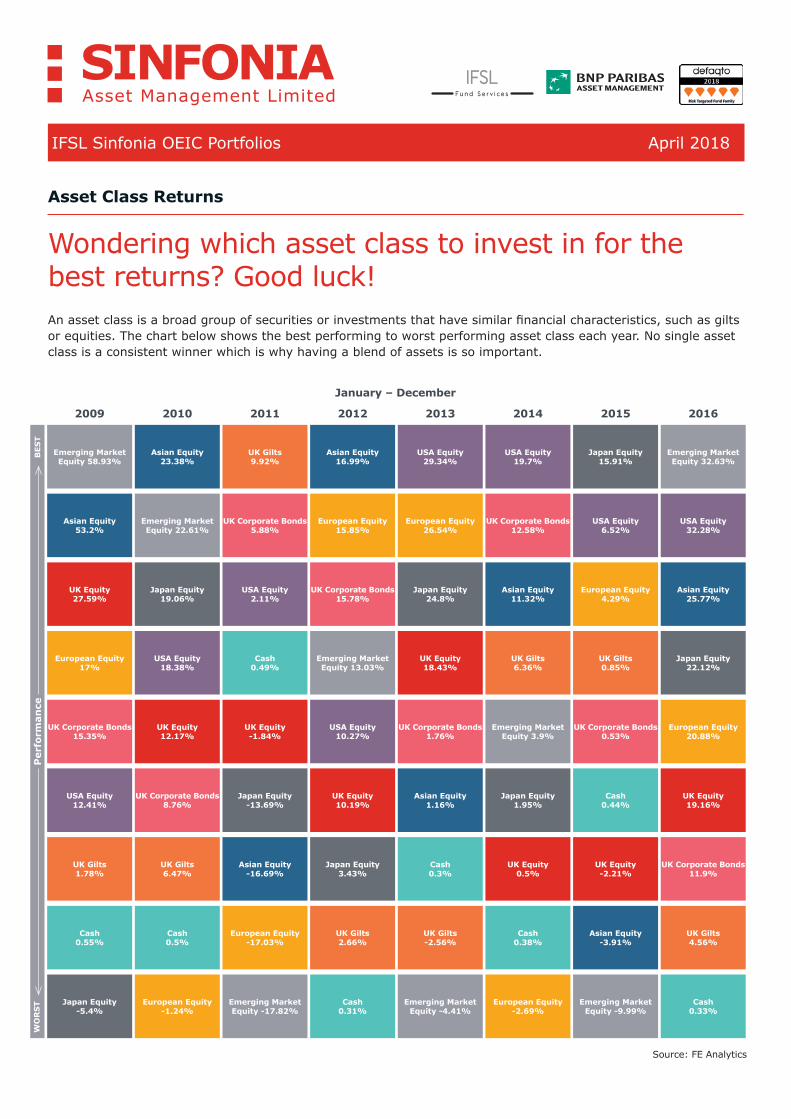
Wondering which asset class to invest in for the best returns? Good luck! An asset class is a broad group of securities or investments that have similar financial characteristics, such as gilts or equities. The chart below shows the best performing to worst performing asset class each year. No single asset class is a consistent winner which is why having a blend of assets is so important.
Per
form
ance
BES
TW
OR
ST
Emerging Market Equity 58.93%
2009
January – December
Asian Equity 53.2%
UK Equity 27.59%
European Equity 17%
UK Corporate Bonds 15.35%
USA Equity 12.41%
UK Gilts 1.78%
Cash 0.55%
Japan Equity -5.4%
Asian Equity 23.38%
2010
Emerging Market Equity 22.61%
Japan Equity 19.06%
USA Equity 18.38%
UK Equity 12.17%
UK Corporate Bonds 8.76%
UK Gilts 6.47%
Cash 0.5%
European Equity -1.24%
UK Gilts 9.92%
2011
UK Corporate Bonds 5.88%
USA Equity 2.11%
Cash 0.49%
UK Equity -1.84%
Japan Equity -13.69%
Asian Equity -16.69%
European Equity -17.03%
Emerging Market Equity -17.82%
Asian Equity 16.99%
2012
European Equity 15.85%
UK Corporate Bonds 15.78%
Emerging Market Equity 13.03%
USA Equity 10.27%
UK Equity 10.19%
Japan Equity 3.43%
UK Gilts 2.66%
Cash 0.31%
USA Equity 29.34%
2013
European Equity 26.54%
Japan Equity 24.8%
UK Equity 18.43%
UK Corporate Bonds 1.76%
Asian Equity 1.16%
Cash 0.3%
UK Gilts -2.56%
Emerging Market Equity -4.41%
USA Equity 19.7%
2014
UK Corporate Bonds 12.58%
Asian Equity 11.32%
UK Gilts 6.36%
Emerging Market Equity 3.9%
Japan Equity 1.95%
UK Equity 0.5%
Cash 0.38%
European Equity -2.69%
Japan Equity 15.91%
2015
USA Equity 6.52%
European Equity 4.29%
UK Gilts 0.85%
UK Corporate Bonds 0.53%
Cash 0.44%
UK Equity -2.21%
Asian Equity -3.91%
Emerging Market Equity -9.99%
Emerging Market Equity 32.63%
2016
USA Equity 32.28%
Asian Equity 25.77%
Japan Equity 22.12%
European Equity 20.88%
UK Equity 19.16%
UK Corporate Bonds 11.9%
UK Gilts 4.56%
Cash 0.33%
Source: FE Analytics
IFSL Sinfonia OEIC Portfolios April 2018
Asset Class Returns
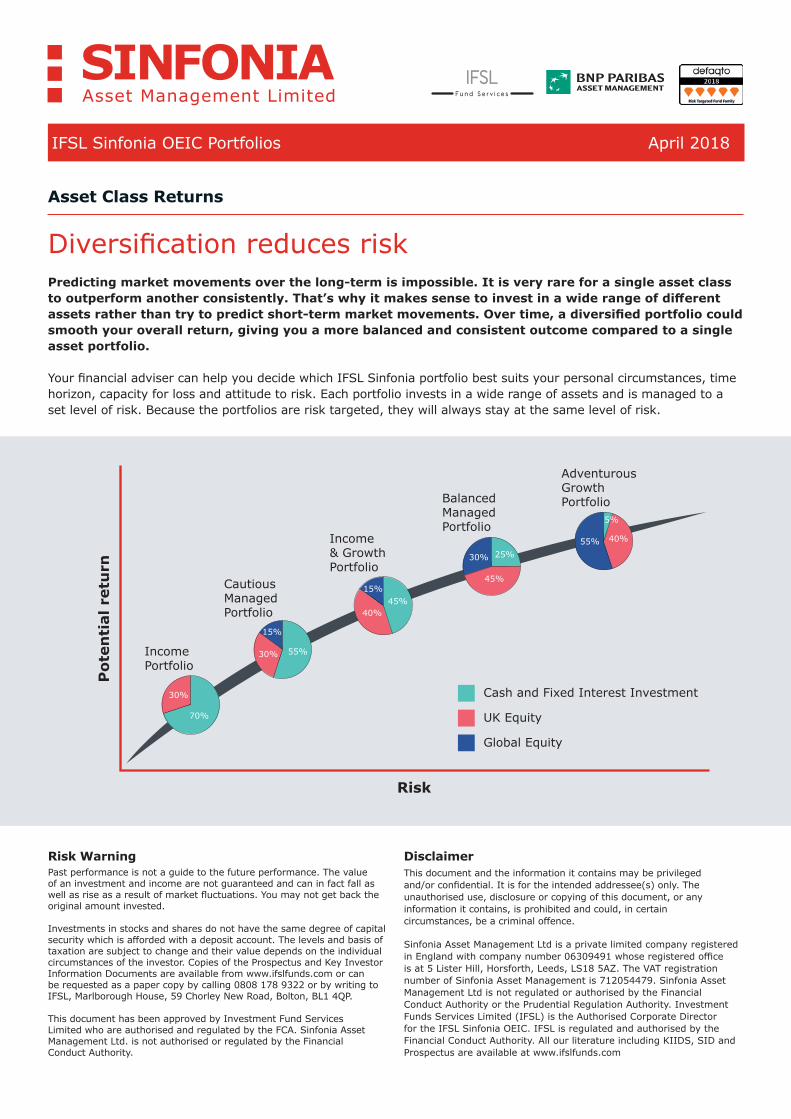
Diversification reduces risk Predicting market movements over the long-term is impossible. It is very rare for a single asset class to outperform another consistently. That’s why it makes sense to invest in a wide range of different assets rather than try to predict short-term market movements. Over time, a diversified portfolio could smooth your overall return, giving you a more balanced and consistent outcome compared to a single asset portfolio.
Your financial adviser can help you decide which IFSL Sinfonia portfolio best suits your personal circumstances, time horizon, capacity for loss and attitude to risk. Each portfolio invests in a wide range of assets and is managed to a set level of risk. Because the portfolios are risk targeted, they will always stay at the same level of risk.
Risk
Pot
enti
al r
etu
rn
IncomePortfolio
CautiousManagedPortfolio
Income& GrowthPortfolio
BalancedManagedPortfolio
AdventurousGrowthPortfolio
Cash and Fixed Interest Investment
UK Equity
Global Equity
30%
70%
55%
40%45%
15%
30%
55%
15%
45%
40%
5%
25%
30%
Risk Warning Past performance is not a guide to the future performance. The value of an investment and income are not guaranteed and can in fact fall as well as rise as a result of market fluctuations. You may not get back the original amount invested.
Investments in stocks and shares do not have the same degree of capital security which is afforded with a deposit account. The levels and basis of taxation are subject to change and their value depends on the individual circumstances of the investor. Copies of the Prospectus and Key Investor Information Documents are available from www.ifslfunds.com or can be requested as a paper copy by calling 0808 178 9322 or by writing to IFSL, Marlborough House, 59 Chorley New Road, Bolton, BL1 4QP.
This document has been approved by Investment Fund Services Limited who are authorised and regulated by the FCA. Sinfonia Asset Management Ltd. is not authorised or regulated by the Financial Conduct Authority.
Disclaimer This document and the information it contains may be privileged and/or confidential. It is for the intended addressee(s) only. The unauthorised use, disclosure or copying of this document, or any information it contains, is prohibited and could, in certain circumstances, be a criminal offence.
Sinfonia Asset Management Ltd is a private limited company registered in England with company number 06309491 whose registered office is at 5 Lister Hill, Horsforth, Leeds, LS18 5AZ. The VAT registration number of Sinfonia Asset Management is 712054479. Sinfonia Asset Management Ltd is not regulated or authorised by the Financial Conduct Authority or the Prudential Regulation Authority. Investment Funds Services Limited (IFSL) is the Authorised Corporate Director for the IFSL Sinfonia OEIC. IFSL is regulated and authorised by the Financial Conduct Authority. All our literature including KIIDS, SID and Prospectus are available at www.ifslfunds.com

To contact SinfoniaFor more information visit our website at www.ifslfunds.com
To invest in IFSL Sinfonia OEIC Portfolios please contact your financial adviser.
For adviser use onlyAdviser Service Line: 0808 178 9322
Leeds Head Office: 0113 239 0025
Email: [email protected]
Website: www.sinfonia.com