Embed Size (px)
Citation preview
April 2017
2
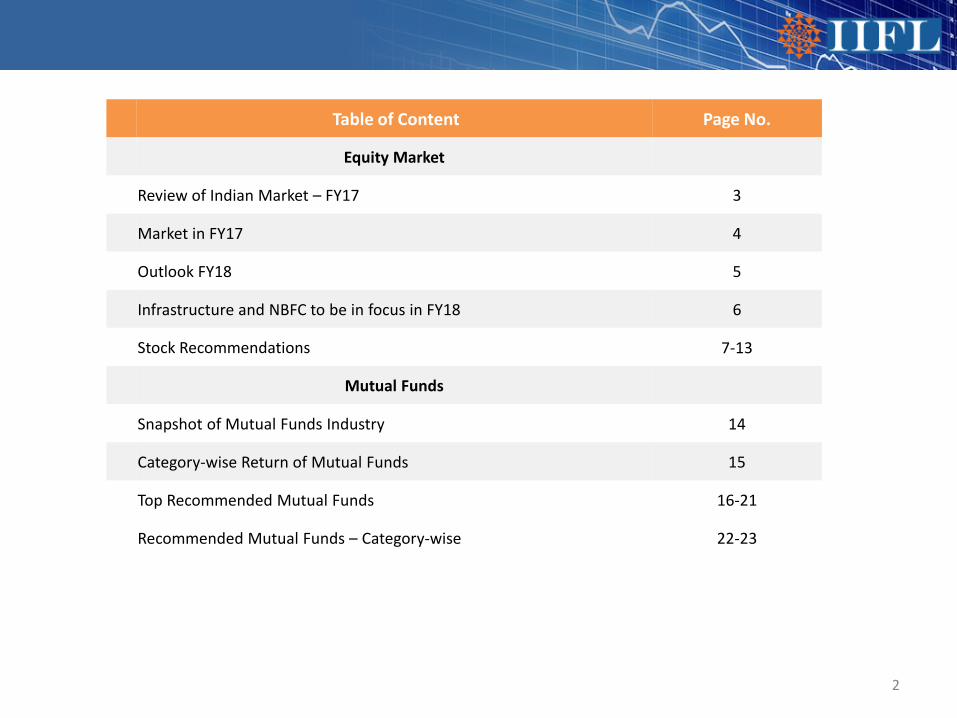
Table of Content Page No.
Equity Market
Review of Indian Market – FY17 3
Market in FY17 4
Outlook FY18 5
Infrastructure and NBFC to be in focus in FY18 6
Stock Recommendations 7-13
Mutual Funds
Snapshot of Mutual Funds Industry 14
Category-wise Return of Mutual Funds 15
Top Recommended Mutual Funds 16-21
Recommended Mutual Funds – Category-wise 22-23
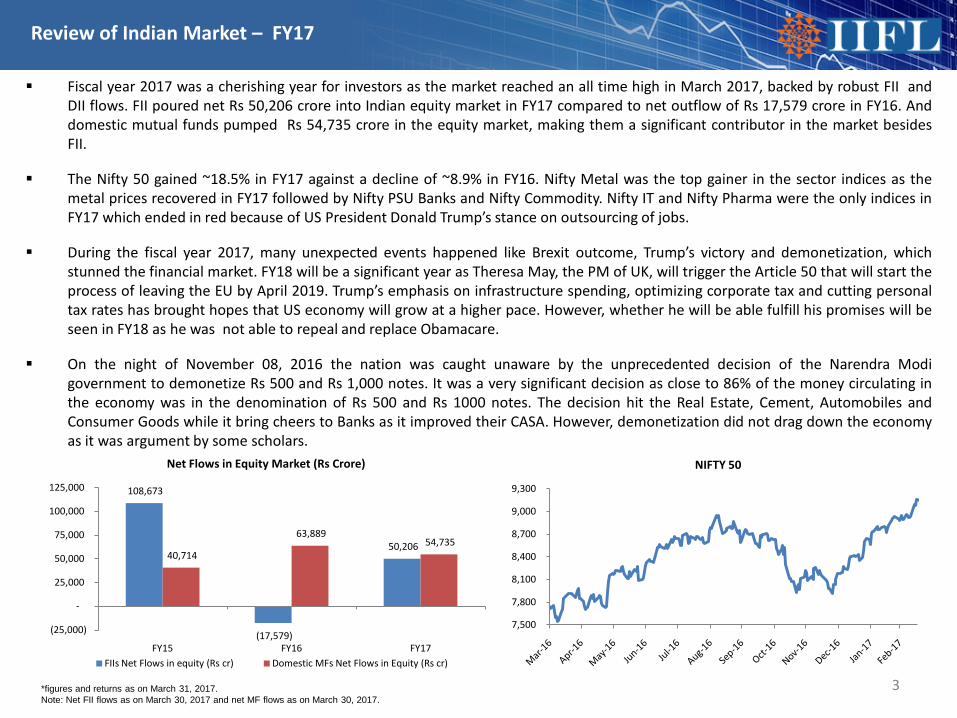
Fiscal year 2017 was a cherishing year for investors as the market reached an all time high in March 2017, backed by robust FII andDII flows. FII poured net Rs 50,206 crore into Indian equity market in FY17 compared to net outflow of Rs 17,579 crore in FY16. Anddomestic mutual funds pumped Rs 54,735 crore in the equity market, making them a significant contributor in the market besidesFII.
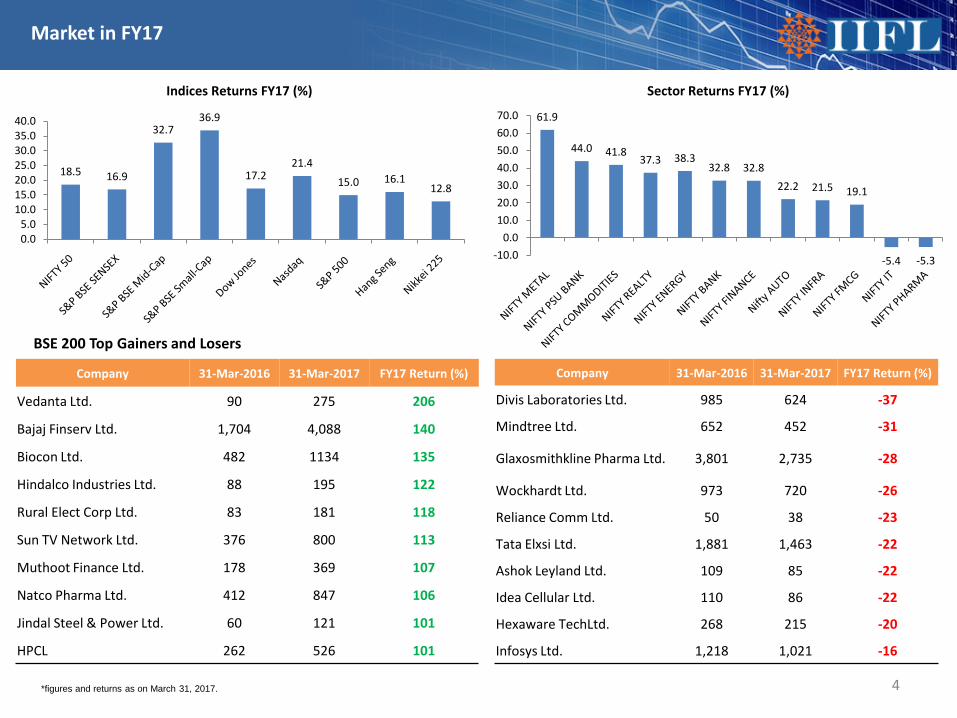
The Nifty 50 gained ~18.5% in FY17 against a decline of ~8.9% in FY16. Nifty Metal was the top gainer in the sector indices as themetal prices recovered in FY17 followed by Nifty PSU Banks and Nifty Commodity. Nifty IT and Nifty Pharma were the only indices inFY17 which ended in red because of US President Donald Trump’s stance on outsourcing of jobs.
During the fiscal year 2017, many unexpected events happened like Brexit outcome, Trump’s victory and demonetization, whichstunned the financial market. FY18 will be a significant year as Theresa May, the PM of UK, will trigger the Article 50 that will start theprocess of leaving the EU by April 2019. Trump’s emphasis on infrastructure spending, optimizing corporate tax and cutting personaltax rates has brought hopes that US economy will grow at a higher pace. However, whether he will be able fulfill his promises will beseen in FY18 as he was not able to repeal and replace Obamacare.
On the night of November 08, 2016 the nation was caught unaware by the unprecedented decision of the Narendra Modigovernment to demonetize Rs 500 and Rs 1,000 notes. It was a very significant decision as close to 86% of the money circulating inthe economy was in the denomination of Rs 500 and Rs 1000 notes. The decision hit the Real Estate, Cement, Automobiles andConsumer Goods while it bring cheers to Banks as it improved their CASA. However, demonetization did not drag down the economyas it was argument by some scholars.
3*figures and returns as on March 31, 2017. Note: Net FII flows as on March 30, 2017 and net MF flows as on March 30, 2017.
Review of Indian Market – FY17
7,500
7,800
8,100
8,400
8,700
9,000
9,300
NIFTY 50
108,673
(17,579)
50,206 40,714
63,889 54,735
(25,000)
-
25,000
50,000
75,000
100,000
125,000
FY15 FY16 FY17
Net Flows in Equity Market (Rs Crore)
FIIs Net Flows in equity (Rs cr) Domestic MFs Net Flows in Equity (Rs cr)
Market in FY17
4
18.5 16.9
32.736.9
17.221.4
15.0 16.112.8
0.05.0
10.015.020.025.030.035.040.0
Indices Returns FY17 (%)
61.9
44.0 41.837.3 38.3
32.8 32.822.2 21.5 19.1
-5.4 -5.3-10.00.0
10.020.030.040.050.060.070.0
Sector Returns FY17 (%)
Company 31-Mar-2016 31-Mar-2017 FY17 Return (%)
Vedanta Ltd. 90 275 206
Bajaj Finserv Ltd. 1,704 4,088 140
Biocon Ltd. 482 1134 135
Hindalco Industries Ltd. 88 195 122
Rural Elect Corp Ltd. 83 181 118
Sun TV Network Ltd. 376 800 113
Muthoot Finance Ltd. 178 369 107
Natco Pharma Ltd. 412 847 106
Jindal Steel & Power Ltd. 60 121 101
HPCL 262 526 101
Company 31-Mar-2016 31-Mar-2017 FY17 Return (%)
Divis Laboratories Ltd. 985 624 -37
Mindtree Ltd. 652 452 -31
Glaxosmithkline Pharma Ltd. 3,801 2,735 -28
Wockhardt Ltd. 973 720 -26
Reliance Comm Ltd. 50 38 -23
Tata Elxsi Ltd. 1,881 1,463 -22
Ashok Leyland Ltd. 109 85 -22
Idea Cellular Ltd. 110 86 -22
Hexaware TechLtd. 268 215 -20
Infosys Ltd. 1,218 1,021 -16
BSE 200 Top Gainers and Losers
*figures and returns as on March 31, 2017.
Outlook – FY18
• Implementation of GST: GST is all set to be implemented from July 1, 2017 and will replace the currentcumbersome taxation system in India. As per some estimates, the GDP will rise by 2% after the implementation ofGST. With the implementation of GST, unorganized sector will come under the tax net and will lose the benefit ofnon-tax payments. Thus, the companies in the sector with a high market share of unorganized players will gainmore market share. In addition, sectors such as pharma, FMCG, consumer durables etc., which have a long supplychain spread across multiple states, will be able to save on the transportation cost. However, with theimplementation of GST, service tax is expected to go up from 14.5% which will impact hospitality, airlines, telecomand insurance in the short-term.
• Below Normal Monsoon and fear of El Nino: According to Skymet, India is expected to receive below normalmonsoon in 2017 because of strengthening of El Nino in Pacific Ocean which has brought the fear of possibledrought. India received normal monsoon in 2016 which revived the rural economy after two consecutive droughtsin 2014 and 2015. But historic data shows that occurrence of 3 drought in 4 years and the occurrence of El Ninowithin 2 years after a strong La Nina is very unlikely. In addition, monsoon in India also depends upon IndianOcean Dipole(IOD) which is positive and is expected to neutralize the impact of El Nino in India.
• Modi to speedup the reforms: The Modi government will increase the pace of reforms after BJP’s spectacularperformance in the latest five state elections with a behemoth victory in UP has boosting its confidence. Thepresence of BJP will rise in the Upper House which will support the government in passing bills. With the UPvictory, PM Narendra Modi has also strengthen his chance to win the 2019 election.
5
The outlook for FY18 is positive considering strong macroeconomic indicators and the implementation of GST.However, there are some reports that India may receive below normal monsoon in 2017.
Infrastructure and NBFC to be in focus in FY18
NBFC• NBFCs will continue to be in focus as the demonetization impact fades away and the companies gain ground as
demand revives on the back of increase in rural consumption and personal business financing activities.
• The government’s thrust on affordable housing (39% higher budgetary allocation) and an extension of the creditlinked subsidy scheme to loans of up to Rs. 12 lakh bodes well for housing finance companies.
• NBFCs might be a preferred bet over mid-sized public sector banks on account of better operating efficiency fromincreasing economies of scale and strengthening funding profile.
Infrastructure Sector• Infrastructure will be another sector to look out for as the government speeds up investment in roads, bridges,
highways, airports, waterways etc. Approximately Rs. 64,000 cr and Rs 1.3 lakh cr investment is lined up forhighways and Railways respectively.
• We expect any further rate cut will create a favorable demand environment if the banks pass on the rate cut toborrowers. This will lead to deleveraging of the infrastructure companies, thereby strengthening their balancesheets.
6
Stock Recommendations
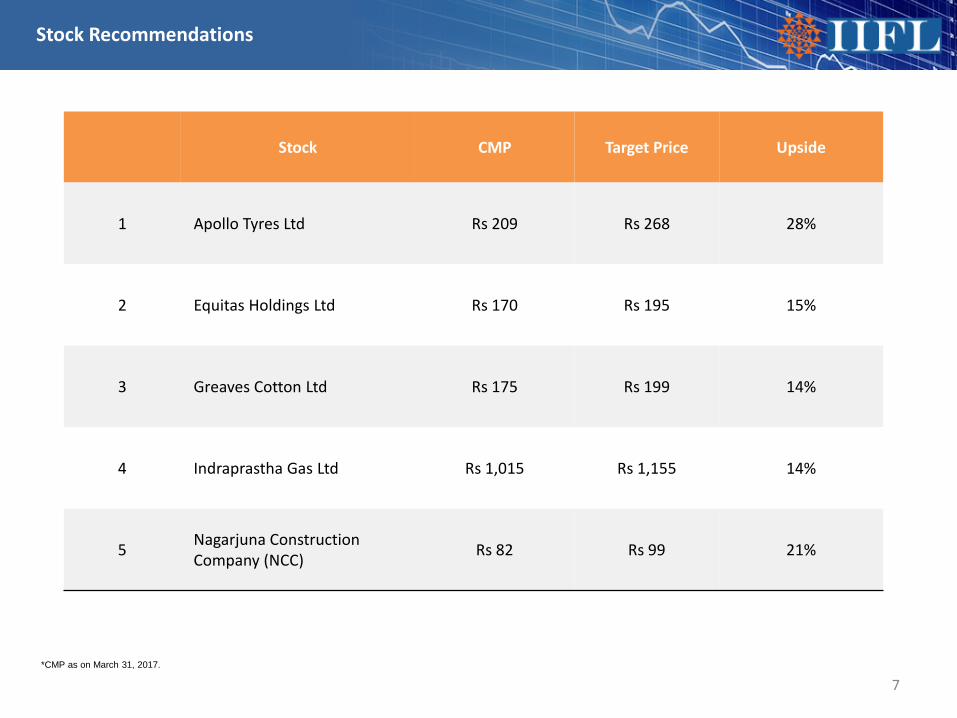
Stock CMP Target Price Upside
1 Apollo Tyres Ltd Rs 209 Rs 268 28%
2 Equitas Holdings Ltd Rs 170 Rs 195 15%
3 Greaves Cotton Ltd Rs 175 Rs 199 14%
4 Indraprastha Gas Ltd Rs 1,015 Rs 1,155 14%
5 Nagarjuna Construction Company (NCC) Rs 82 Rs 99 21%
7*CMP as on March 31, 2017.
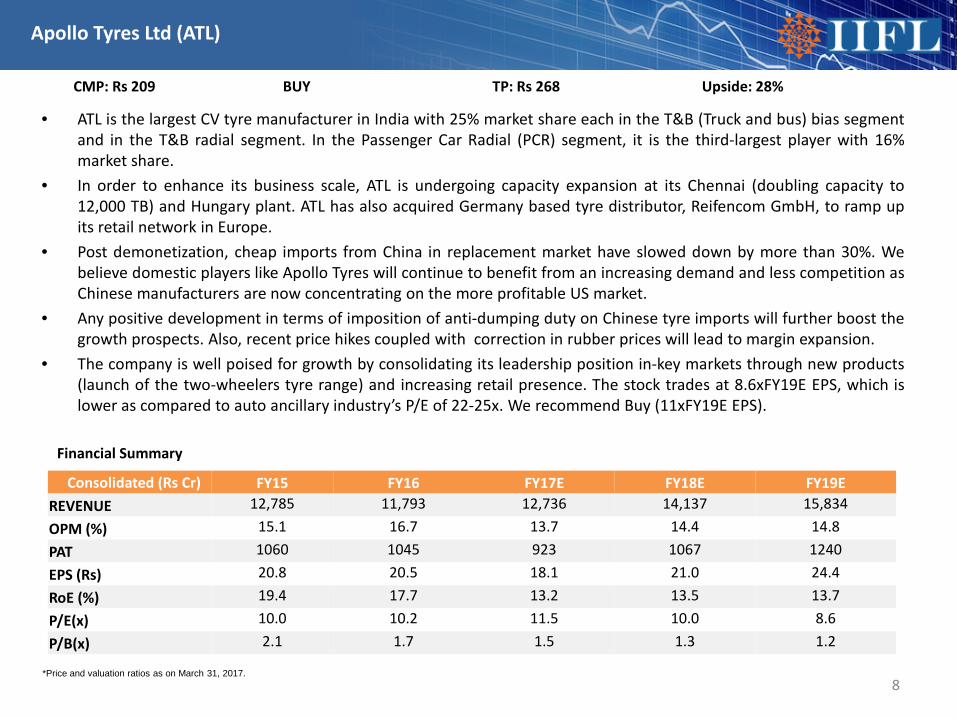
• ATL is the largest CV tyre manufacturer in India with 25% market share each in the T&B (Truck and bus) bias segmentand in the T&B radial segment. In the Passenger Car Radial (PCR) segment, it is the third-largest player with 16%market share.
• In order to enhance its business scale, ATL is undergoing capacity expansion at its Chennai (doubling capacity to12,000 TB) and Hungary plant. ATL has also acquired Germany based tyre distributor, Reifencom GmbH, to ramp upits retail network in Europe.
• Post demonetization, cheap imports from China in replacement market have slowed down by more than 30%. Webelieve domestic players like Apollo Tyres will continue to benefit from an increasing demand and less competition asChinese manufacturers are now concentrating on the more profitable US market.
• Any positive development in terms of imposition of anti-dumping duty on Chinese tyre imports will further boost thegrowth prospects. Also, recent price hikes coupled with correction in rubber prices will lead to margin expansion.
• The company is well poised for growth by consolidating its leadership position in-key markets through new products(launch of the two-wheelers tyre range) and increasing retail presence. The stock trades at 8.6xFY19E EPS, which islower as compared to auto ancillary industry’s P/E of 22-25x. We recommend Buy (11xFY19E EPS).
8
Consolidated (Rs Cr) FY15 FY16 FY17E FY18E FY19E REVENUE 12,785 11,793 12,736 14,137 15,834
OPM (%) 15.1 16.7 13.7 14.4 14.8
PAT 1060 1045 923 1067 1240
EPS (Rs) 20.8 20.5 18.1 21.0 24.4
RoE (%) 19.4 17.7 13.2 13.5 13.7
P/E(x) 10.0 10.2 11.5 10.0 8.6
P/B(x) 2.1 1.7 1.5 1.3 1.2
Financial Summary
Apollo Tyres Ltd (ATL)
*Price and valuation ratios as on March 31, 2017.
CMP: Rs 209 BUY TP: Rs 268 Upside: 28%
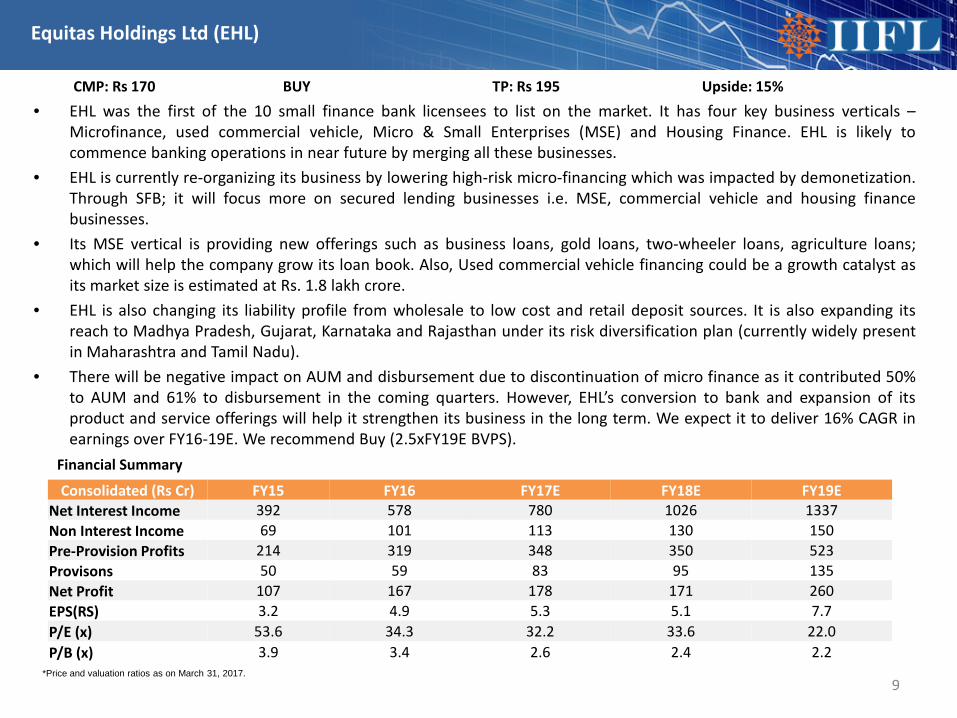
• EHL was the first of the 10 small finance bank licensees to list on the market. It has four key business verticals –Microfinance, used commercial vehicle, Micro & Small Enterprises (MSE) and Housing Finance. EHL is likely tocommence banking operations in near future by merging all these businesses.
• EHL is currently re-organizing its business by lowering high-risk micro-financing which was impacted by demonetization.Through SFB; it will focus more on secured lending businesses i.e. MSE, commercial vehicle and housing financebusinesses.
• Its MSE vertical is providing new offerings such as business loans, gold loans, two-wheeler loans, agriculture loans;which will help the company grow its loan book. Also, Used commercial vehicle financing could be a growth catalyst asits market size is estimated at Rs. 1.8 lakh crore.
• EHL is also changing its liability profile from wholesale to low cost and retail deposit sources. It is also expanding itsreach to Madhya Pradesh, Gujarat, Karnataka and Rajasthan under its risk diversification plan (currently widely presentin Maharashtra and Tamil Nadu).
• There will be negative impact on AUM and disbursement due to discontinuation of micro finance as it contributed 50%to AUM and 61% to disbursement in the coming quarters. However, EHL’s conversion to bank and expansion of itsproduct and service offerings will help it strengthen its business in the long term. We expect it to deliver 16% CAGR inearnings over FY16-19E. We recommend Buy (2.5xFY19E BVPS).
9
Consolidated (Rs Cr) FY15 FY16 FY17E FY18E FY19E Net Interest Income 392 578 780 1026 1337Non Interest Income 69 101 113 130 150Pre-Provision Profits 214 319 348 350 523Provisons 50 59 83 95 135Net Profit 107 167 178 171 260EPS(RS) 3.2 4.9 5.3 5.1 7.7P/E (x) 53.6 34.3 32.2 33.6 22.0P/B (x) 3.9 3.4 2.6 2.4 2.2
Financial Summary
Equitas Holdings Ltd (EHL)
CMP: Rs 170 BUY TP: Rs 195 Upside: 15%
*Price and valuation ratios as on March 31, 2017.
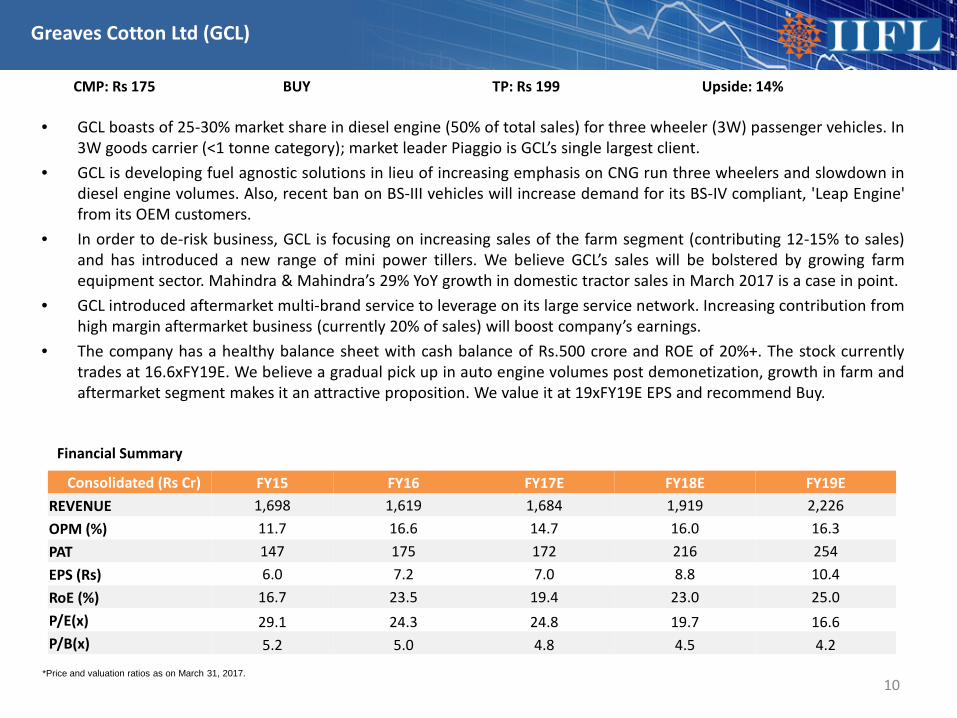
• GCL boasts of 25-30% market share in diesel engine (50% of total sales) for three wheeler (3W) passenger vehicles. In3W goods carrier (<1 tonne category); market leader Piaggio is GCL’s single largest client.
• GCL is developing fuel agnostic solutions in lieu of increasing emphasis on CNG run three wheelers and slowdown indiesel engine volumes. Also, recent ban on BS-III vehicles will increase demand for its BS-IV compliant, 'Leap Engine'from its OEM customers.
• In order to de-risk business, GCL is focusing on increasing sales of the farm segment (contributing 12-15% to sales)and has introduced a new range of mini power tillers. We believe GCL’s sales will be bolstered by growing farmequipment sector. Mahindra & Mahindra’s 29% YoY growth in domestic tractor sales in March 2017 is a case in point.
• GCL introduced aftermarket multi-brand service to leverage on its large service network. Increasing contribution fromhigh margin aftermarket business (currently 20% of sales) will boost company’s earnings.
• The company has a healthy balance sheet with cash balance of Rs.500 crore and ROE of 20%+. The stock currentlytrades at 16.6xFY19E. We believe a gradual pick up in auto engine volumes post demonetization, growth in farm andaftermarket segment makes it an attractive proposition. We value it at 19xFY19E EPS and recommend Buy.
10
Consolidated (Rs Cr) FY15 FY16 FY17E FY18E FY19E REVENUE 1,698 1,619 1,684 1,919 2,226OPM (%) 11.7 16.6 14.7 16.0 16.3PAT 147 175 172 216 254EPS (Rs) 6.0 7.2 7.0 8.8 10.4RoE (%) 16.7 23.5 19.4 23.0 25.0P/E(x) 29.1 24.3 24.8 19.7 16.6P/B(x) 5.2 5.0 4.8 4.5 4.2
Financial Summary
Greaves Cotton Ltd (GCL)
CMP: Rs 175 BUY TP: Rs 199 Upside: 14%
*Price and valuation ratios as on March 31, 2017.
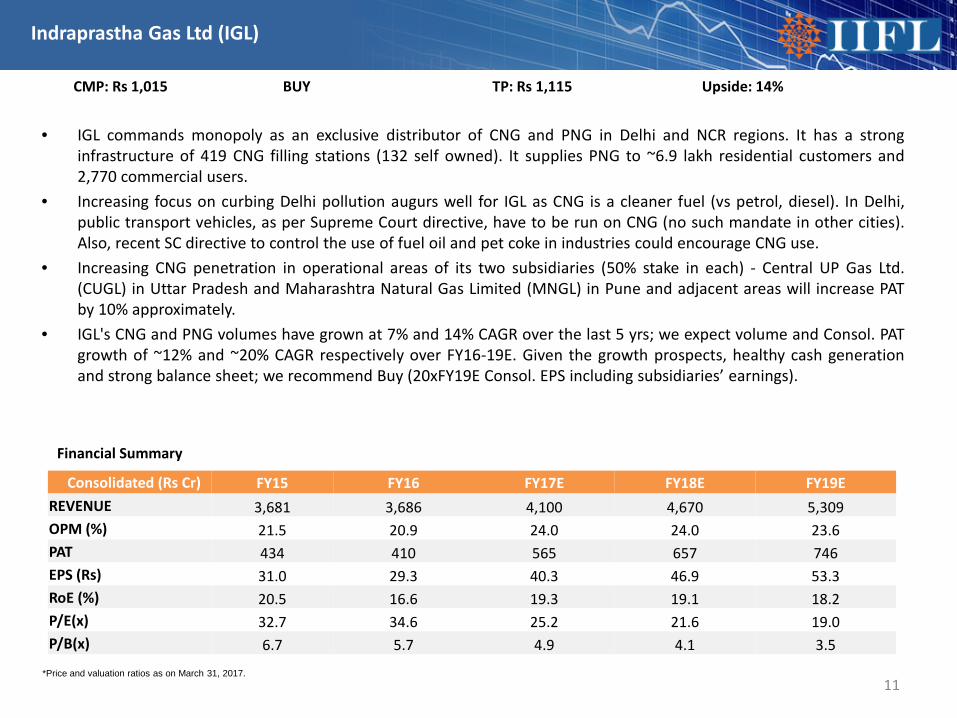
• IGL commands monopoly as an exclusive distributor of CNG and PNG in Delhi and NCR regions. It has a stronginfrastructure of 419 CNG filling stations (132 self owned). It supplies PNG to ~6.9 lakh residential customers and2,770 commercial users.
• Increasing focus on curbing Delhi pollution augurs well for IGL as CNG is a cleaner fuel (vs petrol, diesel). In Delhi,public transport vehicles, as per Supreme Court directive, have to be run on CNG (no such mandate in other cities).Also, recent SC directive to control the use of fuel oil and pet coke in industries could encourage CNG use.
• Increasing CNG penetration in operational areas of its two subsidiaries (50% stake in each) - Central UP Gas Ltd.(CUGL) in Uttar Pradesh and Maharashtra Natural Gas Limited (MNGL) in Pune and adjacent areas will increase PATby 10% approximately.
• IGL's CNG and PNG volumes have grown at 7% and 14% CAGR over the last 5 yrs; we expect volume and Consol. PATgrowth of ~12% and ~20% CAGR respectively over FY16-19E. Given the growth prospects, healthy cash generationand strong balance sheet; we recommend Buy (20xFY19E Consol. EPS including subsidiaries’ earnings).
11
Consolidated (Rs Cr) FY15 FY16 FY17E FY18E FY19E REVENUE 3,681 3,686 4,100 4,670 5,309OPM (%) 21.5 20.9 24.0 24.0 23.6PAT 434 410 565 657 746EPS (Rs) 31.0 29.3 40.3 46.9 53.3RoE (%) 20.5 16.6 19.3 19.1 18.2P/E(x) 32.7 34.6 25.2 21.6 19.0P/B(x) 6.7 5.7 4.9 4.1 3.5
Financial Summary
Indraprastha Gas Ltd (IGL)
CMP: Rs 1,015 BUY TP: Rs 1,115 Upside: 14%
*Price and valuation ratios as on March 31, 2017.
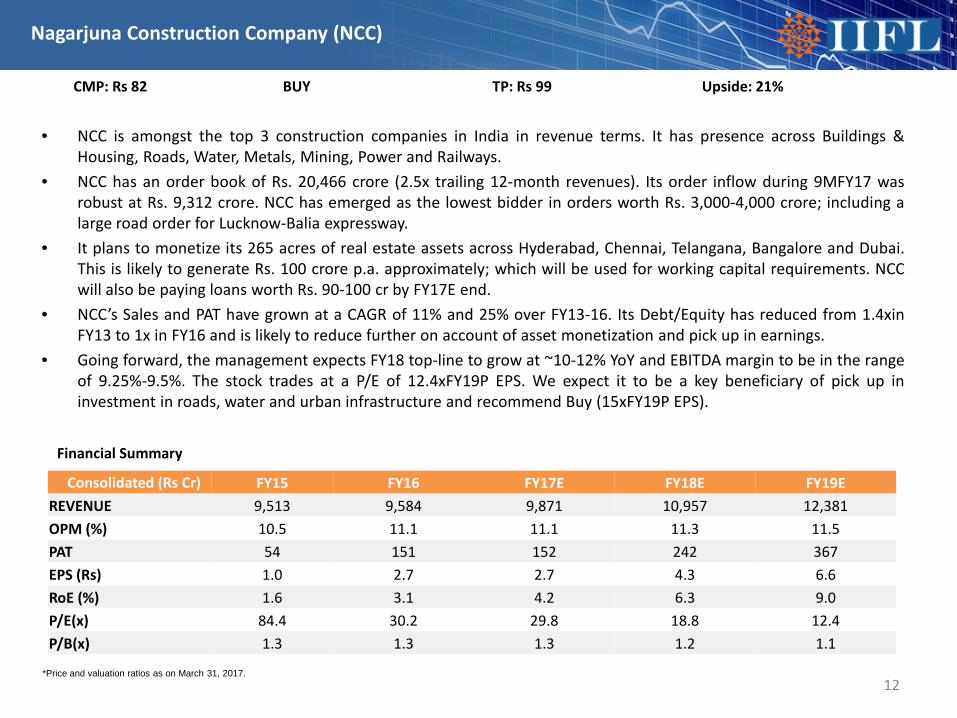
• NCC is amongst the top 3 construction companies in India in revenue terms. It has presence across Buildings &Housing, Roads, Water, Metals, Mining, Power and Railways.
• NCC has an order book of Rs. 20,466 crore (2.5x trailing 12-month revenues). Its order inflow during 9MFY17 wasrobust at Rs. 9,312 crore. NCC has emerged as the lowest bidder in orders worth Rs. 3,000-4,000 crore; including alarge road order for Lucknow-Balia expressway.
• It plans to monetize its 265 acres of real estate assets across Hyderabad, Chennai, Telangana, Bangalore and Dubai.This is likely to generate Rs. 100 crore p.a. approximately; which will be used for working capital requirements. NCCwill also be paying loans worth Rs. 90-100 cr by FY17E end.
• NCC’s Sales and PAT have grown at a CAGR of 11% and 25% over FY13-16. Its Debt/Equity has reduced from 1.4xinFY13 to 1x in FY16 and is likely to reduce further on account of asset monetization and pick up in earnings.
• Going forward, the management expects FY18 top-line to grow at ~10-12% YoY and EBITDA margin to be in the rangeof 9.25%-9.5%. The stock trades at a P/E of 12.4xFY19P EPS. We expect it to be a key beneficiary of pick up ininvestment in roads, water and urban infrastructure and recommend Buy (15xFY19P EPS).
12
Consolidated (Rs Cr) FY15 FY16 FY17E FY18E FY19E REVENUE 9,513 9,584 9,871 10,957 12,381OPM (%) 10.5 11.1 11.1 11.3 11.5PAT 54 151 152 242 367EPS (Rs) 1.0 2.7 2.7 4.3 6.6RoE (%) 1.6 3.1 4.2 6.3 9.0P/E(x) 84.4 30.2 29.8 18.8 12.4P/B(x) 1.3 1.3 1.3 1.2 1.1
Financial Summary
Nagarjuna Construction Company (NCC)
CMP: Rs 82 BUY TP: Rs 99 Upside: 21%
*Price and valuation ratios as on March 31, 2017.
Mutual Funds
13
Type (Rs thousand cr) Feb-17 Feb-16
Change (yoy)
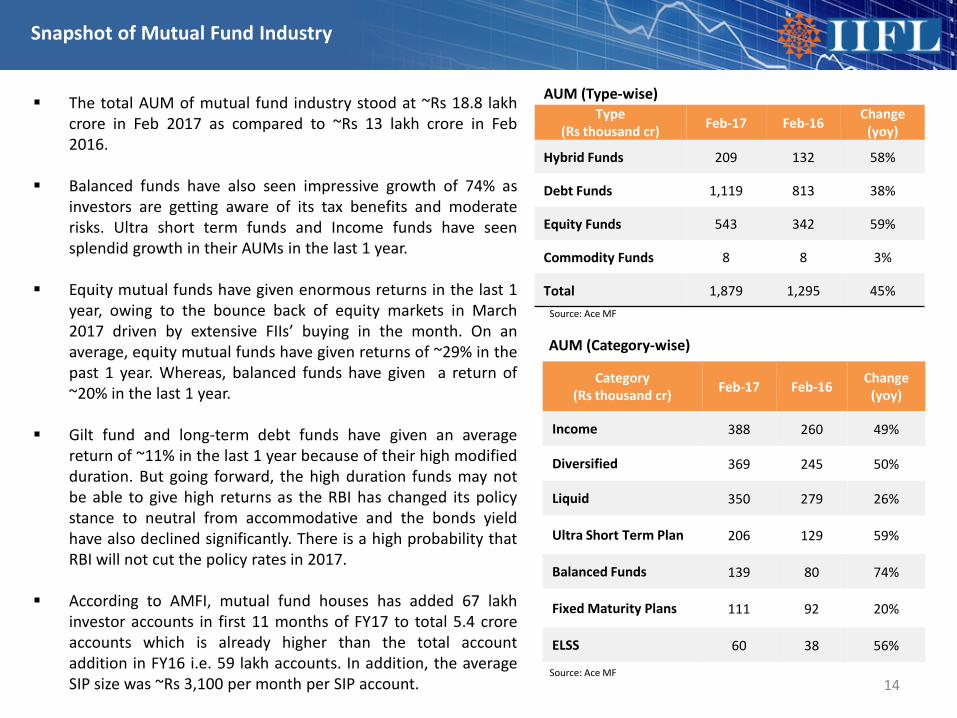
Hybrid Funds 209 132 58%
Debt Funds 1,119 813 38%
Equity Funds 543 342 59%
Commodity Funds 8 8 3%
Total 1,879 1,295 45%
14
Category (Rs thousand cr) Feb-17 Feb-16 Change
(yoy)
Income 388 260 49%
Diversified 369 245 50%
Liquid 350 279 26%
Ultra Short Term Plan 206 129 59%
Balanced Funds 139 80 74%
Fixed Maturity Plans 111 92 20%
ELSS 60 38 56%
The total AUM of mutual fund industry stood at ~Rs 18.8 lakhcrore in Feb 2017 as compared to ~Rs 13 lakh crore in Feb2016.
Balanced funds have also seen impressive growth of 74% asinvestors are getting aware of its tax benefits and moderaterisks. Ultra short term funds and Income funds have seensplendid growth in their AUMs in the last 1 year.
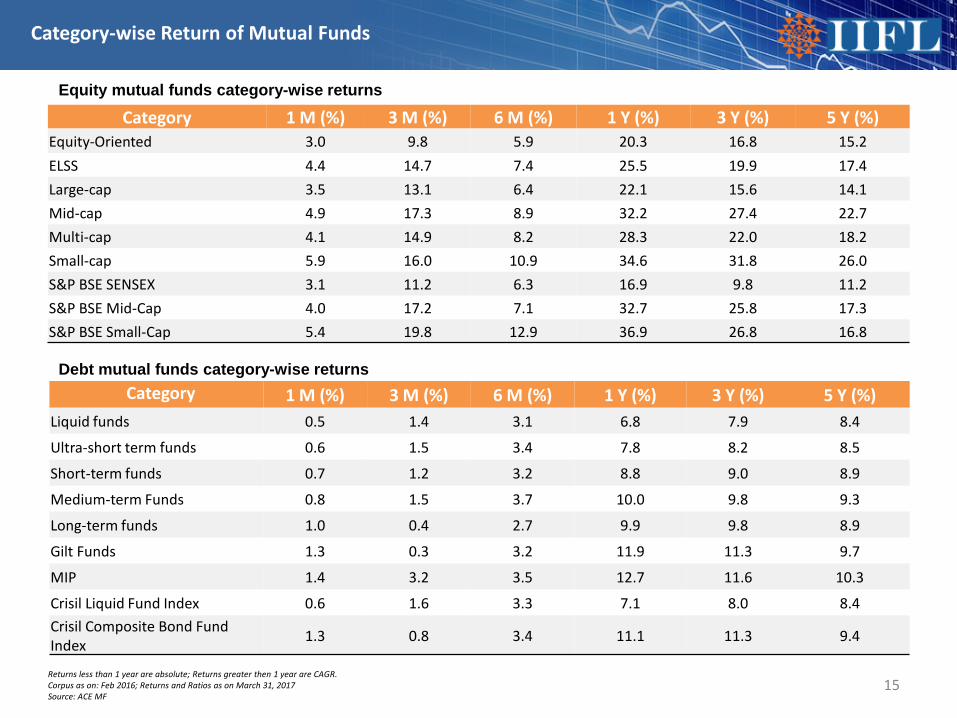
Equity mutual funds have given enormous returns in the last 1year, owing to the bounce back of equity markets in March2017 driven by extensive FIIs’ buying in the month. On anaverage, equity mutual funds have given returns of ~29% in thepast 1 year. Whereas, balanced funds have given a return of~20% in the last 1 year.
Gilt fund and long-term debt funds have given an averagereturn of ~11% in the last 1 year because of their high modifiedduration. But going forward, the high duration funds may notbe able to give high returns as the RBI has changed its policystance to neutral from accommodative and the bonds yieldhave also declined significantly. There is a high probability thatRBI will not cut the policy rates in 2017.
According to AMFI, mutual fund houses has added 67 lakhinvestor accounts in first 11 months of FY17 to total 5.4 croreaccounts which is already higher than the total accountaddition in FY16 i.e. 59 lakh accounts. In addition, the averageSIP size was ~Rs 3,100 per month per SIP account.
AUM (Type-wise)
AUM (Category-wise)
Snapshot of Mutual Fund Industry
Source: Ace MF
Source: Ace MF
15
Equity mutual funds category-wise returns
Category 1 M (%) 3 M (%) 6 M (%) 1 Y (%) 3 Y (%) 5 Y (%)Liquid funds 0.5 1.4 3.1 6.8 7.9 8.4
Ultra-short term funds 0.6 1.5 3.4 7.8 8.2 8.5
Short-term funds 0.7 1.2 3.2 8.8 9.0 8.9
Medium-term Funds 0.8 1.5 3.7 10.0 9.8 9.3
Long-term funds 1.0 0.4 2.7 9.9 9.8 8.9
Gilt Funds 1.3 0.3 3.2 11.9 11.3 9.7
MIP 1.4 3.2 3.5 12.7 11.6 10.3
Crisil Liquid Fund Index 0.6 1.6 3.3 7.1 8.0 8.4Crisil Composite Bond Fund Index 1.3 0.8 3.4 11.1 11.3 9.4
Debt mutual funds category-wise returns
Category-wise Return of Mutual Funds
Category 1 M (%) 3 M (%) 6 M (%) 1 Y (%) 3 Y (%) 5 Y (%)Equity-Oriented 3.0 9.8 5.9 20.3 16.8 15.2ELSS 4.4 14.7 7.4 25.5 19.9 17.4Large-cap 3.5 13.1 6.4 22.1 15.6 14.1Mid-cap 4.9 17.3 8.9 32.2 27.4 22.7Multi-cap 4.1 14.9 8.2 28.3 22.0 18.2Small-cap 5.9 16.0 10.9 34.6 31.8 26.0S&P BSE SENSEX 3.1 11.2 6.3 16.9 9.8 11.2S&P BSE Mid-Cap 4.0 17.2 7.1 32.7 25.8 17.3S&P BSE Small-Cap 5.4 19.8 12.9 36.9 26.8 16.8
Returns less than 1 year are absolute; Returns greater then 1 year are CAGR. Corpus as on: Feb 2016; Returns and Ratios as on March 31, 2017Source: ACE MF
Top Recommended Mutual Funds
16
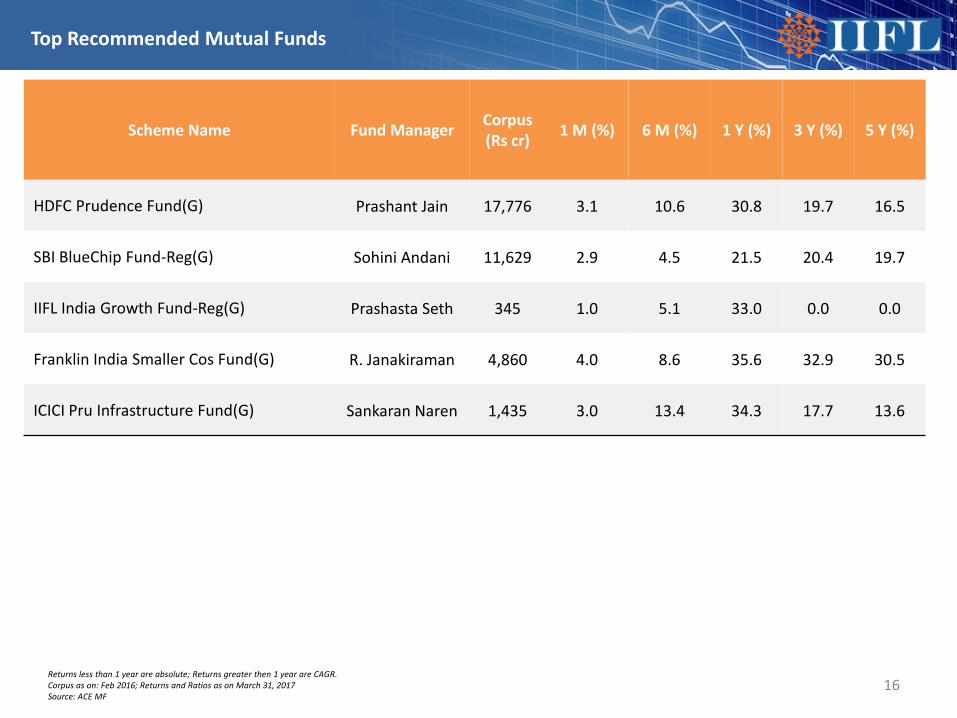
Scheme Name Fund Manager Corpus (Rs cr) 1 M (%) 6 M (%) 1 Y (%) 3 Y (%) 5 Y (%)
HDFC Prudence Fund(G) Prashant Jain 17,776 3.1 10.6 30.8 19.7 16.5
SBI BlueChip Fund-Reg(G) Sohini Andani 11,629 2.9 4.5 21.5 20.4 19.7
IIFL India Growth Fund-Reg(G) Prashasta Seth 345 1.0 5.1 33.0 0.0 0.0
Franklin India Smaller Cos Fund(G) R. Janakiraman 4,860 4.0 8.6 35.6 32.9 30.5
ICICI Pru Infrastructure Fund(G) Sankaran Naren 1,435 3.0 13.4 34.3 17.7 13.6
Returns less than 1 year are absolute; Returns greater then 1 year are CAGR. Corpus as on: Feb 2016; Returns and Ratios as on March 31, 2017Source: ACE MF
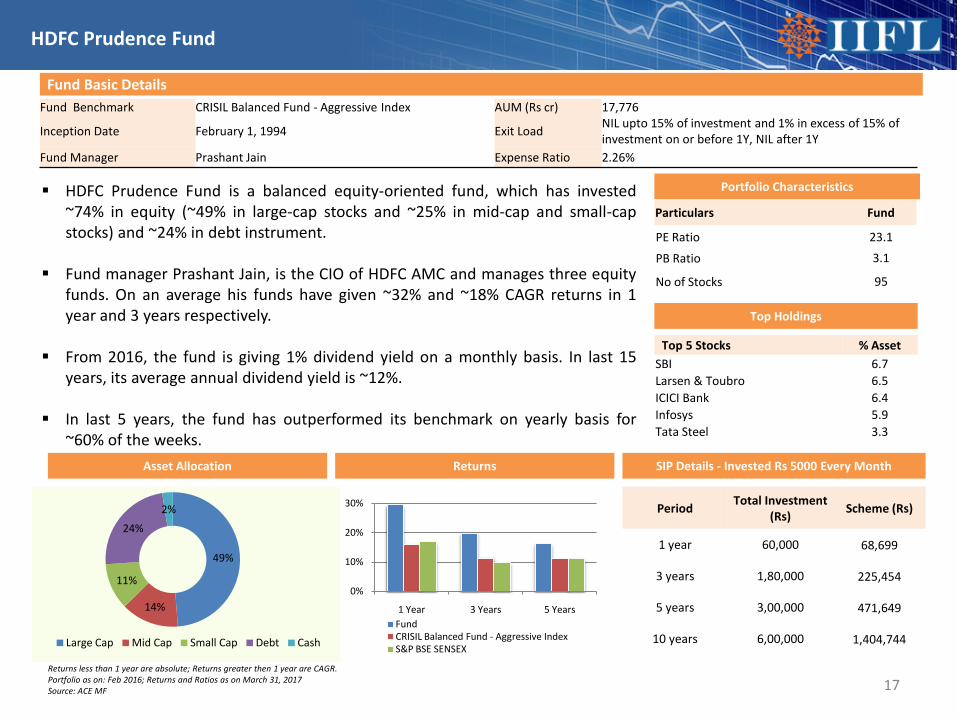
Fund Benchmark CRISIL Balanced Fund - Aggressive Index AUM (Rs cr) 17,776
Inception Date February 1, 1994 Exit Load NIL upto 15% of investment and 1% in excess of 15% of investment on or before 1Y, NIL after 1Y
Fund Manager Prashant Jain Expense Ratio 2.26%
Fund Basic Details
Top 5 Stocks % Asset SBI 6.7Larsen & Toubro 6.5ICICI Bank 6.4Infosys 5.9Tata Steel 3.3
Top Holdings
Portfolio Characteristics
Particulars Fund
PE Ratio 23.1
PB Ratio 3.1
No of Stocks 95
HDFC Prudence Fund is a balanced equity-oriented fund, which has invested~74% in equity (~49% in large-cap stocks and ~25% in mid-cap and small-capstocks) and ~24% in debt instrument.
Fund manager Prashant Jain, is the CIO of HDFC AMC and manages three equityfunds. On an average his funds have given ~32% and ~18% CAGR returns in 1year and 3 years respectively.
From 2016, the fund is giving 1% dividend yield on a monthly basis. In last 15years, its average annual dividend yield is ~12%.
In last 5 years, the fund has outperformed its benchmark on yearly basis for~60% of the weeks.
SIP Details - Invested Rs 5000 Every MonthReturns
0%
10%
20%
30%
1 Year 3 Years 5 YearsFundCRISIL Balanced Fund - Aggressive IndexS&P BSE SENSEX
49%
14%
11%
24%
2%
Large Cap Mid Cap Small Cap Debt Cash
17
HDFC Prudence Fund
Asset Allocation
Period Total Investment (Rs) Scheme (Rs)
1 year 60,000 68,699
3 years 1,80,000 225,454
5 years 3,00,000 471,649
10 years 6,00,000 1,404,744
Returns less than 1 year are absolute; Returns greater then 1 year are CAGR.Portfolio as on: Feb 2016; Returns and Ratios as on March 31, 2017Source: ACE MF
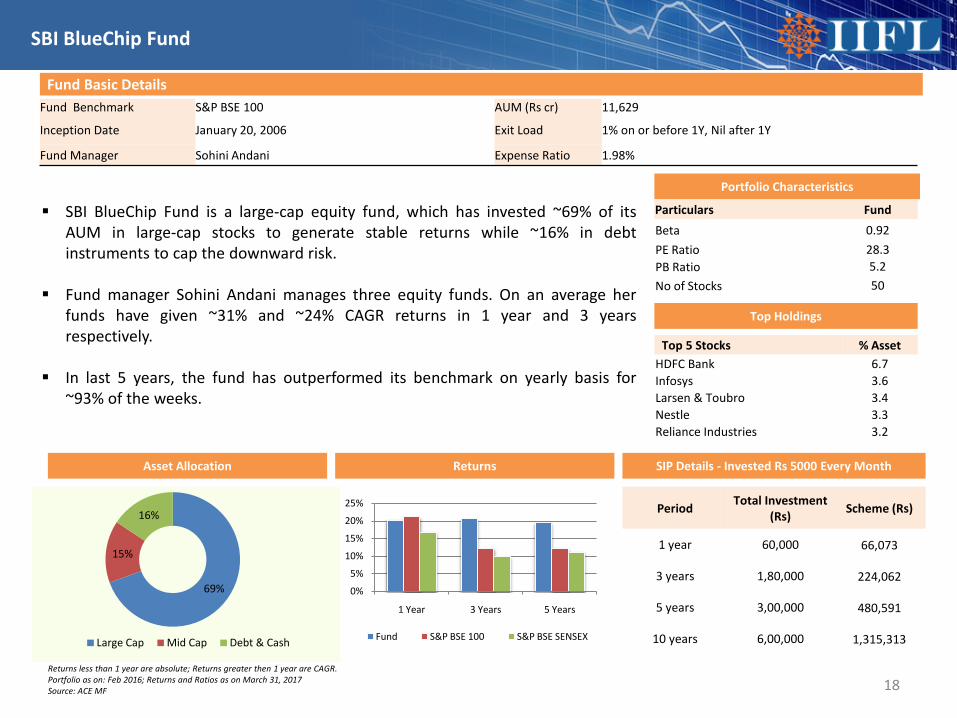
Fund Benchmark S&P BSE 100 AUM (Rs cr) 11,629
Inception Date January 20, 2006 Exit Load 1% on or before 1Y, Nil after 1Y
Fund Manager Sohini Andani Expense Ratio 1.98%
Fund Basic Details
Top 5 Stocks % Asset HDFC Bank 6.7Infosys 3.6Larsen & Toubro 3.4Nestle 3.3Reliance Industries 3.2
Top Holdings
Portfolio Characteristics
SBI BlueChip Fund is a large-cap equity fund, which has invested ~69% of itsAUM in large-cap stocks to generate stable returns while ~16% in debtinstruments to cap the downward risk.
Fund manager Sohini Andani manages three equity funds. On an average herfunds have given ~31% and ~24% CAGR returns in 1 year and 3 yearsrespectively.
In last 5 years, the fund has outperformed its benchmark on yearly basis for~93% of the weeks.
SIP Details - Invested Rs 5000 Every MonthReturns
0%
5%
10%
15%
20%
25%
1 Year 3 Years 5 Years
Fund S&P BSE 100 S&P BSE SENSEX
18
SBI BlueChip Fund
Asset Allocation
Period Total Investment (Rs) Scheme (Rs)
1 year 60,000 66,073
3 years 1,80,000 224,062
5 years 3,00,000 480,591
10 years 6,00,000 1,315,313
Particulars FundBeta 0.92PE Ratio 28.3PB Ratio 5.2No of Stocks 50
69%
15%
16%
Large Cap Mid Cap Debt & Cash
Returns less than 1 year are absolute; Returns greater then 1 year are CAGR.Portfolio as on: Feb 2016; Returns and Ratios as on March 31, 2017Source: ACE MF
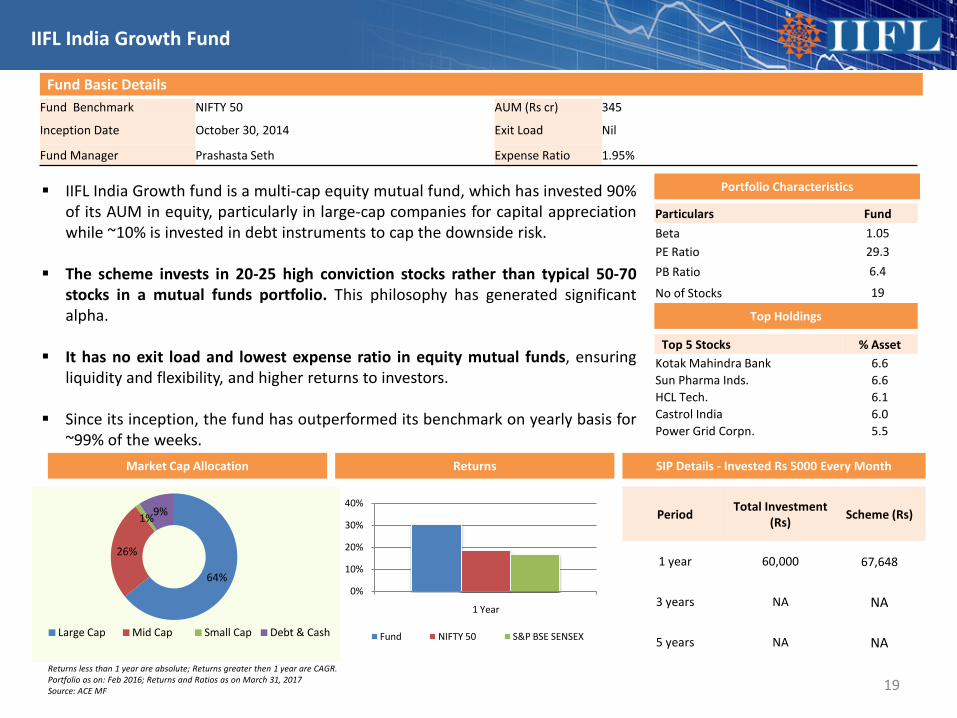
Fund Benchmark NIFTY 50 AUM (Rs cr) 345
Inception Date October 30, 2014 Exit Load Nil
Fund Manager Prashasta Seth Expense Ratio 1.95%
Fund Basic Details
Top 5 Stocks % Asset Kotak Mahindra Bank 6.6Sun Pharma Inds. 6.6HCL Tech. 6.1Castrol India 6.0Power Grid Corpn. 5.5
Top Holdings
Portfolio Characteristics
Particulars FundBeta 1.05PE Ratio 29.3PB Ratio 6.4
No of Stocks 19
IIFL India Growth fund is a multi-cap equity mutual fund, which has invested 90%of its AUM in equity, particularly in large-cap companies for capital appreciationwhile ~10% is invested in debt instruments to cap the downside risk.
The scheme invests in 20-25 high conviction stocks rather than typical 50-70stocks in a mutual funds portfolio. This philosophy has generated significantalpha.
It has no exit load and lowest expense ratio in equity mutual funds, ensuringliquidity and flexibility, and higher returns to investors.
Since its inception, the fund has outperformed its benchmark on yearly basis for~99% of the weeks.
SIP Details - Invested Rs 5000 Every MonthReturns
0%
10%
20%
30%
40%
1 Year
Fund NIFTY 50 S&P BSE SENSEX
19
IIFL India Growth Fund
Market Cap Allocation
Period Total Investment (Rs) Scheme (Rs)
1 year 60,000 67,648
3 years NA NA
5 years NA NA
64%
26%
1%9%
Large Cap Mid Cap Small Cap Debt & Cash
Returns less than 1 year are absolute; Returns greater then 1 year are CAGR.Portfolio as on: Feb 2016; Returns and Ratios as on March 31, 2017Source: ACE MF
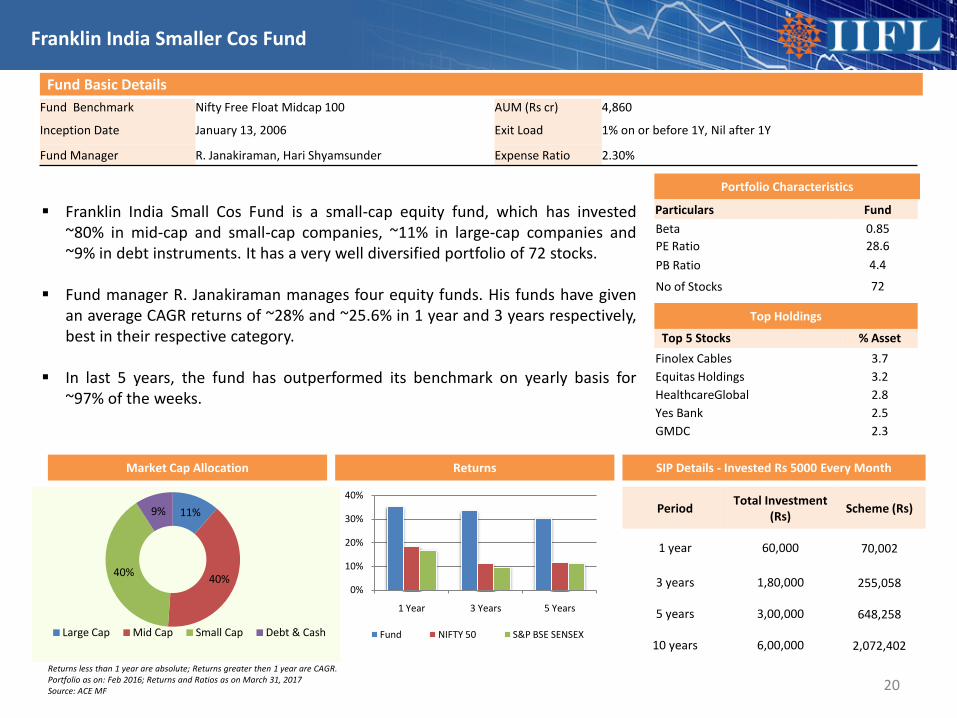
Fund Benchmark Nifty Free Float Midcap 100 AUM (Rs cr) 4,860
Inception Date January 13, 2006 Exit Load 1% on or before 1Y, Nil after 1Y
Fund Manager R. Janakiraman, Hari Shyamsunder Expense Ratio 2.30%
Fund Basic Details
Top 5 Stocks % Asset Finolex Cables 3.7Equitas Holdings 3.2HealthcareGlobal 2.8Yes Bank 2.5GMDC 2.3
Top Holdings
Portfolio Characteristics
Particulars FundBeta 0.85PE Ratio 28.6PB Ratio 4.4
No of Stocks 72
Franklin India Small Cos Fund is a small-cap equity fund, which has invested~80% in mid-cap and small-cap companies, ~11% in large-cap companies and~9% in debt instruments. It has a very well diversified portfolio of 72 stocks.
Fund manager R. Janakiraman manages four equity funds. His funds have givenan average CAGR returns of ~28% and ~25.6% in 1 year and 3 years respectively,best in their respective category.
In last 5 years, the fund has outperformed its benchmark on yearly basis for~97% of the weeks.
SIP Details - Invested Rs 5000 Every MonthReturns
0%
10%
20%
30%
40%
1 Year 3 Years 5 Years
Fund NIFTY 50 S&P BSE SENSEX
11%
40%40%
9%
Large Cap Mid Cap Small Cap Debt & Cash
20
Franklin India Smaller Cos Fund
Market Cap Allocation
Period Total Investment (Rs) Scheme (Rs)
1 year 60,000 70,002
3 years 1,80,000 255,058
5 years 3,00,000 648,258
10 years 6,00,000 2,072,402
Returns less than 1 year are absolute; Returns greater then 1 year are CAGR.Portfolio as on: Feb 2016; Returns and Ratios as on March 31, 2017Source: ACE MF
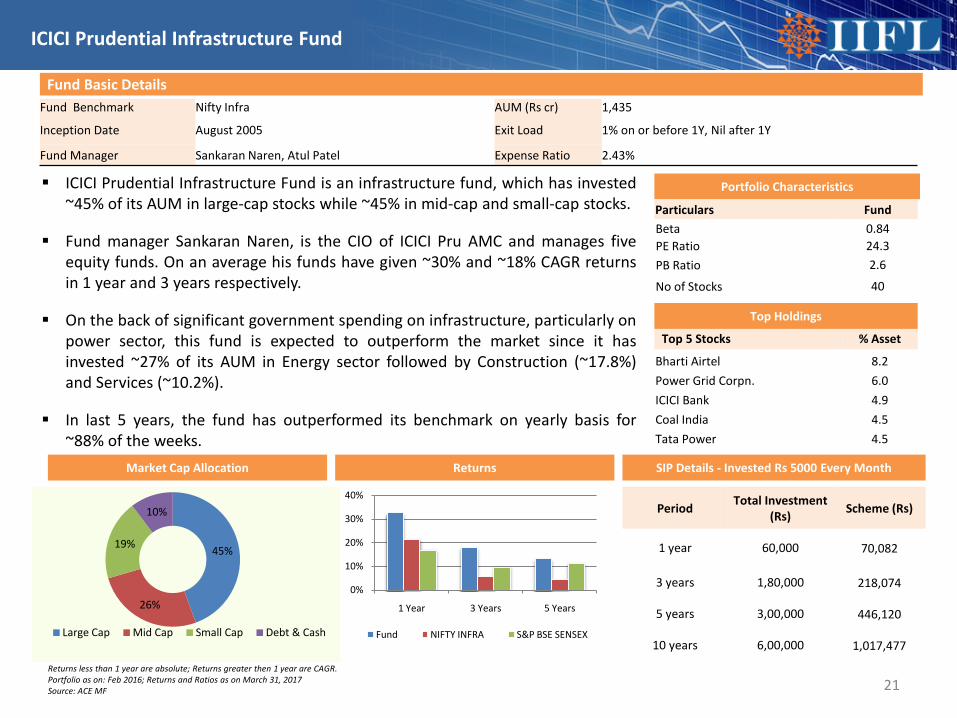
Fund Benchmark Nifty Infra AUM (Rs cr) 1,435
Inception Date August 2005 Exit Load 1% on or before 1Y, Nil after 1Y
Fund Manager Sankaran Naren, Atul Patel Expense Ratio 2.43%
Fund Basic Details
Top 5 Stocks % Asset
Bharti Airtel 8.2Power Grid Corpn. 6.0ICICI Bank 4.9Coal India 4.5Tata Power 4.5
Top Holdings
Portfolio Characteristics
Particulars FundBeta 0.84PE Ratio 24.3PB Ratio 2.6
No of Stocks 40
ICICI Prudential Infrastructure Fund is an infrastructure fund, which has invested~45% of its AUM in large-cap stocks while ~45% in mid-cap and small-cap stocks.
Fund manager Sankaran Naren, is the CIO of ICICI Pru AMC and manages fiveequity funds. On an average his funds have given ~30% and ~18% CAGR returnsin 1 year and 3 years respectively.
On the back of significant government spending on infrastructure, particularly onpower sector, this fund is expected to outperform the market since it hasinvested ~27% of its AUM in Energy sector followed by Construction (~17.8%)and Services (~10.2%).
In last 5 years, the fund has outperformed its benchmark on yearly basis for~88% of the weeks.
SIP Details - Invested Rs 5000 Every MonthReturns
0%
10%
20%
30%
40%
1 Year 3 Years 5 Years
Fund NIFTY INFRA S&P BSE SENSEX
45%
26%
19%
10%
Large Cap Mid Cap Small Cap Debt & Cash
21
ICICI Prudential Infrastructure Fund
Market Cap Allocation
Period Total Investment (Rs) Scheme (Rs)
1 year 60,000 70,082
3 years 1,80,000 218,074
5 years 3,00,000 446,120
10 years 6,00,000 1,017,477
Returns less than 1 year are absolute; Returns greater then 1 year are CAGR.Portfolio as on: Feb 2016; Returns and Ratios as on March 31, 2017Source: ACE MF
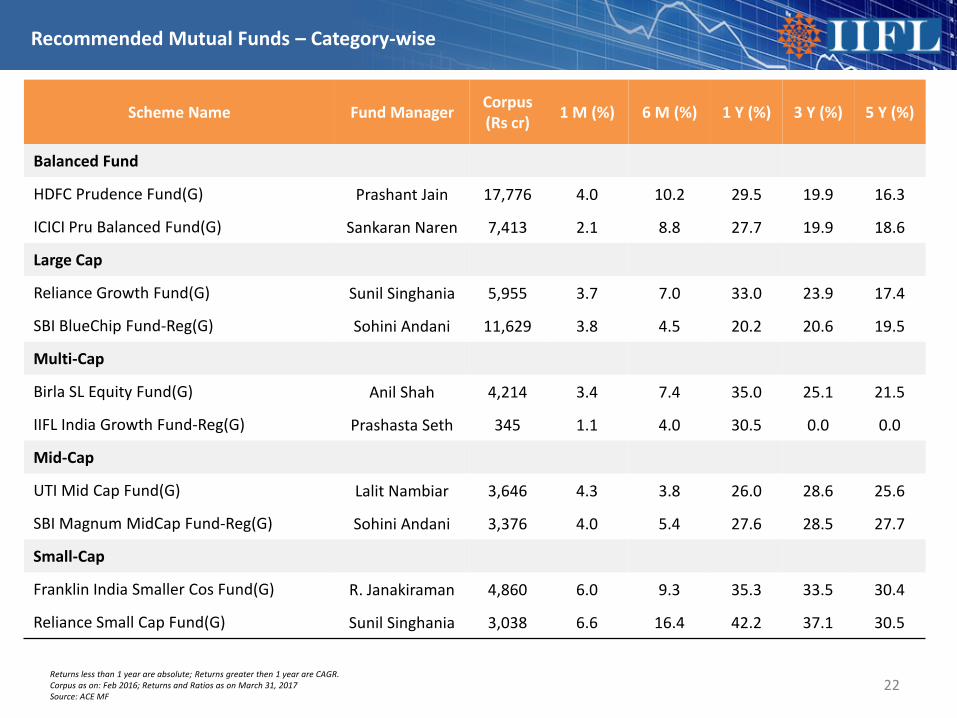
Recommended Mutual Funds – Category-wise
22
Scheme Name Fund Manager Corpus (Rs cr) 1 M (%) 6 M (%) 1 Y (%) 3 Y (%) 5 Y (%)
Balanced Fund
HDFC Prudence Fund(G) Prashant Jain 17,776 4.0 10.2 29.5 19.9 16.3
ICICI Pru Balanced Fund(G) Sankaran Naren 7,413 2.1 8.8 27.7 19.9 18.6
Large Cap
Reliance Growth Fund(G) Sunil Singhania 5,955 3.7 7.0 33.0 23.9 17.4
SBI BlueChip Fund-Reg(G) Sohini Andani 11,629 3.8 4.5 20.2 20.6 19.5
Multi-Cap
Birla SL Equity Fund(G) Anil Shah 4,214 3.4 7.4 35.0 25.1 21.5
IIFL India Growth Fund-Reg(G) Prashasta Seth 345 1.1 4.0 30.5 0.0 0.0
Mid-Cap
UTI Mid Cap Fund(G) Lalit Nambiar 3,646 4.3 3.8 26.0 28.6 25.6
SBI Magnum MidCap Fund-Reg(G) Sohini Andani 3,376 4.0 5.4 27.6 28.5 27.7
Small-Cap
Franklin India Smaller Cos Fund(G) R. Janakiraman 4,860 6.0 9.3 35.3 33.5 30.4
Reliance Small Cap Fund(G) Sunil Singhania 3,038 6.6 16.4 42.2 37.1 30.5
Returns less than 1 year are absolute; Returns greater then 1 year are CAGR. Corpus as on: Feb 2016; Returns and Ratios as on March 31, 2017Source: ACE MF
Recommended Mutual Funds – Category-wise
23
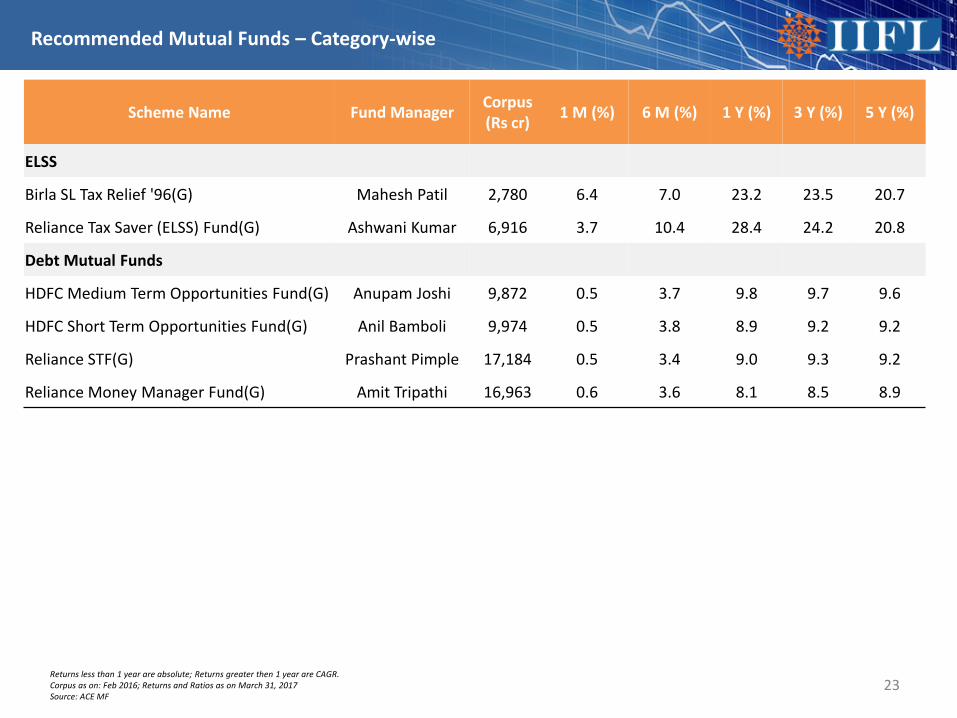
Scheme Name Fund Manager Corpus (Rs cr) 1 M (%) 6 M (%) 1 Y (%) 3 Y (%) 5 Y (%)
ELSS
Birla SL Tax Relief '96(G) Mahesh Patil 2,780 6.4 7.0 23.2 23.5 20.7
Reliance Tax Saver (ELSS) Fund(G) Ashwani Kumar 6,916 3.7 10.4 28.4 24.2 20.8
Debt Mutual Funds
HDFC Medium Term Opportunities Fund(G) Anupam Joshi 9,872 0.5 3.7 9.8 9.7 9.6
HDFC Short Term Opportunities Fund(G) Anil Bamboli 9,974 0.5 3.8 8.9 9.2 9.2
Reliance STF(G) Prashant Pimple 17,184 0.5 3.4 9.0 9.3 9.2
Reliance Money Manager Fund(G) Amit Tripathi 16,963 0.6 3.6 8.1 8.5 8.9
Returns less than 1 year are absolute; Returns greater then 1 year are CAGR. Corpus as on: Feb 2016; Returns and Ratios as on March 31, 2017Source: ACE MF
Disclosure
• Mutual Fund investments are subject to market risks, read all scheme related documents carefully.• Nothing in this document constitutes investment, legal, accounting or tax advice or a representation that any investment or strategy is suitable or appropriate to the investor's specific
circumstances. The details included are based on information obtained from public sources and sources believed to be reliable, but no independent verification has been made nor is its accuracy or completeness guaranteed.
• Investors should consult their financial advisers if in doubt about whether the product is suitable for them. The fund may or may not be suitable for all investors, who must make their own investment decisions, based on their own investment objectives, financial positions and needs. This document may not be taken in substitution for the exercise of independent judgment by any investor. The investor should independently evaluate the investment risks.
• India Infoline Ltd. or any of its director/s or principal officer/employees and associate companies (IIFL) does not assure/give guarantee for accuracy of any of the facts/interpretations in this document, and shall not be liable to any person including the beneficiary for any claim or demand for damages or otherwise in relation to this opinion or its contents.
• The aimed returns mentioned anywhere in this document are purely indicative and are not promised or guaranteed in any manner. Returns are dependent on prevalent market factors, liquidity and credit conditions. Instrument returns depicted are in the current context and may be significantly different in the future.
• The group company of India Infoline Limited, IIFL Wealth Management Limited is the Sponsor of IIFL Mutual Fund and holding company of the Investment Manager & Trustee Company of IIFL Mutual Fund.
• IIFL or its subsidiaries & affiliates may be holding all or any of the units of the scheme(s), referred in the document. The information contained herein is strictly confidential and meant solely for the selected recipient and may not be altered in any way, transmitted to, copied or distributed, in part or in whole, to any other person or to the media or reproduced in any form, without prior written consent of IIFL. While due care has been taken in preparing this document, IIFL and its affiliates accept no liabilities for any loss or damage of any kind arising out of any inaccurate, delayed or incomplete information nor for any actions taken in reliance thereon.
• This document is not directed or intended for distribution to, or use by, any person or entity who is a citizen or resident of or located in any locality, state, country or other jurisdiction, where such distribution, publication, availability or use would be contrary to law, regulation or which would subject IIFL or its affiliates to any registration or licensing requirement within such jurisdiction. IIFL and/or its associates receive compensation/ commission for distribution of Mutual Funds from various Asset Management Companies (AMCs).
• IIFL hosts the details of the commission rates earned by IIFL from Mutual Fund houses on our website https://ttweb.indiainfoline.com/trade/downloads/brokerage%20file.pdf. Hence, IIFL or its associates may have received compensation from AMCs whose funds are mentioned in the report during the period preceding twelve months from the date of this report for distribution of Mutual Funds or for providing marketing advertising support to these AMCs. IIFL group, associate and subsidiary companies are engaged in providing various financial services and for the said services (including the service for acquiring and sourcing the units of the fund) may earn fees or remuneration in form of arranger fees, referral fees, advisory fees, management fees, trustee fees, Commission, brokerage, transaction charges, underwriting charges, issue management fees and other fees.
• Please refer to http://www.indiainfoline.com/research/disclaimer for additional recommendation parameter, analyst disclaimer and other disclosures. • Published in 2017. © India Infoline Ltd 2017• India Infoline Limited (Formerly “India Infoline Distribution Company Limited”), CIN No.: U99999MH1996PLC132983, Corporate Office – IIFL Centre, Kamala City, Senapati Bapat Marg, Lower Parel,
Mumbai – 400013 Tel: (91-22) 4249 9000 Fax: (91-22) 40609049, Regd. Office – IIFL House, Sun Infotech Park, Road No. 16V, Plot No. B-23, MIDC, Thane Industrial Area, Wagle Estate, Thane –400604 Tel: (91-22) 25806650 Fax: (91-22) 25806654, E-mail: [email protected], Website: www.indiainfoline.com, refer www.indiainfoline.com for detail of Associates.
• National Stock Exchange of India Ltd. SEBI Regn. No. : INB231097537/ INF231097537/ INE231097537, BSE Ltd. SEBI Regn. No.:INB011097533/ INF011097533/ BSE-Currency, MCX Stock Exchange Ltd. SEBI Regn. No.: INB261097530/ INF261097530/ INE261097537, PMS SEBI Regn. No. INP000002213, IA SEBI Regn. No. INA000000623, SEBI RA Regn.:- INH000000248, ARN No.47791
• For Research related queries, write at [email protected] • For Sales and Account related information, write to customer care: [email protected] or call on 91-22 4007 1000
24