Embed Size (px)
Citation preview
Nuclear Engineeting and Design
Nuclear Engineering and Design 167 (1997) 357-373
IIST and LSTF counterpart test on PWR station blackout transient
Tay-Jian Liu, Chien-Hsiung Lee, Yuan-Shun Way
Institute of Nuclear Energy Research, PO Box 3-3, Lung-Tan 325, Taiwan
Received 14 November 1995
Abstract
A reduced-height, reduced-pressure (RHRP) integral system test facility at the Institute of Nuclear Energy Research (INER) has been established for simulating the thermal-hydraulics of a Westinghouse three-loop pressurized water reactor (PWR). To understand whether or not the physical phenomena observed in this RHRP integral system test facility during a station blackout (SB) transient can be reliably extrapolated to those for an actual plant, a counterpart test based on the same scenarios as those of the full-height, full-pressure (FHFP) large-scale test facility (LSTF) test was performed. To see the result of differences in the design, scaling approach and facility operational conditions in the systems, the present study examines their effects on the SB transient, particularly for the tests performed at full and reduced pressures. We also identify the occurrence of key thermal-hydraulic phenomena, as well as their possible distortions. Results of the INER integral system test (IIST) facility and LSTF tests showed the common thermal-hy- draulic phenomena, such as the secondary coolant boil-off and the subsequent primary coolant saturation, pressurization, coolant inventory depletion and redistribution, and core uncovery caused by coolant boil-off. The sequence and timing of the significant events during the SB transient studied in the RHRP IIST facility are also consistent (in most cases) with those for the SB transient studied in the FHFP LSTF. 0 1997 Elsevier Science S.A.
1. Introduction being considered by the United States Nuclear Regulatory Commission (USNRC) as a postu-
A station blackout (SB) accident refers to the occurrence of the hypothetical sequence of events that lead to the loss of all offsite and onsite alternating current (a.c.) power supplies in a nor- mal operating nuclear reactor. The consequences of this accident include the potential risk of core deformation, as well as fission-product transport to the reactor coolant system (RCS), the contain- ment and the environment (Schultz et al., 1984). As a result of its very high potential risk and tendency to dominate many risk studies, the SB
lated nuclear reactor severe accident (USNRC, 1975, 1990) has been investigated for several full- height, full-pressure (FHFP) test facilities, such as Semiscale (Chapman, 1985) and the large-scale test facility (LSTF) (Kukita et al., 1990, 1991; Anoda et al., 1992; Watanabe and Kukita, 1993), with variations in the initial conditions and sce- narios.
The thermal-hydraulic transient of a pressur- ized water reactor (PWR) during SB are charac- terized by the long-term natural circulation in the
0029-5493/97/$17.00 0 1997 Elsevier Science S.A. All rights reserved
PII SOO29-5493(96)01302-7
358 T.-J. Liu et al. 1 Nuclear Engineering and Design 167 (1997) 357-373
RCS, while the residual heat is removed by the steam generator (SG) secondary side coolant boil- off. The unavailability of the turbine-driven auxil- iary feedwater (AFW) will further degrade the residual heat removal capability of the SG, caus- ing the primary coolant heat-up and expansion to result in an increase in the primary pressure. Normally, the primary inventory will be lost through the pump seals if pump seal breaks occur. Otherwise, the primary system will stay in a high pressure condition for a period of time, by dis- charging the water through the pressurizer safety valves (PSVs). Ultimately, if the a.c. power con- tinues to be unavailable, so that all active safety systems remain inoperative, then enough water will be lost to uncover the reactor fuel and inade- quate core-cooling conditions may occur. For the above-mentioned circumstances, the core uncov- ery can be delayed but cannot be restored by an appropriate operator action, because there are no existing means to maintain the coolant inventory (Schultz et al., 1984; Kappler et al., 1985). The only way to avoid core melting is to restore the a.c. power before the occurrence of a significant core uncovery. Therefore, the emergency operat- ing procedures (EOPs) will aim at increasing the time available for such a recovery.
During the past few years, a number of small- scale multiloop integral system test facilities have been constructed to investigate the physical phe- nomena of a transient or accidents occurring in nuclear power plants. These small-scale test facili- ties can be classified into three groups: (i) FHFP facilities, such as Semiscale (Larson and Loomis, 1988), MIST (Babcock and Wilcox, 1983), LSTF (JAERI, 1985, 1989) and BETHSY (CENG, 1990); (ii) full-height, reduced-pressure (FHRP) facilities, such as PKL (Brand et al., 1988); (iii) reduced-height, reduced-pressure (RHRP) facili- ties, such as UMCP (Sallet, 1984) and the Insti- tute of Nuclear Energy Research (INER) integral system test (IIST) facility (Lee et al., 1991). Among the RHRP facilities, UMCP is designed to support the MIST program, which addresses the four-loop PWR with once-through SGs, while the IIST facility, as shown in Fig. 1, is designed to support the Maanshan nuclear power plant pro- gram, which addresses the three-loop PWR with
U-tube SGs. The major advantages of the RHRP IIST facility are its lower costs for construction, as well as for operation, and the direct visualiza- tion of the two-phase phenomena from the view ports installed in the facility. The primary objec- tives of the research in the IIST facility are (1) to enhance understanding of the thermal-hydraulic phenomena during off-normal and accident con- ditions, and (2) to generate an experimental data- base for the assessment of the predictive capabilities of thermal-hydraulic system codes used in light water reactor safety analysis.
Because the behavior of a nuclear power plant is complicated, and the designs of all the integral system test facilities have limitations and make compromises in modelling and scaling with their respective referenced nuclear power plants, it is quite impossible for a small-scale facility to simu- late all the physical phenomena during the tran- sient process. However, by proper scaling, most of the important aspects of the transient behavior can be simulated. One of the important questions that arises for a small-scale facility is whether or not the physical phenomena observed in this kind of facility can be reliably extrapolated to those for an actual plant.
For an RHRP facility, before answering this question, it must be known whether or not the physical phenomena observed at an FHFP facility can be generated in an RHRP facility. A practical way to answer this question is to conduct an experiment that corresponds to the experiment which has already been performed at an FHFP facility under the same accident scenarios (Lar- son, 1987). To do this, the experimenter must have a good idea of the response that he/she is trying to simulate, so that a proper scaling of the initial and boundary conditions can be estab- lished; as a result, most of the key ther- mal-hydraulic phenomena observed in a reduced- pressure facility can be expected in an actual plant. In view of this, a counterpart test on the PWR SB transient was conducted at the IIST facility. The initial and boundary conditions of the present test were determined by scaling the corresponding conditions of an SB experiment performed at the LSTF (Kukita et al., 1990). The scenarios simulated in the present study were the
T.-J. Liu et al. / Nuclear Engineering and Design 167 (1997) 357-373 359
-ACCUMULATOR
gFs”M GENERATOR
PR
-SG2
ESSURIZER RELIEF VALVE
SGl
PRESSURE VESSEL
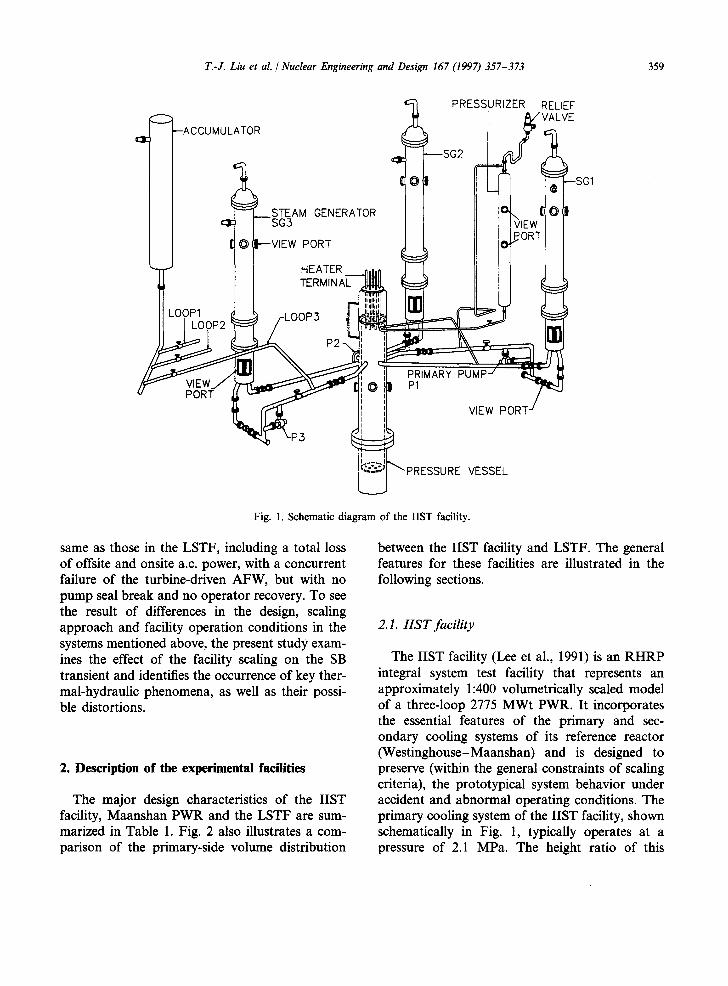
Fig. 1. Schematic diagram of the IIST facility.
same as those in the LSTF, including a total loss of offsite and onsite a.c. power, with a concurrent failure of the turbine-driven AFW, but with no pump seal break and no operator recovery. To see the result of differences in the design, scaling approach and facility operation conditions in the systems mentioned above, the present study exam- ines the effect of the facility scaling on the SB transient and identifies the occurrence of key ther- mal-hydraulic phenomena, as well as their possi- ble distortions.
2. Description of the experimental facilities
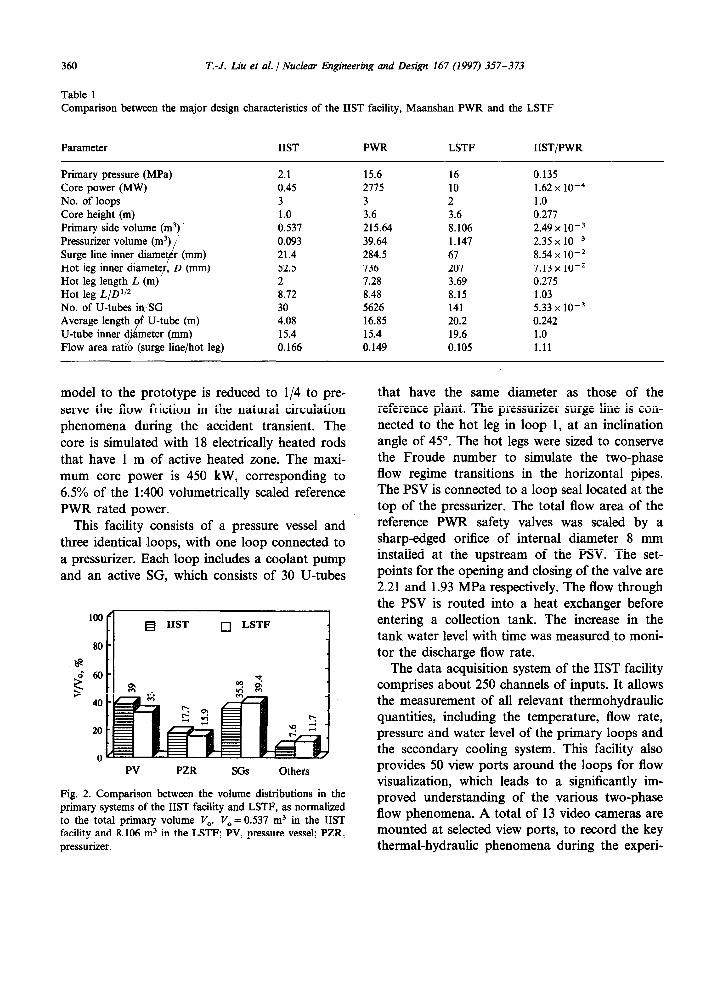
The major design characteristics of the IIST facility, Maanshan PWR and the LSTF are sum- marized in Table 1. Fig. 2 also illustrates a com- parison of the primary-side volume distribution
between the IIST facility and LSTF. The general features for these facilities are illustrated in the following sections.
2.1. IIST facility
The IIST facility (Lee et al., 1991) is an RHRP integral system test facility that represents an approximately 1:400 volumetrically scaled model of a three-loop 2775 MWt PWR. It incorporates the essential features of the primary and sec- ondary cooling systems of its reference reactor (Westinghouse-Maanshan) and is designed to preserve (within the general constraints of scaling criteria), the prototypical system behavior under accident and abnormal operating conditions. The primary cooling system of the IIST facility, shown schematically in Fig. 1, typically operates at a pressure of 2.1 MPa. The height ratio of this
360 T.-J. Liu et al. / Nuclear Engineering and Design 167 (1997) 357-373
Table 1 Comparison between the major design characteristics of the IIST facility, Maanshan PWR and the LSTF
Parameter
Primary pressure (MPa) Core (MW) power No. of loops Core height (m) Primary side volume Pressurizer volume (m3) (m”] Surge line inner diamet k r (mm) Hot leg inner diamete#, D (mm) Hot leg length L (m) Hot leg L/D112 No. of U-tubes in ‘SG Average length g U-tube (m) U-tube inner d’ eter (mm) Flow area ratio (surge line/hot leg)
IIST PWR LSTF IIST/PWR
2.1 15.6 16 0.135 0.45 2775 10 1.62 x 1O-4 3 3 2 1.0 1.0 3.6 3.6 0.277 0.537 215.64 8.106 2.49 x 1o-3 0.093 39.64 1.147 2.35 x 1O-3 21.4 284.5 67 8.54 x 1O-2 52.5 736 207 7.13 x 1o-2 2 7.28 3.69 0.275 8.72 8.48 8.15 1.03 30 5626 141 5.33 x 1o-3 4.08 16.85 20.2 0.242 15.4 15.4 19.6 1.0 0.166 0.149 0.105 1.11
model to the prototype is reduced to l/4 to pre- serve the flow friction in the natural circulation phenomena during the accident transient. The core is simulated with 18 electrically heated rods that have 1 m of active heated zone. The maxi- mum core power is 450 kW, corresponding to 6.5% of the 1:400 volumetrically scaled reference PWR rated power.
This facility consists of a pressure vessel and three identical loops, with one loop connected to a pressurizer. Each loop includes a coolant pump and an active SG, which consists of 30 U-tubes
0 LSTF
PV PZR SGS Others
Fig. 2. Comparison between the volume distributions in the primary systems of the IIST facility and LSTF, as normalized to the total primary volume V,. V, = 0.537 m3 in the IIST facility and 8.106 m3 in the LSTF; PV, pressure vessel; PZR, pressurizer.
that have the same diameter as those of the reference plant. The pressurizer surge line is con- nected to the hot leg in loop 1, at an inclination angle of 45”. The hot legs were sized to conserve the Froude number to simulate the two-phase flow regime transitions in the horizontal pipes. The PSV is connected to a loop seal located at the top of the pressurizer. The total flow area of the reference PWR safety valves was scaled by a sharp-edged orifice of internal diameter 8 mm installed at the upstream of the PSV. The set- points for the opening and closing of the valve are 2.21 and 1.93 MPa respectively. The flow through the PSV is routed into a heat exchanger before entering a collection tank. The increase in the tank water level with time was measured to moni- tor the discharge flow rate.
The data acquisition system of the IIST facility comprises about 250 channels of inputs. It allows the measurement of all relevant thermohydraulic quantities, including the temperature, flow rate, pressure and water level of the primary loops and the secondary cooling system. This facility also provides 50 view ports around the loops for flow visualization, which leads to a significantly im- proved understanding of the various two-phase flow phenomena. A total of 13 video cameras are mounted at selected view ports, to record the key thermal-hydraulic phenomena during the experi-
T.-J. Liu et al. / Nuclear Engineering and Design 167 (1997) 357-373 361
ments. To reduce the heat loss to the environ- ment, all external metal surfaces of the test facility are thermally insulated, except at the pressure vessel upper head, where power cables penetrate.
2.2. LSTF
The LSTF (JAERI, 1985, 1989) is a Japanese FHFP facility designed to simulate a Westing- house 3423 MWt four-loop PWR. The volumetric scaling factor is l/48, which is the largest PWR integral simulator currently operative worldwide. The four primary loops of the reference PWR are represented by two equal-volume loops. The hot legs and the cold legs are sized to conserve the Froude number criterion and the scaled volumes. The SG in the LSTF contains 141 full-sized U- tubes. The PSV is connected to the top of the pressurizer. The total flow area of the reference PWR safety valves was scaled by a sharp-edged orifice of internal diameter 14.5 mm installed at the upstream of the PSV. The setpoints for the opening and closing of the valve are 17.26 and 17.06 MPa respectively. The pressurizer surge line is connected to the hot leg in loop A, at an inclination angle of 45” from the horizontal. The maximum core power used to simulate the decay core power is 10 MW, corresponding to 14% of the l/48 volumetrically scaled reference PWR rated power.
3. Scaling criteria and test conditions
The initial and boundary conditions of the present test were obtained by properly scaling down the conditions of the ROSA-IV LSTF SB experiment (Kukita et al., 1990). To obtain exper- imental conditions equivalent to those of the counterpart tests for the FHFP LSTF and RHRP IIST facility, power-to-mass scaling was devel- oped and the specific scaling for the initial condi- tions of the RHRP IIST facility test, such as the RCS pressure, hot leg fluid temperature, and sec- ondary pressure, were addressed. Table 2 summa- rizes the major initial steady state operating conditions of the counterpart tests conducted at the IIST facility and LSTF.
Table 2 Initial steady state conditions of the IIST facility and LSTF tests in the SB transient
Parameter IIST LSTF
Core power (kw) 180 10000 Primary pressure (MPa) 1.86 15.6 Primary inventory (kg) 471 5764 Hot leg temperature (K) 463 600 Cold leg temperature (K) 410 565 Pressurizer water level/H, (m/m) 2.5012.93 2.614.2 Secondary pressure (MPa) 0.3 7.3 Secondary inventory (total) (kg) 240 3600 Secondary fluid temperature (K) 407 562 Secondary water level/H, (m/m)b 1.5512.95 8.5117.7
* H,, inner height of pressurizer. b Hz, inner heigh t of SG secondary.
3.1. Power-to -mass scaling
As SB scenarios show, the most important con- sideration in deriving appropriate scaling criteria is to preserve the power history and the distribu- tion of mass inventory during the transient. Power-to-volume scaling is frequently used to pre- serve the time, power and mass inventory for FHFP facilities and for prototype plant, because the fluid exhibits the same properties at the full pressure. However, for RHRP facilities, power-to- volume scaling cannot preserve the mass inven- tory, because the fluid’s properties are not preserved at the reduced pressure. Therefore, this leads us to propose a power-to-mass scaling for both the FHFP and RHRP facilities, instead of the power-to-volume scaling in the simulation of the SB transient.
In the determination of the initial mass inven- tory MIIST, it is very important to take into ac- count the difference in fluid volumetric expansion between the IIST facility and LSTF. In this way, simulating the same PSV opening time as in the LSTF could be expected. To do this, the initial RCS volume fraction B of steam in both facilities must be known in advance. In the LSTF, the collapsed liquid level in the pressurizer is 2.6 m, corresponding to a PLsTF value of 5.3%. BIIsT can then be determined from fiLsTF as
B**s* = BLSTF[V(Tm)lIISTI[V(Tm)lLSTF (1)
362 T.-J. Liu et al. / Nuclear Engineering and Design 167 (1997) 357-373
where v(Td is the liquid phase specific volume at T,, and T, = (THL + T&/2.
Then, the initial liquid mass inventory in the IIST facility can be determined by
A4 IIST = (b2S - vl’ZR)~~ Td + &ST bCSPg( Tsat)
+wPm- &ST vRCS)PdT,a,) (2)
where VRcs and VpZR are the volumes in the RCS and Pressurizer, and pF and pB are the densities of the liquid and gas phases respectively.
The core power decay curve in the IIST facility (QrrsT(t)) used in this study is scaled from the ROSA-IV new core power curve QLsTF(t) (JAERI, 1989), based on the power-to-mass scal- ing criterion. The scaling factor S is the ratio of the initial RCS mass inventories between the IIST facility and LSTF. Thus, the core power decay curve for the present test was developed by adding the overall heat loss (18.9 kW) of the system to the above-mentioned scaled core power, i.e.
+ (overall heat loss in the IIST facility) (3)
3.2. SpeciJic scaling for the initial conditions
The initial primary pressure Ppi in the IIST facility was determined to conserve the saturated temperature difference ATsat between Ppi and the opening setpoint of the PSV (Ppsv) in both facili- ties, i.e.
(A T&ST = (A Tsat)LSTF
where
(4)
A Tsat = Tz3adpPSV) - Twdppi)
and T,,,(P) is the saturated temperature corre- sponding to the pressure P.
The initial hot leg fluid temperature THL was determined to match the value of subcooling AT,, as used in the LSTF, i.e.
(A TI-IL)IIST = (ATI-IL)LSTF (5)
where
AT& = Tsat(ppi) - THL
However, the initial cold leg fluid temperature TcL was limited by the SG secondary saturated fluid temperature Tsat(Psi), with ATCL = 3 K in both facilities, such that
CA TCL)IIST = CA TCLkSTF (6)
where
The secondary coolant pressure Psi was selected to conserve the normalized pressure in both facili- ties, such that
psi - Lu-H3 Ppi - PsadTd IIST = 1 [
psi - P,at(THL) Ppi - PdT’d 1 LSTF (7)
where P.&T) is the saturated pressure corre- sponding to the temperature T.
The secondary water level for the three SGs was maintained at 1.55 m. The above initial sec- ondary level was determined to scale the initial secondary coolant inventory, which directly af- fects the time required to boil dry the secondary water. The initial secondary coolant mass inven- tory in each SG was estimated to be 80 kg, based on calibration experiments which measured the secondary inventory for conditions similar to those of the initial steady state in the SB experi- ment. Indeed, the need to start the transient with an already reduced secondary mass inventory comes from the fact that the SG mass inventory degrades from normal operation of the plant, and the residual power level during the initial period of transient cannot be simulated.
3.3. IIST facility test procedure
During the warm-up period, the core power heat transport and heating of various components in the primary system were achieved by single- phase natural circulation. The primary and sec- ondary pressures were maintained by adjusting the power of the 10 kW immersion heater inserted at the bottom of the pressurizer, and the opening of a pneumatic control valve installed at a header of three steam discharge lines respectively. The initial secondary coolant levels were maintained
T.-J. Liu et al. 1 Nuclear Engineering and Design 167 (1997) 357-373 363
by feeding the hot water (363 K) from a boiler as the levels dropped to the preset value of 1.45 m. As the initial steady state condition was reached, the SB transient experiment started up at t = 0 s. At this instance, the power to the pressurizer heater was turned off and the valve to the sec- ondary feedwater line was closed. After keeping the initial core power (180 kW) for 370 s as the decay power attained to the initial core power value, the core power decay curve was simulated by regulating the output of direct current (d.c.) power supply to the core heater rods. The experi- ment was terminated as the upper core regions were uncovered, while the power supply was auto- matically tripped when the heater rod cladding temperature exceeded the preset value of 873 K.
4. Results and discussion
The thermal-hydraulic responses of the major transient parameters during this experiment are shown in Figs. 3- 11. Figs. 12- 15 also compare the evolutions of the core flow rate, discharged mass and depletion modes through the PSV, pres- surizer mass inventory and primary mass inven- tory, respectively, with those of the LSTF data. The experimental results of the key events, such as the initial transients, secondary side boil-off, pri-
0.5 -
Hall -E”srcr Dcgradntion 1
SG 1 steam dome
--.-_ 0.0 ’
0 , . , ., I
3000 6000 9000 12000
Time, set
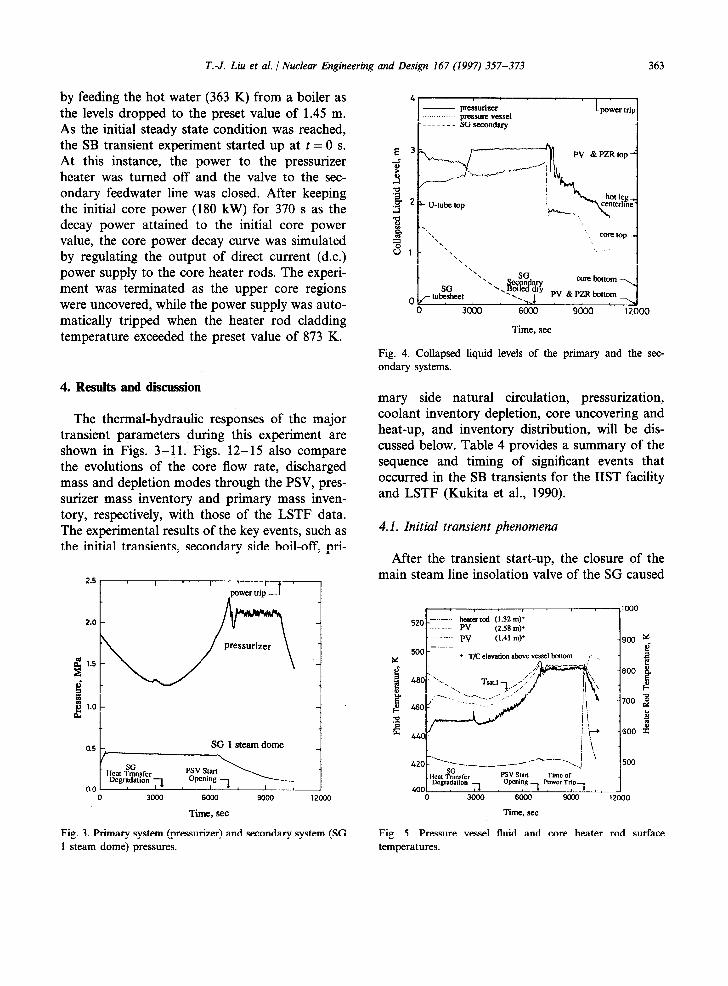
Fig. 3. Primary system (pressurizer) and secondary system (SG 1 steam dome) pressures.
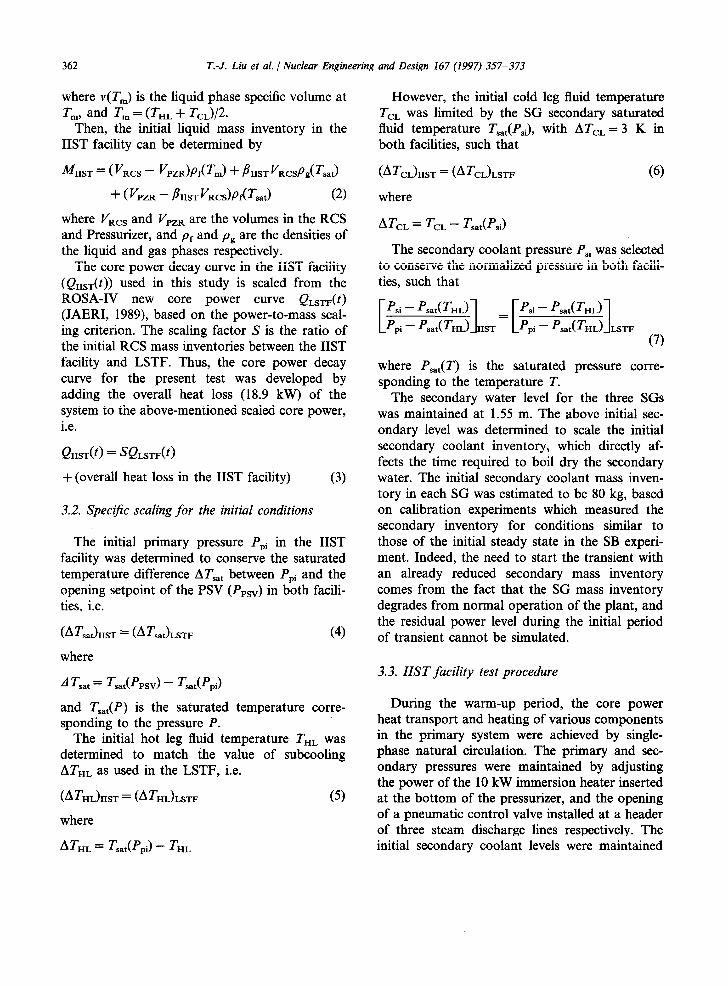
- prcssurizcr pressure vessel
------- SGseumdq
’ t ’ power trip
1
h PV &PZRtop-
.M S 2; ;I
u-tube top
B ._, 8 *\ %
\ core top - \
U 1 - ‘\\ \ \
‘\ ‘.
SG Q$k& cobttom~
O J tubesheet PV & PZR bottom I L.1 .
0 3ooo 6000 go00 12000
Time, set
Fig. 4. Collapsed liquid levels of the primary and the sec- ondary systems.
mary side natural circulation, pressurization, coolant inventory depletion, core uncovering and heat-up, and inventory distribution, will be dis- cussed below. Table 4 provides a summary of the sequence and timing of significant events that occurred in the SB transients for the IIST facility and LSTF (Kukita et al., 1990).
4.1. Initial transient phenomena
After the transient start-up, the closure of the main steam line insolation valve of the SG caused
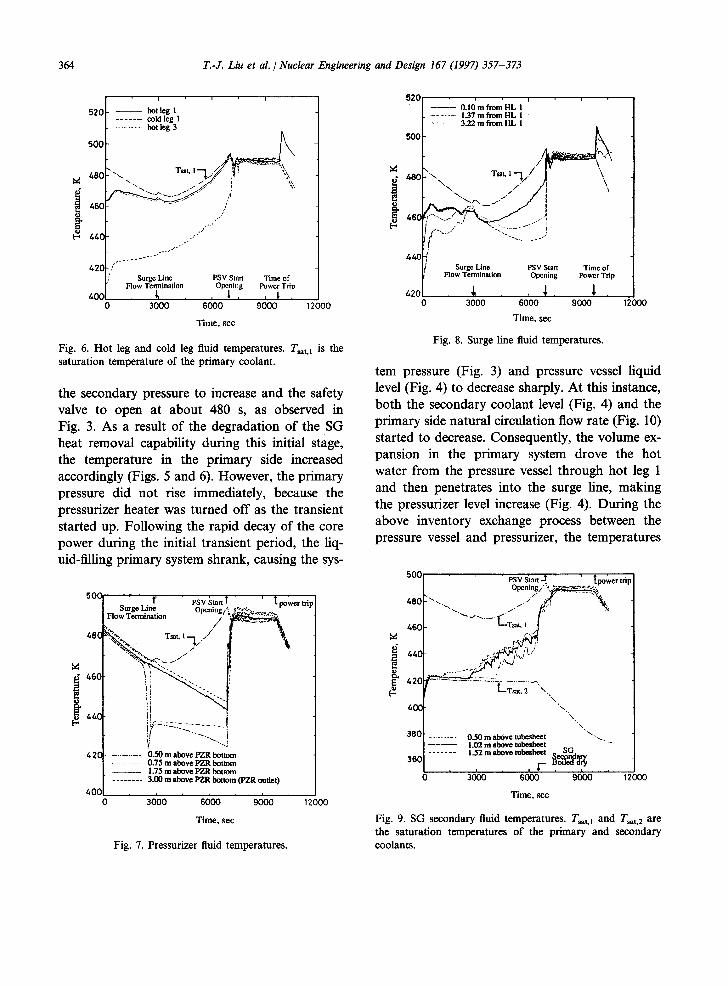
520 _---- ~exrotl (1.32 m)+ . (2.58 m)+
-- PV (1.41 m)+ -.-.-
500 - + T/C elevation above vessel bottom
I i i \ ~*0_‘~-.___._ _,_,,__.-.,~~-.---,,.j 500
xi hat Tran~kr Psv Shin Time ol Degrodatmn Opting Power Trip
400 .J. I 7. I 7, ,
0 3000 6000 9000 12000
Time, set
Fig. 5. Pressure vessel fluid and core heater rod surface temperatures.
364 T.-J. Liu et al. / Nuclear Engineering and Design 167 (1997) 357-373
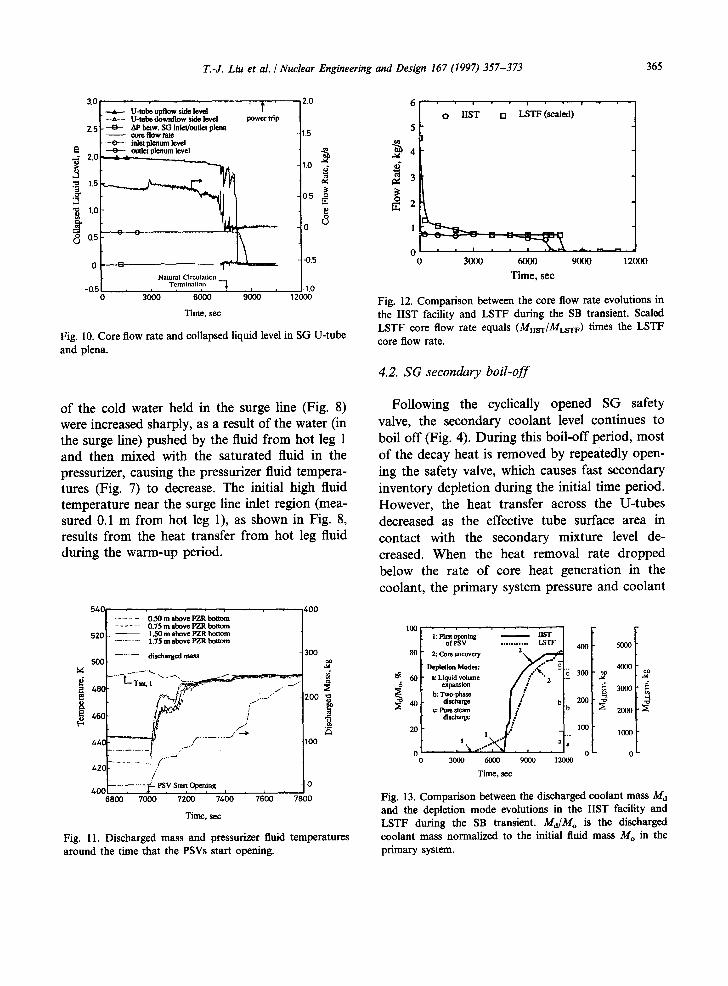
520 - - hot leg 1 ------- coldleg 1
hot leg 3
500 -
0 3000 6000 9000 1
Time, set
Fig. 6. Hot leg and cold leg fluid temperatures. T,,, is the saturation temperature of the primary coolant.
the secondary pressure to increase and the safety valve to open at about 480 s, as observed in Fig. 3. As a result of the degradation of the SG heat removal capability during this initial stage, the temperature in the primary side increased accordingly (Figs. 5 and 6). However, the primary pressure did not rise immediately, because the pressurizer heater was turned off as the transient started up. Following the rapid decay of the core power during the initial transient period, the liq- uid-filling primary system shrank, causing the sys-
h2
4
-..-..-- 0.50 m above PZR bottom - 0.75 m above FZR bottom
1.75 m above PZR bottom ___----_ 3.00 m above FZR bottom (PZR outkt)
0 3000 6000 9000 12000
Time, set
Fig. 7. Pressurizer fluid temperatures.
0 3000 6000 9000 1:
Time, set
00
Fig. 8. Surge line fluid temperatures.
tern pressure (Fig. 3) and pressure vessel liquid level (Fig. 4) to decrease sharply. At this instance, both the secondary coolant level (Fig. 4) and the primary side natural circulation flow rate (Fig. 10) started to decrease. Consequently, the volume ex- pansion in the primary system drove the hot water from the pressure vessel through hot leg 1 and then penetrates into the surge line, making the pressurizer level increase (Fig. 4). During the above inventory exchange process between the pressure vessel and pressurizer, the temperatures
660 -
L
4 “\
“\ . . ‘.
~~0 0.50 m above tubesheet i. ‘1.
- 1.02 m above tubesheet _ _ _ _ _ _ _
360 1.52 m above Mesh? B,,$&q
I I I
0 3000 6OOCi 9000 1:
Time, set
00
Fig. 9. SG secondary fluid temperatures. Ts,t,l and Tsat,z are the saturation temperatures of the primary and secondary coolants.
T.-J. Liu et al. / Nuclear Engineering and Design 167 (1997) 357-373 365
+ U-tube upflow side level I ‘. A .. U-tube downflow side level power trip
2.5 ff- &~~~~inkt/outkt plena 1.5
E - o- inktpknllmkvel
-0- outkt plenum kvel
- 1.0 3 d
. 2 - 0.5 g
- E 0
-0 u
0 ~-- j-o.5 Nalurnl Circulntion
-0.5 Tcnninnlinn 7 1 # -1.0 0 3000 6000 9000 12000
Time, set
Fig. 10. Core flow rate and collapsed liquid level in SG U-tube and plena.
of the cold water held in the surge line (Fig. 8) were increased sharply, as a result of the water (in the surge line) pushed by the fluid from hot leg 1 and then mixed with the saturated fluid in the pressurizer, causing the pressurizer fluid tempera- tures (Fig. 7) to decrease. The initial high fluid temperature near the surge line inlet region (mea- sured 0.1 m from hot leg l), as shown in Fig. 8, results from the heat transfer from hot leg fluid during the warm-up period.
t
0.50 m above PZR bottoh ------ 0.75mabovcPZRbottom
520 - 1.50 m above PZR bottom -.--- 1.75maboveFZRbottom
’ . . . -... .I-. PSV Stan Opening 0 - - 0 * 0’
6800 7000 7200 7400 7600 7800
Time, set
Fig. 11. Discharged mass and pressurizer fluid temperatures around the time that the PSVs start opening.
3ooo 9ooo 12wl
Time, set
Fig. 12. Comparison between the core flow rate evolutions in the IIST facility and LSTF during the SB transient. Scaled LSTF core flow rate equals (MnST/MLsTF) times the LSTF core flow rate.
4.2. SG secondary boil-off
Following the cyclically opened SG safety valve, the secondary coolant level continues to boil off (Fig. 4). During this boil-off period, most of the decay heat is removed by repeatedly open- ing the safety valve, which causes fast secondary inventory depletion during the initial time period. However, the heat transfer across the U-tubes decreased as the effective tube surface area in contact with the secondary mixture level de- creased. When the heat removal rate dropped below the rate of core heat generation in the coolant, the primary system pressure and coolant
100
80
@60 6 s 40
20
n
. 1: Fim;g;ing
- 2: Core uncovety
’ Depletion Modes:
- IIST . . ...“.... LSTF
c: Pure seam . discharge
400 -
300 - r”
t;;
200 - 3
loo -
0 L
r 5ooo -
4ooo- .r”
3000- - .5
2ooo’~
loo0 -
11 ” 3ooo 6ow 9wl
Time, set
Fig. 13. Comparison between the discharged coolant mass Md and the depletion mode evolutions in the IIST facility and LSTF during the SB transient. M,/M, is the discharged coolant mass normalized to the initial fluid mass MO in the primary system.
366 T.-J. Liu et al. / Nuclear Engineering and Design 167 (1997) 357-373
0.0 i 0 L 0 3000 6000 9ooo 12000
Time, set
800 F
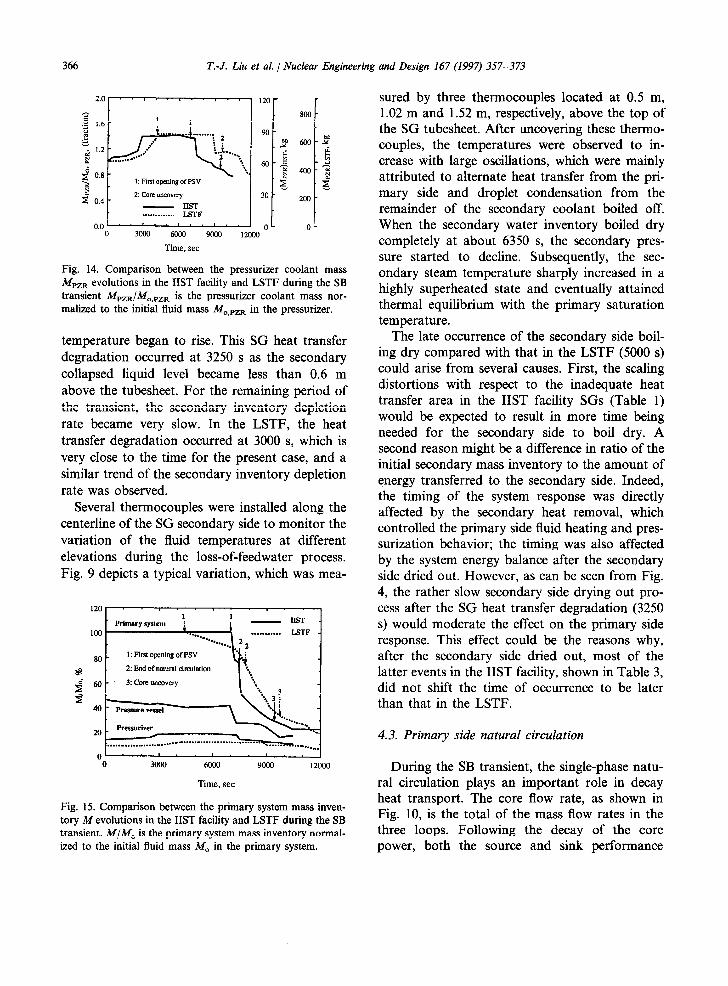
Fig. 14. Comparison between the pressurizer coolant mass M PZR evolutions in the IIST facility and LSTF during the SB transient MpzR/Mo,pZR is the pressurizer coolant mass nor- malized to the initial fluid mass Mo,pZR in the pressurizer.
temperature began to rise. This SG heat transfer degradation occurred at 3250 s as the secondary collapsed liquid level became less than 0.6 m above the tubesheet. For the remaining period of the transient, the secondary inventory depletion rate became very slow. In the LSTF, the heat transfer degradation occurred at 3000 s, which is very close to the time for the present case, and a similar trend of the secondary inventory depletion rate was observed.
Several thermocouples were installed along the centerline of the SG secondary side to monitor the variation of the fluid temperatures at different elevations during the loss-of-feedwater process. Fig. 9 depicts a typical variation, which was mea-
120) . ’ I . I . I . , 1 1
Primary system - UST . 100 . . . . . . _ . . . . LSTF -
80 - 1: First opening of PSV
* . 2: End of natural circulation ‘. \
Time, set
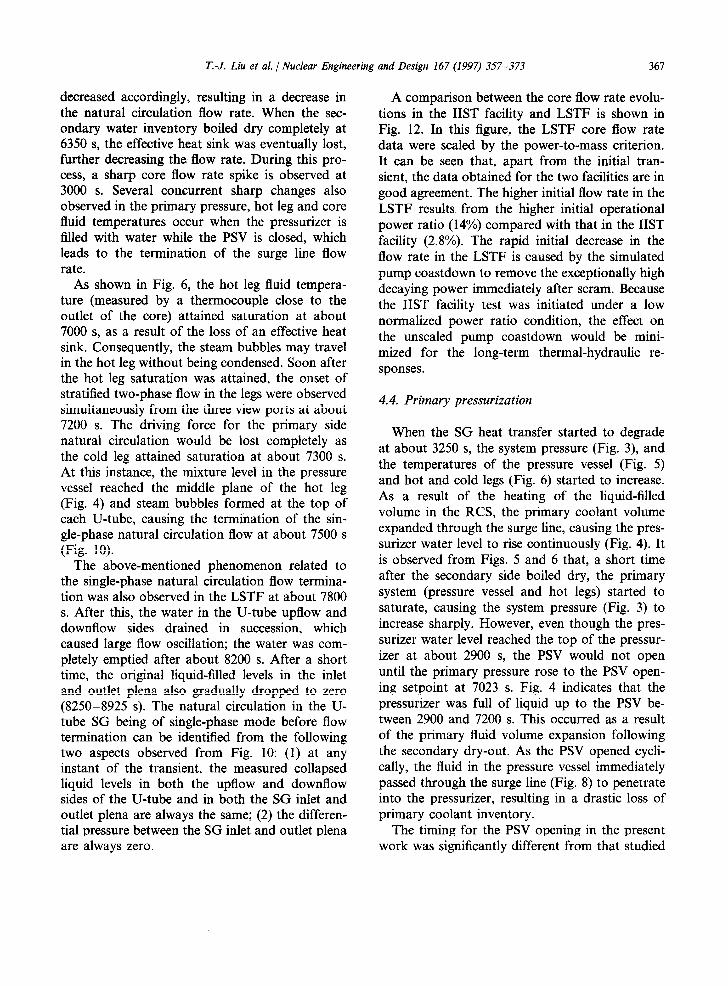
Fig. 15. Comparison between the primary system mass inven- tory M evolutions in the IIST facility and LSTF during the SB transient. M/M,, is the primary system mass inventory normal- ized to the initial fluid mass MO in the primary system.
sured by three thermocouples located at 0.5 m, 1.02 m and 1.52 m, respectively, above the top of the SG tubesheet. After uncovering these thermo- couples, the temperatures were observed to in- crease with large oscillations, which were mainly attributed to alternate heat transfer from the pri- mary side and droplet condensation from the remainder of the secondary coolant boiled off. When the secondary water inventory boiled dry completely at about 6350 s, the secondary pres- sure started to decline. Subsequently, the sec- ondary steam temperature sharply increased in a highly superheated state and eventually attained thermal equilibrium with the primary saturation temperature.
The late occurrence of the secondary side boil- ing dry compared with that in the LSTF (5000 s) could arise from several causes. First, the scaling distortions with respect to the inadequate heat transfer area in the IIST facility SGs (Table 1) would be expected to result in more time being needed for the secondary side to boil dry. A second reason might be a difference in ratio of the initial secondary mass inventory to the amount of energy transferred to the secondary side. Indeed, the timing of the system response was directly affected by the secondary heat removal, which controlled the primary side fluid heating and pres- surization behavior; the timing was also affected by the system energy balance after the secondary side dried out. However, as can be seen from Fig. 4, the rather slow secondary side drying out pro- cess after the SG heat transfer degradation (3250 s) would moderate the effect on the primary side response. This effect could be the reasons why, after the secondary side dried out, most of the latter events in the IIST facility, shown in Table 3, did not shift the time of occurrence to be later than that in the LSTF.
4.3. Primary side natural circulation
During the SB transient, the single-phase natu- ral circulation plays an important role in decay heat transport. The core flow rate, as shown in Fig. 10, is the total of the mass flow rates in the three loops. Following the decay of the core power, both the source and sink performance
T.-J. Liu et al. / Nuclear Engineering and Design 167 (1997) 357-373 367
decreased accordingly, resulting in a decrease in the natural circulation flow rate. When the sec- ondary water inventory boiled dry completely at 6350 s, the effective heat sink was eventually lost, further decreasing the, flow rate. During this pro- cess, a sharp core flow rate spike is observed at 3000 s. Several concurrent sharp changes also observed in the primary pressure, hot leg and core fluid temperatures occur when the pressurizer is filled with water while the PSV is closed, which leads to the termination of the surge line flow rate.
As shown in Fig. 6, the hot leg fluid tempera- ture (measured by a thermocouple close to the outlet of the core) attained saturation at about 7000 s, as a result of the loss of an effective heat sink. Consequently, the steam bubbles may travel in the hot leg without being condensed. Soon after the hot leg saturation was attained, the onset of stratified two-phase flow in the legs were observed simultaneously from the three view ports at about 7200 s. The driving force for the primary side natural circulation would be lost completely as the cold leg attained saturation at about 7300 s. At this instance, the mixture level in the pressure vessel reached the middle plane of the hot leg (Fig. 4) and steam bubbles formed at the top of each U-tube, causing the termination of the sin- gle-phase natural circulation flow at about 7500 s (Fig. 10).
The above-mentioned phenomenon related to the single-phase natural circulation flow termina- tion was also observed in the LSTF at about 7800 s. After this, the water in the U-tube upflow and downflow sides drained in succession, which caused large flow oscillation; the water was com- pletely emptied after about 8200 s. After a short time, the original liquid-filled levels in the inlet and outlet plena also gradually dropped to zero (8250-8925 s). The natural circulation in the U- tube SG being of single-phase mode before flow termination can be identified from the following two aspects observed from Fig. 10: (1) at any instant of the transient, the measured collapsed liquid levels in both the upflow and downflow sides of the U-tube and in both the SG inlet and outlet plena are always the same; (2) the differen- tial pressure between the SG inlet and outlet plena are always zero.
A comparison between the core flow rate evolu- tions in the IIST facility and LSTF is shown in Fig. 12. In this figure, the LSTF core flow rate data were scaled by the power-to-mass criterion. It can be seen that, apart from the initial tran- sient, the data obtained for the two facilities are in good agreement. The higher initial flow rate in the LSTF results from the higher initial operational power ratio (14%) compared with that in the IIST facility (2.8%). The rapid initial decrease in the flow rate in the LSTF is caused by the simulated pump coastdown to remove the exceptionally high decaying power immediately after scram. Because the IIST facility test was initiated under a low normalized power ratio condition, the effect on the unscaled pump coastdown would be mini- mized for the long-term thermal-hydraulic re- sponses.
4.4. Primary pressurization
When the SG heat transfer started to degrade at about 3250 s, the system pressure (Fig. 3), and the temperatures of the pressure vessel (Fig. 5) and hot and cold legs (Fig. 6) started to increase. As a result of the heating of the liquid-filled volume in the RCS, the primary coolant volume expanded through the surge line, causing the pres- surizer water level to rise continuously (Fig. 4). It is observed from Figs. 5 and 6 that, a short time after the secondary side boiled dry, the primary system (pressure vessel and hot legs) started to saturate, causing the system pressure (Fig. 3) to increase sharply. However, even though the pres- surizer water level reached the top of the pressur- izer at about 2900 s, the PSV would not open until the primary pressure rose to the PSV open- ing setpoint at 7023 s. Fig. 4 indicates that the pressurizer was full of liquid up to the PSV be- tween 2900 and 7200 s. This occurred as a result of the primary fluid volume expansion following the secondary dry-out. As the PSV opened cycli- cally, the fluid in the pressure vessel immediately passed through the surge line (Fig. 8) to penetrate into the pressurizer, resulting in a drastic loss of primary coolant inventory.
The timing for the PSV opening in the present work was significantly different from that studied
368 T.-J. Liu et al. / Nuclear Engineering and Design 167 (1997) 357-373
in the LSTF. In the LSTF, the pressurizer water level reached the top of the pressurizer at 4300 s after the first PSV opened at 4200 s (which was 800 s earlier than the SG secondary coolant boiled dry) (Kukita et al., 1990, 1991). This difference could be caused by the different operating condi- tions and facility geometries between the IIST facility and LSTF. To clarify this, the variations of the fluid temperatures in the pressurized and surge line need to be examined in detail.
Figs. 7 and 8 illustrate the fluid temperature histories of the pressurizer at different elevations and along the surge line. It can be seen from Fig. 7 that the fluid in the pressurizer at 0.5 m from the bottom was initially saturated but became subcooled at about 2000 s. The sudden drop in fluid temperatures near the bottom of the Pressur- izer resulted from the thermal expansion in the RCS, causing the cold water originally in the surge line to reach the different elevations in the pressurizer. This phenomenon propagated upward in the pressurizer indicating a significant heat loss in the pressurizer and surge line during the liquid volume expansion period. After the occurrence of the termination of the surge line flow (3000 s), the pressurizer was filled with water, while the PSV was closed, which further enhanced the heat loss in the pressurizer and surge line. This can be observed from Fig. 7 in the period 2000-7000 s, where the fluid temperatures continuously de- crease in the pressurizer. During this period, the surge line thermocouples located at a distance far from hot leg 1 also measured the exceptional lower temperature (Fig. 8). As illustrated in Fig. 11, at about 7180 s, the whole pressurizer fluid attained saturation shortly after the first opening of the PSV, expanding the saturated wa- ter from the pressure vessel to the pressurizer. After this, the primary side pressure and fluid temperature were maintained at the system pres- sure and saturated temperature, causing the pri- mary coolant inventory to boil off through the PSV.
To know how the operating conditions affect the PSV opening, several sensitivity studies have been performed in the IIST facility. The parame- ters selected include the primary coolant mass inventory, secondary coolant mass inventory, sec-
ondary coolant pressure and heat loss in the pressurizer. As expected, all these parameters af- fected the system pressurization rate and the chronological events were all the same as before. In particular, the time of PSV opening was always later than the time of the secondary coolant dry- ing out. Of these parameters, the heat loss in the pressurizer was found to be a dominant factor in affecting the timing of PSV opening. As men- tioned earlier in this section, a higher heat loss in the pressurizer was observed during the liquid volume expansion process, which drastically de- creased the system pressurization rate, so delaying the occurrence of PSV opening. This was because the long-term natural circulation flow was not circulated through the surge line and pressurizer while the immersion heater in the pressurizer was turned off at the beginning of the transient. This implies that, during the SB transient in a real plant, heat loss in the pressurizer is inevitable. In the LSTF test, however, the pressurizer back-up heater was powered at 2.5 kW throughout the transient, to make up for the heat lost from the pressurizer, which might drastically increase the system pressurization rate, so causing an earlier occurrence of the PSV opening.
The other important factors in affecting the system pressurization rate could also be attributed to the geometrical differences between these two facilities. The reason is that each of these two reduced-scale test facilities represents its own PWR prototype and each PWR has its own spe- cific configurations. Fig. 2 depicts the typical geo- metrical differences between the IIST facility and LSTF, by comparing the volume distributions in the pressure vessel, pressurizer, SGs and others (i.e. pipe lines between the components). As men- tioned earlier, the determination of the initial primary coolant mass in this study is by consider- ing the fluid thermal expansion between these two facilities is to simulate the same PSV opening time as that of LSTF. However, because of differences in design, scaling approach and operational con- ditions, these geometrical differences may result in different hot and cold fluid mass distributions during the transient, which in turn will directly affect the pressurization rate in reaching the PSV opening setpoint.
T.-J. Liu et al. / Nuclear Engineering and Design 167 (1997) 357-373 369
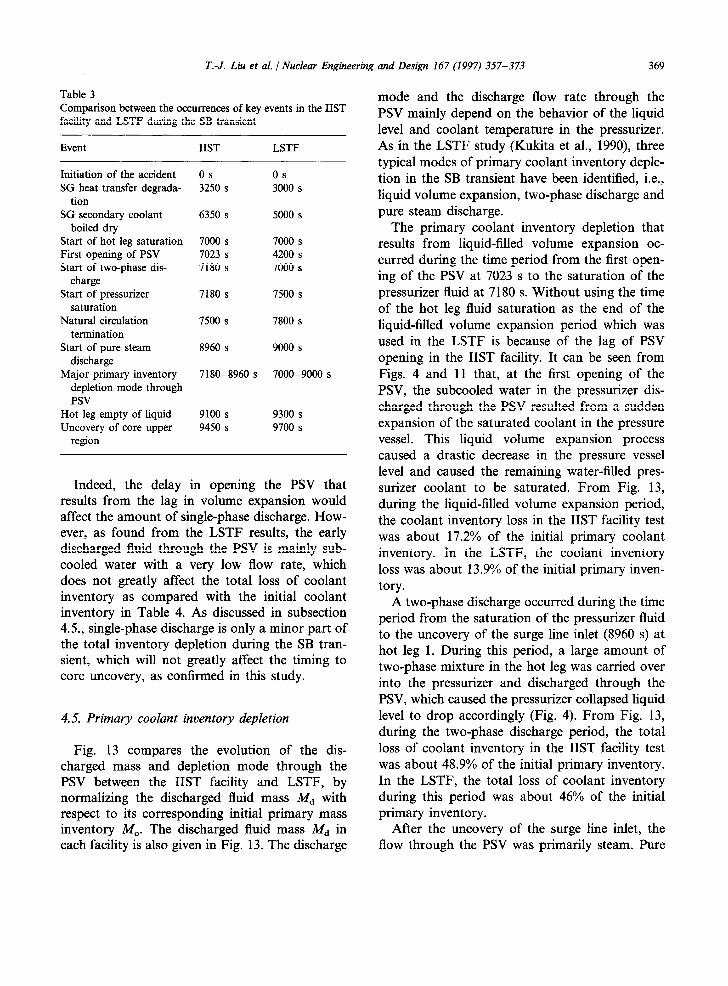
Table 3 Comparison between the occurrences of key events in the IIST facility and LSTF during the SB transient
Event IIST LSTF
Initiation of the accident 0 s OS SG heat transfer degrada- 3250 s 3000 s
tion SG secondary coolant 6350 s 5000 s
boiled dry Start of hot leg saturation 7000 s 7000 s First opening of PSV 7023 s 4200 s Start of two-phase dis- 7180 s 7000 s
charge Start of pressurizer 7180 s 7500 s
saturation Natural circulation 7500 s 7800 s
termination Start of pure steam 8960 s 9000 s
discharge Major primary inventory 7180-8960 s 7000-9000 s
depletion mode through PSV
Hot leg empty of liquid 9100 s 9300 s Uncovery of core upper 9450 s 9700 s
region
Indeed, the delay in opening the PSV that results from the lag in volume expansion would affect the amount of single-phase discharge. How- ever, as found from the LSTF results, the early discharged fluid through the PSV is mainly sub- cooled water with a very low flow rate, which does not greatly affect the total loss of coolant inventory as compared with the initial coolant inventory in Table 4. As discussed in subsection 4.5., single-phase discharge is only a minor part of the total inventory depletion during the SB tran- sient, which will not greatly affect the timing to core uncovery, as confirmed in this study.
4.5. Primary coolant inventory depletion
Fig. 13 compares the evolution of the dis- charged mass and depletion mode through the PSV between the IIST facility and LSTF, by normalizing the discharged fluid mass Md with respect to its corresponding initial primary mass inventory M,. The discharged fluid mass i& in each facility is also given in Fig. 13. The discharge
mode and the discharge flow rate through the PSV mainly depend on the behavior of the liquid level and coolant temperature in the pressurizer. As in the LSTF study (Kukita et al., 1990), three typical modes of primary coolant inventory deple- tion in the SB transient have been identified, i.e., liquid volume expansion, two-phase discharge and pure steam discharge.
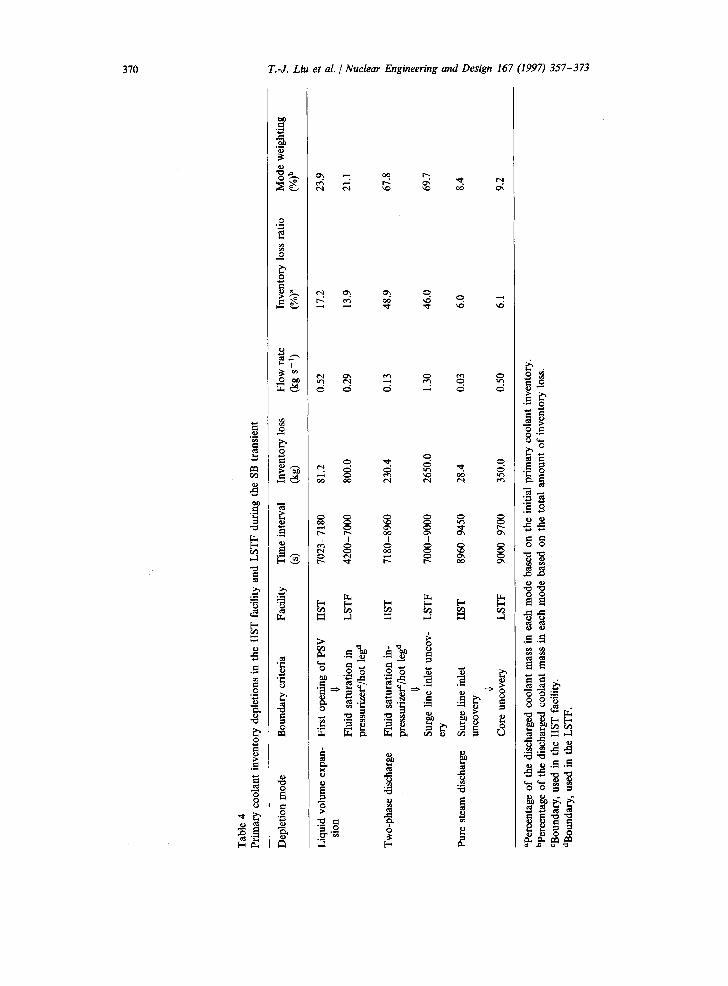
The primary coolant inventory depletion that results from liquid-filled volume expansion oc- curred during the time period from the first open- ing of the PSV at 7023 s to the saturation of the pressurizer fluid at 7180 s. Without using the time of the hot leg fluid saturation as the end of the liquid-filled volume expansion period which was used in the LSTF is because of the lag of PSV opening in the IIST facility. It can be seen from Figs. 4 and 11 that, at the first opening of the PSV, the subcooled water in the pressurizer dis- charged through the PSV resulted from a sudden expansion of the saturated coolant in the pressure vessel. This liquid volume expansion process caused a drastic decrease in the pressure vessel level and caused the remaining water-filled pres- surizer coolant to be saturated. From Fig. 13, during the liquid-filled volume expansion period, the coolant inventory loss in the IIST facility test was about 17.2% of the initial primary coolant inventory. In the LSTF, the coolant inventory loss was about 13.9% of the initial primary inven- tory.
A two-phase discharge occurred during the time period from the saturation of the pressurizer fluid to the uncovery of the surge line inlet (8960 s) at hot leg 1. During this period, a large amount of two-phase mixture in the hot leg was carried over into the pressurizer and discharged through the PSV, which caused the pressurizer collapsed liquid level to drop accordingly (Fig. 4). From Fig. 13, during the two-phase discharge period, the total loss of coolant inventory in the IIST facility test was about 48.9% of the initial primary inventory. In the LSTF, the total loss of coolant inventory during this period was about 46% of the initial primary inventory.
After the uncovery of the surge line inlet, the flow through the PSV was primarily steam. Pure
Tab
le 4
Pr
imar
y co
olan
t in
vent
ory
depl
etio
ns
in t
he I
IST
fac
ility
an
d L
STF
duri
ng
the
SB t
rans
ient
Dep
letio
n m
ode
Bou
ndar
y cr
iteri
a Fa
cilit
y T
ime
inte
rval
(s)
Inve
ntor
y lo
ss
(kg)
Flow
ra
te
(kg
s-‘)
Inve
ntor
y lo
ss r
atio
(%
) M
ode
wei
ghtin
g (%
)b
Liq
uid
volu
me
expa
n-
Firs
t op
enin
g of
PSV
II
ST
70
23-7
180
81.2
0.
52
17.2
23
.9
sion
u
Flui
d sa
tura
tion
in
LST
F 42
00-7
000
800.
0 0.
29
13.9
21
.1
pres
suri
zefl
/hot
le
gd
Tw
o-ph
ase
disc
harg
e Fl
uid
satu
ratio
n in
- II
ST
71
80-8
960
230.
4 0.
13
48.9
67
.8
pres
suri
zef/
hot
legd
u
Surg
e lin
e in
let
unco
v-
LST
F 70
00-9
000
2650
.0
1.30
46
.0
69.7
cry
Pure
ste
am
disc
harg
e Su
rge
line
inle
t II
ST
89
60-9
450
28.4
0.
03
6.0
8.4
unco
very
u
Cor
e un
cove
ry
LST
F 90
00-9
700
350.
0 0.
50
6.1
9.2
“Per
cent
age
of t
he d
isch
arge
d co
olan
t m
ass
in e
ach
mod
e ba
sed
on t
he i
nitia
l pr
imar
y co
olan
t in
vent
ory.
bP
erce
ntag
e of
the
dis
char
ged
cool
ant
mas
s in
eac
h m
ode
base
d on
the
tot
al
amou
nt
of i
nven
tory
lo
ss.
“Bou
ndar
y,
used
in
the
IIS
T f
acili
ty.
dBou
ndar
y,
used
in
the
LST
F.
T.-J. Liu et al. / Nuclear Engineering and Design 167 (1997) 357-373 371
steam discharge occurred when the hot leg be- came completely empty of liquid. As observed from the view ports in the IIST facility, this occurred at about 9100 s. During the period from the uncovery of the surge line inlet (8960 s) to the core uncovery (9450 s), the coolant inventory loss was only about 6.0% of the initial primary inven- tory. In the LSTF, the coolant inventory loss during this period was about 6.1% of the initial primary inventory.
Table 4 summarizes the primary coolant inven- tory depletions in the IIST facility and LSTF. The inventory loss ratio and the mode weighting in the last two columns of Table 4 are defined as the percentage of discharged coolant mass i& based on the initial primary coolant mass inventory M, and on the total amount of coolant mass loss, respectively, in the IIST facility and LSTF. It can be seen from Table 4 that the inventory loss ratio and the mode weighting for all three depletion modes tested in the IIST facility are fairly consis- tent with those of the results in the LSTF. The slight difference between the liquid volume expan- sion and two-phase discharge modes in both facil- ities is believed to arise mainly from the timing of PSV opening.
As observed from Fig. 13 and Table 4, the early discharged fluid through the PSV in the LSTF test was mainly subcooled water with a very low flow rate, and lasted a long period of time, which had a minor effect on the total loss of coolant inven- tory. In contrast, the late opening of the PSV that resulted from the lag in volume expansion, as observed in the present test, would sharply in- crease the amount of discharged subcooled water within a very short period of time. This higher inventory loss ratio in the IIST facility test led to an earlier decrease in the pressurizer level (Fig. 14) and a relatively higher inventory loss ratio in the next period of two-phase discharge. Among the three types of primary coolant inventory de- pletion mode during the SB transient, one can see that the two-phase discharge in the IIST facility test was the major depletion mode, because it accounted for 67.8% of the total amount of coolant inventory loss (340 kg) within a period of 1780 s. Similarly, in the LSTF, a weighting of 69.7% in two-phase flow was discharged within a period of 2000 s (Kukita et al., 1990).
4.6. Core uncovery and heat-up
After the uncovery of the surge line inlet, the pressure vessel water level dropped again, as a result of the continuation of the coolant boil-off through the PSV. Finally, the core upper regions were uncovered at 9450 s, signalled by the heater rod temperature excursions, while the core power decayed to about 1.1% of the normal operating power. When the peak cladding temperature reached the preset power trip temperature of 873 K, the simulated residual core power supplied to the heater rods was tripped automatiaally to ter- minate the experiment. As shown in Fig. 5, the power trip was triggered at 9765 s, by an embed- ded thermocouple located at the top of the heated zone, at an elevation of 1323 mm above the bottom of the pressure vessel. Immediately after the power trip, it can be observed from Figs. 5 and 6 and 8 that steam superheating up to about 20 K was detected in hot leg 1, the surge line and the pressure vessel, but not in the two other hot legs and the pressurizer, where liquid still re- mained. Similar phenomena in the LSTF were also observed but with a much higher steam su- perheating up to 110 K (Kukita et al., 1990). These thermodynamic non-equilibrium phenom- ena were caused by the fact that, soon after the core power tripped, the water falling back into the core was insufficient to rewet the very hot, bared heater rod immediately. The occurrence of differ- ent superheats only in loop 1 could mainly be induced by the PSV leakage after a long period of cyclical operation.
5. Inventory distribution
From the evolution of the SB transient, it was noticed that the primary coolant inventory redis- tributed drastically among the pressure vessel, pressurizer and SGs. Fig. 14 shows a comparison of the pressurizer mass inventory evolution in the IIST facility with that in the LSTF, with the pressurizer fluid mass MpZR being normalized to its corresponding initial value Mo,PzR. From this comparison, it is seen that the normalized pressur- izer mass inventories in these two facilities show a
372 T.-J. Liu et al. / Nuclear Engineering and Design 167 (1997) 357-373
similar up-and-down trend, with similar liquid- full mass ratios. However, there are large differ- ences in the time to reach the top of the pressurizer and in the inventory at the beginning of core uncovery.
The time for the water level to reach the top of the pressurizer is dependent on the single- phase volume expansion, as mentioned earlier. The difference between the pressurizer invento- ries in the IIST facility and LSTF at core un- covery could be caused by the difference in the phase separation efficiency upstream of the surge line inlet (Kukita et al., 1990). The phase separation efficiency may depend on the plant- specific geometry in the surge line inlet design, as well as on the facility scale. At the time of core uncovery, the pressurizer still held 90.1% of the initial water inventory in the IIST facility and a slightly greater amount (115%) in the LSTF. This could have resulted from the higher flow area ratio of the surge line to hot leg in the IIST facility than that in the LSTF, as shown in Table 1. For accident prevention, it is essential for the operators to take appropriate action to drain the pressurizer water inventory effectively into the pressure vessel before achiev- ing significant core overheating.
To highlight the mass inventory redistribution, Fig. 15 provides a comparison between the IIST facility and LSTF of the evolution of the mass inventory in the primary system, as well as in the pressurizer. In this figure, the evolution of the fluid mass in each component (M) is nor- malized by the initial RCS coolant mass A&, in both facilities. The evolution of the pressure ves- sel mass inventory was provided for the IIST facility only, because the corresponding data for the LSTF were unavailable. Fig. 15 indicates that the evolution of the pressurizer mass inven- tory in the IIST facility test is always higher than that in the LSTF, based on the mass in- ventory in the pressurizer being normalized by the initial RCS coolant mass M, in both facili- ties. It should be noted that the somewhat dif- ferent results between Figs. 14 and 15 for the evolution of the mass inventory in the pressur- izer arise mainly from the inventory being nor- malized to the different bases mentioned above.
The geometrical difference that a larger fraction of the pressurizer volume is occupied in the IIST facility than in the LSTF (Fig. 2) is be- lieved to be another reason.
It can be seen from Fig. 15 that the normal- ized mass inventories in both primary systems showed a very similar physical behavior, even though there were small differences in the time to reach the end of natural circulation and the beginning of core uncovery resulted from a dif- ference in the time of PSV opening. Neverthe- less, it is encouraging to notice that, at the end of natural circulation, the fraction of primary coolant inventory remaining in the present test, estimated from the amount of water depletion, was about 78%, which is in close agreement with the LSTF result (77%). A similar behavior was also observed at the beginning of core un- covery. For reactor safety, it is known that the determinant parameter to avoid core overheating is the amount of coolant left in the pressure vessel, which effectively cools the core, but not the amount of the coolant inventory that re- mains in the primary system, which is a general concern in nuclear reactor safety analysis. How- ever, as shown in Fig. 15, the effective coolant usable in core cooling was only about one-half of the system inventory that remained at the beginning of core uncovery.
6. Conclusion
Counterpart experiments have been performed at the RHRP IIST facility to simulate a PWR SB test performed at the ROSA-IV FHFP LSTF. The ROSA-IV LSTF test conditions were used to originate the scaled initial and boundary conditions used in the present test, by employing a power-to-mass scaling method and specific scaling method based on the characteris- tics of the SB transient. The long-term thermal- hydraulic phenomena, including the SG secondary boil-off, primary side natural circula- tion, subsequent primary system saturation and pressurization, primary coolant inventory deple- tion and redistribution, and eventual core un- covery and heat-up, were studied in detail. The
T.-J. Liu et al. / Nuclear Engineering znd Design 167 (1997) 357-373
phenomenology of the transient and supporting evidence were presented and extensively discussed. The important results are summarized as follows.
(1) The behaviors of key parameters in these two facilities during the SB transient -including the core flow rate, system pressure and tempera- ture, primary system mass inventory, secondary coolant boiling dry, and discharged flow rate evo- lution-were found to be quite similar when com- paring the IIST facility and LSTF experimental data. It is seen that significant thermal-hydraulic phenomena that occur in the FHFP LSTF test also occurred in the RHRP IIST facility test.
(2) The most relevant discrepancy between the IIST facility and LSTF test results is the time of the anticipated opening of the PSV, which is mainly affected by the following three factors: (i) the primary-to-secondary heat transfer rate; (ii) whether or not there is pressurizer heat loss compensation; (iii) the geometrical differences be- tween the two facilities.
(3) However, such geometrical differences and the discrepancy in the time of PSV opening do not greatly affect the primary coolant inventory deple- tion and the subsequent transient phenomena, such as natural circulation termination and core uncovery, as observed in this experiment.
(4) The fractions of inventory loss through the PSV for all three depletion modes are fairly con- sistent with those of the results in the LSTF. Of these modes, two-phase discharge was the major depletion mode, because it covered 67.8% of the total amount of coolant inventory loss within a period of about 2000 s, which is similar to the LSTF result (69.7%).
(5) The primary coolant inventory redistributed drastically during SB transient. At the time of core uncovery, the amount of water accumulated in the pressurizer was comparable with the initial inventory, so that the effective coolant usable in core cooling was only about one-half of the re- maining mass inventory. To prevent the occur- rence of excessive core overheating-or at least to delay it-effective operator action should be taken to lower the primary pressure so that the PSVs do not open, or to drain the pressurizer water into the pressure vessel so that the pressure vessel water level can be recovered.
373
References
Y. Anoda, J. Katayama, Y. Kukita and R. Mandl, Secondary bleed and passive feed during PWR station blackout (TMLB’) transient: experimental simulation at full pressure and tem- perature, ASME Winter Annual Meeting, Anaheim, CA, FED 140 (1992) 89.
Babcock and Wilcox, Multi-loop integral system test (MIST) facility specification, NRC-04-83-168, Babcock and Wilcox, 1983.
B. Brand, R. Mandl and H. Watzinger, Investigation of PWR transients in the PKL test facility, Proc. 3rd Int. Topical Meet. on Nuclear Power Plant Thermal Hydraulics and Operations, Seoul, 1988.
CENG, BETHSY general description, Note SETH/LES/90-97, Centre d’Etudes Nucleaire de Grenoble, 1990.
J.C. Chapman, Station blackout transient in the Semiscale test facility, NUREG/CR-446, US Nuclear Regulatory Commis- sion, 1985.
JAERI, ROSA-IV large scale test facility (LSTF) system descrip- tion, JAERI-M-84-237, Japan Atomic Energy Research Institute, 1985.
JAERI, Supplemental description of ROSA-IV LSTF with No. 1 simulated fuel-rod assembly, JAERI-M-89-113, Japan Atomic Energy Research Institute, 1989.
F. Kappler, I. Mougey and R. Simon, Primary-system integrity of french pressurized-water reactors during station blackout, Nucl. Safety26(1985)427.
Y. Kukita, Y. Anoda, H. Asaka and F. Serre, Pressurized water reactor station blackout: experimental simulation in the ROSA-IV LSTF, Proc. ASME Winter Annual Meet., Dallas, TX, FED 104(1990)7.
Y. Kukita, Y. Anoda and K. Tasaka, Summary of ROSA-IV LSTF first-phase test program-integral simulation of PWR small-break LOCAs and transients, Nucl. Eng. Des. 131 (1991) 101.
T.K. Larson, An investigation of integral facility scaling and data reduction method, NUREG/CR-453 1, US Nuclear Regula- tory Commission, 1987.
T.K. Larson and G.C. Loomis, Semiscale program, a summary of program contributions to water reactor safety research, Nucl. Safety29 (1988)436.
C.H. Lee et al., The conceptual design report for INER integral system test facility, INER-1098, Institute of Nuclear Energy Research, Taiwan, 199 1.
D.W. Sallet, Final Design Report for the UMCP 2 x 4 B&W Simulation Loop, Department of Chemical and Nuclear Engineering, University of Maryland, 1984.
R.R. Schultz, C.D. Fletcher and T.R. Charlton, Station blackout in US light-water nuclear reactors, Nucl. Safety 25 (1984) 501.
USNRC, Reactor safety study-an assessment of accident risks in US commercial nuclear plants, NUREG-075/14, US Nuclear Regulatory Commission, 1975.
USNRC, Reactor risk reference document, NUREG-1150, US Nuclear Regulatory Commission, 1990.
T. Watanabe and Y. Kukita, Experiment and analyses of PWR station blackout transient involving pump seal leak, Proc. NURETH-6, Grenoble, 1993, p. 1233.