Embed Size (px)
Citation preview
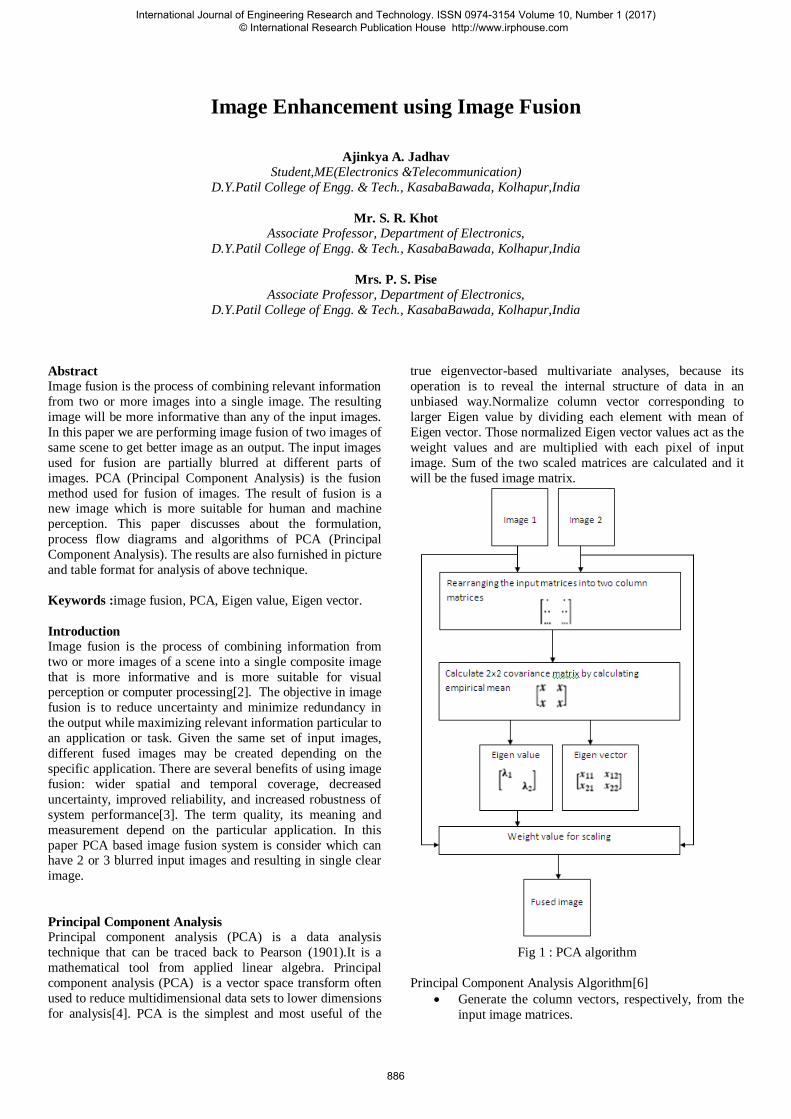
Image Enhancement using Image Fusion
Ajinkya A. Jadhav
Student,ME(Electronics &Telecommunication)
D.Y.Patil College of Engg. & Tech., KasabaBawada, Kolhapur,India
Mr. S. R. Khot
Associate Professor, Department of Electronics,
D.Y.Patil College of Engg. & Tech., KasabaBawada, Kolhapur,India
Mrs. P. S. Pise
Associate Professor, Department of Electronics,
D.Y.Patil College of Engg. & Tech., KasabaBawada, Kolhapur,India
Abstract Image fusion is the process of combining relevant information
from two or more images into a single image. The resulting
image will be more informative than any of the input images.
In this paper we are performing image fusion of two images of
same scene to get better image as an output. The input images
used for fusion are partially blurred at different parts of
images. PCA (Principal Component Analysis) is the fusion
method used for fusion of images. The result of fusion is a new image which is more suitable for human and machine
perception. This paper discusses about the formulation,
process flow diagrams and algorithms of PCA (Principal
Component Analysis). The results are also furnished in picture
and table format for analysis of above technique.
Keywords :image fusion, PCA, Eigen value, Eigen vector.
Introduction Image fusion is the process of combining information from
two or more images of a scene into a single composite image
that is more informative and is more suitable for visual perception or computer processing[2]. The objective in image
fusion is to reduce uncertainty and minimize redundancy in
the output while maximizing relevant information particular to
an application or task. Given the same set of input images,
different fused images may be created depending on the
specific application. There are several benefits of using image
fusion: wider spatial and temporal coverage, decreased
uncertainty, improved reliability, and increased robustness of
system performance[3]. The term quality, its meaning and
measurement depend on the particular application. In this
paper PCA based image fusion system is consider which can have 2 or 3 blurred input images and resulting in single clear
image.
Principal Component Analysis
Principal component analysis (PCA) is a data analysis
technique that can be traced back to Pearson (1901).It is a
mathematical tool from applied linear algebra. Principal
component analysis (PCA) is a vector space transform often
used to reduce multidimensional data sets to lower dimensions
for analysis[4]. PCA is the simplest and most useful of the
true eigenvector-based multivariate analyses, because its
operation is to reveal the internal structure of data in an
unbiased way.Normalize column vector corresponding to
larger Eigen value by dividing each element with mean of
Eigen vector. Those normalized Eigen vector values act as the
weight values and are multiplied with each pixel of input
image. Sum of the two scaled matrices are calculated and it
will be the fused image matrix.
Fig 1 : PCA algorithm
Principal Component Analysis Algorithm[6]
Generate the column vectors, respectively, from the
input image matrices.
International Journal of Engineering Research and Technology. ISSN 0974-3154 Volume 10, Number 1 (2017) © International Research Publication House http://www.irphouse.com
886
Calculate the covariance matrix of the two column
vectors formed in 1
The diagonal elements of the 2x2 covariance vector
would contain the variance of each column vector
with itself, respectively.
Calculate the Eigen values and the Eigen vectors of the covariance matrix
Normalize the column vector corresponding to the
larger Eigen value by dividing each element with
mean of the Eigen vector.
The values of the normalized Eigen vector act as the
weight values which are respectively multiplied with
each pixel of the input images.
Sum of the two scaled matrices calculated in 6 will
be the fused image matrix.
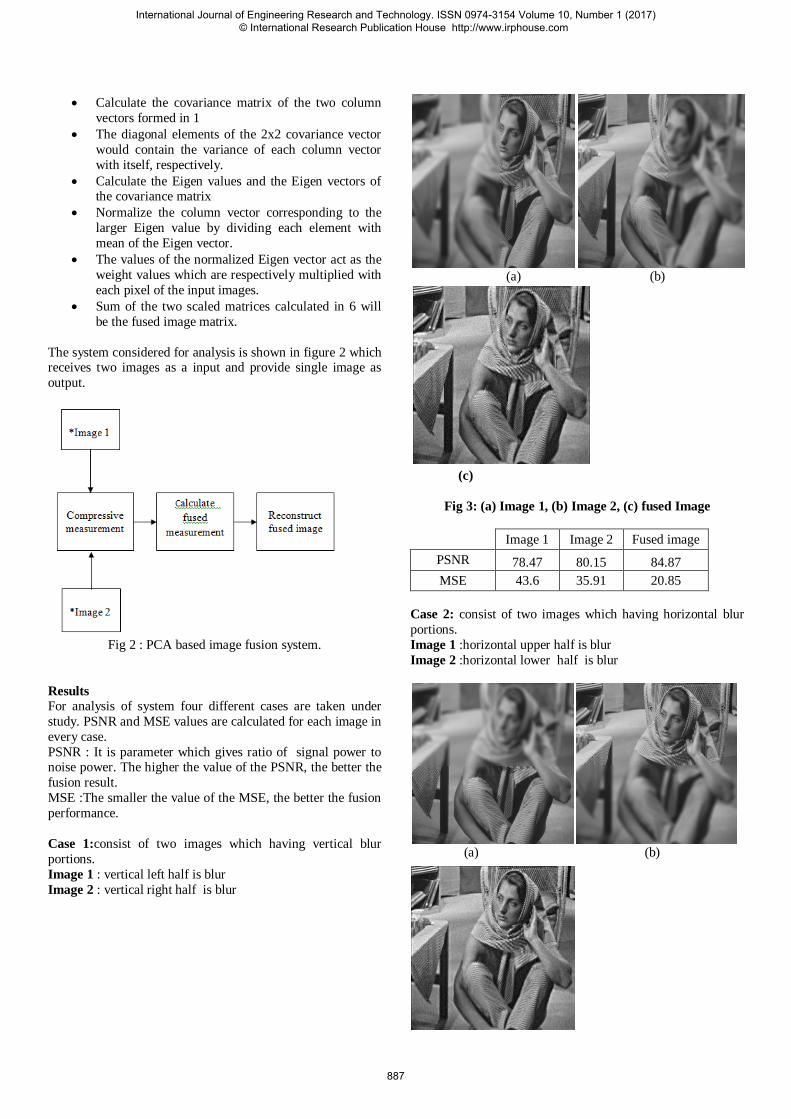
The system considered for analysis is shown in figure 2 which receives two images as a input and provide single image as
output.
Fig 2 : PCA based image fusion system.
Results For analysis of system four different cases are taken under
study. PSNR and MSE values are calculated for each image in
every case.
PSNR : It is parameter which gives ratio of signal power to noise power. The higher the value of the PSNR, the better the
fusion result.
MSE :The smaller the value of the MSE, the better the fusion
performance.
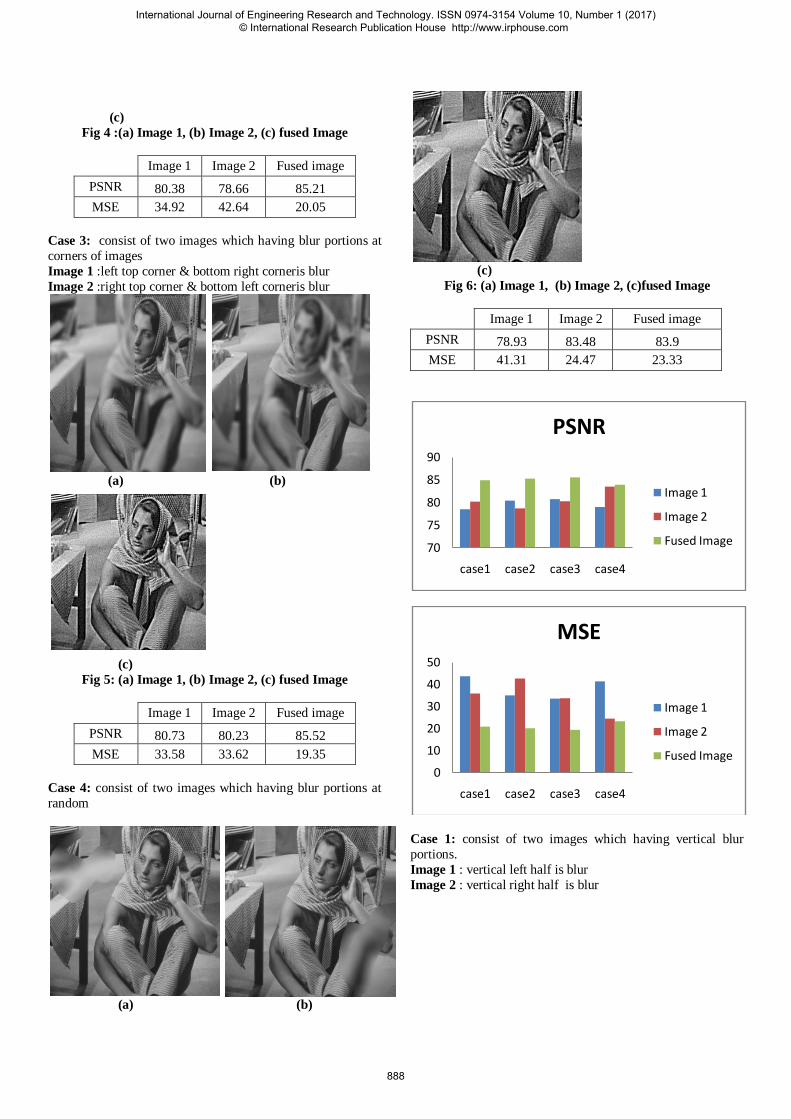
Case 1:consist of two images which having vertical blur
portions.
Image 1 : vertical left half is blur
Image 2 : vertical right half is blur
(a) (b)
(c)
Fig 3: (a) Image 1, (b) Image 2, (c) fused Image
Image 1 Image 2 Fused image
PSNR 78.47 80.15 84.87
MSE 43.6 35.91 20.85
Case 2: consist of two images which having horizontal blur
portions.
Image 1 :horizontal upper half is blur
Image 2 :horizontal lower half is blur
(a) (b)
International Journal of Engineering Research and Technology. ISSN 0974-3154 Volume 10, Number 1 (2017) © International Research Publication House http://www.irphouse.com
887
(c)
Fig 4 :(a) Image 1, (b) Image 2, (c) fused Image
Image 1 Image 2 Fused image
PSNR 80.38 78.66 85.21
MSE 34.92 42.64 20.05
Case 3: consist of two images which having blur portions at
corners of images
Image 1 :left top corner & bottom right corneris blur
Image 2 :right top corner & bottom left corneris blur
(a) (b)
(c)
Fig 5: (a) Image 1, (b) Image 2, (c) fused Image
Image 1 Image 2 Fused image
PSNR 80.73 80.23 85.52
MSE 33.58 33.62 19.35
Case 4: consist of two images which having blur portions at
random
(a) (b)
(c)
Fig 6: (a) Image 1, (b) Image 2, (c)fused Image
Image 1 Image 2 Fused image
PSNR 78.93 83.48 83.9
MSE 41.31 24.47 23.33
Case 1: consist of two images which having vertical blur
portions.
Image 1 : vertical left half is blur
Image 2 : vertical right half is blur
70
75
80
85
90
case1 case2 case3 case4
PSNR
Image 1
Image 2
Fused Image
0
10
20
30
40
50
case1 case2 case3 case4
MSE
Image 1
Image 2
Fused Image
International Journal of Engineering Research and Technology. ISSN 0974-3154 Volume 10, Number 1 (2017) © International Research Publication House http://www.irphouse.com
888
(a) (b)
(c)
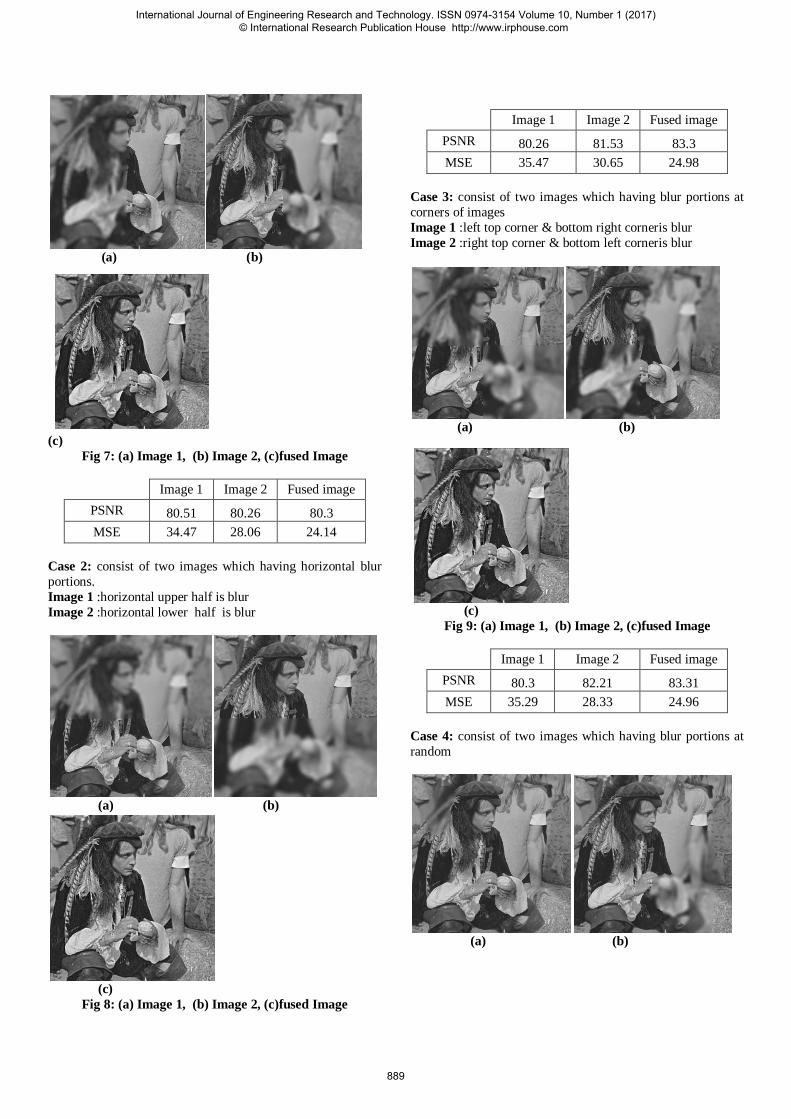
Fig 7: (a) Image 1, (b) Image 2, (c)fused Image
Image 1 Image 2 Fused image
PSNR 80.51 80.26 80.3
MSE 34.47 28.06 24.14
Case 2: consist of two images which having horizontal blur
portions.
Image 1 :horizontal upper half is blur
Image 2 :horizontal lower half is blur
(a) (b)
(c)
Fig 8: (a) Image 1, (b) Image 2, (c)fused Image
Image 1 Image 2 Fused image
PSNR 80.26 81.53 83.3
MSE 35.47 30.65 24.98
Case 3: consist of two images which having blur portions at
corners of images
Image 1 :left top corner & bottom right corneris blur
Image 2 :right top corner & bottom left corneris blur
(a) (b)
(c)
Fig 9: (a) Image 1, (b) Image 2, (c)fused Image
Image 1 Image 2 Fused image
PSNR 80.3 82.21 83.31
MSE 35.29 28.33 24.96
Case 4: consist of two images which having blur portions at
random
(a) (b)
International Journal of Engineering Research and Technology. ISSN 0974-3154 Volume 10, Number 1 (2017) © International Research Publication House http://www.irphouse.com
889
(c)
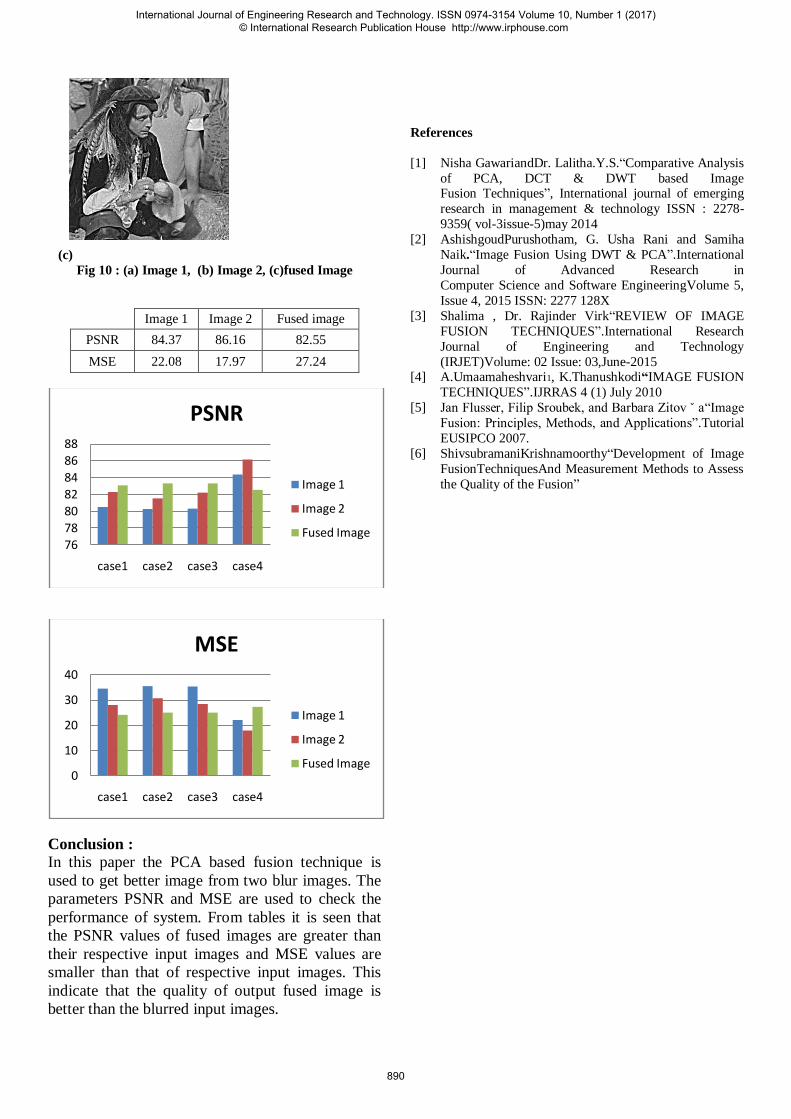
Fig 10 : (a) Image 1, (b) Image 2, (c)fused Image
Image 1 Image 2 Fused image
PSNR 84.37 86.16 82.55
MSE 22.08 17.97 27.24
Conclusion :
In this paper the PCA based fusion technique is
used to get better image from two blur images. The
parameters PSNR and MSE are used to check the
performance of system. From tables it is seen that
the PSNR values of fused images are greater than
their respective input images and MSE values are
smaller than that of respective input images. This
indicate that the quality of output fused image is
better than the blurred input images.
References
[1] Nisha GawariandDr. Lalitha.Y.S.“Comparative Analysis
of PCA, DCT & DWT based Image Fusion Techniques”, International journal of emerging
research in management & technology ISSN : 2278-
9359( vol-3issue-5)may 2014
[2] AshishgoudPurushotham, G. Usha Rani and Samiha
Naik.“Image Fusion Using DWT & PCA”.International
Journal of Advanced Research in
Computer Science and Software EngineeringVolume 5,
Issue 4, 2015 ISSN: 2277 128X
[3] Shalima , Dr. Rajinder Virk“REVIEW OF IMAGE
FUSION TECHNIQUES”.International Research
Journal of Engineering and Technology
(IRJET)Volume: 02 Issue: 03,June-2015 [4] A.Umaamaheshvari1, K.Thanushkodi“IMAGE FUSION
TECHNIQUES”.IJRRAS 4 (1) July 2010
[5] Jan Flusser, Filip Sroubek, and Barbara Zitov ˇ a“Image
Fusion: Principles, Methods, and Applications”.Tutorial
EUSIPCO 2007.
[6] ShivsubramaniKrishnamoorthy“Development of Image
FusionTechniquesAnd Measurement Methods to Assess
the Quality of the Fusion”
76
78
80
82
84
86
88
case1 case2 case3 case4
PSNR
Image 1
Image 2
Fused Image
0
10
20
30
40
case1 case2 case3 case4
MSE
Image 1
Image 2
Fused Image
International Journal of Engineering Research and Technology. ISSN 0974-3154 Volume 10, Number 1 (2017) © International Research Publication House http://www.irphouse.com
890


![Image Enhancement by Fusion in Contourlet Transform · 30 The first multiresolution based image fusion approach was proposed by Burt [6]. This implementation used a Laplacian pyramid](https://img.pdfslide.net/doc/110x75/5b5a51157f8b9a2d458b5d34/image-enhancement-by-fusion-in-contourlet-30-the-first-multiresolution-based.jpg)