Embed Size (px)
Citation preview
Image Retrieval and Perceptual Similarity
DIRK NEUMANN and KARL R. GEGENFURTNER
Justus Liebig University Giessen
Simple, low-level visual features are extensively used for content-based image retrieval. Our goal was to evaluate an image-
indexing system based on some of the known properties of the early stages of human vision. We quantitatively measured the
relationship between the similarity order induced by the indexes and perceived similarity. In contrast to previous evaluation
approaches, we objectively measured similarity both for the few best-matching images and also for relatively distinct images.
The results show that, to a large degree, the rank orders induced by the indexes predict the perceived similarity between images.
The highest index concordance employing a single index was obtained using the chromaticity histogram. Combining different
information sources substantially improved the correspondence with the observers. We conclude that image-indexing systems
can provide useful measures for perceptual image similarity. The methods presented here can be used to evaluate and compare
different image-retrieval systems.
Categories and Subject Descriptors: H.3.3 [Information Systems]: Information Storage and Retrieval—Retrieval models;
H.3.1 [Information Systems]: Content Analysis and Indexing—Indexing methods; J.4 [Social and Behavioral Sciences]—
Psychology
General Terms: Experimentation
Additional Key Words and Phrases: Color indexing, content-based image retrieval, Fourier spectrum, image search
1. INTRODUCTION
The goal of image-indexing systems is to find a set of images that is similar to the target image forwhich the user is searching. Depending on the intention of the user, similarity may be defined by objects,configuration, illumination, camera position or zoom, by semantic aspects, or any combination of theabove. Ideally, computer vision algorithms should extract all the relevant features from the imagein the same way as a human observer. While there has been tremendous progress in recent years[Rui et al. 1999], it is quite clear that this ultimate goal is far beyond our current knowledge of humanvision, cognition, and emotion. Here we present a paradigm useful for the evaluation of different image-indexing systems. We construct a relatively simple image-indexing system based on some of the knownproperties of visual perception and show that such systems can provide measures of visual similaritythat correlate highly with human judgments.
Most current algorithms are quite successful in using low-level features of the images. Color, inparticular, has proved to be very effective for the calculation of image similarity, since an object’s coloris, to a large degree, independent of viewing position or viewing distance. The most prominent color
This work was supported by the Deutsche Forschungsgemeinschaft grant DFG Ge/879.
Authors’ addresses: (Present address) Dirk Neumann, California Institute of Technology, Pasadena, California 91125. Karl
Gegenfurtner, Department of Psychology, Giessen University, Otto-Behaghel-Str. 10, 35394 Giessen, Germany.
Permission to make digital or hard copies of part or all of this work for personal or classroom use is granted without fee provided
that copies are not made or distributed for profit or direct commercial advantage and that copies show this notice on the first
page or initial screen of a display along with the full citation. Copyrights for components of this work owned by others than ACM
must be honored. Abstracting with credit is permitted. To copy otherwise, to republish, to post on servers, to redistribute to lists,
or to use any component of this work in other works requires prior specific permission and/or a fee. Permissions may be requested
from Publications Dept., ACM, Inc., 1515 Broadway, New York, NY 10036 USA, fax: +1 (212) 869-0481, or [email protected].
c© 2006 ACM 1544-3558/06/0100-0031 $5.00
ACM Transactions on Applied Perception, Vol. 3, No. 1, January 2006, Pages 31–47.
32 • D. Neumann and K. R. Gegenfurtner
statistics are histograms with equally sized bins in RGB or HSI color space. In HSI space, the luminance(intensity) axis is often ignored, since it is argued that the overall brightness of an image is irrelevantwith respect to image similarity. Hence, luminance-independent indexes should be more robust withrespect to different illumination conditions. Other color statistics include correlation or covariancecoefficients encoding spatial information about the color distribution [e.g. Huang et al. 1999; Strickerand Dimai 1997]. Features such as texture and shape are other subjects of current research [e.g. Flickneret al. 1995]. The combination of multiple features has received much attention in recent years. Iqbaland Aggarwal [2002] combine linguistic color labels and a Gabor texture index for image-indexing.Rui et al. [1998] combine color, texture, and shape information and use the user’s feedback about therelevance of the search results to update the weighting of the histograms.
All these approaches are based on physical, low-level features. However, in the end, the similarity of agiven image with a target image will always be judged by a human observer. Therefore, we wanted to testwhether the output of such image-indexing systems does correlate with perceptual similarity measures.Until now, the success of indexing algorithms has mostly been judged by the experimenters or thedesigners of the algorithms. In contrast, we use a strictly quantitative and objective approach to evaluateperceived image similarity, by obtaining forced choice judgments from a group of naive observers. Weshow that our method leads to consistent results and can be used to compare the effectiveness ofdifferent indexes.
For our image-indexing system, we used a representation of color and spatial frequency, similar to theone implemented in the primate visual system. Our color index is based on the opponent color processesknown to be implemented in the color opponent retinal ganglion cells of primates. Our spatial index isbased on multiresolution, multiorientation frequency filters, similar to the ones implemented by simpleand complex cells in primary visual cortex.
This procedure provides us with a “plain vanilla” image-indexing system, which we can then use toevaluate its performance. Most of the earlier systems were evaluated informally. The prevalent methodis to have the experimenter decide which images found by the algorithm are similar to the queryimage. As Cox et al. [2000] criticize, the results obtained by such methods are highly dependent on thestrictness of the similarity criteria the observers use, the homogeneity of the images in the database,and the number of images displayed. In any case, it is fairly obvious that such evaluation criteria cannotbe used to compare different systems.
A different approach is used by so called relevance feedback systems, where the human user is partof the loop. The human observer interacts with the computer to optimize retrieval performance [Saltonand Buckley 1990; Rui et al. 1998; Cox et al. 2000]. However, such fine tuning to an individual observeris not always possible and it would be useful to find criteria that allow performance evaluation for arepresentative sample of users. This is the goal of the work presented here.
Of course, no single algorithm will work ideally for all observers. A certain image can mean manydifferent things to different observers. Image analysis based on low-level features will probably never beable to predict human emotional responses to emotionally charged images, such as the ones containedin the International Affective Pictures System (IAPS) set [see, for example, Maljkovic and Martini2005]. However, one can still try to predict average perceived similarity from image content. Work byRogowitz et al. [1998] and Oliva and Torralba [2001] has shown that low-level image features are oftensimilar for images belonging to different semantic categories.
An interesting alternative should be noted here, which avoids the topic of subjective similarity alltogether. Li et al. [2003] propose a “perceptual distance function for measuring image similarity” thatis entirely independent of any human observers. They take images of objects and apply a group oftransformations (translation, rotation, etc.) that human perception is known to be invariant. Then theydesign nonlinear functions on a large set of low-level features. Their ultimate goal is to retrieve as many
ACM Transactions on Applied Perception, Vol. 3, No. 1, January 2006.
Image Retrieval and Perceptual Similarity • 33
of the transformed images as possible. While their results appear to be quite impressive, it has to bekept in mind that their concept of similarity is far narrower than the one we investigate here.
We evaluated our indexing system by comparing the similarity judgments made by the algorithm tojudgments made by human observers. Unlike Rogowitz et al. [1998] who calculated a similarity metricfor a set of 96 images with a multidimensional scaling technique, we measured similarity directly. Bylooking at the degree with which the algorithm correlates with judgments of the observers, we canestimate how much the different features (indexes) contribute.
In three experiments, we measured the relationship between judgments of perceived similarity andthe computed similarity distance over a broad range of images. The similarity of images was variedfrom highly similar best matches to relatively distinct images with rank 2000 in the result list.
In the first experiment, we investigated the influence of the degree of similarity between the testimages on the similarity judgments. In the second experiment, the three indexes were compared to eachother to determine their individual contributions. In the third experiment, the indexes were combinediteratively to measure the improvement in prediction when color, spatial, and luminance informationare considered.
In brief, we found good agreement between the images selected with the perception-based indexesand the perceived similarity. The observers’ judgments can be best predicted with the chromaticityhistogram. The luminance and the Fourier histogram both contribute to the similarity judgments andthe percentage of agreement increases considerably if the luminance and the Fourier information arecombined with the chromaticity index. We found that the percentage of agreement decreases linearlyas a function of the logarithmic rank position, from the first, best-matching image up to the 2000thimage in the result list. The correlation was found for each of the three indexes and for the indexcombinations. While there are certainly better image retrieval systems available in the literature, ourparadigm provides an objective and simple way to evaluate and compare these systems.
2. COLOR AND SPATIAL INDEX
Ideally, content-based image retrieval (CBIR) systems should be modeled with respect to the users andreturn images in good agreement with the perceived similarity. Simple color and texture histogramscapture important aspects of the perceived similarity and we here pursue a straightforward variantof the histogram approach. For the construction of the color and texture histogram, we employ estab-lished coding principles of human vision. Two color histograms were constructed in the color-opponentspace of retinal ganglion and LGN cells (DKL) [Derrington et al. 1984]. The texture information wasstored analogous to the local orientation selective simple cells in the primary visual cortex using atwo-dimensional discrete Fourier transform.
2.1 Early Vision for Color
At the first step of seeing, light is absorbed and converted into neural signals by the three differentclasses of cone photoreceptors in the retina. This initial stage of processing is well-understood and theexact shape of the absorption spectra of the cones are now known quite precisely. While the cones areoften called red, green, and blue cones, they all absorb light over a wide range of the visible spectrum.Most notably, the representation of color in the cones is quite different from the RGB triplets of modernimage sensors. Although the transformation converting between the two color spaces is nonlinear, itcan be approximated linearly. Any such conversion process requires careful calibration of the image-acquisition device [Wandell 1993].
Still, at the level of the retina, the signals from the cones get transformed by a complex network ofretinal cells into color opponent signals [Wassle and Boycott 1991]. Electrical recordings from singleneurons in the retina and the lateral geniculate nucleus (LGN) have shown three different classes of
ACM Transactions on Applied Perception, Vol. 3, No. 1, January 2006.
34 • D. Neumann and K. R. Gegenfurtner
neurons. A “luminance-type” neuron simply takes the sum of the outputs from all three cone classes.“Red–green” opponent neurons take the difference between the red- and the green-cone signal. “Blue-yellow” opponent neurons take the difference between the blue-cone signal and the sum of the red-and green-cone signal [Gegenfurtner and Kiper 2003]. This basically results in a principal componentsanalysis of the cone signals [Buchsbaum and Gottschalk 1983; Ruderman et al. 1998] and thus removesany correlation between the signal channels, resulting in nearly optimal information transmission fromthe eye to the brain. Note that these color opponent signals are quite different from the ones proposedby Hering [1964] and Hurvich and Jameson [1957], which form the basis of the widely used HSI space.
Since color information, in the end, gets represented in the human brain as a small number of differenthue categories, it seems much better, at first, to simply use these categories in a color index. However,the assignment of RGB values to categories is not constant, but changes dependent on the distributionof colors in a scene, which is, to a large degree, dependent on the illuminant. Since human observers can“discount” the illuminant [D’Zmura and Lennie 1986], any computer vision algorithm would have toimplement the same degree of color constancy. We chose to use a luminance-independent color opponentspace and chose our categories, such that the bins would roughly contain equally discriminable rangesof colors.
It was mentioned in the introduction that there is no simple transform to convert RGB triplets intohuman cone photoreceptor excitations. However, these receptor excitations are necessary to calculatethe DKL cone-opponent coordinates of the colors. We circumvented this problem by using the photore-ceptor excitations resulting from the display of the images on a standardized and calibrated displaymonitor (Sony GDM-F500). Since our observers made their judgments looking at the images displayedon that monitor, it is correct to use these excitations as the basis for the similarity metric.
A first color index encodes only chromaticity and is, therefore, luminance independent. The secondindex encodes the mean luminance of the color tones. For the color bins, we used bin sizes reflecting thegranularity of higher-order color perception. For example, for saturated colors, the resolution for hue ismuch finer than it is for unsaturated colors while the resolution of saturation decreases, in agreementwith the results of Krauskopf and Gegenfurtner [1992], who also showed that the increase of thresholdsfor detecting colors along one cardinal axis is independent from the other cardinal axis. Therefore, thiscode will lead to a highly efficient representation that ensures that colors within the same bin are nearlyindistinguishable, while, at the same time, minimizing the number of bins. However, it is quite likelythat other color representations will lead to results similar to the ones presented here.
2.2 Color Histograms
To create the two color histograms, we converted all images into the DKL color space that is spanned bytwo orthogonal color-opponent axes and luminance. The resulting color distribution can be visualizedby plotting the pixels of the image with respect to their coordinates on the red–green and yellow–bluecolor axis. In Figure 1a, the pixels of the images with the hats (at the bottom left of the chart) wereplotted according to their color-opponent coordinates. The pixels of the differently colored hats fall intoseparate radial sections. The Cartesian color-opponent values were then transformed into the polarcoordinates hue and saturation and this cylindrical space was used to define the histogram bins.
The color histograms were created by dividing the chromaticity plane into logarithmic-radial seg-ments (Figure 1b). The resolution for saturation of these bins decreases with increasing saturation.Six different rings were used to discriminate saturation; the remaining unsaturated color tones in thecenter were averaged into a single, gray bin. The ring r, to which a color tone belongs, was calculatedby the logarithm of the saturation s: r = �− log 2 s�. The histogram’s hue resolution nr is lowest forunsaturated, gray colors and doubles with increasing saturation: nr = 2 �6−r�. This yields 127 bins—64 bins for the most saturated colors. Color values exceeding 95% or falling below 5% of the maximally
ACM Transactions on Applied Perception, Vol. 3, No. 1, January 2006.
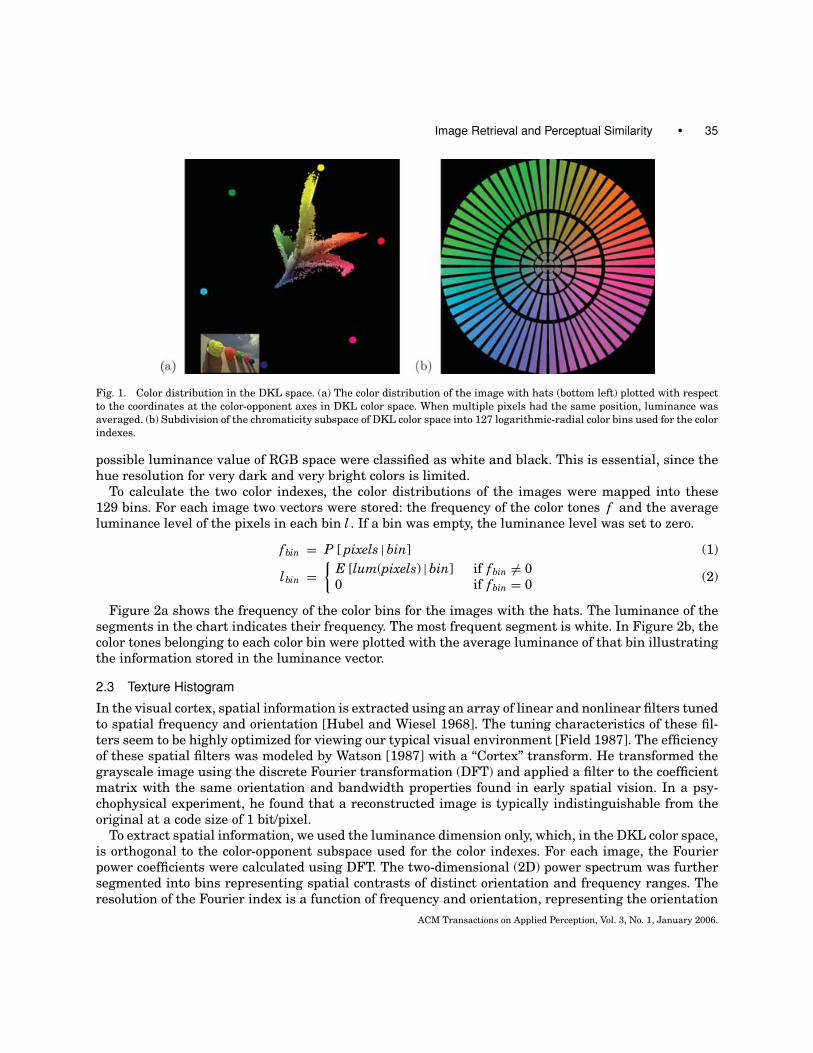
Image Retrieval and Perceptual Similarity • 35
Fig. 1. Color distribution in the DKL space. (a) The color distribution of the image with hats (bottom left) plotted with respect
to the coordinates at the color-opponent axes in DKL color space. When multiple pixels had the same position, luminance was
averaged. (b) Subdivision of the chromaticity subspace of DKL color space into 127 logarithmic-radial color bins used for the color
indexes.
possible luminance value of RGB space were classified as white and black. This is essential, since thehue resolution for very dark and very bright colors is limited.
To calculate the two color indexes, the color distributions of the images were mapped into these129 bins. For each image two vectors were stored: the frequency of the color tones f and the averageluminance level of the pixels in each bin l . If a bin was empty, the luminance level was set to zero.
fbin = P [ pixels | bin] (1)
lbin ={
E [lum(pixels) | bin] if fbin �= 00 if fbin = 0
(2)
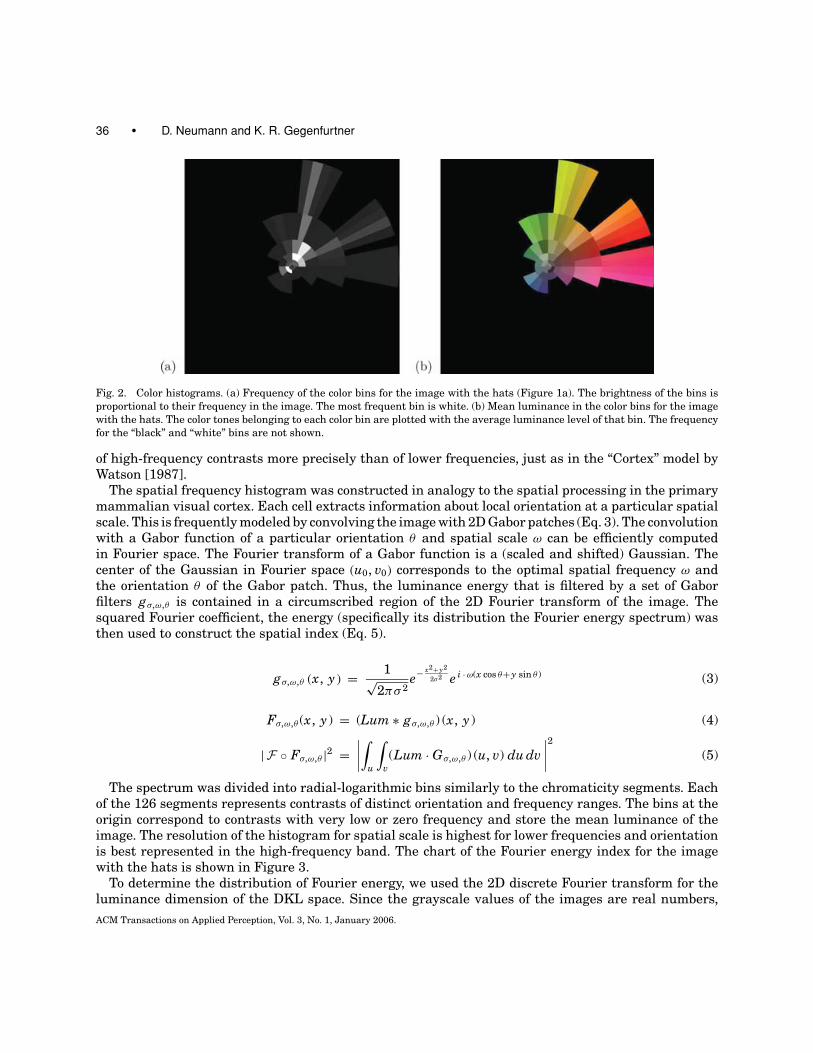
Figure 2a shows the frequency of the color bins for the images with the hats. The luminance of thesegments in the chart indicates their frequency. The most frequent segment is white. In Figure 2b, thecolor tones belonging to each color bin were plotted with the average luminance of that bin illustratingthe information stored in the luminance vector.
2.3 Texture Histogram
In the visual cortex, spatial information is extracted using an array of linear and nonlinear filters tunedto spatial frequency and orientation [Hubel and Wiesel 1968]. The tuning characteristics of these fil-ters seem to be highly optimized for viewing our typical visual environment [Field 1987]. The efficiencyof these spatial filters was modeled by Watson [1987] with a “Cortex” transform. He transformed thegrayscale image using the discrete Fourier transformation (DFT) and applied a filter to the coefficientmatrix with the same orientation and bandwidth properties found in early spatial vision. In a psy-chophysical experiment, he found that a reconstructed image is typically indistinguishable from theoriginal at a code size of 1 bit/pixel.
To extract spatial information, we used the luminance dimension only, which, in the DKL color space,is orthogonal to the color-opponent subspace used for the color indexes. For each image, the Fourierpower coefficients were calculated using DFT. The two-dimensional (2D) power spectrum was furthersegmented into bins representing spatial contrasts of distinct orientation and frequency ranges. Theresolution of the Fourier index is a function of frequency and orientation, representing the orientation
ACM Transactions on Applied Perception, Vol. 3, No. 1, January 2006.
36 • D. Neumann and K. R. Gegenfurtner
Fig. 2. Color histograms. (a) Frequency of the color bins for the image with the hats (Figure 1a). The brightness of the bins is
proportional to their frequency in the image. The most frequent bin is white. (b) Mean luminance in the color bins for the image
with the hats. The color tones belonging to each color bin are plotted with the average luminance level of that bin. The frequency
for the “black” and “white” bins are not shown.
of high-frequency contrasts more precisely than of lower frequencies, just as in the “Cortex” model byWatson [1987].
The spatial frequency histogram was constructed in analogy to the spatial processing in the primarymammalian visual cortex. Each cell extracts information about local orientation at a particular spatialscale. This is frequently modeled by convolving the image with 2D Gabor patches (Eq. 3). The convolutionwith a Gabor function of a particular orientation θ and spatial scale ω can be efficiently computedin Fourier space. The Fourier transform of a Gabor function is a (scaled and shifted) Gaussian. Thecenter of the Gaussian in Fourier space (u0, v0) corresponds to the optimal spatial frequency ω andthe orientation θ of the Gabor patch. Thus, the luminance energy that is filtered by a set of Gaborfilters gσ,ω,θ is contained in a circumscribed region of the 2D Fourier transform of the image. Thesquared Fourier coefficient, the energy (specifically its distribution the Fourier energy spectrum) wasthen used to construct the spatial index (Eq. 5).
gσ,ω,θ (x, y) = 1√2πσ 2
e− x2+ y2
2σ2 e i · ω(x cos θ+ y sin θ ) (3)
Fσ,ω,θ (x, y) = (Lum ∗ gσ,ω,θ ) (x, y) (4)
|F ◦ Fσ,ω,θ |2 =∣∣∣∣∫
u
∫v(Lum · Gσ,ω,θ ) (u, v) du dv
∣∣∣∣2 (5)
The spectrum was divided into radial-logarithmic bins similarly to the chromaticity segments. Eachof the 126 segments represents contrasts of distinct orientation and frequency ranges. The bins at theorigin correspond to contrasts with very low or zero frequency and store the mean luminance of theimage. The resolution of the histogram for spatial scale is highest for lower frequencies and orientationis best represented in the high-frequency band. The chart of the Fourier energy index for the imagewith the hats is shown in Figure 3.
To determine the distribution of Fourier energy, we used the 2D discrete Fourier transform for theluminance dimension of the DKL space. Since the grayscale values of the images are real numbers,
ACM Transactions on Applied Perception, Vol. 3, No. 1, January 2006.
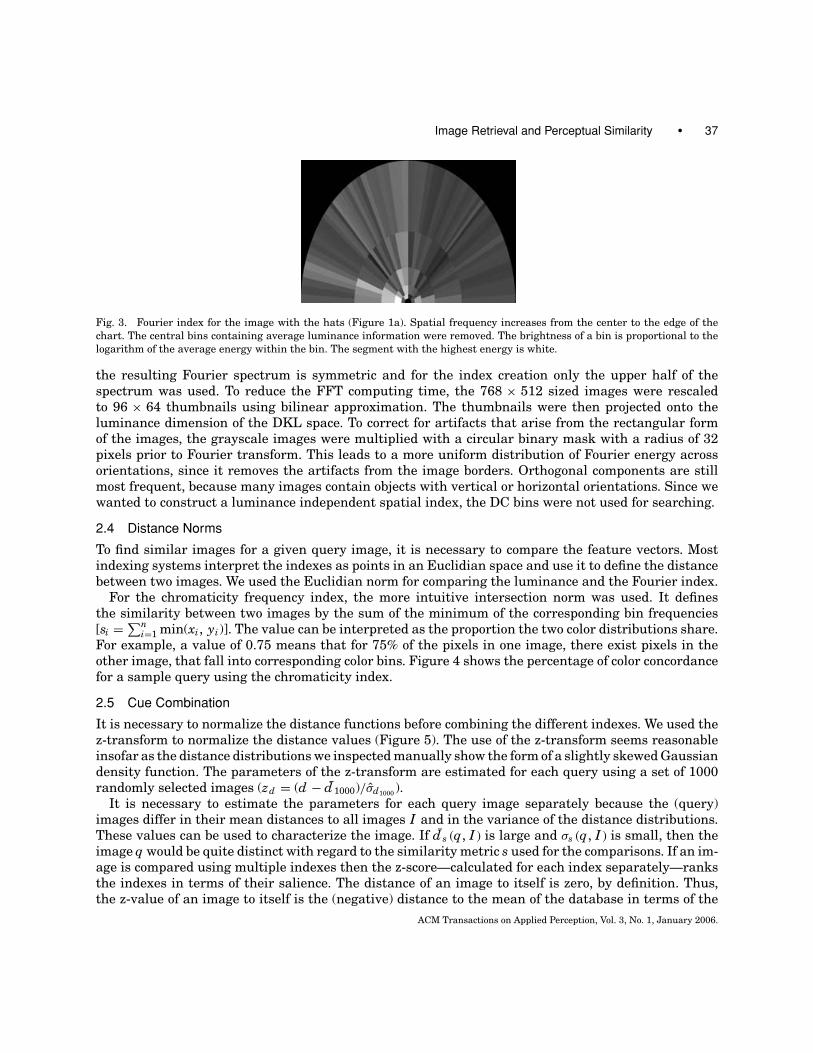
Image Retrieval and Perceptual Similarity • 37
Fig. 3. Fourier index for the image with the hats (Figure 1a). Spatial frequency increases from the center to the edge of the
chart. The central bins containing average luminance information were removed. The brightness of a bin is proportional to the
logarithm of the average energy within the bin. The segment with the highest energy is white.
the resulting Fourier spectrum is symmetric and for the index creation only the upper half of thespectrum was used. To reduce the FFT computing time, the 768 × 512 sized images were rescaledto 96 × 64 thumbnails using bilinear approximation. The thumbnails were then projected onto theluminance dimension of the DKL space. To correct for artifacts that arise from the rectangular formof the images, the grayscale images were multiplied with a circular binary mask with a radius of 32pixels prior to Fourier transform. This leads to a more uniform distribution of Fourier energy acrossorientations, since it removes the artifacts from the image borders. Orthogonal components are stillmost frequent, because many images contain objects with vertical or horizontal orientations. Since wewanted to construct a luminance independent spatial index, the DC bins were not used for searching.
2.4 Distance Norms
To find similar images for a given query image, it is necessary to compare the feature vectors. Mostindexing systems interpret the indexes as points in an Euclidian space and use it to define the distancebetween two images. We used the Euclidian norm for comparing the luminance and the Fourier index.
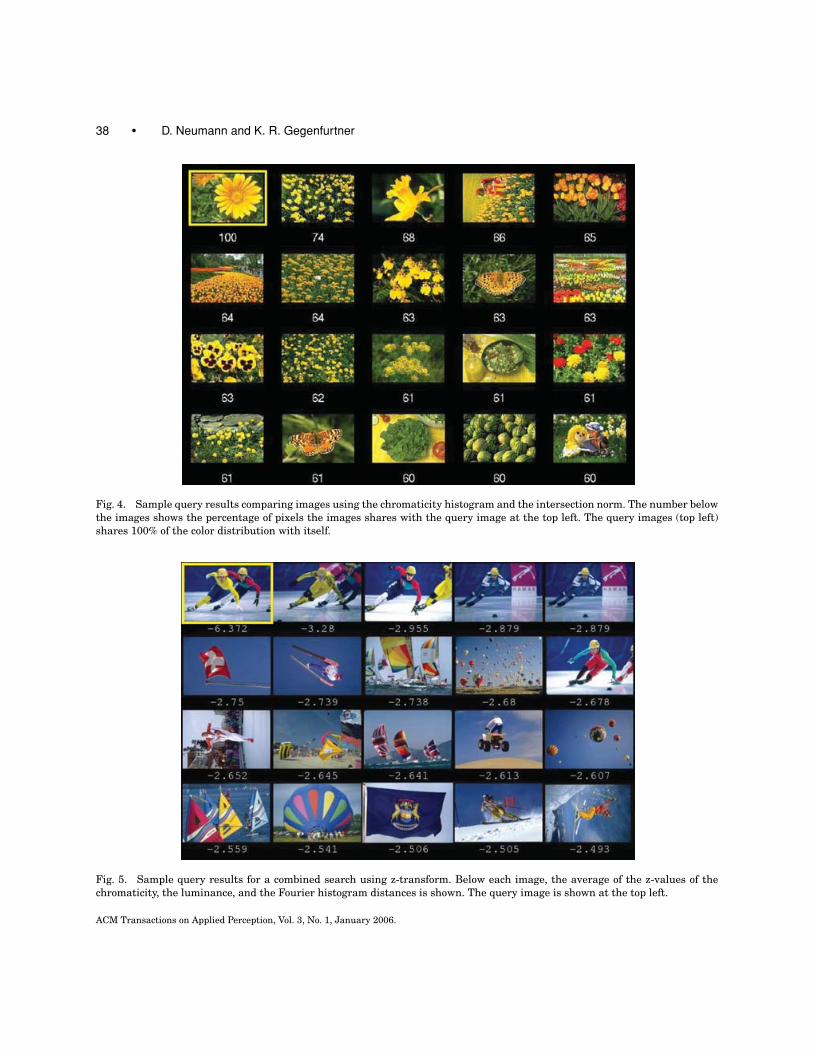
For the chromaticity frequency index, the more intuitive intersection norm was used. It definesthe similarity between two images by the sum of the minimum of the corresponding bin frequencies[si = ∑n
i=1 min(xi, yi)]. The value can be interpreted as the proportion the two color distributions share.For example, a value of 0.75 means that for 75% of the pixels in one image, there exist pixels in theother image, that fall into corresponding color bins. Figure 4 shows the percentage of color concordancefor a sample query using the chromaticity index.
2.5 Cue Combination
It is necessary to normalize the distance functions before combining the different indexes. We used thez-transform to normalize the distance values (Figure 5). The use of the z-transform seems reasonableinsofar as the distance distributions we inspected manually show the form of a slightly skewed Gaussiandensity function. The parameters of the z-transform are estimated for each query using a set of 1000randomly selected images (zd = (d − d1000)/σd1000
).It is necessary to estimate the parameters for each query image separately because the (query)
images differ in their mean distances to all images I and in the variance of the distance distributions.These values can be used to characterize the image. If d s (q, I ) is large and σs (q, I ) is small, then theimage q would be quite distinct with regard to the similarity metric s used for the comparisons. If an im-age is compared using multiple indexes then the z-score—calculated for each index separately—ranksthe indexes in terms of their salience. The distance of an image to itself is zero, by definition. Thus,the z-value of an image to itself is the (negative) distance to the mean of the database in terms of the
ACM Transactions on Applied Perception, Vol. 3, No. 1, January 2006.
38 • D. Neumann and K. R. Gegenfurtner
Fig. 4. Sample query results comparing images using the chromaticity histogram and the intersection norm. The number below
the images shows the percentage of pixels the images shares with the query image at the top left. The query images (top left)
shares 100% of the color distribution with itself.
Fig. 5. Sample query results for a combined search using z-transform. Below each image, the average of the z-values of the
chromaticity, the luminance, and the Fourier histogram distances is shown. The query image is shown at the top left.
ACM Transactions on Applied Perception, Vol. 3, No. 1, January 2006.
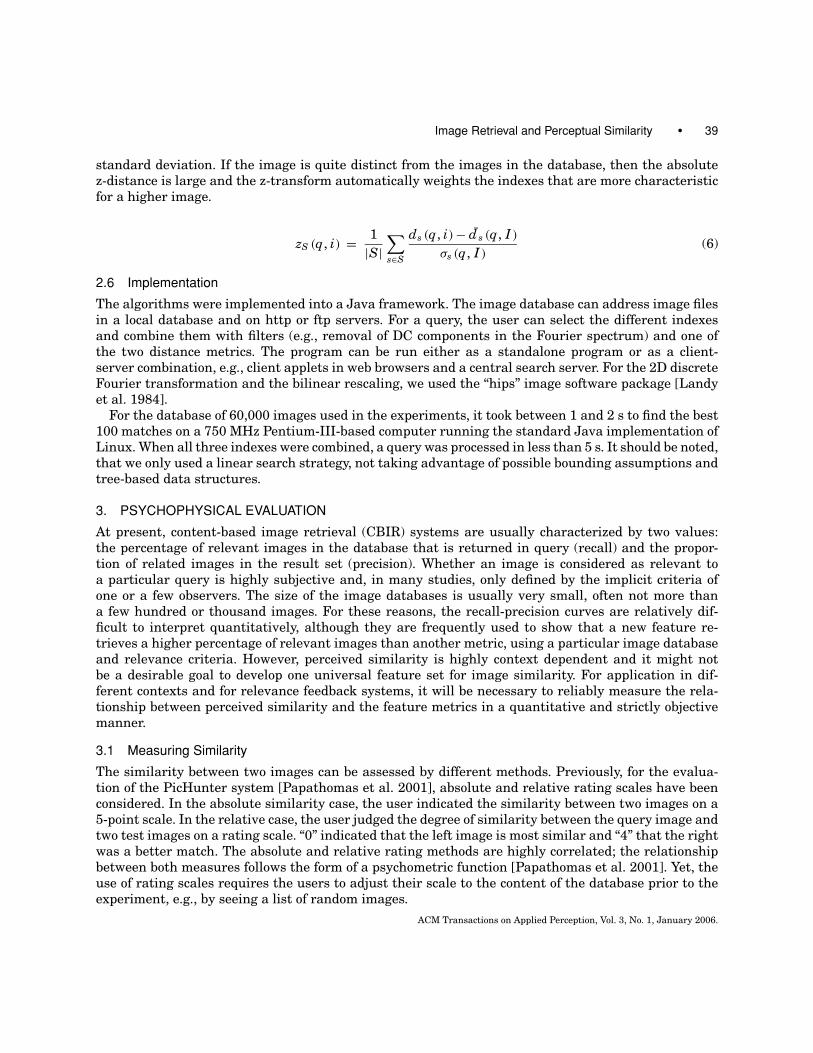
Image Retrieval and Perceptual Similarity • 39
standard deviation. If the image is quite distinct from the images in the database, then the absolutez-distance is large and the z-transform automatically weights the indexes that are more characteristicfor a higher image.
zS (q, i) = 1
|S|∑s∈S
ds (q, i) − d s (q, I )
σs (q, I )(6)
2.6 Implementation
The algorithms were implemented into a Java framework. The image database can address image filesin a local database and on http or ftp servers. For a query, the user can select the different indexesand combine them with filters (e.g., removal of DC components in the Fourier spectrum) and one ofthe two distance metrics. The program can be run either as a standalone program or as a client-server combination, e.g., client applets in web browsers and a central search server. For the 2D discreteFourier transformation and the bilinear rescaling, we used the “hips” image software package [Landyet al. 1984].
For the database of 60,000 images used in the experiments, it took between 1 and 2 s to find the best100 matches on a 750 MHz Pentium-III-based computer running the standard Java implementation ofLinux. When all three indexes were combined, a query was processed in less than 5 s. It should be noted,that we only used a linear search strategy, not taking advantage of possible bounding assumptions andtree-based data structures.
3. PSYCHOPHYSICAL EVALUATION
At present, content-based image retrieval (CBIR) systems are usually characterized by two values:the percentage of relevant images in the database that is returned in query (recall) and the propor-tion of related images in the result set (precision). Whether an image is considered as relevant toa particular query is highly subjective and, in many studies, only defined by the implicit criteria ofone or a few observers. The size of the image databases is usually very small, often not more thana few hundred or thousand images. For these reasons, the recall-precision curves are relatively dif-ficult to interpret quantitatively, although they are frequently used to show that a new feature re-trieves a higher percentage of relevant images than another metric, using a particular image databaseand relevance criteria. However, perceived similarity is highly context dependent and it might notbe a desirable goal to develop one universal feature set for image similarity. For application in dif-ferent contexts and for relevance feedback systems, it will be necessary to reliably measure the rela-tionship between perceived similarity and the feature metrics in a quantitative and strictly objectivemanner.
3.1 Measuring Similarity
The similarity between two images can be assessed by different methods. Previously, for the evalua-tion of the PicHunter system [Papathomas et al. 2001], absolute and relative rating scales have beenconsidered. In the absolute similarity case, the user indicated the similarity between two images on a5-point scale. In the relative case, the user judged the degree of similarity between the query image andtwo test images on a rating scale. “0” indicated that the left image is most similar and “4” that the rightwas a better match. The absolute and relative rating methods are highly correlated; the relationshipbetween both measures follows the form of a psychometric function [Papathomas et al. 2001]. Yet, theuse of rating scales requires the users to adjust their scale to the content of the database prior to theexperiment, e.g., by seeing a list of random images.
ACM Transactions on Applied Perception, Vol. 3, No. 1, January 2006.
40 • D. Neumann and K. R. Gegenfurtner
Fig. 6. 2AFC display used in the experiments. At the top, the query image is show; below are two test images (target and
distractor positions were randomized).
A simpler method is the two-alternative forced-choice (2AFC) design. We used a configuration withthree images: the query image at the top together with two test images below (Figure 6). The subjectswere asked to compare the similarity of the test images with the query image and to select the imagethat is more similar. We defined the similarity between the query image and a target image p (q, i) asthe probability of preferring the image i. For a given query image q, the image i can be chosen to beeither relatively similar or quite dissimilar to q. If the similarity metric s corresponds to the observers’,then varying the computed degree of similarity s (q, i) should have an influence on the selection rate. Forweak indexing approaches, however, the observed correlation would be low. The relationship betweenthe computed similarity s (q, i) and the rate of preferring the image p (q, i) can, therefore, be used toevaluate the similarity metric.
The 2AFC design has several advantages over the classical evaluation approaches. First, it is ob-jective and independent of any criteria the observer has to apply in yes/no or rating tasks. We didnot instruct the subjects to use any particular comparison criteria. Choosing one of the two imagesthat is more similar was generally considered an easy task and most subjects finished the 900 com-parisons in about 45 min, at a self-paced rate of about 3 s per image. Second, the 2AFC design allowsthe manipulation of the relative similarity between the images. The two test images can be eitherchosen to be relatively similar, or one or both could be relatively distinct from the query images. Cur-rently most similarity measures are only evaluated for the first best-matched images using precisioninformation. However, little is known whether histogram-based indexing can be used to compare thesimilarity of relatively distinct images. In the experiments, we varied the similarity between the targetand the query images over a broad range, from best matches to rank 2000. Third, the results relatethe similarity norm to a probability. The results could be directly incorporated into Bayes models of theuser [Cox et al. 2000] and relevance feedback systems. Most systems use arbitrary functions for thispurpose.
We evaluated our system in three experiments. In the first, the evaluation procedure itself wasvalidated. One image, the target image, had either rank 1, 2, 20, 200, 2000, or was random. The otherimage, the distractor image, was chosen to be either very similar (rank 1), moderately similar (rank2000), or random. For the three distractor conditions, the functional relationship between the similarityrank and the observers’ judgment was measured.
In a second experiment, the three indexes were compared. The indexes store distinct information:the chromaticity histogram encodes the frequency of the color bins, the luminance histograms storesaverage luminance levels, and both color histograms do not contain spatial information. From theFourier index, the bins containing average luminance information were removed. Therefore, it onlystores information about orientation and spatial frequency. We wanted to know which index would be
ACM Transactions on Applied Perception, Vol. 3, No. 1, January 2006.
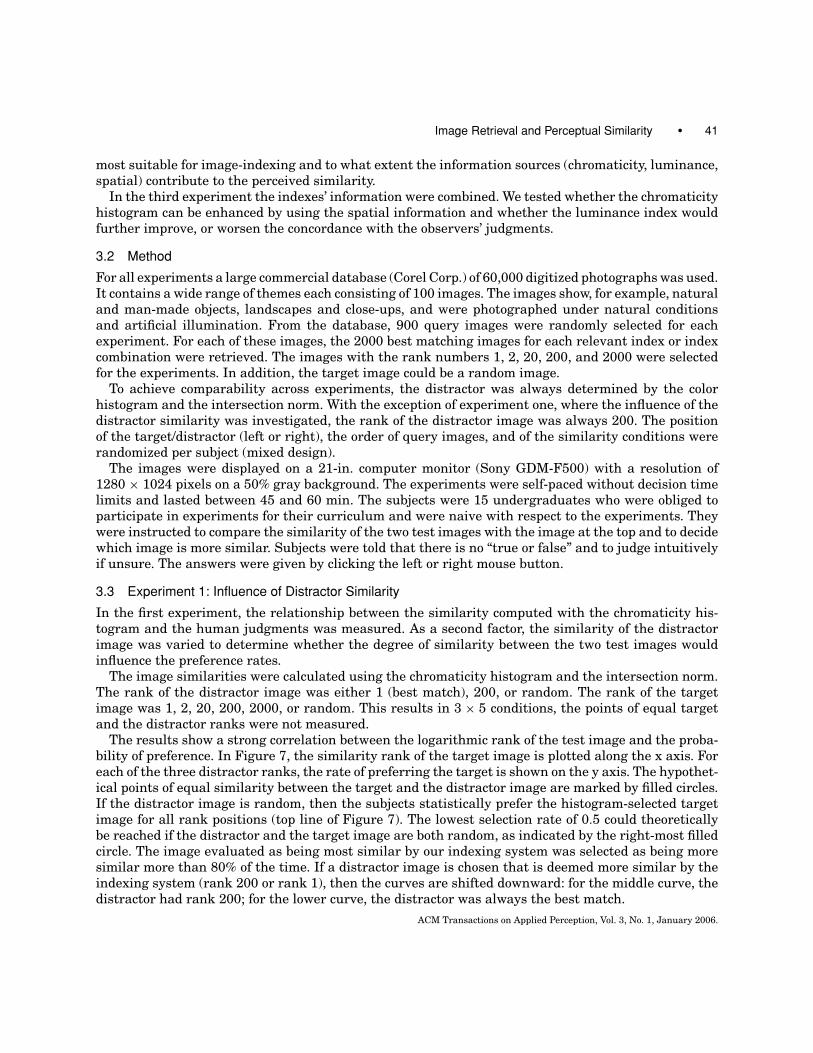
Image Retrieval and Perceptual Similarity • 41
most suitable for image-indexing and to what extent the information sources (chromaticity, luminance,spatial) contribute to the perceived similarity.
In the third experiment the indexes’ information were combined. We tested whether the chromaticityhistogram can be enhanced by using the spatial information and whether the luminance index wouldfurther improve, or worsen the concordance with the observers’ judgments.
3.2 Method
For all experiments a large commercial database (Corel Corp.) of 60,000 digitized photographs was used.It contains a wide range of themes each consisting of 100 images. The images show, for example, naturaland man-made objects, landscapes and close-ups, and were photographed under natural conditionsand artificial illumination. From the database, 900 query images were randomly selected for eachexperiment. For each of these images, the 2000 best matching images for each relevant index or indexcombination were retrieved. The images with the rank numbers 1, 2, 20, 200, and 2000 were selectedfor the experiments. In addition, the target image could be a random image.
To achieve comparability across experiments, the distractor was always determined by the colorhistogram and the intersection norm. With the exception of experiment one, where the influence of thedistractor similarity was investigated, the rank of the distractor image was always 200. The positionof the target/distractor (left or right), the order of query images, and of the similarity conditions wererandomized per subject (mixed design).
The images were displayed on a 21-in. computer monitor (Sony GDM-F500) with a resolution of1280 × 1024 pixels on a 50% gray background. The experiments were self-paced without decision timelimits and lasted between 45 and 60 min. The subjects were 15 undergraduates who were obliged toparticipate in experiments for their curriculum and were naive with respect to the experiments. Theywere instructed to compare the similarity of the two test images with the image at the top and to decidewhich image is more similar. Subjects were told that there is no “true or false” and to judge intuitivelyif unsure. The answers were given by clicking the left or right mouse button.
3.3 Experiment 1: Influence of Distractor Similarity
In the first experiment, the relationship between the similarity computed with the chromaticity his-togram and the human judgments was measured. As a second factor, the similarity of the distractorimage was varied to determine whether the degree of similarity between the two test images wouldinfluence the preference rates.
The image similarities were calculated using the chromaticity histogram and the intersection norm.The rank of the distractor image was either 1 (best match), 200, or random. The rank of the targetimage was 1, 2, 20, 200, 2000, or random. This results in 3 × 5 conditions, the points of equal targetand the distractor ranks were not measured.
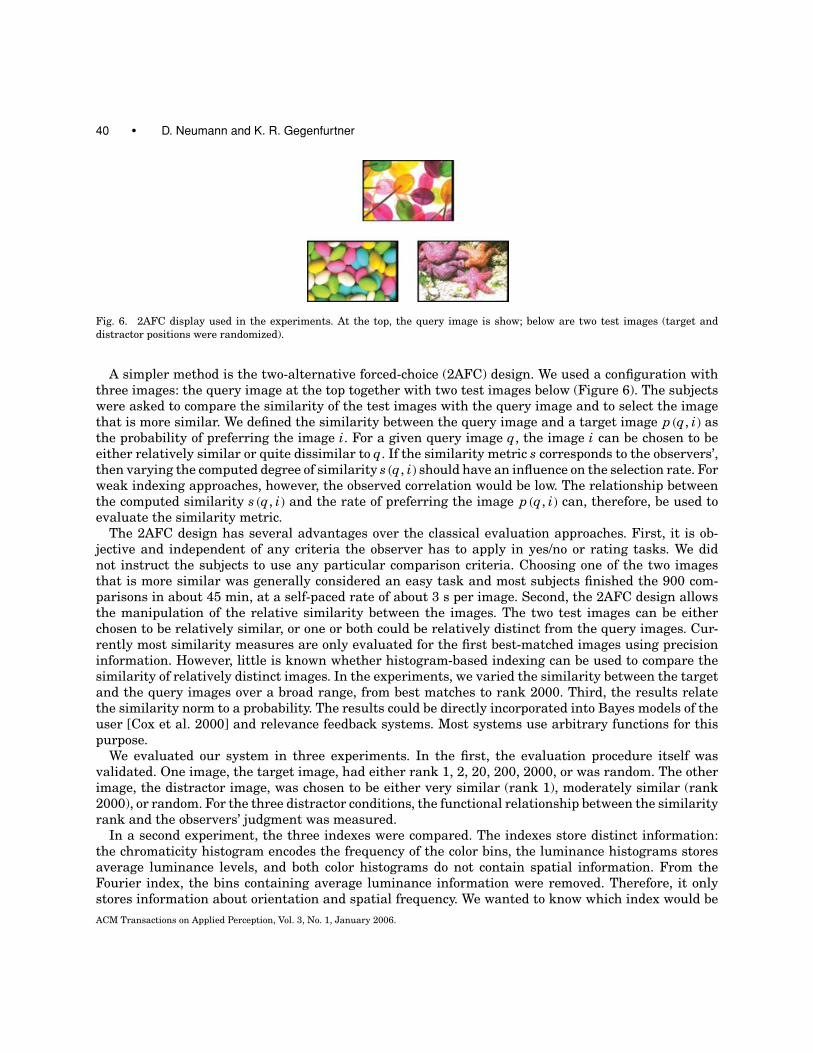
The results show a strong correlation between the logarithmic rank of the test image and the proba-bility of preference. In Figure 7, the similarity rank of the target image is plotted along the x axis. Foreach of the three distractor ranks, the rate of preferring the target is shown on the y axis. The hypothet-ical points of equal similarity between the target and the distractor image are marked by filled circles.If the distractor image is random, then the subjects statistically prefer the histogram-selected targetimage for all rank positions (top line of Figure 7). The lowest selection rate of 0.5 could theoreticallybe reached if the distractor and the target image are both random, as indicated by the right-most filledcircle. The image evaluated as being most similar by our indexing system was selected as being moresimilar more than 80% of the time. If a distractor image is chosen that is deemed more similar by theindexing system (rank 200 or rank 1), then the curves are shifted downward: for the middle curve, thedistractor had rank 200; for the lower curve, the distractor was always the best match.
ACM Transactions on Applied Perception, Vol. 3, No. 1, January 2006.
42 • D. Neumann and K. R. Gegenfurtner
Fig. 7. Probability of preferring the target image against the distractor image as a function of similarity between the target and
the query image. The distractor rank was varied from top to bottom: random, 200 and 1 (best match). The filled circles indicate
hypothetic points of equal similarity of distractor and target image with expected probability. 0.5 and, therefore, define the rank
of the distractor image (from left to right: 1, 200, random). The similarity distance was calculated using the chromaticity index
and the intersection metric. The standard error is shown for each point.
Table I. Regression (slope b and intercept a) and
Correlation Coefficients for the Relationship
between Logarithmic Target Rank and Concordance
for Different Distractor Ranks
Distractor Rank b a r
1 −.022 .49 .985
200 −.032 .68 .999
Random −.027 .80 .965
The correlation coefficient between the logarithmic rank and the percentage of concordance is veryhigh (r > 0.95) and significant (p < 0.05) for all conditions. Table I shows the regression (b, a) and thecorrelation (r) coefficients between the logarithmic rank and target preference.
psubj = b log(rank{zq[s(q, i)]}) + a + ξsubj (7)
Changing the distractor similarity shifts the functions by a constant amount and does not alter theslope of the linear regression. This is an important finding since it shows that the subjects’ do not changetheir judgments if one image is either very similar or random. Therefore, the distrator image in the2AFC design is not of critical importance for the evaluation of the indexes. For the following experiments,we kept the distractor similarity constant. We decided to use the medium distractor similarity (rank200) to optimally use the range.
3.4 Experiment 2: Index Comparison
In experiment 2, we wanted to know to what extent the other information sources (luminance, orienta-tion, and spation frequency) contribute to the similarity judgments. The target images were chosen byusing one of the three histograms and their ranks were again 1, 2, 20, 2000, or random. The distractorimage was determined with the chromaticity histogram and had rank 200. For the chromaticity his-togram the minimum norm was used, the distances between the luminance and Fourier vectors werecalculated with the Euclidian norm.
ACM Transactions on Applied Perception, Vol. 3, No. 1, January 2006.
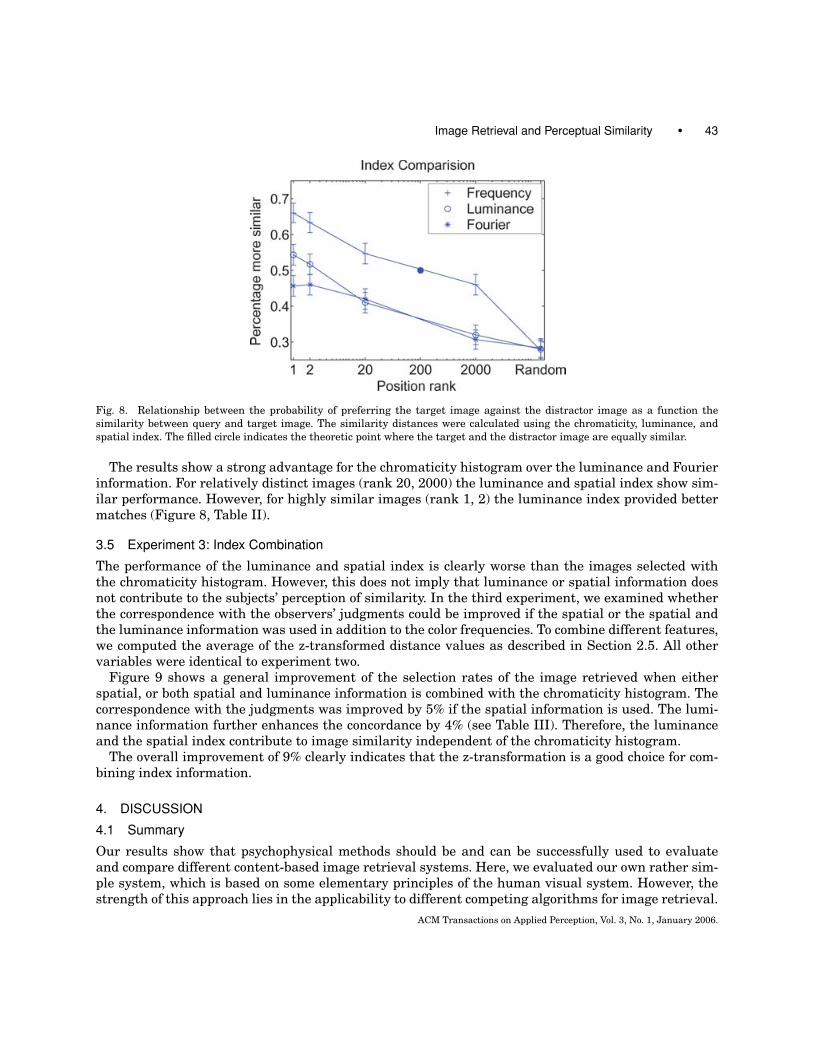
Image Retrieval and Perceptual Similarity • 43
Fig. 8. Relationship between the probability of preferring the target image against the distractor image as a function the
similarity between query and target image. The similarity distances were calculated using the chromaticity, luminance, and
spatial index. The filled circle indicates the theoretic point where the target and the distractor image are equally similar.
The results show a strong advantage for the chromaticity histogram over the luminance and Fourierinformation. For relatively distinct images (rank 20, 2000) the luminance and spatial index show sim-ilar performance. However, for highly similar images (rank 1, 2) the luminance index provided bettermatches (Figure 8, Table II).
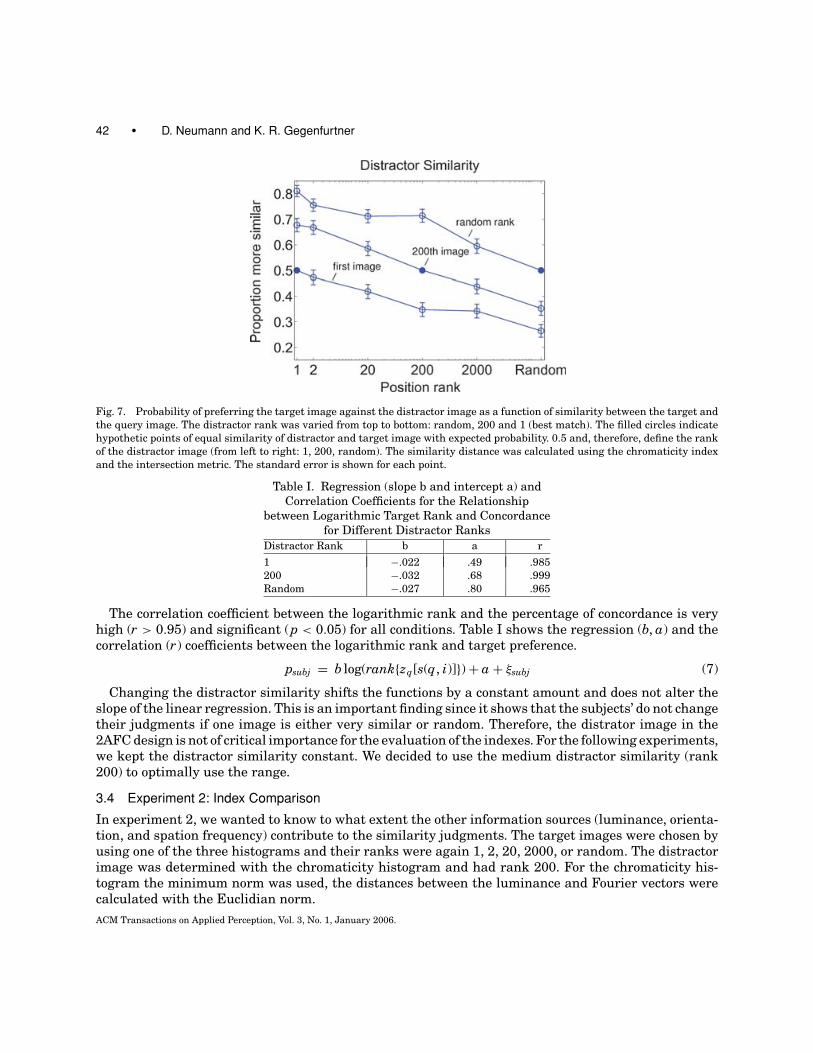
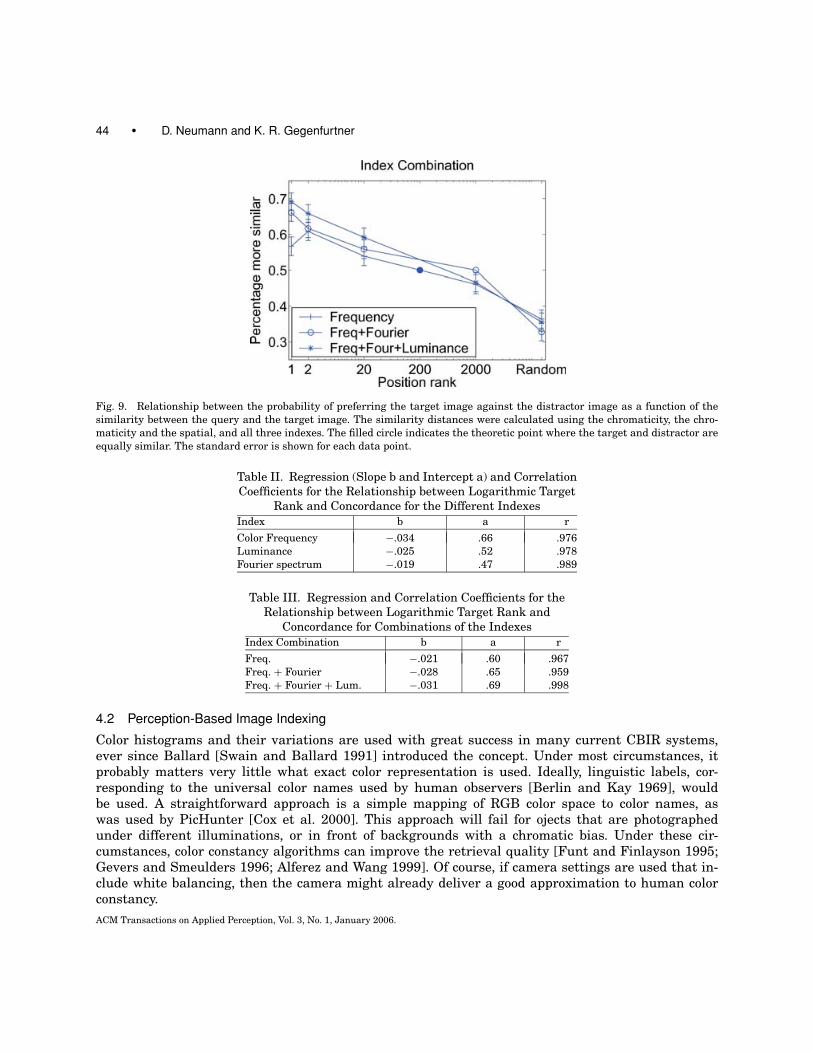
3.5 Experiment 3: Index Combination
The performance of the luminance and spatial index is clearly worse than the images selected withthe chromaticity histogram. However, this does not imply that luminance or spatial information doesnot contribute to the subjects’ perception of similarity. In the third experiment, we examined whetherthe correspondence with the observers’ judgments could be improved if the spatial or the spatial andthe luminance information was used in addition to the color frequencies. To combine different features,we computed the average of the z-transformed distance values as described in Section 2.5. All othervariables were identical to experiment two.
Figure 9 shows a general improvement of the selection rates of the image retrieved when eitherspatial, or both spatial and luminance information is combined with the chromaticity histogram. Thecorrespondence with the judgments was improved by 5% if the spatial information is used. The lumi-nance information further enhances the concordance by 4% (see Table III). Therefore, the luminanceand the spatial index contribute to image similarity independent of the chromaticity histogram.
The overall improvement of 9% clearly indicates that the z-transformation is a good choice for com-bining index information.
4. DISCUSSION
4.1 Summary
Our results show that psychophysical methods should be and can be successfully used to evaluateand compare different content-based image retrieval systems. Here, we evaluated our own rather sim-ple system, which is based on some elementary principles of the human visual system. However, thestrength of this approach lies in the applicability to different competing algorithms for image retrieval.
ACM Transactions on Applied Perception, Vol. 3, No. 1, January 2006.
44 • D. Neumann and K. R. Gegenfurtner
Fig. 9. Relationship between the probability of preferring the target image against the distractor image as a function of the
similarity between the query and the target image. The similarity distances were calculated using the chromaticity, the chro-
maticity and the spatial, and all three indexes. The filled circle indicates the theoretic point where the target and distractor are
equally similar. The standard error is shown for each data point.
Table II. Regression (Slope b and Intercept a) and Correlation
Coefficients for the Relationship between Logarithmic Target
Rank and Concordance for the Different Indexes
Index b a r
Color Frequency −.034 .66 .976
Luminance −.025 .52 .978
Fourier spectrum −.019 .47 .989
Table III. Regression and Correlation Coefficients for the
Relationship between Logarithmic Target Rank and
Concordance for Combinations of the Indexes
Index Combination b a r
Freq. −.021 .60 .967
Freq. + Fourier −.028 .65 .959
Freq. + Fourier + Lum. −.031 .69 .998
4.2 Perception-Based Image Indexing
Color histograms and their variations are used with great success in many current CBIR systems,ever since Ballard [Swain and Ballard 1991] introduced the concept. Under most circumstances, itprobably matters very little what exact color representation is used. Ideally, linguistic labels, cor-responding to the universal color names used by human observers [Berlin and Kay 1969], wouldbe used. A straightforward approach is a simple mapping of RGB color space to color names, aswas used by PicHunter [Cox et al. 2000]. This approach will fail for ojects that are photographedunder different illuminations, or in front of backgrounds with a chromatic bias. Under these cir-cumstances, color constancy algorithms can improve the retrieval quality [Funt and Finlayson 1995;Gevers and Smeulders 1996; Alferez and Wang 1999]. Of course, if camera settings are used that in-clude white balancing, then the camera might already deliver a good approximation to human colorconstancy.
ACM Transactions on Applied Perception, Vol. 3, No. 1, January 2006.
Image Retrieval and Perceptual Similarity • 45
One has to keep in mind that the assignment of names to colored objects probably happens at a ratherlate stage of visual processing [De Valois and De Valois 1993]. If an earlier level representation withmore than just 7–11 categories is desired, the code used in the primate visual system at the second stageof color vision, color opponency, might be close to optimal. This code removes the correlation between thethree different cone photoreceptors [Buchsbaum and Gottschalk 1983; Zaidi 1997]. It has been shownin a variety of psychophysical experiments that the axes of this space are independent for a variety ofvisual tasks [Krauskopf 2001]. Since the bin sizes we used were proportional to color discriminationthresholds obtained by Krauskopf and Gegenfurtner [1992], it can be argued that the code is optimal inthe sense of requiring the least number of bins to represent all possible discriminable colors. It shouldalso be noted that this color space is not identical to other color opponent spaces, such as HSI. However,in all likelihood the exact representation of colors will not make a significant difference.
In addition to the frequency-encoding chromaticity histogram, we stored the average luminance levelsof the color bins in a second vector. The separate processing of chromaticity and luminance (contrast)information is part of various models of visual processing. We used the separation of chromaticityand luminance information to compare the contribution of both information sources to the similarityjudgments. We found that the luminance index is correlated with the observers’ judgments, too. Theprediction of the perceived similarity is not as good as with the chromaticity histogram. However,luminance appears to be considered when images are compared, even if the luminance of the colortones seems not to be as important as their frequency.
The spatial information was extracted using the 2D DFT. The index was constructed to represent thedistribution of orientation and spatial frequency in the image analogous to the processing of contrastinformation in the visual cortex. Although many texture feature sets describe similar information,Fourier analysis offers a mathematically profound way to extract the information. The explicit repre-sentation of orientation and spatial frequency in the Fourier spectrum allows the simple filtering ofthese dimensions. In our program, the user could, for example, select a radial filter to use the Fourierindex as an orientation index only. By averaging the bins of equal frequency ranges a rotation invariantsearch can be conducted. Of course, there are more sophisticated ways of encoding the spatial informa-tion of images, for example, by multiple histograms [Stricker and Dimai 1997], correlograms [Huanget al. 1999], explicit texture statistics [Liu and Picard 1996] or by wavelet transforms [Manjunath andMa 1996; Wang et al. 1997; Liang and Kuo 1999]. However, our evaluation clearly demonstrates thatour index does capture perceptual similarity.
4.3 Evaluation
Currently, CBIR systems are evaluated by precision and, sometimes, recall measures. Relevant imagesare, in the majority of the publications, defined by similarity judgments of a single person decidingwhether an image belongs to the same category as the query image, or is in some unspecified way“similar” to it. The image databases used for evaluation typically contain between a hundred and somethousand images.
An exception is the well-evaluated PicHunter system [Cox et al. 2000; Papathomas et al. 2001]. Thesystem includes simple features like the image height and width, color histograms, color autocorrel-ogram, a color-coherence vector, and, for a subset of the images, semantic annotations. The featureswere tested in a forced-choice design similar to the one we used and then later compared within thetarget testing paradigm [Cox et al. 2000]. However, the target testing evaluation procedure used inPapathomas et al. [2001] is limited to relevance feedback systems. This is an ideal way to evaluate acomplete system, but it is less ideal to measure the relationship between single features and humanperception. With target testing the functional relationship between an index similarity space and thesimilarity space of human perception cannot be determined.
ACM Transactions on Applied Perception, Vol. 3, No. 1, January 2006.
46 • D. Neumann and K. R. Gegenfurtner
Cox et al. [2000] used a sigmoid function to transform the raw distances to a probabilistic scale. Ourresults suggest that the relationship can be modeled by a logarithmic function between the similarityrank and the selection probability for 2AFC designs. That relationship holds for all indexes and is notimpacted by the similarity of the distractor image.
For relevance feedback systems, it is highly important to measure the relationship between thesimilarity metric and the perceived similarity over the whole range of similarity, from the most similarimage to random images.
4.4 Conclusion
In summary, we have shown that the psychophysically based indexes are effective in finding similarimages. The indexes were constructed in accordance with some of the known properties of the earlystages of human vision. The color codes in the “red-green” and “blue-yellow” channels were modeledusing the color-opponent axes of the DKL color space and a logarithmic-radial scaling for the histogrambins. The luminance information was stored in a separate index. The 2D discrete Fourier transform wasused to create an orientation and spatial frequency histogram analogous to similar representations inthe visual cortex. Most importantly, we evaluated the indexing system with a strictly quantitative andobjective approach using a large, heterogeneous database of 60,000 digitized photographs.
REFERENCES
ALFEREZ, R. AND WANG, Y.-F. 1999. Geometric and illumination invariants for object recognition. IEEE Trans. PAMI 21, 6
(June), 505–536.
BERLIN, B. AND KAY, P. 1969. Basic Color Terms: Their Universality and Evolution. University of California Press, Berkeley,
CA.
BUCHSBAUM, G. AND GOTTSCHALK, A. 1983. Trichromacy opponent color coding and color transmission in the retina. In Proc.Roy. Soc. Lond. (B). 220, 89–113.
COX, I. J., MILLER, M. L., MINKA, T. P., PAPATHOMAS, T. V., AND YIANILOS, P. N. 2000. The bayesian image retrieval system,
pichunter: Theory, implementation, and psychophysical experiments. IEEE Transactions on Image Processing 9, 1, 20–37.
DE VALOIS, R. AND DE VALOIS, K. 1993. A multi-stage color model. Vision Research 33, 1053–1065.
DERRINGTON, A. M., KRAUSKOPF, J., AND LENNIE, P. 1984. Chromatic mechanisms in lateral geniculate nucleus of macque. J.Physiol. 357, 241–265.
D’ZMURA, M. AND LENNIE, P. 1986. Mechanisms of color constancy. Journal of the Optical Society of America a-Optics ImageScience and Vision 3, 10, 1662–1672.
FIELD, D. 1987. Relations between the statistics of natural images and the response properties of cortical cells. J. Opt. Soc.Amer. 4, 12, 2379–2394.
FLICKNER, M., SAWHNEY, H., NIBLACK, W., ASHLEY, J., HUANG, Q., DOM, B., GORKANI, M., HAFNER, J., LEE, D., PETKOVIC, D., STEELE, D.,
AND YANKER, P. 1995. Query by image and video content: The qbic system. IEEE Computer Magazine 28, 23–32.
FUNT, B. V. AND FINLAYSON, G. D. 1995. Color constant color indexing. IEEE Trans. PAMI 15, 5 (May), 522–529.
GEGENFURTNER, K. AND KIPER, D. 2003. Color vision. Annual Review of Neuroscience 26, 181–206.
GEVERS, T. AND SMEULDERS, A. 1996. A comparative study of several color models for color image invariant retreival. In Proc.1st Int. Workshop on Image Databases and Multimedia Search. Amsterdam, Netherlands, 17.
HERING, E. 1964. Outlines of a Theory of the Light Sense. Harvard University Press, Cambridge, MA.
HUANG, J., KUMAR, S., MITRA, M., ZHU, W., AND ZABIH, R. 1999. Spatial color indexing and applications. International Journal ofComputer Vision 35, 3, 245–268.
HUBEL, D. AND WIESEL, T. 1998. Early exploration of the visual cortex. Neuron 20, 3, 401–412.
HURVICH, L. M. AND JAMESON, D. 1957. An opponent-process theory of color-vision. Psychological Review 64, 6, 384–404.
IQBAL, Q. AND AGGARWAL, J. K. 2002. Combining structure, color and texture for image retrieval: A performance evaluation. In
Proceedings of the 16th Intern Conf Pattern Recognition (ICPR) (Aug 11–15, 2002). 438–443.
KRAUSKOPF, J. 2001. Color Vision: From Genes to Perception. K. R. Gegenfurtner & L. T. Sharpe, Eds. Cambridge University
Press, London. 303–316.
ACM Transactions on Applied Perception, Vol. 3, No. 1, January 2006.

Image Retrieval and Perceptual Similarity • 47
KRAUSKOPF, J. AND GEGENFURTNER, K. 1992. Color discrimination and adaptation. Vision Research 32, 11, 2165–2175.
LANDY, M. S., COHEN, Y., AND SPERLING, G. 1984. Hips: a Unix-based image processing system. Computer Vision, Graphics, andImage Processing 25, 3 (Mar.), 331–347.
LI, B. T., CHANG, E., AND WU, Y. 2003. Discovery of a perceptual distance function for measuring image similarity. MultimediaSystems 8, 6, 512–522.
LIANG, K.-C. AND KUO, C.-C. J. 1999. Waveguide: A joint wavelet-based image representation and description system. IEEETrans. Image Processing 8, 11.
LIU, F. AND PICARD, R. W. 1996. Periodicity, directionality, and randomness: Wold features for image modeling and retrieval.
IEEE Trans. PAMI 18, 7, 517–549.
MALJKOVIC, V. AND MARTINI, P. 2005. Short-term memory for scenes with affective content. Journal of Vision 5, 3, 215–229.
MANJUNATH, B. S. AND MA, M. Y. 1996. Texture features for browsing and retrieval of image data. IEEE Trans. PAMI 18, 8
(Aug.), 837–842.
OLIVA, A. AND TORRALBA, A. 2001. Modeling the shape of the scene: A holistic representation of the spatial envelope. InternationalJournal of Computer Vision 42, 3, 145–175.
PAPATHOMAS, T., COX, I., YIANILOS, P., MILLER, M., MINKA, T., CONWAY, T., AND GHOSN, J. 2001. Psychophysical experiments on the
PicHunter image retrieval system. Journal of Electronic Imaging 10, 1, 170–180.
ROGOWITZ, B. E., FRESE, T., SMITH, J. R., BOUMAN, C. A., AND KALIN, E. 1998. Perceptual image similarity experiments. HumanVision and Electronic Imaging III 3299, 1, 576–590.
RUDERMAN, D. L., CRONIN, T. W., AND CHIAO, C.-C. 1998. Statistics of cone responses to natural images: implications for visual
coding. J. Opt. Soc. America A 15, 2036–2045.
RUI, Y., HUANG, T. S., ORTEGA, M., AND MEHROTRA, S. 1998. Relevance feedback: A power tool for interactive content-based image
retrieval. IEEE Transactions on Circuits and Systems for Video Technology 8, 5, 644–655.
RUI, Y., HUANG, T., AND CHANG, S. 1999. Image retrieval: current techniques, promising directions and open issues. Journal ofVisual Communication and Image Representation 10, 39–62.
SALTON, G. AND BUCKLEY, C. 1990. Improving retrieval performance by relevance feedback. Journal of the American Society forInformation Science 41, 4, 288–297.
STRICKER, M. AND DIMAI, A. 1997. Spectral covariance and fuzzy regions for image-indexing. Machine Vision and Applications 10,
2, 66–73.
SWAIN, M. J. AND BALLARD, D. H. 1991. Color indexing. International Journal of Computer Vision 7, 1, 11–32.
WANDELL, B. 1993. Color appearance: The effects of illumination and spatial resolution. Proc. Nat. Acad. Sci. 90. 1494–1501.
WANG, J. Z., WIEDERHOLD, G., FIRSCHEIN, O., AND WEI, S. X. 1997. Content-based image-indexing and searching using daubechies’
wavelets. Int. J. Digit. Libr. 1, 311–328.
WATSON, A. B. 1987. Efficiency of a model human image code. J. Opt. Soc. Am. 4, 12, 2401–2417.
WASSLE, H. AND BOYCOTT, B. B. 1991. Functional architecture of the mammalian retina. Physiol Rev 71, 447–480.
ZAIDI, Q. 1997. Decorrelation of L- and M-cone signals. J. Opt. Soc. America A 14, 3430–3431.
Received June 2004; revised May 2005; accepted October 2005
ACM Transactions on Applied Perception, Vol. 3, No. 1, January 2006.