Embed Size (px)
Citation preview

Pre-clinical Imaging
a p p l i c a t i o n n o t e
Author
Jeffrey D. Peterson, Ph.D.
PerkinElmer, Inc. Waltham, MA USA
Abstract
The accurate quantitation of gastric emptying is crucial for understanding the physiological, pathological and pharmacological mechanisms underlying gastric motility both clinically and in animal studies. Current methods used for determining gastric emptying rates in small animals are either terminal or involve radioactive tracers, incurring high financial and time cost. We have developed a novel,
near-infrared (NIR) fluorescent imaging agent, GastroSense™ 750, to monitor and quantitate gastric emptying rates in murine models in vivo, non-invasively, and in real time. The imaging agent is comprised of an acid-stable NIR fluorophore conjugated to a non-absorbable pharmacokinetic modifier designed to be formulated in liquid or incorporated into a solid meal. Using female 8 week old BALB/c mice recipients, 0.25 nmol GastroSense 750 was orally gavaged in liquid formulation (PBS) or fed in egg yolk, an experimental approach designed to detect changes in gastric emptying. In vivo 3D fluorescent imaging and quantitation using the FMT® 2500 Fluorescence Molecular Tomography (FMT) system at multiple time points revealed a gastric half-life (t1/2) of 36 ±16 minutes for the liquid formulation and 63 ±18 minutes for the egg formulation. Clonidine (an a2 adrenergic agonist, 1 mg/kg) further inhibited gastric emptying time for the egg formulation, halting the process completely between 2 and 4 h and ultimately delaying the completion of gastric emptying to greater than 6-7 h. GastroSense 750 signal can also be quantitated as it transits into the intestines, ultimately decreasing in intensity and volume as it is excreted. These findings reveal that GastroSense 750 and FMT 3D fluorescent imaging in vivo can be used successfully to quantitate gastrointestinal transit of both liquid and solid diets in small animals.
Imaging Gastric Emptying with GastroSense 750
2
As a validation of GastroSense transit through the gastro-intestinal system, the agent was orally gavaged in multiple mice, and tissue was excised for ex vivo fluorescence imaging. Figure 2 shows the kinetics of localization of the PBS-formulated agent in different gastrointestinal regions over 4 h. Ex vivo imaging (Figure 1C) shows that the GastroSense empties from the stomach over 1 h, rapidly moves through the duodenum and jejunum, and more slowly transits through the ileum, cecum, and colon.
Materials and Methods
Fluorescent agents for the quantitation of gastric emptying
GastroSense 750, non-targeted physiologic agent, was used to image the rate of gastric emptying. The imaging doses were 0.25-1.0 nmoles in 150 mL saline administered via oral gavage in all imaging studies.
Gastric emptying model
Eight week-old female BALB/c mice were purchased from Charles River Laboratories (Wilmington, MA) and main-tained in a pathogen-free animal facility with water and low-fluorescence mouse chow (Harlan Tekland, Madison, WI). Handling of mice and experimental procedures were in accordance with PerkineElmer IACUC guidelines and approved veterinarian requirements for animal care and use. Mice were depilated (Nair® depilatory cream, Church & Dwight Co., Inc., Princeton, NJ) 24 h prior to initiation of studies. BALB/c mice were gavaged with agent (0.25 nmole) in PBS, final volume of 200 µL. The effect of solid food on gastric emptying rates was assessed by feeding some mice cooked egg yolk into which 25 µL of GastroSense 750 (0.25 nmole) was pipetted.
In vivo FMT 2500 tomographic imaging and analysis
Mice were anesthetized by isoflurane inhalation. Depilatory lotion was applied thickly on skin over the lower torso (front, back, and sides) of each mouse, rinsed off with warm water, and re-applied until all fur had been removed. Mice were then imaged using the FMT 2500 Quantitative Pre-clinical Imaging System which collected both 2D surface images as well as 3D tomographic imaging datasets.
FMT reconstruction and analysis
The collected fluorescence data was reconstructed by FMT 2500 system software (TrueQuant™ v2.0) for the quantitation of three-dimensional fluorescence signal within the stomach and intestines. Three-dimensional regions of interest (ROI) were drawn encompassing the relevant biology. A variety of background thresholding levels were applied systematically, and results were compared to other independent readouts for validation.
Results
GastroSense validation
GastroSense 750 is a NIRF imaging agent designed to monitor and quantitate gastric and intestinal emptying non-invasively in murine models in vivo as represented in Figure 1. The fluorophore of this agent is acid-stable and conjugated to a non-absorbable pharmacokinetic modifier designed to be formulated in liquid or incorporated into a solid meal.
Figure 1. Gastric emptying and intestinal imaging.
Figure 2. Gastrointestinal transit kinetics.
GastroSense Oral gavage
BALB/c mice
A. GI Diagram
C. Ex Vivo Tissue: Planar Imaging of GastroSense Transit
B. Transit Diagram
Stomach
0 1 2 3 4
Time (h)
Duodenum
Jejunum
Ileum
Cecum
Ascending Colon
Descending Colon
0-60 minutes
1-5 h
Gastric Emptying Imaging
Intestine Imaging
S
C
Imaging the stomach. GastroSense was administered by oral gavage in PBS (Liquid) and gastrointestinal tissue was excised to determine agent localization. A. Schematic diagram of the different regions of the gastrointestinal tract. B. Diagrammatic representation of GastroSense localization over time based on two studies. C. Ex vivo planar NIR images of excised gastrointestinal tissue from representative mice at 5 timepoints.
5 min 1 h 2 h 3 h30 min
3
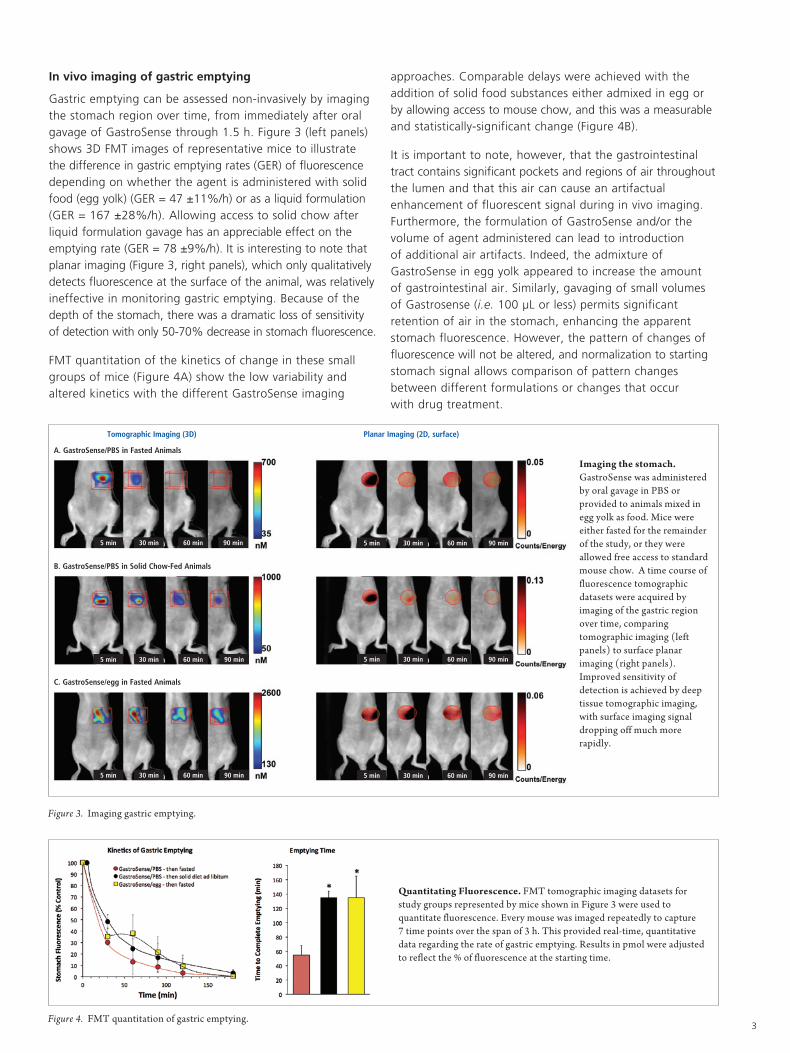
approaches. Comparable delays were achieved with the addition of solid food substances either admixed in egg or by allowing access to mouse chow, and this was a measurable and statistically-significant change (Figure 4B).
It is important to note, however, that the gastrointestinal tract contains significant pockets and regions of air throughout the lumen and that this air can cause an artifactual enhancement of fluorescent signal during in vivo imaging. Furthermore, the formulation of GastroSense and/or the volume of agent administered can lead to introduction of additional air artifacts. Indeed, the admixture of GastroSense in egg yolk appeared to increase the amount of gastrointestinal air. Similarly, gavaging of small volumes of Gastrosense (i.e. 100 µL or less) permits significant retention of air in the stomach, enhancing the apparent stomach fluorescence. However, the pattern of changes of fluorescence will not be altered, and normalization to starting stomach signal allows comparison of pattern changes between different formulations or changes that occur with drug treatment.
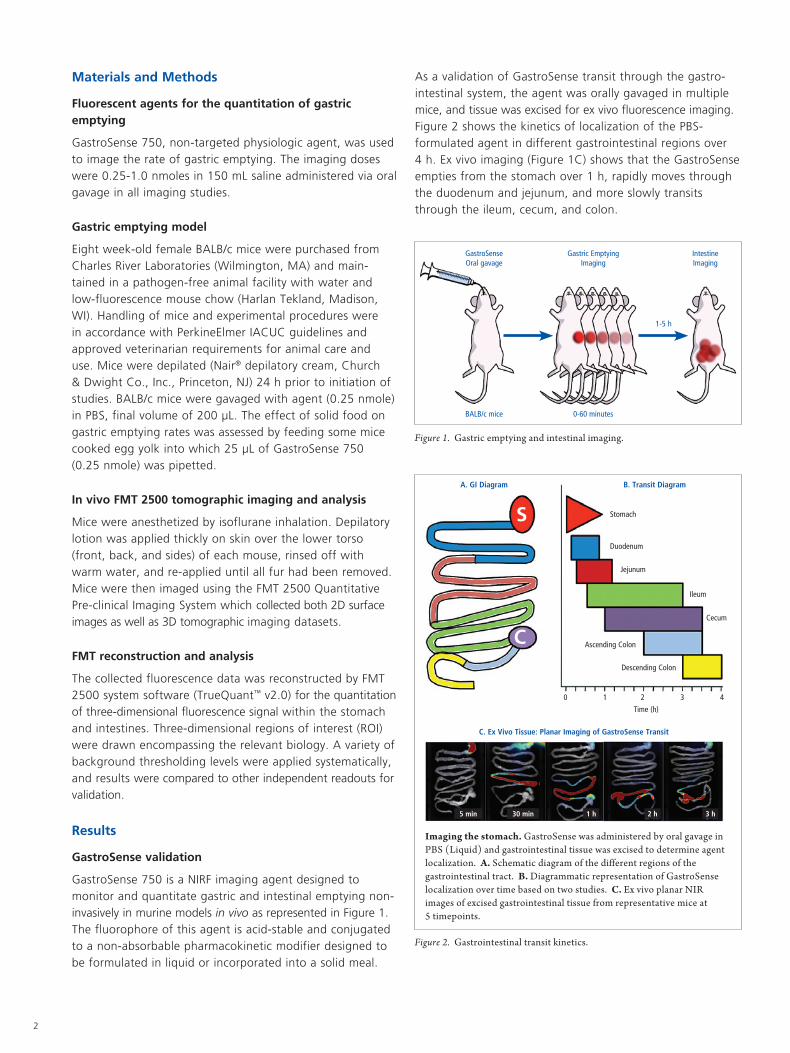
In vivo imaging of gastric emptying
Gastric emptying can be assessed non-invasively by imaging the stomach region over time, from immediately after oral gavage of GastroSense through 1.5 h. Figure 3 (left panels) shows 3D FMT images of representative mice to illustrate the difference in gastric emptying rates (GER) of fluorescence depending on whether the agent is administered with solid food (egg yolk) (GER = 47 ±11%/h) or as a liquid formulation (GER = 167 ±28%/h). Allowing access to solid chow after liquid formulation gavage has an appreciable effect on the emptying rate (GER = 78 ±9%/h). It is interesting to note that planar imaging (Figure 3, right panels), which only qualitatively detects fluorescence at the surface of the animal, was relatively ineffective in monitoring gastric emptying. Because of the depth of the stomach, there was a dramatic loss of sensitivity of detection with only 50-70% decrease in stomach fluorescence.
FMT quantitation of the kinetics of change in these small groups of mice (Figure 4A) show the low variability and altered kinetics with the different GastroSense imaging
Figure 3. Imaging gastric emptying.
Imaging the stomach. GastroSense was administered by oral gavage in PBS or provided to animals mixed in egg yolk as food. Mice were either fasted for the remainder of the study, or they were allowed free access to standard mouse chow. A time course of fluorescence tomographic datasets were acquired by imaging of the gastric region over time, comparing tomographic imaging (left panels) to surface planar imaging (right panels). Improved sensitivity of detection is achieved by deep tissue tomographic imaging, with surface imaging signal dropping off much more rapidly.
Tomographic Imaging (3D) Planar Imaging (2D, surface)
A. GastroSense/PBS in Fasted Animals
5 min
5 min
5 min
30 min
30 min
30 min
60 min
60 min
60 min
90 min
90 min
90 min
5 min
5 min
5 min
30 min
30 min
30 min
60 min
60 min
60 min
90 min
90 min
90 min
B. GastroSense/PBS in Solid Chow-Fed Animals
C. GastroSense/egg in Fasted Animals
Figure 4. FMT quantitation of gastric emptying.
Quantitating Fluorescence. FMT tomographic imaging datasets for study groups represented by mice shown in Figure 3 were used to quantitate fluorescence. Every mouse was imaged repeatedly to capture 7 time points over the span of 3 h. This provided real-time, quantitative data regarding the rate of gastric emptying. Results in pmol were adjusted to reflect the % of fluorescence at the starting time.
4
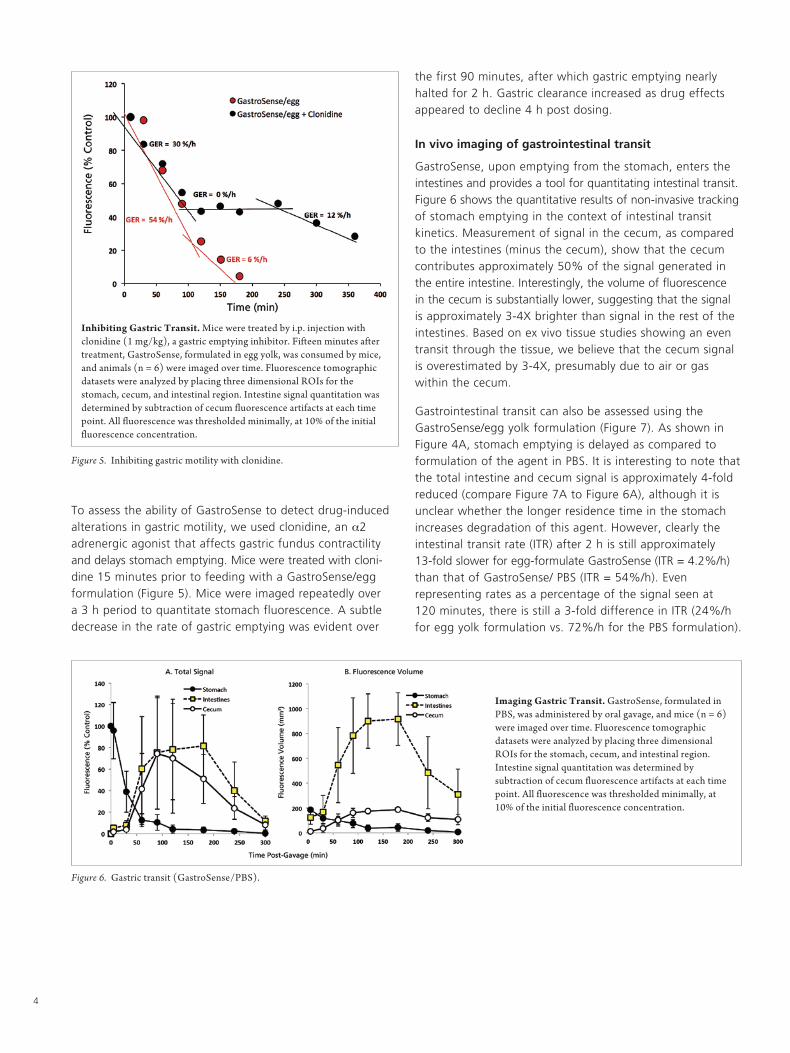
Figure 5. Inhibiting gastric motility with clonidine.
Inhibiting Gastric Transit. Mice were treated by i.p. injection with clonidine (1 mg/kg), a gastric emptying inhibitor. Fifteen minutes after treatment, GastroSense, formulated in egg yolk, was consumed by mice, and animals (n = 6) were imaged over time. Fluorescence tomographic datasets were analyzed by placing three dimensional ROIs for the stomach, cecum, and intestinal region. Intestine signal quantitation was determined by subtraction of cecum fluorescence artifacts at each time point. All fluorescence was thresholded minimally, at 10% of the initial fluorescence concentration.
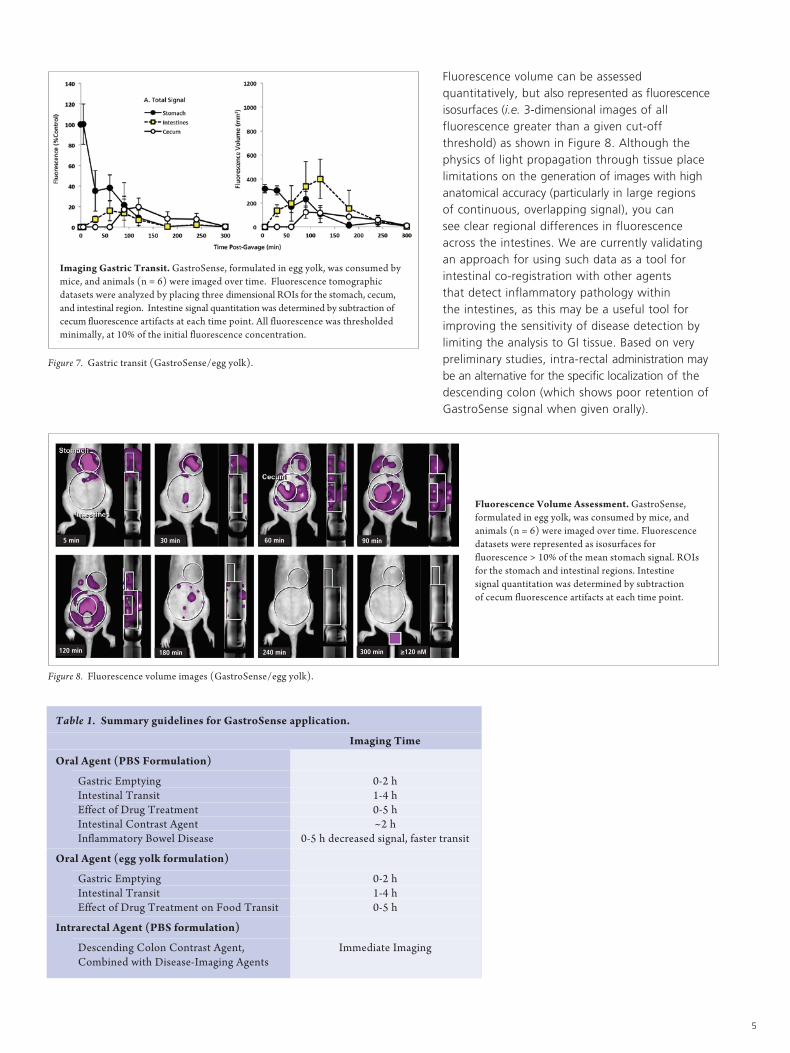
Figure 6. Gastric transit (GastroSense/PBS).
Imaging Gastric Transit. GastroSense, formulated in PBS, was administered by oral gavage, and mice (n = 6) were imaged over time. Fluorescence tomographic datasets were analyzed by placing three dimensional ROIs for the stomach, cecum, and intestinal region. Intestine signal quantitation was determined by subtraction of cecum fluorescence artifacts at each time point. All fluorescence was thresholded minimally, at 10% of the initial fluorescence concentration.
To assess the ability of GastroSense to detect drug-induced alterations in gastric motility, we used clonidine, an a2 adrenergic agonist that affects gastric fundus contractility and delays stomach emptying. Mice were treated with cloni-dine 15 minutes prior to feeding with a GastroSense/egg formulation (Figure 5). Mice were imaged repeatedly over a 3 h period to quantitate stomach fluorescence. A subtle decrease in the rate of gastric emptying was evident over
the first 90 minutes, after which gastric emptying nearly halted for 2 h. Gastric clearance increased as drug effects appeared to decline 4 h post dosing.
In vivo imaging of gastrointestinal transit
GastroSense, upon emptying from the stomach, enters the intestines and provides a tool for quantitating intestinal transit. Figure 6 shows the quantitative results of non-invasive tracking of stomach emptying in the context of intestinal transit kinetics. Measurement of signal in the cecum, as compared to the intestines (minus the cecum), show that the cecum contributes approximately 50% of the signal generated in the entire intestine. Interestingly, the volume of fluorescence in the cecum is substantially lower, suggesting that the signal is approximately 3-4X brighter than signal in the rest of the intestines. Based on ex vivo tissue studies showing an even transit through the tissue, we believe that the cecum signal is overestimated by 3-4X, presumably due to air or gas within the cecum.
Gastrointestinal transit can also be assessed using the GastroSense/egg yolk formulation (Figure 7). As shown in Figure 4A, stomach emptying is delayed as compared to formulation of the agent in PBS. It is interesting to note that the total intestine and cecum signal is approximately 4-fold reduced (compare Figure 7A to Figure 6A), although it is unclear whether the longer residence time in the stomach increases degradation of this agent. However, clearly the intestinal transit rate (ITR) after 2 h is still approximately 13-fold slower for egg-formulate GastroSense (ITR = 4.2%/h) than that of GastroSense/ PBS (ITR = 54%/h). Even representing rates as a percentage of the signal seen at 120 minutes, there is still a 3-fold difference in ITR (24%/h for egg yolk formulation vs. 72%/h for the PBS formulation).
5
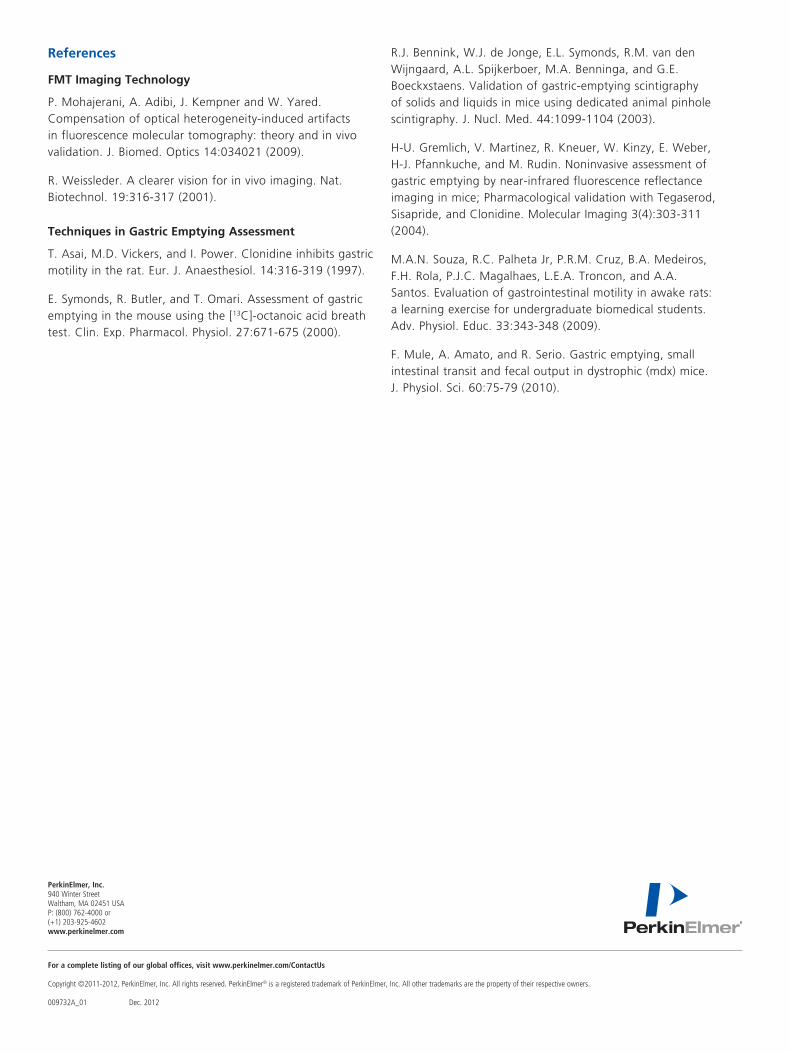
Figure 8. Fluorescence volume images (GastroSense/egg yolk).
Figure 7. Gastric transit (GastroSense/egg yolk).
Imaging Gastric Transit. GastroSense, formulated in egg yolk, was consumed by mice, and animals (n = 6) were imaged over time. Fluorescence tomographic datasets were analyzed by placing three dimensional ROIs for the stomach, cecum, and intestinal region. Intestine signal quantitation was determined by subtraction of cecum fluorescence artifacts at each time point. All fluorescence was thresholded minimally, at 10% of the initial fluorescence concentration.
Fluorescence Volume Assessment. GastroSense, formulated in egg yolk, was consumed by mice, and animals (n = 6) were imaged over time. Fluorescence datasets were represented as isosurfaces for fluorescence > 10% of the mean stomach signal. ROIs for the stomach and intestinal regions. Intestine signal quantitation was determined by subtraction of cecum fluorescence artifacts at each time point.
Fluorescence volume can be assessed quantitatively, but also represented as fluorescence isosurfaces (i.e. 3-dimensional images of all fluorescence greater than a given cut-off threshold) as shown in Figure 8. Although the physics of light propagation through tissue place limitations on the generation of images with high anatomical accuracy (particularly in large regions of continuous, overlapping signal), you can see clear regional differences in fluorescence across the intestines. We are currently validating an approach for using such data as a tool for intestinal co-registration with other agents that detect inflammatory pathology within the intestines, as this may be a useful tool for improving the sensitivity of disease detection by limiting the analysis to GI tissue. Based on very preliminary studies, intra-rectal administration may be an alternative for the specific localization of the descending colon (which shows poor retention of GastroSense signal when given orally).
Table 1. Summary guidelines for GastroSense application.
Imaging Time
Oral Agent (PBS Formulation)
Gastric Emptying 0-2 h Intestinal Transit 1-4 h Effect of Drug Treatment 0-5 h Intestinal Contrast Agent ~2 h Inflammatory Bowel Disease 0-5 h decreased signal, faster transit
Oral Agent (egg yolk formulation)
Gastric Emptying 0-2 h Intestinal Transit 1-4 h Effect of Drug Treatment on Food Transit 0-5 h
Intrarectal Agent (PBS formulation)
Descending Colon Contrast Agent, Immediate Imaging Combined with Disease-Imaging Agents
5 min 30 min 60 min 90 min
120 min 180 min 240 min 300 min ≥120 nM
For a complete listing of our global offices, visit www.perkinelmer.com/ContactUs
Copyright ©2011-2012, PerkinElmer, Inc. All rights reserved. PerkinElmer® is a registered trademark of PerkinElmer, Inc. All other trademarks are the property of their respective owners. 009732A_01 Dec. 2012
PerkinElmer, Inc. 940 Winter Street Waltham, MA 02451 USA P: (800) 762-4000 or (+1) 203-925-4602www.perkinelmer.com
References
FMT Imaging Technology
P. Mohajerani, A. Adibi, J. Kempner and W. Yared. Compensation of optical heterogeneity-induced artifacts in fluorescence molecular tomography: theory and in vivo validation. J. Biomed. Optics 14:034021 (2009).
R. Weissleder. A clearer vision for in vivo imaging. Nat. Biotechnol. 19:316-317 (2001).
Techniques in Gastric Emptying Assessment
T. Asai, M.D. Vickers, and I. Power. Clonidine inhibits gastric motility in the rat. Eur. J. Anaesthesiol. 14:316-319 (1997).
E. Symonds, R. Butler, and T. Omari. Assessment of gastric emptying in the mouse using the [13C]-octanoic acid breath test. Clin. Exp. Pharmacol. Physiol. 27:671-675 (2000).
R.J. Bennink, W.J. de Jonge, E.L. Symonds, R.M. van den Wijngaard, A.L. Spijkerboer, M.A. Benninga, and G.E. Boeckxstaens. Validation of gastric-emptying scintigraphy of solids and liquids in mice using dedicated animal pinhole scintigraphy. J. Nucl. Med. 44:1099-1104 (2003).
H-U. Gremlich, V. Martinez, R. Kneuer, W. Kinzy, E. Weber, H-J. Pfannkuche, and M. Rudin. Noninvasive assessment of gastric emptying by near-infrared fluorescence reflectance imaging in mice; Pharmacological validation with Tegaserod, Sisapride, and Clonidine. Molecular Imaging 3(4):303-311 (2004).
M.A.N. Souza, R.C. Palheta Jr, P.R.M. Cruz, B.A. Medeiros, F.H. Rola, P.J.C. Magalhaes, L.E.A. Troncon, and A.A. Santos. Evaluation of gastrointestinal motility in awake rats: a learning exercise for undergraduate biomedical students. Adv. Physiol. Educ. 33:343-348 (2009).
F. Mule, A. Amato, and R. Serio. Gastric emptying, small intestinal transit and fecal output in dystrophic (mdx) mice. J. Physiol. Sci. 60:75-79 (2010).