Embed Size (px)
Citation preview
IMMIGRATION, HOUSING DISCRIMINATION ANDEMPLOYMENT*
Tito Boeri, Marta De Philippis, Eleonora Patacchini and Michele Pellizzari
We use a new data set on Italy and a novel identification strategy to analyse the relationship betweenmigrants’ employment status and the percentage of non-Italians living nearby. Our data containinformation at the very local level and are representative of both legal and illegal migrants.Identification exploits the physical characteristics of local buildings as a source of exogenousvariation in the incidence of migrants. We find that migrants residing in more immigrant-dense areasare less likely to be employed. This penalty is higher if the migrants leaving nearby are illegal and it isnot mitigated if they are from own ethnic group or more proficient in Italian.
In the 10 years predating the Great Recession Europe received twice as manyimmigrants (relative to the resident population) than the US and 4–5 times as many asJapan (OECD, 2009). The main motivation of these flows was finding a job. Familyreunification and asylum seeking were fairly marginal. The main destination ofmigrants was Southern Europe, where the stock of foreign born increased by some5 million in Spain and 3 million in Italy within a decade, doubling the migrantpopulation in several urban areas over a few years. Most of these migrants came inillegally hoping for a subsequent regularisation and there was no major social housingprogramme activated in the destination countries responding to these mass migrationflows, just while house prices were booming. Newcomers did not locate uniformly acrossthe board: they often found residence where other persons of the same nationality orethnic group were already living, increasing the residential concentration of migrants inurban areas. How did these residential location patterns affect the economicintegration of migrants, notably their probability of finding a job? Is there scope forpolicies reducing residential concentration of migrants in specific urban areas?
While in the US research related to the effects of residential concentration ofmigrants on their economic and social integration is long standing (Borjas, 1995;Cutler and Glaeser, 1997; Ross, 1998; Cutler et al., 1999; Card and Rothstein, 2007), inEurope, notably in Southern Europe, there is a very thin scientific literature on thisissue, despite the highly controversial public debate. This paucity of studies for Europeis mainly due to a lack of detailed data on ethnic minorities and migrants, especially atthe city level (Bisin et al., 2011). Moreover data collection is particularly problematic
* Corresponding author: Tito Boeri, Department of Economics, Bocconi University, via Roentgen 1, 20136Milan, Italy. Email: [email protected].
We thank the European Bank for Reconstruction and Development (EBRD) for financing this project,Francesca Pissarides for her contribution to the survey design and Carlo Erminero & Co. for theirprofessional services. We are grateful to Massimo Baldini and Marta Federici for having given us access tomicrodata of their experiment on discrimination in the Italian housing market. We benefited from thevaluable comments of Francesco Fasani, Gianmarco Ottaviano, Giovanni Peri, Fabiano Schivardi, StuartRosenthal, John Yinger and seminar participants at Bocconi University. Gaetano Basso, Vittorio Bassi,Barbara Biasi, Andrea Catania, Hristo Dachev, Rachele Poggi and Alessandro Vecchiato provided skilfulresearch assistance. The usual disclaimer applies. Michele Pellizzari acknowledges financial support from theSwiss National Science Foundation through the NCCR-LIVES programme.
[ F82 ]
The Economic Journal, 125 (August), F82–F114. Doi: 10.1111/ecoj.12232© 2015 Royal Economic Society. Published by John Wiley & Sons, 9600
Garsington Road, Oxford OX4 2DQ, UK and 350 Main Street, Malden, MA 02148, USA.
given the relatively large share of illegal immigrants in Southern Europe, who are notrepresented by surveys drawing from population registers. In this context, a key issue isthe relatively large share of illegal migrants in Southern Europe, who are notrepresented by surveys drawing from population registers.
In this article, we contribute to filling this gap by estimating the causal effect of thelocal concentration of immigrants on their employment prospects using a new andunique survey conducted in 2009 in eight cities located in the North of Italy. Italy is aparticularly interesting case to study, as migrants appear to be very highly concentratedin their residential locations. Based on official data from the 2001 census, the coefficientof variation in the number of resident migrants across census tracts is twice as large asthat of natives (1.793 against 0.966 for natives). At the same time, the fraction of illegalmigrants is large: Italian migration policies require that migrants have a job beforeentering the country and getting a legal permit.1 This requirement is never fulfilled asmigrants come in illegally and then search for a job, hoping for a migration amnesty or aletter of an employer allowing them to leave the country and come back legally. Thepoor design and enforcement of Italian migration policies make the case even moreinteresting. Illegal status may indeed interact with residential location and affect therelationship between housing concentration of migrants and employment.
The focus on a limited group of eight cities in Northern Italy allowed us to designthe sampling frame very carefully, also including illegal migrants, and to use acomprehensive questionnaire for the interviews.
Our study is novel along several dimensions. First, thanks to a particular samplingframe which randomly draws blocks from the continuum of map locations within cities(see subsection 2.1), our survey covers both legal and illegal migrants. Around 20% ofmigrants in our data are illegally resident in the country and they are far from being arandom subgroup of the entire population. Compared to the legally resident, illegalmigrants appear to be on average men, younger, slightly less educated, less proficientwith the Italian language and more likely to rely on informal networks to look foremployment.
Second, the data are available at a very detailed level of geographical disaggregation,namely, we can identify the exact address where each interviewed person resides.Hence, we can define residential concentration more accurately than in most previousstudies, that is at the level of the individual block.
Third, by merging our survey with data from the national census, we are able toobtain information about various physical attributes of the buildings in each block,which are valid instruments for migrants’ residential concentration in Italy. This is themain identification strategy used in this article to uncover the causal effect of migrantdensity on labour market outcomes. As part of our analysis, we also develop amethodological contribution that extends to non-linear models the procedure ofChernozhukov and Hansen (2008) to construct weak-instrument robust confidenceintervals from reduced-form estimates. Moreover, the fine geographical disaggregationof our data allows identifying the same parameter using an alternative approach basedon the comparison of blocks within narrowly defined groups, as in Bayer et al. (2008).
1 The quota on residence permits are very tight.
© 2015 Royal Economic Society.
[AUGUST 2015] I MM I G R A T I O N , H OU S I N G A ND EM P LO YM E N T F83
Our main results show that migrants who reside in areas with a high concentration ofnon-Italians are less likely to be employed compared to similar migrants who reside inareas with a lower concentration of migrants. The magnitude of these effects is non-negligible: in our preferred specification, a 1 percentage point increase in the share ofimmigrants residing in the block reduces the probability of being employed by 2percentage points or about 2.3% over the average.
While our data do not allow us to evaluate which particular mechanism is behindthe negative effects of residential concentration on the employment prospects ofmigrants, we can nevertheless assess the nature of the externalities associated withlarge shares of migrants living nearby and rule out some explanations provided bythe earlier literature. We find that residential concentration is not associated with ahigher probability of finding jobs through friends. This suggests that network effectsin job search may be fairly limited. At the same time we do not find support for theview that employers may redline areas with a high concentration of migrants as aform of statistical discrimination: native employment probabilities appear to beunaffected by the concentration of migrants in their block. We find that a largeshare of illegal, as opposed to legal, migrants in the block strengthens the negativeeffects on employment, which is only minimally reduced by a higher proficiency inItalian of neighbouring migrants. This may suggest that there are relevantcongestion externalities in the informal labour market, the only market illegalmigrants can have access to. This explanation, when confirmed by further evidence,would have relevant policy implications on the design of migration policies morethan on social housing programmes. In particular, it suggests that migration policies,preventing the acquisition of legal status by those migrants who come withoutalready having a job, are likely to increase the negative externalities associated withimmigration.
The structure of the article is as follows. Section 1 discusses the theoreticalfoundation for a relationship between residential proximity of individuals from thesame ethnic group and the probability of finding a job, and reviews the empiricalevidence. Our data are described in Section 2. Section 3 outlines the identificationstrategy, whereas Section 4 is devoted to presenting our empirical results. Finally,Section 5 briefly characterises the normative implications of our results andconcludes.
1. Theoretical Mechanisms and Existing Evidence
In this Section, we briefly survey both the theoretical and the empirical literaturerelated to our work. The purpose of this review is twofold. First, we want to describe thetheoretical mechanisms that may justify the existence of a causal link between thegeographical incidence of migrants and their employment. Second, we want todocument the variety of empirical strategies that have been used to address the difficultidentification problems of this literature.
Partly because of the large differences in the econometric methodologies, theempirical findings are mixed and particularly scant for Europe, notably for SouthernEurope, where illegal migration is pervasive.
© 2015 Royal Economic Society.
F84 TH E E CONOM I C J O U RN A L [ A U G U S T
1.1. Theoretical Mechanisms
In this subsection, we review the theoretical mechanisms that may explain why living inneighbourhoods with a high concentration of migrants may affect their labour marketoutcomes. Several theories have been proposed, pointing to either positive or negativeeffects. The latter are generally attributed to the fact that the neighbourhoods are seen asghettos, spatially and socially separated from the majority society. Positive effects, on theother hand, are normally associated with the idea that migrant neighbourhoods can belaunching pads, helping the newcomers to establish themselves in the majority society.
The ghettos hypothesis is long-standing in the literature. The underlying mechanismoperates either on the labour supply side or via the demand of employers.
On the supply side, commuting and information frictions associated with the distanceof ghettos frommajor centres of employment reduce the effectiveness (Ihlanfeldt, 1997;Wasmer and Zenou, 2002), the intensity (Smith and Zenou, 2003; Patacchini and Zenou,2006) and the spatial horizon (Coulson et al., 2001; Brueckner and Zenou, 2003; Gautierand Zenou, 2010) of job search. Social interactions may also be at work.2 Ethnicminorities are over-represented among the unemployed, hence they have fewerconnections to employed workers making it more difficult to access information aboutjobs (Hellerstein et al., 2008). Also, infrequent interactions with natives reduceincentives to acquire host-country specific human capital (Chiswick, 1991; ChiswickandMiller, 1995; Lazear, 1999). Social distance and physical distance are self-reinforcingin this context, because migrants living far from business centres rely mainly on theirstrong ties, who aremore likely to be unemployed, rather than on their weak ties, who areknown to be the main source of connections to jobs (Zenou, 2013).3 Limited access tolocal services, such as childcare facilities, also places individuals in migrant neighbour-hoods at a disadvantage (Musterd and Andersson, 2005).
On the demand side, employers may discriminate against residentially segregatedworkers because of the stigma or prejudice associated with their residential location(Boccard and Zenou, 2000). This procedure, often labelled redlining, can encompassboth prejudices against social or racial groups and statistical discrimination. Distantworkers may also have relatively low productivity due to the long commuting, especiallywhere the transport system is unreliable and particularly in jobs which involve longbreaks during the day (such as waiter/waitress). Firms may then choose not to hireworkers residing beyond a certain distance from their locations (Wilson, 1996; Zenou,2002). Finally, employers may also discriminate against ghetto residents to satisfy theprejudices of their local customers (Borjas and Bronars, 1989).
A positive association between large shares of resident migrants and theiremployment is predicted by the literature on the cumulative causation of migrationflows (Walker and Hannan, 1989; Massey, 1990; Massey and Espinosa, 1997; Masseyet al., 1998; Massey and Zenteno, 1999). This theory postulates that each act ofmigration creates social capital among those to whom the migrant is related, inducingnew people to migrate and, thus, creating a network that can be useful in job search
2 See the excellent literature reviews by Ioannides and Loury (2004) and Ioannides (2012).3 According to Granovetter (1973, 1974, 1983), weak ties are acquaintances who are not necessarily
connected with one another by family or friendship links.
© 2015 Royal Economic Society.
2015] I MM I G R A T I O N , H OU S I N G A ND EM P LO YM E N T F85
(Ioannides and Loury, 2004; Pellizzari, 2010). This mechanism is likely to beparticularly strong within ethnic minorities, whose members often concentrate inspecific jobs (Loury, 1977; Edin et al., 2003; Damm, 2009; Patacchini and Zenou,2012). In these theories, ethnic social networks mainly play the role of facilitating thetransmission of information (Phelps, 1972) and, by doing so, they help newcomers tosettle down in the receiving country (Bonacich and Light, 1988; Waldinger, 1996;Portes, 1998). Ethnic niches also often provide a refuge for immigrants whoare discriminated against in the primary labour market (Li, 1998) and immigrantentrepreneurs may greatly benefit through reduced risk and costs of hiring membersof their same groups (Bach and Portes, 1985; Bailey and Waldinger, 1991; Newman,1999; Wang, 2004). Additionally, ethnic social networks may play a role in dissemi-nating information about welfare eligibility, thus increasing take-up rates amongmigrants (Bertrand et al., 2000; Pellizzari, 2013). Finally, ethnic networks shape thenorms of individual co-ethnic members, potentially affecting their labour marketoutcomes through, for instance, peer group pressure (Granovetter, 1985), an effectwhich is likely to be more important when newcomers are more skilled and there ismore human capital in the co-ethnic community (Borjas, 1995; Cutler and Glaeser,1997; Edin et al., 2003; Kahanec, 2006; Damm, 2009).
1.2. Empirical Studies
The early empirical literature on the effects of residential concentration on theemployment prospects of migrants treats residential location as exogenous anddocuments a strongnegative effect of residential segregationon labourmarket outcomes(Borjas, 1987; Chiswick and Miller, 2005; Kahanec, 2006). In particular, the correlationbetween the employment of ethnic minorities and their physical distance from majorbusiness centres, according to the spatial mismatch hypothesis has been extensivelyinvestigated (Kain, 1968; Ihlanfeldt, 1991; Ihlanfeldt and Sjoquist, 1998; Zenou, 2008).
However, residential location is obviously endogenous and any causal inferencemade in this literature is questionable. Self-selection and unobserved heterogeneity,rather than distance to jobs, may explain the association of lower employment andhigher residential concentration among migrants and ethnic minorities moregenerally. Causality might actually run from employment to job access, as betterlabour market outcomes of workers in some neighbourhoods may attract firms into thearea (Ihlanfeldt, 1991). As noted by Ihlanfeldt (1992), if the simultaneity betweenemployment and residential location is ignored, the estimated effect of job access onemployment will likely be biased towards zero.
Two main strategies have been pursued to deal with these endogeneity problems, inparticular to those related to endogenous sorting into neighbourhoods, one based onobservational studies and one using experimental (or quasi experimental) variation.
1.2.1. Observational studiesA relatively large set of observational studies address the problem of sorting by exploitingcross-metropolitan variation in the incidence ofmigrants and assuming that sorting acrossmetropolitan areas is orthogonal to the outcome under consideration (Evans et al., 1992;Cutler and Glaeser, 1997; Ross, 1998; Gabriel and Rosenthal, 1999; Bertrand et al., 2000;
© 2015 Royal Economic Society.
F86 TH E E CONOM I C J O U RN A L [ A U G U S T
Weinberg, 2000, 2004; Card and Rothstein, 2007; Ross and Zenou, 2008). The commonfinding of these studies is a negative employment effect of residential concentration.
Another approach consists in analysing youngworkers residing with their parents, whoare assumed to have chosen their place of residence for their children (Borjas, 1995;Raphael, 1998). These studies also find anegative link between the incidence ofmigrantsin one’s location of residence and their employment. However, if parents and childrenshare similar unobservable traits and/or parents decide where to reside considering theemployment prospects of their children, the youth approach becomes invalid.
A different identification strategy is based on instrumental variables and uses laggedimmigrant density to instrument its current level. The key identification assumption inthis approach is the orthogonality between the factors that influenced immigrants’settlements in the past and in the present, apart from their effect through the currentpresence of immigrants. Such a strategy has been extensively used in the US literature(Walker and Hannan, 1989; Altonji and Card, 1991; Conley and Topa, 1999; Masseyand Zenteno, 1999; Falcon and Melendez, 2001; Mouw, 2002; Munshi, 2003; Falcon,2007). Patacchini and Zenou (2012) used this identification strategy on data for theUK they show a positive employment effect of ethnic population density. This is one ofthe very few studies in Europe. Some evidence on the role of ethnic networks infinding a job can be found in Frijters et al. (2005) and Battu et al. (2011), althoughthese studies are not explicitly focused on residential concentration.
Bayer et al. (2008) use an alternative approach. They draw on data from the USCensus, disaggregated at the level of the city block and city blocks are grouped intosmall sets of adjacent areas. This enables them to condition on block-group fixedeffects in their regression analysis to isolate block-level variation in neighbourattributes. Their identifying (untestable) assumption is the absence of correlation inunobservables across blocks within block groups. They find evidence of significantsocial interactions operating at the block level: residing in the same versus nearbyblocks increases the probability of working for the same employer by over 33%. Theirresults also indicate that this referral effect is stronger when individuals are similar insocio-demographic characteristics and when at least one individual is well attached tothe labour market.
1.2.2. Experimental (and quasi-experimental) studiesEdin et al. (2003) and Damm (2009) make use of natural experiments in Sweden andDenmark, respectively. In both countries the residential choices of migrants werelimited by governmental policies that either explicitly randomised (conditional on aset of observables) or were arguably exogenous to labour market conditions.
Edin et al. (2003) document immigrant earning gains of about 13% following astandard deviation increase in local ethnic group size. Damm (2009) finds a similareffect for earnings (about 18%), while the effect on employment is negative for high-educated individuals and virtually zero for the low educated.4
While the use of random assignment across municipalities is attractive, these studiesare not without their shortcomings. These include small sample sizes, the large margin
4 Recently, Beckers and Borghans (2011) exploit a similar natural experiment in the Netherlands and findsimilar, although stronger, results.
© 2015 Royal Economic Society.
2015] I MM I G R A T I O N , H OU S I N G A ND EM P LO YM E N T F87
of error in the definition of the treated population and the use of municipalities as thegeographical unit of interest.5
In the US, some papers were inspired by the two major programmes of residentialmobility: the Gautreaux programme, implemented in Chicago (1976–90), and theMoving to Opportunity programme (MTO), implemented in five major cities(Baltimore, Boston, Chicago, Los Angeles and New York) between 1994 and 1999.6
Assessing the employment effects of the Gautreaux programme, Harris and Rosen-baum (2001) find higher employment but no difference in wages or hours worked forthose who moved to the suburbs compared with those who moved to the central city.Mendenhall et al. (2006) study the effect of the programme on low-income blackfemales and find no difference between movers to suburbs and movers to the centralcity. Katz et al. (2001) find no effect of MTO on either employment or earnings.
Finally, Holzer et al. (2003) uses exogenous variation in job access generated by theunanticipated opening of a new transit line to control for sorting across neighbour-hoods and he finds that employment effects are positive and greatest for those residingnearest to the origin of the new transit road.
2. Data and Descriptive Evidence
2.1. Data
Our analysis is based on data from a new survey of immigrants, which was carried outbetween October and November 2009 in eight cities in Northern Italy: Alessandria,Brescia, Bologna, Lucca, Milano, Prato, Rimini and Verona. The cities were chosennon-randomly to represent agglomerations of different sizes (large, medium-sized andsmall) while at the same time guaranteeing a good degree of representativeness of theentire population of the North of Italy, where more than 60% of the non-Italianresidents are located.
Table A1 in the Appendix reports some key characteristics of these cities, comparingthem to the averages in the country and showing that they offer a good representationof the population of the North of Italy.
The sampling procedure of our survey was designed with the intention of reachingparticularly hard-to-trace segments of thepopulation, namely immigrants, both legal andillegal.Migrants are grouped into threemacro regions of origin and the survey guaranteesrepresentative results only within these three subpopulations: European new memberstates (NMS),7 Western Balkan countries (WBC)8 and all other countries of origin.9
The sampling strategy consists of three main steps: in the first stage, we sampleneighbourhoods separately in each of the eight cities and then, in the second stage, we
5 Conley and Topa (1999) and Bayer et al. (2008) show that the relevant neighbours are those in the closevicinity.
6 The Gautreaux programme targeted black families residing in poor neighbourhoods and handed themrental vouchers to move to predominantly white or racially mixed areas. The MTO programme was inspiredby the Gautreaux programme but the target was inner-city low income families with children living in publichousing.
7 Bulgaria, Czech Republic, Estonia, Hungary, Latvia, Lithuania, Poland, Romania, Slovakia and Slovenia.8 Albania, Bosnia, Croatia, Macedonia, Kosovo, Montenegro and Serbia.9 The focus on EU new member states and the Western Balkan countries was imposed by the European
Bank for Reconstruction and Development (EBRD), the sponsor of the study.
© 2015 Royal Economic Society.
F88 TH E E CONOM I C J O U RN A L [ A U G U S T
select one block of buildings in each of the sampled neighbourhoods where, in thefinal stage, the individuals to be interviewed are randomly chosen.
The neighbourhoods are selected with sampling probabilities that are proportionalto the share of legal migrants resident in the area, as measured by the officialpopulation registers. Then, a purposely designed algorithm randomly selects one pointon the official map of each sampled neighbourhood and the blocks that are closest tosuch points are included in the survey.10 In order to increase sample size additionalblocks are selected based on a proximity criterion. Namely, we also include in thesurvey blocks that are adjacent to one (or more) of the randomly selected blocks wherethe share of dwellings occupied by immigrant households is higher than a fixedthreshold.11
In each selected block, a census of residential units is carried out on the basis of acombination of conversations with the buildings’ janitors and short door-to-door visits.The census provides a list of apartments for each of the four groups (NMS, WBS, othernon-Italians and Italians). It is used to randomly select four households for each of theabove population groups. One adult (older than 18 years old) in each household israndomly chosen for the interview. Hence, a maximum of 16 persons are eventuallyinterviewed in each block. However, in most blocks there are fewer than 16 interviewsbecause there were fewer than four persons in some of the population groups.12
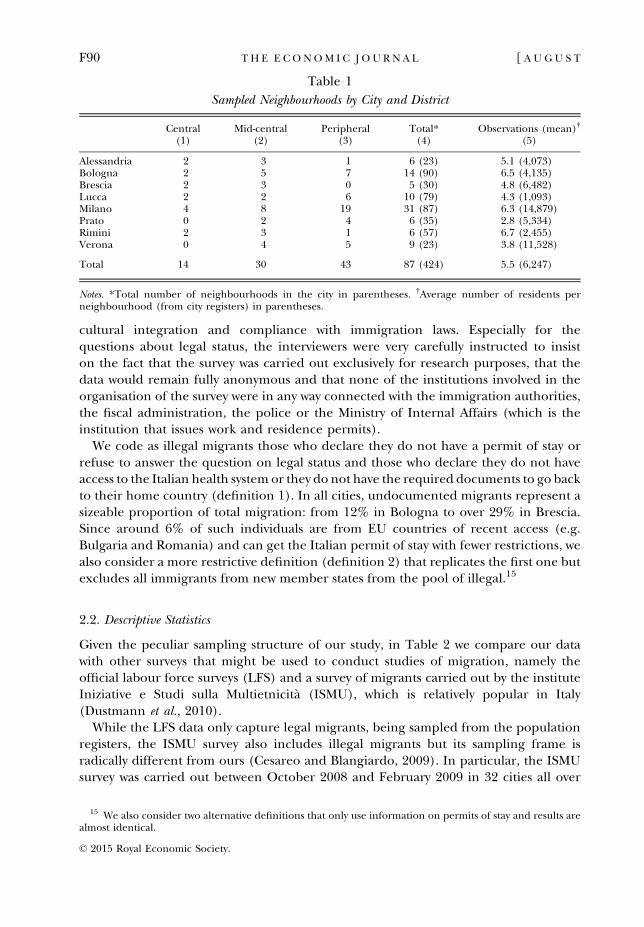
Table 1 summarises the sampling procedure. Each city is divided into three districts:central, mid-central and peripheral. The first three columns of the Table indicate foreach city and district the number of sampled neighbourhoods, which, ignoring theblocks selected with the proximity criterion, is equivalent to the number of blocks. Thefourth column simply sums over the first three and reports the total number ofsampled neighbourhoods. The average number of interviews/observations perneighbourhood is shown in column 5. In columns 4 and 5, we also show inparentheses the total number of neighbourhoods in the city (column 4) and theaverage population in the neighbourhoods (column 5), so as to give an indication ofthe coverage of our sample.13
The census of the residential units in each block is a particularly precious source ofinformation. Official population registers from the city councils only consider legalimmigrants, whereas our census includes both legal and illegal residents, living, eitherpermanently and temporarily, in the considered blocks.
Although the survey includes both migrants and natives, for this study we onlyconsider the subsample of migrants.14 Interviewees are asked questions on individualand family characteristics, reasons behind migration, living and work conditions,
10 The website http://v.controul.com/app/ shows exactly which blocks were chosen in each neighbour-hood. Blocks are defined as portions of urban surface that are built-up and continuous, that is notinterrupted by areas for traffic circulation or allocated for public use (e.g. parks).
11 Since the randomly selected blocks that satisfy the threshold criterion are usually adjacent to severalother blocks, only the one adjacent block with the highest incidence of immigrants is selected.
12 Non-response bias is very low: interviewers are asked to visit the selected households several times and atdifferent times of the day. In case the selected individual refuses to answer or is unreachable, a replacementunit is drawn from a reserve list.
13 Note that sampled blocks are much smaller than sampled neighbourhoods and have, on average, apopulation of 208 residential units.
14 Some information on natives will be used in Table 10.
© 2015 Royal Economic Society.
2015] I MM I G R A T I O N , H OU S I N G A ND EM P LO YM E N T F89
cultural integration and compliance with immigration laws. Especially for thequestions about legal status, the interviewers were very carefully instructed to insiston the fact that the survey was carried out exclusively for research purposes, that thedata would remain fully anonymous and that none of the institutions involved in theorganisation of the survey were in any way connected with the immigration authorities,the fiscal administration, the police or the Ministry of Internal Affairs (which is theinstitution that issues work and residence permits).
We code as illegal migrants those who declare they do not have a permit of stay orrefuse to answer the question on legal status and those who declare they do not haveaccess to the Italian health system or they do not have the required documents to go backto their home country (definition 1). In all cities, undocumented migrants represent asizeable proportion of total migration: from 12% in Bologna to over 29% in Brescia.Since around 6% of such individuals are from EU countries of recent access (e.g.Bulgaria and Romania) and can get the Italian permit of stay with fewer restrictions, wealso consider a more restrictive definition (definition 2) that replicates the first one butexcludes all immigrants from new member states from the pool of illegal.15
2.2. Descriptive Statistics
Given the peculiar sampling structure of our study, in Table 2 we compare our datawith other surveys that might be used to conduct studies of migration, namely theofficial labour force surveys (LFS) and a survey of migrants carried out by the instituteIniziative e Studi sulla Multietnicit�a (ISMU), which is relatively popular in Italy(Dustmann et al., 2010).
While the LFS data only capture legal migrants, being sampled from the populationregisters, the ISMU survey also includes illegal migrants but its sampling frame isradically different from ours (Cesareo and Blangiardo, 2009). In particular, the ISMUsurvey was carried out between October 2008 and February 2009 in 32 cities all over
Table 1
Sampled Neighbourhoods by City and District
Central Mid-central Peripheral Total* Observations (mean)†
(1) (2) (3) (4) (5)
Alessandria 2 3 1 6 (23) 5.1 (4,073)Bologna 2 5 7 14 (90) 6.5 (4,135)Brescia 2 3 0 5 (30) 4.8 (6,482)Lucca 2 2 6 10 (79) 4.3 (1,093)Milano 4 8 19 31 (87) 6.3 (14,879)Prato 0 2 4 6 (35) 2.8 (5,334)Rimini 2 3 1 6 (57) 6.7 (2,455)Verona 0 4 5 9 (23) 3.8 (11,528)
Total 14 30 43 87 (424) 5.5 (6,247)
Notes. *Total number of neighbourhoods in the city in parentheses. †Average number of residents perneighbourhood (from city registers) in parentheses.
15 We also consider two alternative definitions that only use information on permits of stay and results arealmost identical.
© 2015 Royal Economic Society.
F90 TH E E CONOM I C J O U RN A L [ A U G U S T
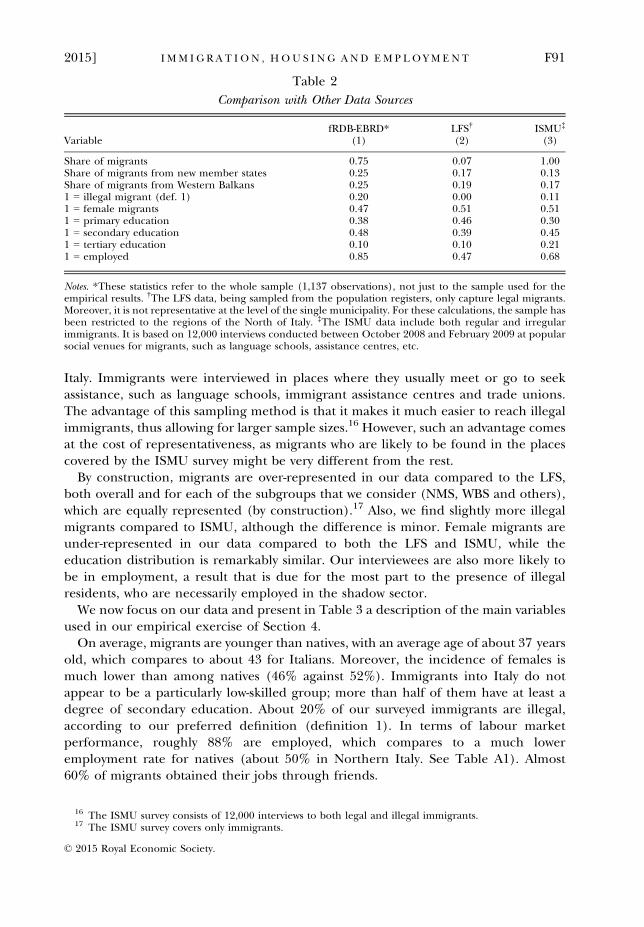
Italy. Immigrants were interviewed in places where they usually meet or go to seekassistance, such as language schools, immigrant assistance centres and trade unions.The advantage of this sampling method is that it makes it much easier to reach illegalimmigrants, thus allowing for larger sample sizes.16 However, such an advantage comesat the cost of representativeness, as migrants who are likely to be found in the placescovered by the ISMU survey might be very different from the rest.
By construction, migrants are over-represented in our data compared to the LFS,both overall and for each of the subgroups that we consider (NMS, WBS and others),which are equally represented (by construction).17 Also, we find slightly more illegalmigrants compared to ISMU, although the difference is minor. Female migrants areunder-represented in our data compared to both the LFS and ISMU, while theeducation distribution is remarkably similar. Our interviewees are also more likely tobe in employment, a result that is due for the most part to the presence of illegalresidents, who are necessarily employed in the shadow sector.
We now focus on our data and present in Table 3 a description of the main variablesused in our empirical exercise of Section 4.
On average, migrants are younger than natives, with an average age of about 37 yearsold, which compares to about 43 for Italians. Moreover, the incidence of females ismuch lower than among natives (46% against 52%). Immigrants into Italy do notappear to be a particularly low-skilled group; more than half of them have at least adegree of secondary education. About 20% of our surveyed immigrants are illegal,according to our preferred definition (definition 1). In terms of labour marketperformance, roughly 88% are employed, which compares to a much loweremployment rate for natives (about 50% in Northern Italy. See Table A1). Almost60% of migrants obtained their jobs through friends.
Table 2
Comparison with Other Data Sources
VariablefRDB-EBRD* LFS† ISMU‡
(1) (2) (3)
Share of migrants 0.75 0.07 1.00Share of migrants from new member states 0.25 0.17 0.13Share of migrants from Western Balkans 0.25 0.19 0.171 = illegal migrant (def. 1) 0.20 0.00 0.111 = female migrants 0.47 0.51 0.511 = primary education 0.38 0.46 0.301 = secondary education 0.48 0.39 0.451 = tertiary education 0.10 0.10 0.211 = employed 0.85 0.47 0.68
Notes. *These statistics refer to the whole sample (1,137 observations), not just to the sample used for theempirical results. †The LFS data, being sampled from the population registers, only capture legal migrants.Moreover, it is not representative at the level of the single municipality. For these calculations, the sample hasbeen restricted to the regions of the North of Italy. ‡The ISMU data include both regular and irregularimmigrants. It is based on 12,000 interviews conducted between October 2008 and February 2009 at popularsocial venues for migrants, such as language schools, assistance centres, etc.
16 The ISMU survey consists of 12,000 interviews to both legal and illegal immigrants.17 The ISMU survey covers only immigrants.
© 2015 Royal Economic Society.
2015] I MM I G R A T I O N , H OU S I N G A ND EM P LO YM E N T F91
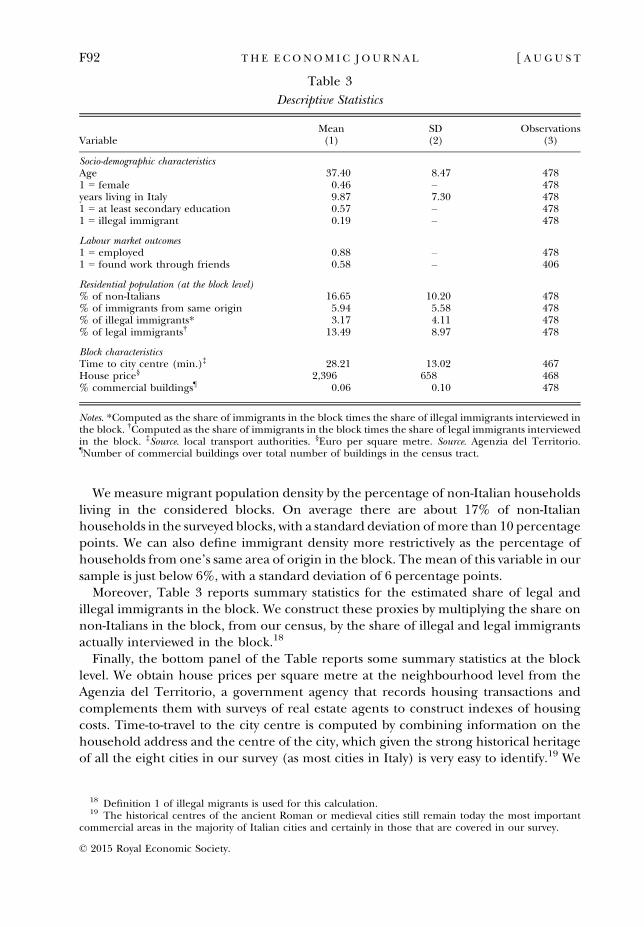
Wemeasure migrant population density by the percentage of non-Italian householdsliving in the considered blocks. On average there are about 17% of non-Italianhouseholds in the surveyed blocks, with a standard deviation ofmore than 10 percentagepoints. We can also define immigrant density more restrictively as the percentage ofhouseholds from one’s same area of origin in the block. Themean of this variable in oursample is just below 6%, with a standard deviation of 6 percentage points.
Moreover, Table 3 reports summary statistics for the estimated share of legal andillegal immigrants in the block. We construct these proxies by multiplying the share onnon-Italians in the block, from our census, by the share of illegal and legal immigrantsactually interviewed in the block.18
Finally, the bottom panel of the Table reports some summary statistics at the blocklevel. We obtain house prices per square metre at the neighbourhood level from theAgenzia del Territorio, a government agency that records housing transactions andcomplements them with surveys of real estate agents to construct indexes of housingcosts. Time-to-travel to the city centre is computed by combining information on thehousehold address and the centre of the city, which given the strong historical heritageof all the eight cities in our survey (as most cities in Italy) is very easy to identify.19 We
Table 3
Descriptive Statistics
VariableMean SD Observations(1) (2) (3)
Socio-demographic characteristicsAge 37.40 8.47 4781 = female 0.46 – 478years living in Italy 9.87 7.30 4781 = at least secondary education 0.57 – 4781 = illegal immigrant 0.19 – 478
Labour market outcomes1 = employed 0.88 – 4781 = found work through friends 0.58 – 406
Residential population (at the block level)% of non-Italians 16.65 10.20 478% of immigrants from same origin 5.94 5.58 478% of illegal immigrants* 3.17 4.11 478% of legal immigrants† 13.49 8.97 478
Block characteristicsTime to city centre (min.)‡ 28.21 13.02 467House price§ 2,396 658 468% commercial buildings¶ 0.06 0.10 478
Notes. *Computed as the share of immigrants in the block times the share of illegal immigrants interviewed inthe block. †Computed as the share of immigrants in the block times the share of legal immigrants interviewedin the block. ‡Source. local transport authorities. §Euro per square metre. Source. Agenzia del Territorio.¶Number of commercial buildings over total number of buildings in the census tract.
18 Definition 1 of illegal migrants is used for this calculation.19 The historical centres of the ancient Roman or medieval cities still remain today the most important
commercial areas in the majority of Italian cities and certainly in those that are covered in our survey.
© 2015 Royal Economic Society.
F92 TH E E CONOM I C J O U RN A L [ A U G U S T
then use the online websites of the local transport authorities to compute the time (inminutes) necessary to travel to the centre by public transport.
Finally, we include some variables obtained by merging our survey with the auxiliarydatabase of census tracts from the 2001 official census of the Italian population. Besideaggregate population variables, the database also contains a large set of descriptivecharacteristics of the buildings in the tract and it is the source used to construct ourinstrument in Section 3.20 In Table 3, we show the share of commercial buildings in theblock as a proxy for the presence of jobs in the neighbourhood.21
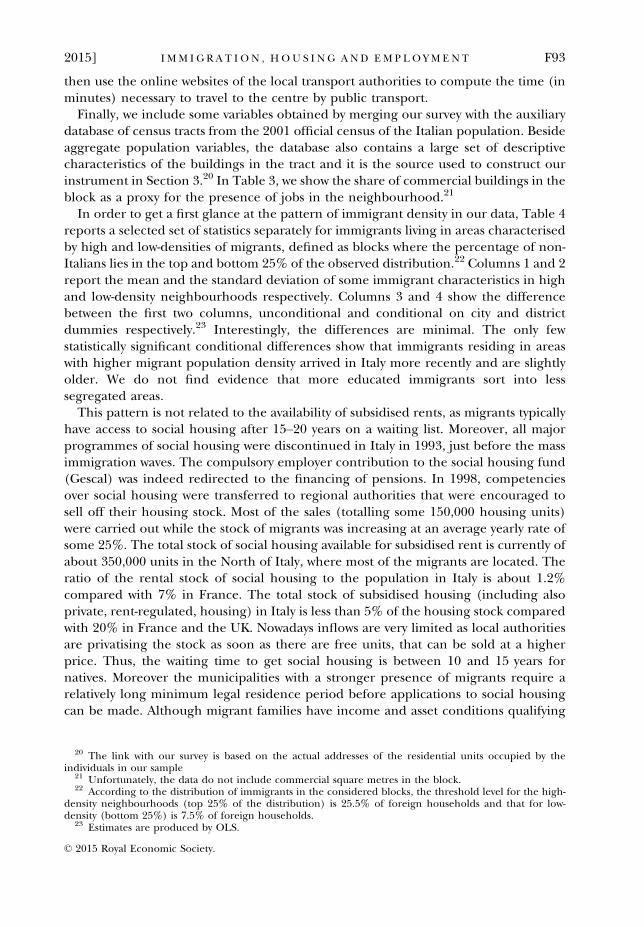
In order to get a first glance at the pattern of immigrant density in our data, Table 4reports a selected set of statistics separately for immigrants living in areas characterisedby high and low-densities of migrants, defined as blocks where the percentage of non-Italians lies in the top and bottom 25% of the observed distribution.22 Columns 1 and 2report the mean and the standard deviation of some immigrant characteristics in highand low-density neighbourhoods respectively. Columns 3 and 4 show the differencebetween the first two columns, unconditional and conditional on city and districtdummies respectively.23 Interestingly, the differences are minimal. The only fewstatistically significant conditional differences show that immigrants residing in areaswith higher migrant population density arrived in Italy more recently and are slightlyolder. We do not find evidence that more educated immigrants sort into lesssegregated areas.
This pattern is not related to the availability of subsidised rents, as migrants typicallyhave access to social housing after 15–20 years on a waiting list. Moreover, all majorprogrammes of social housing were discontinued in Italy in 1993, just before the massimmigration waves. The compulsory employer contribution to the social housing fund(Gescal) was indeed redirected to the financing of pensions. In 1998, competenciesover social housing were transferred to regional authorities that were encouraged tosell off their housing stock. Most of the sales (totalling some 150,000 housing units)were carried out while the stock of migrants was increasing at an average yearly rate ofsome 25%. The total stock of social housing available for subsidised rent is currently ofabout 350,000 units in the North of Italy, where most of the migrants are located. Theratio of the rental stock of social housing to the population in Italy is about 1.2%compared with 7% in France. The total stock of subsidised housing (including alsoprivate, rent-regulated, housing) in Italy is less than 5% of the housing stock comparedwith 20% in France and the UK. Nowadays inflows are very limited as local authoritiesare privatising the stock as soon as there are free units, that can be sold at a higherprice. Thus, the waiting time to get social housing is between 10 and 15 years fornatives. Moreover the municipalities with a stronger presence of migrants require arelatively long minimum legal residence period before applications to social housingcan be made. Although migrant families have income and asset conditions qualifying
20 The link with our survey is based on the actual addresses of the residential units occupied by theindividuals in our sample
21 Unfortunately, the data do not include commercial square metres in the block.22 According to the distribution of immigrants in the considered blocks, the threshold level for the high-
density neighbourhoods (top 25% of the distribution) is 25.5% of foreign households and that for low-density (bottom 25%) is 7.5% of foreign households.
23 Estimates are produced by OLS.
© 2015 Royal Economic Society.
2015] I MM I G R A T I O N , H OU S I N G A ND EM P LO YM E N T F93
them for priority in the queue, their waiting period is therefore longer than that ofnatives as they have to wait first for the regularisation and then for the completion ofthe minimum legal residence period.
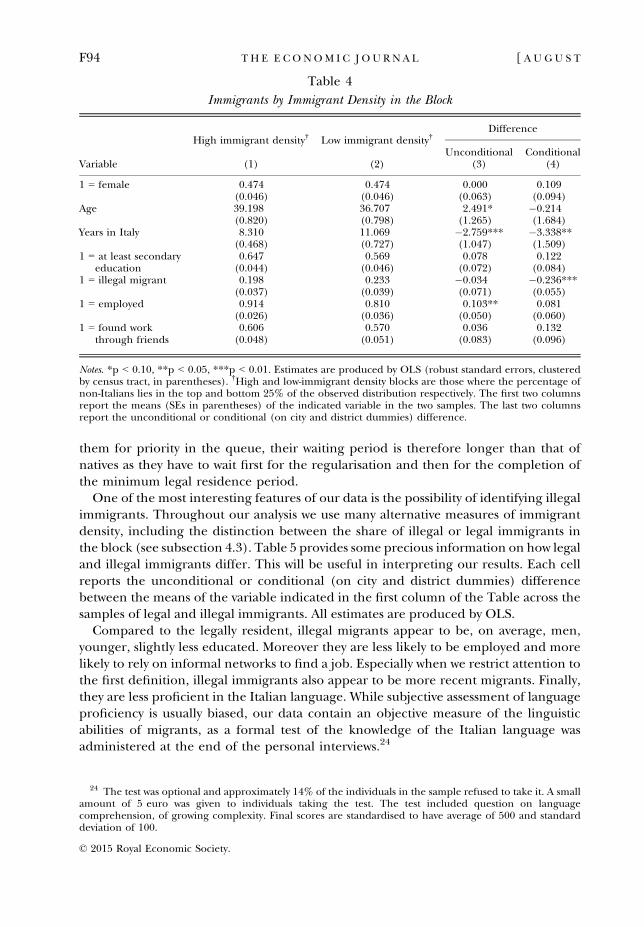
One of the most interesting features of our data is the possibility of identifying illegalimmigrants. Throughout our analysis we use many alternative measures of immigrantdensity, including the distinction between the share of illegal or legal immigrants inthe block (see subsection 4.3). Table 5 provides some precious information on how legaland illegal immigrants differ. This will be useful in interpreting our results. Each cellreports the unconditional or conditional (on city and district dummies) differencebetween the means of the variable indicated in the first column of the Table across thesamples of legal and illegal immigrants. All estimates are produced by OLS.
Compared to the legally resident, illegal migrants appear to be, on average, men,younger, slightly less educated. Moreover they are less likely to be employed and morelikely to rely on informal networks to find a job. Especially when we restrict attention tothe first definition, illegal immigrants also appear to be more recent migrants. Finally,they are less proficient in the Italian language. While subjective assessment of languageproficiency is usually biased, our data contain an objective measure of the linguisticabilities of migrants, as a formal test of the knowledge of the Italian language wasadministered at the end of the personal interviews.24
Table 4
Immigrants by Immigrant Density in the Block
Variable
High immigrant density† Low immigrant density†Difference
Unconditional Conditional(1) (2) (3) (4)
1 = female 0.474 0.474 0.000 0.109(0.046) (0.046) (0.063) (0.094)
Age 39.198 36.707 2.491* �0.214(0.820) (0.798) (1.265) (1.684)
Years in Italy 8.310 11.069 �2.759*** �3.338**(0.468) (0.727) (1.047) (1.509)
1 = at least secondaryeducation
0.647 0.569 0.078 0.122(0.044) (0.046) (0.072) (0.084)
1 = illegal migrant 0.198 0.233 �0.034 �0.236***(0.037) (0.039) (0.071) (0.055)
1 = employed 0.914 0.810 0.103** 0.081(0.026) (0.036) (0.050) (0.060)
1 = found workthrough friends
0.606 0.570 0.036 0.132(0.048) (0.051) (0.083) (0.096)
Notes. *p < 0.10, **p < 0.05, ***p < 0.01. Estimates are produced by OLS (robust standard errors, clusteredby census tract, in parentheses). †High and low-immigrant density blocks are those where the percentage ofnon-Italians lies in the top and bottom 25% of the observed distribution respectively. The first two columnsreport the means (SEs in parentheses) of the indicated variable in the two samples. The last two columnsreport the unconditional or conditional (on city and district dummies) difference.
24 The test was optional and approximately 14% of the individuals in the sample refused to take it. A smallamount of 5 euro was given to individuals taking the test. The test included question on languagecomprehension, of growing complexity. Final scores are standardised to have average of 500 and standarddeviation of 100.
© 2015 Royal Economic Society.
F94 TH E E CONOM I C J O U RN A L [ A U G U S T
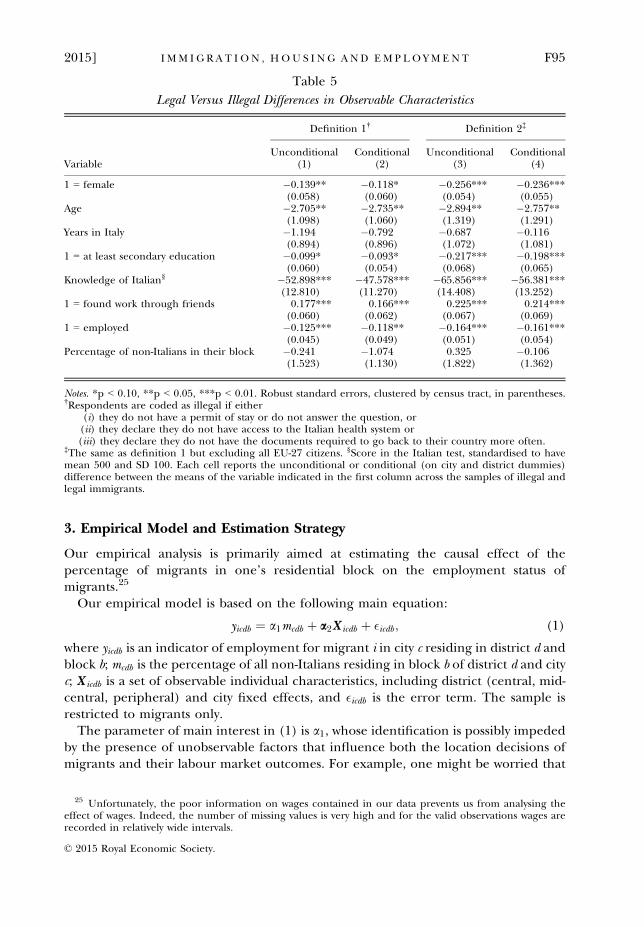
3. Empirical Model and Estimation Strategy
Our empirical analysis is primarily aimed at estimating the causal effect of thepercentage of migrants in one’s residential block on the employment status ofmigrants.25
Our empirical model is based on the following main equation:
yicdb ¼ a1mcdb þ a2X icdb þ �icdb ; (1)
where yicdb is an indicator of employment for migrant i in city c residing in district d andblock b; mcdb is the percentage of all non-Italians residing in block b of district d and cityc; X icdb is a set of observable individual characteristics, including district (central, mid-central, peripheral) and city fixed effects, and �icdb is the error term. The sample isrestricted to migrants only.
The parameter of main interest in (1) is a1, whose identification is possibly impededby the presence of unobservable factors that influence both the location decisions ofmigrants and their labour market outcomes. For example, one might be worried that
Table 5
Legal Versus Illegal Differences in Observable Characteristics
Variable
Definition 1† Definition 2‡
Unconditional Conditional Unconditional Conditional(1) (2) (3) (4)
1 = female �0.139** �0.118* �0.256*** �0.236***(0.058) (0.060) (0.054) (0.055)
Age �2.705** �2.735** �2.894** �2.757**(1.098) (1.060) (1.319) (1.291)
Years in Italy �1.194 �0.792 �0.687 �0.116(0.894) (0.896) (1.072) (1.081)
1 = at least secondary education �0.099* �0.093* �0.217*** �0.198***(0.060) (0.054) (0.068) (0.065)
Knowledge of Italian§ �52.898*** �47.578*** �65.856*** �56.381***(12.810) (11.270) (14.408) (13.252)
1 = found work through friends 0.177*** 0.166*** 0.225*** 0.214***(0.060) (0.062) (0.067) (0.069)
1 = employed �0.125*** �0.118** �0.164*** �0.161***(0.045) (0.049) (0.051) (0.054)
Percentage of non-Italians in their block �0.241 �1.074 0.325 �0.106(1.523) (1.130) (1.822) (1.362)
Notes. *p < 0.10, **p < 0.05, ***p < 0.01. Robust standard errors, clustered by census tract, in parentheses.†Respondents are coded as illegal if either
(i) they do not have a permit of stay or do not answer the question, or(ii) they declare they do not have access to the Italian health system or(iii) they declare they do not have the documents required to go back to their country more often.
‡The same as definition 1 but excluding all EU-27 citizens. §Score in the Italian test, standardised to havemean 500 and SD 100. Each cell reports the unconditional or conditional (on city and district dummies)difference between the means of the variable indicated in the first column across the samples of illegal andlegal immigrants.
25 Unfortunately, the poor information on wages contained in our data prevents us from analysing theeffect of wages. Indeed, the number of missing values is very high and for the valid observations wages arerecorded in relatively wide intervals.
© 2015 Royal Economic Society.
2015] I MM I G R A T I O N , H OU S I N G A ND EM P LO YM E N T F95
residentially segregated migrants are negatively selected, as only the very high abilitycan afford to live in native-dominated neighbourhoods and high-ability workers alsoexperience better labour market outcomes, regardless of where they live. Such amechanism would bias a1 downwards in standard OLS. Additionally, there might alsobe unobservable factors at the block level that affect both the migrant’s probability oflocating in the block as well as labour market success, such as the availability of somepublic services (employment services, public transport). Finally, our regressor ofinterest, being based on conversations with buildings’ janitors and door-to-doorconversations, is likely to be affected by measurement error. Although it is difficult toassess the exact extent of mismeasurement, the assumption of classical measurementerror seems quite plausible in our setting, so that the resulting bias should draw theestimated parameter closer to zero.
Overall, it is hard to establish whether the total bias in simple OLS (or probit)estimates of (1) would be positive or negative.
We address the two issues of measurement error and omitted variable biasdifferently. For measurement error, we collected additional auxiliary informationabout the implementation of the survey, namely individual characteristics of theinterviewers and their evaluations of the overall quality of each single interview.Assuming that the measurement error is a linear function of such variables, it ispossible to rewrite an augmented version of (1) which includes interviewer’characteristics as additional explanatory variables to eliminate the bias due tomeasurement error in mcdb .
26
The bias from omitted variables is the key identification issue in this literature and ithas been addressed in many different ways by previous studies, as we discussed insubsection 1.2. Our identification strategy rests on the use of an instrumental variablethat has never been previously proposed. Moreover, in subsection 4.2, we replicate ourresults using an alternative approach that mimics closely the prominent study by Bayeret al. (2008), which compares adjacent blocks within small groups of buildings. Giventhe particular sampling structure of our data, only a small subsample of our survey canbe used for this purpose, so that the first approach, the instrumental variable strategy,is more powerful in our setting (see Section 1 for details).
Specifically, we use the building structure of the block 10 years before the survey toinstrument the percentage of migrants currently residing in the area. Using the actualaddresses of the residential units of the individuals in our sample, we have linked ourdata to an ancillary database of the 2001 Italian population census. Such an ancillarydatabase contains a large set of descriptive characteristics of each single city block inItaly, including the total number of buildings and the total amount of square metres(i.e. the sum of the square metres of each floor in each building) in the block, brokendown by residential and commercial space. We use these data to calculate the ratio of
26 In order to clarify our approach to measurement error, assume mcdb is the true variable andm�
cdb ¼ mcdb þ ucdb is its mismeasured analogue with ucdb being the error of measurement. Further assumethat ucdb is the sum of a linear function of observables (in our specification, the individual characteristics ofthe interviewers and their evaluations of the overall quality of each single interview) and a purely randomterm: ucdb ¼ cZcdb þ vcdb . Then, replacing and rearranging terms in (1) yields the following augmentedversion of the model yicdb ¼ a1mcdb þ a2X icdb � ða1cÞZcdb � a1vcdb þ �icdb which allows reducing the biasfrom measurement error.
© 2015 Royal Economic Society.
F96 TH E E CONOM I C J O U RN A L [ A U G U S T
residential square metres per residential building in the block, a variable that takeshigh values in areas that are dominated by large residential buildings (lots ofresidential square metres for few buildings) and low values in areas of detached orsemi-detached houses.27
The idea of this instrument builds on the literature on housing discrimination,which documents how migrants and other minorities find accommodation moredifficultly than natives, both on the renting and the property markets (Yinger, 1986;Page, 1995; Ondrich et al., 1999; Ahmed and Hammarstedt, 2008; Bosch et al., 2010;Baldini and Federici, 2011; Hanson and Hawley, 2011). The relevance of ourinstrument rests on the presumption that such type of discrimination is taste-based andthat natives, who predominantly populate the supply side of the housing market,dislike close interactions with migrants. As a consequence, they are less willing to rentor sell their properties to migrants, especially so where the urban structure isconductive of close interactions among residents, such as in neighbourhoods whereresidential space is concentrated in a small number of buildings.
The literature on housing discrimination provides numerous pieces of evidence insupport of our instrumental variable strategy. Firstly, all papers find a sizeable degreeof discrimination against migrants, both in the US and in Europe (Page, 1995; Ahmedand Hammarstedt, 2008; Bosch et al., 2010; Baldini and Federici, 2011; Hanson andHawley, 2011). Second, discrimination persists even when additional informationabout the potential renter/buyer is available (Ondrich et al., 1999; Ahmed et al., 2010;Bosch et al., 2010). This is an important finding because it allows documenting theextent to which discrimination is driven by each of the two most commonly citedsources, namely statistical and taste-based discrimination. In our specific application,statistical discrimination arises if landlords, who are primarily natives, prefer not torent their apartments to a migrant because they know that on average they are poorerthan natives and thus less likely to pay their rents regularly. Without specificinformation about the individual applicant, landlords base their decisions on theaverage characteristics of migrants. Hence, statistical discrimination should disappearor at least be limited when information about the individual candidate is provided.Ahmed et al. (2010); Bosch et al. (2010) show that providing such information doesnot eliminate discrimination. As a consequence, it must be that it arises, at least partly,by the fact that natives simply dislike interacting with migrants, a mechanism that iscommonly labelled as taste-based discrimination.
Discrimination in the Italian housing market has been recently documented byBaldini and Federici (2011), who selected a large sample of renting advertisements forhousing units throughout Italy that were posted on the Internet and sent fictitiousemail requests to visit such units. The only distinctive feature of the email messages wasthe name of the perspective tenant, which could be either typical Italian or typical ofArab or Eastern European origin. Emails were sent to advertisers according to arandom algorithm, so as to guarantee orthogonality of the characteristics of thefictitious perspective tenant and those of the apartments, a strategy that is common to
27 As far as we know, Bauer et al. (2011) is the only other paper that instruments migration at theneighbourhood level with some physical characteristics of the local buildings, although their specificinstrument is different from ours and the context is also different.
© 2015 Royal Economic Society.
2015] I MM I G R A T I O N , H OU S I N G A ND EM P LO YM E N T F97
other studies in this field (Carpusor and Loges, 2006; Ahmed et al., 2010). The studythen records responses to the email contacts and investigates whether the probabilityof a positive feedback varies with the ethnicity of the fictitious names.28 The resultsshow clear evidence of housing discrimination in the Italian market, especially inNorthern Italy, which is where our sampled cities are located.
We have been kindly given access to the data of Baldini and Federici (2011) and havemerged them with our instrumental variable at the level of the city to producesupporting evidence for our identification strategy.29 We then run an OLS regressionwith the ratio of the average rate of positive response for migrants and natives as adependent variable and the total amount of residential square metres over the totalnumber of residential buildings in the city as a main regressor of interest. Additionally,we include the city average of all the controls used by Baldini and Federici (2011) ascontrol variables, namely dummies for the week and the weekday when the email wassent, the log of the property size in square metres, the monthly rent per square metre,dummies for whether the advertisement was posted by an agency, whether theadvertisement included pictures, whether the email included additional informationabout the perspective tenant (family composition, occupation) and whether the emailincluded orthographic or grammar errors. There are 41 cities in the database and theregression weights them by the number of observations in the original microdata.
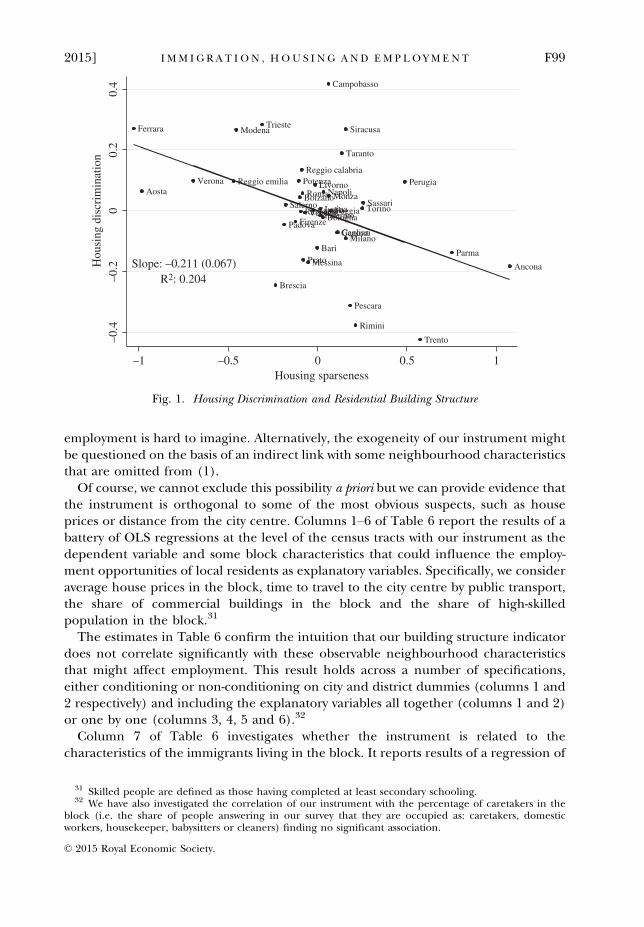
Figure 1 shows the partitioned regression equivalent of the above model, namely thevariables on the axes are the residuals of regressions of the dependent variable (on thevertical axis) and the main regressor of interest (on the horizontal axis) on the controlset. The graph indicates the existence of housing discrimination (as measured by alower recall rate for possible renters with non-Italian names) in urban structuresdominated by large residential buildings (as opposed to those populated by detachedor semi-detached houses). Indeed, the results show that residential building structureis strongly and significantly correlated with discrimination against migrants in thehousing market and it explains a sizeable 20% of the variation in relative response ratesacross cities, thus providing strong support to the logic behind our instrumentalvariable strategy.30 Additional evidence of the relevance of the instrument is in the first-stage results that will be reported later in Table 7.
Another factor which plays in favour of the relevance of our instrument is connectedto the characteristics of immigration to Italy. As stressed above, most immigrants comein illegally, and residence in buildings with a relatively low density may reduce theprobability that their illegal status is detected. Although not statistically significant,illegal status is negatively correlated with the ratio of total residential square metres tothe number of residential buildings in the block (see column 7 of Table 6).
Contrary to the relevance of the instrument, its exogeneity cannot be tested.However, a direct effect of the structure of the buildings in the neighbourhood on
28 Contacts leading to an immediate appointment for a visit or ask additional information are classified aspositive responses.
29 Unfortunately, Baldini and Federici (2011) did not record the address or the neighbourhood of theadvertised apartments and the city is the only geographical identifier that can be used for our purposes.
30 We checked that our results are not driven by few outliers by using robust regression methods. Whenestimating the slope parameter in Figure 1 using OLS weighted by the inverse of the Cook’s distance, ourcoefficient is still negative and significant (b = �0.179, SE = 0.060).
© 2015 Royal Economic Society.
F98 TH E E CONOM I C J O U RN A L [ A U G U S T
employment is hard to imagine. Alternatively, the exogeneity of our instrument mightbe questioned on the basis of an indirect link with some neighbourhood characteristicsthat are omitted from (1).
Of course, we cannot exclude this possibility a priori but we can provide evidence thatthe instrument is orthogonal to some of the most obvious suspects, such as houseprices or distance from the city centre. Columns 1–6 of Table 6 report the results of abattery of OLS regressions at the level of the census tracts with our instrument as thedependent variable and some block characteristics that could influence the employ-ment opportunities of local residents as explanatory variables. Specifically, we consideraverage house prices in the block, time to travel to the city centre by public transport,the share of commercial buildings in the block and the share of high-skilledpopulation in the block.31
The estimates in Table 6 confirm the intuition that our building structure indicatordoes not correlate significantly with these observable neighbourhood characteristicsthat might affect employment. This result holds across a number of specifications,either conditioning or non-conditioning on city and district dummies (columns 1 and2 respectively) and including the explanatory variables all together (columns 1 and 2)or one by one (columns 3, 4, 5 and 6).32
Column 7 of Table 6 investigates whether the instrument is related to thecharacteristics of the immigrants living in the block. It reports results of a regression of
Roma
Milano
Napoli
TorinoPalermo
Genova
BolognaFirenze
Bari
CataniaVenezia
Verona
Messina
Padova
Trieste
Taranto
Brescia
Reggio calabria
PratoParma
Modena
Reggio emilia PerugiaLivorno
Cagliari
RavennaFoggiaSalerno
Rimini
Ferrara
Sassari
Siracusa
Pescara
Monza
Latina
Trento
Ancona
Bolzano
Potenza
Campobasso
Aosta
Slope: –0.211 (0.067)R2: 0.204
–0.4
–0.2
00.
20.
4H
ousi
ng d
iscr
imin
atio
n
–1 –0.5 0 0.5 1Housing sparseness
Fig. 1. Housing Discrimination and Residential Building Structure
31 Skilled people are defined as those having completed at least secondary schooling.32 We have also investigated the correlation of our instrument with the percentage of caretakers in the
block (i.e. the share of people answering in our survey that they are occupied as: caretakers, domesticworkers, housekeeper, babysitters or cleaners) finding no significant association.
© 2015 Royal Economic Society.
2015] I MM I G R A T I O N , H OU S I N G A ND EM P LO YM E N T F99
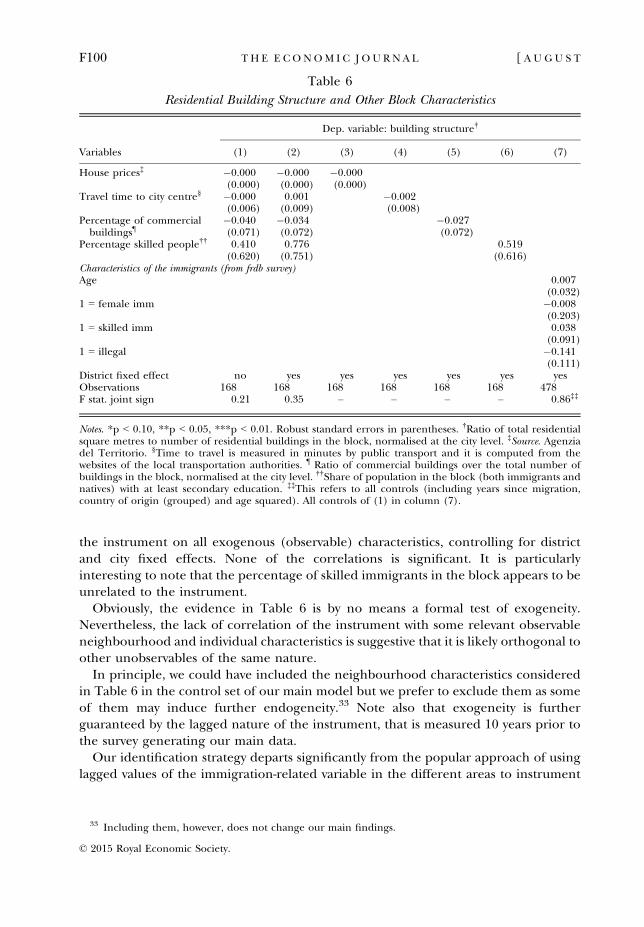
the instrument on all exogenous (observable) characteristics, controlling for districtand city fixed effects. None of the correlations is significant. It is particularlyinteresting to note that the percentage of skilled immigrants in the block appears to beunrelated to the instrument.
Obviously, the evidence in Table 6 is by no means a formal test of exogeneity.Nevertheless, the lack of correlation of the instrument with some relevant observableneighbourhood and individual characteristics is suggestive that it is likely orthogonal toother unobservables of the same nature.
In principle, we could have included the neighbourhood characteristics consideredin Table 6 in the control set of our main model but we prefer to exclude them as someof them may induce further endogeneity.33 Note also that exogeneity is furtherguaranteed by the lagged nature of the instrument, that is measured 10 years prior tothe survey generating our main data.
Our identification strategy departs significantly from the popular approach of usinglagged values of the immigration-related variable in the different areas to instrument
Table 6
Residential Building Structure and Other Block Characteristics
Variables
Dep. variable: building structure†
(1) (2) (3) (4) (5) (6) (7)
House prices‡ �0.000 �0.000 �0.000(0.000) (0.000) (0.000)
Travel time to city centre§ �0.000 0.001 �0.002(0.006) (0.009) (0.008)
Percentage of commercialbuildings¶
�0.040 �0.034 �0.027(0.071) (0.072) (0.072)
Percentage skilled people†† 0.410 0.776 0.519(0.620) (0.751) (0.616)
Characteristics of the immigrants (from frdb survey)Age 0.007
(0.032)1 = female imm �0.008
(0.203)1 = skilled imm 0.038
(0.091)1 = illegal �0.141
(0.111)District fixed effect no yes yes yes yes yes yesObservations 168 168 168 168 168 168 478F stat. joint sign 0.21 0.35 – – – – 0.86‡‡
Notes. *p < 0.10, **p < 0.05, ***p < 0.01. Robust standard errors in parentheses. †Ratio of total residentialsquare metres to number of residential buildings in the block, normalised at the city level. ‡Source. Agenziadel Territorio. §Time to travel is measured in minutes by public transport and it is computed from thewebsites of the local transportation authorities. ¶ Ratio of commercial buildings over the total number ofbuildings in the block, normalised at the city level. ††Share of population in the block (both immigrants andnatives) with at least secondary education. ‡‡This refers to all controls (including years since migration,country of origin (grouped) and age squared). All controls of (1) in column (7).
33 Including them, however, does not change our main findings.
© 2015 Royal Economic Society.
F100 TH E E CONOM I C J O U RN A L [ A U G U S T
its current values (Altonji and Card, 1991). The validity of such an approach rests onvery specific assumptions about the relative degree of serial correlation in the errorterm of the main model and in the process generating the endogenous variable(Angrist and Krueger, 2001). These assumptions are very rarely spelt out and discussedand we believe that they would be hard to justify in our setting.
4. Empirical Results
Our main results are reported in Table 7, which shows probit estimates of model (1)where the dependent variable is a dummy indicator of employment and thepercentage of immigrants in the block is the main regressor of interest. The basicset of controls includes a linear function of age, a gender dummy, a dummy foreducation at or above secondary level, a dummy for illegal status, dummies for origin(new member states, Western Balkans, other origins), dummies for years sincemigration in Italy (less than 5 years, 5–10 years, 15–20 years and more than 20 years)and city and district dummies.
Consistently with the dichotomous nature of the outcome variable, we adopt a probitmodel, although our discussion in Section 3 was framed in a linear setting in order toemphasise the fact that we do not exploit the non-linearity of the probit model foridentification purposes.34
The first column of Table 7 reports the estimates of a simple specification of ourmodel that only includes the basic controls and does not take into account neither thepotential endogeneity of the main regressor of interest nor the bias due tomeasurement error. The estimated coefficient is negative, but very small andimprecise.
In column 2, the control set is augmented with several variables to control, at leastpartly, for mismeasurement, namely dummies for interviewers of Italian and ofAlbanian nationality (the two most common groups), a dummy for graduateinterviewers and one for professionals,35 a dummy for whether the interviewer andthe interviewee are of the same gender and the self-reported evaluation of the level ofunderstanding of the questions by the interviewee, ranging 0–10. The estimatedcoefficient is now substantially larger (�0.005 as opposed to �0.001) but still far fromconventional levels of statistical significance.
Column 3 reports our preferred specification and, in addition to the interviewer’scharacteristics, it also instruments the percentage of non-Italians in the block with ourindicator of residential building structure. The model is estimated by full-informationmaximum likelihood, thus producing jointly the estimates of the first stage and themain equation. The standard errors are clustered at the level of the census tract, whichis the exact level of variation of the instrument and the same clustering is applied to allthe estimates in Table 7. The first stage linear regression and the reduced form probit,
34 The estimation results when using a linear probability model remain largely unchanged. The results areavailable upon request from the authors.
35 About one-quarter of the interviewers are regular dependent employees of the survey company, whilethe others were hired (and trained) for this specific project, although they might have worked for the same orsimilar companies in the past.
© 2015 Royal Economic Society.
2015] I MM I G R A T I O N , H OU S I N G A ND EM P LO YM E N T F101
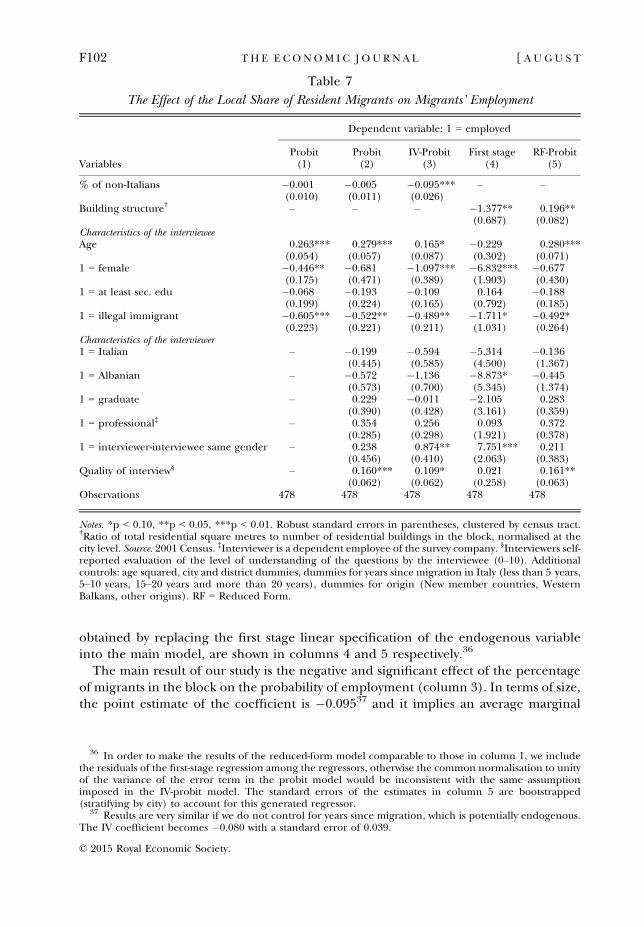
obtained by replacing the first stage linear specification of the endogenous variableinto the main model, are shown in columns 4 and 5 respectively.36
The main result of our study is the negative and significant effect of the percentageof migrants in the block on the probability of employment (column 3). In terms of size,the point estimate of the coefficient is �0.09537 and it implies an average marginal
Table 7
The Effect of the Local Share of Resident Migrants on Migrants’ Employment
Variables
Dependent variable: 1 = employed
Probit Probit IV-Probit First stage RF-Probit(1) (2) (3) (4) (5)
% of non-Italians �0.001 �0.005 �0.095*** – –(0.010) (0.011) (0.026)
Building structure† – – – �1.377** 0.196**(0.687) (0.082)
Characteristics of the intervieweeAge 0.263*** 0.279*** 0.165* �0.229 0.280***
(0.054) (0.057) (0.087) (0.302) (0.071)1 = female �0.446** �0.681 �1.097*** �6.832*** �0.677
(0.175) (0.471) (0.389) (1.903) (0.430)1 = at least sec. edu �0.068 �0.193 �0.109 0.164 �0.188
(0.199) (0.224) (0.165) (0.792) (0.185)1 = illegal immigrant �0.605*** �0.522** �0.489** �1.711* �0.492*
(0.223) (0.221) (0.211) (1.031) (0.264)Characteristics of the interviewer1 = Italian – �0.199 �0.594 �5.314 �0.136
(0.445) (0.585) (4.500) (1.367)1 = Albanian – �0.572 �1.136 �8.873* �0.445
(0.573) (0.700) (5.345) (1.374)1 = graduate – 0.229 �0.011 �2.105 0.283
(0.390) (0.428) (3.161) (0.359)1 = professional‡ – 0.354 0.256 0.093 0.372
(0.285) (0.298) (1.921) (0.378)1 = interviewer-interviewee same gender – 0.238 0.874** 7.751*** 0.211
(0.456) (0.410) (2.063) (0.383)Quality of interview§ – 0.160*** 0.109* 0.021 0.161**
(0.062) (0.062) (0.258) (0.063)Observations 478 478 478 478 478
Notes. *p < 0.10, **p < 0.05, ***p < 0.01. Robust standard errors in parentheses, clustered by census tract.†Ratio of total residential square metres to number of residential buildings in the block, normalised at thecity level. Source. 2001 Census. ‡Interviewer is a dependent employee of the survey company. §Interviewers self-reported evaluation of the level of understanding of the questions by the interviewee (0–10). Additionalcontrols: age squared, city and district dummies, dummies for years since migration in Italy (less than 5 years,5–10 years, 15–20 years and more than 20 years), dummies for origin (New member countries, WesternBalkans, other origins). RF = Reduced Form.
36 In order to make the results of the reduced-form model comparable to those in column 1, we includethe residuals of the first-stage regression among the regressors, otherwise the common normalisation to unityof the variance of the error term in the probit model would be inconsistent with the same assumptionimposed in the IV-probit model. The standard errors of the estimates in column 5 are bootstrapped(stratifying by city) to account for this generated regressor.
37 Results are very similar if we do not control for years since migration, which is potentially endogenous.The IV coefficient becomes �0.080 with a standard error of 0.039.
© 2015 Royal Economic Society.
F102 TH E E CONOM I C J O U RN A L [ A U G U S T
effect of about 2 percentage points, over an average employment rate of 88%, for eachpercentage point change in the share of immigrants residing in the block.38
This magnitude, however, needs to be taken with care. Our approach is likely toidentify a Local Average Treatment Effect (LATE; Angrist and Imbens, 1994), as ourestimates are identified by the subgroup of the immigrants residing in areas where thepresence of immigrants is related to discrimination in the housing market or to theillegal status of immigrants (through the residential building structure). Note that thismay actually be the LATE of policy interest for populations with fragile or uncertainattachment to the native markets but it still cannot be interpreted in a global sense. Alocal treatment effect of illegal migrants would also explain why the IV estimates aremore negative than the OLS estimates. Illegal migrants can only compete for jobs inthe informal sector and, due to the thin size of the illegal jobs market, congestionexternalities are likely to be stronger in this context. In subsection 4.2, we use analternative estimation strategy and we always find a negative, albeit smaller, effect ofimmigrant density on employment.
4.1. Dealing with Weak Instruments in Non-linear Models
In assessing the robustness of our main finding, it is important to notice the F-test ofthe excluded instrument in the first stage is just above 4, which, to some readers, mayindicate a problem of weak instruments.
To tackle this issue we extend to non-linear models the reduced-form approachsuggested by Angrist and Krueger (2001) and further developed by Chernozhukov andHansen (2008) for linear models. To describe our procedure, consider our IV systemof two equations:
y�icdb ¼ a1mcdb þ a2X icdb þ �icdb ; (2)
mcdb ¼ b1zcdb þ b2X icdb þ vicdb ; (3)
where (2) is equivalent to (1), with the only difference that we now explicitly considerthe dependent variable as a latent outcome and we indicate it with a star, following thecommon convention. Equation (3) is the first stage linear regression with zcdb as theinstrument.
The reduced-form model is obtained by replacing (3) into (2):
y�icdb ¼ b1a1ð Þzcdb þ b2a1 þ a2ð ÞX icdb þ a1vicdb þ �icdb ; (4)
which can be simply estimated as a probit under the usual distributional assumption�icdb � i:i:d:Nð0; 1Þ. The only minor complication is the presence of the unobservablefirst-stage error vicdb among the explanatory variables and it can be addressed as inRivers and Vuong (1988) by replacing it with the estimated OLS residuals andappropriately adjusting the standard errors to account for the generated regressor.This is the exact procedure used to produce the estimates reported in column 5 ofTable 7.39
38 We compute this average partial effect by first calculating the marginal effect for every observation andthen averaging over the entire sample.
39 The standard errors are bootstrapped (stratifying by city).
© 2015 Royal Economic Society.
2015] I MM I G R A T I O N , H OU S I N G A ND EM P LO YM E N T F103
Equation (4) shows that the standard test statistics for the null hypothesis b1a1 ¼ 0can be used to make inference about the statistical significance of the main parameterof interest a1, extending the results Chernozhukov and Hansen (2008) to non-linearmodels.40 In other words, one can interpret the usual z-statistics of the coefficient onthe instrument in the first-stage model as a test of the statistical significance of a1 that isrobust to weak instruments, as no information about the strength of the correlationbetween the endogenous regressor and the instrument is used to derive it.
In our specific setting, the z-statistics of the main effect derived from the jointmaximum likelihood estimation of (2) and (3) is 3.58 (column 3 of Table 7), whereasthe same statistics in the reduced form model declines to 2.39 (column 5 of Table 7),which is approximately one third lower but still allows rejection of the null.
We also extend the procedure of Chernozhukov and Hansen (2008) to derive aweak-instrument robust confidence interval for a1. Define a wide enough range ofpotential values for a1, A, and for each a 2 A rewrite (2) as follows:
y�icdb ¼ ða1 � aÞmcdb þ amcdb þ a2X icdb þ �icdb : (5)
Then, replace the first instance of mcdb with the first-stage (3):
y�icdb ¼ b1ða1 � aÞ½ �zcdb þ a mcdb þ b2a1 þ a2ð ÞX icdb þ ða1 � aÞvicdb þ �icdb : (6)
In the simple linear context, Chernozhukov and Hansen (2008) propose estimating(6) by moving the term amcdb to the left-hand side, effectively transforming thedependent variable. By the same argument made above, the usual test statistics for thesignificance of the coefficient on the instrument in such a modified reduced-formequation tests the null a1 ¼ a and iterating over several values of a allows constructinga confidence interval for a1 that does not use information about the strength of thecorrelation between the instrument and the endogenous variable.
In our setting y�icdb is not observable and it is not possible to transform the dependentvariable as in Chernozhukov and Hansen (2008). However, we can leave amcdb on theright-hand side of (6) and estimate it as a constrained probit, forcing the coefficient ofthe endogenous variable mcdb to equal a. By doing so, the endogeneity of mcdb becomesirrelevant for the consistent estimation of b1ða1 � aÞ½ �.
In practice, we proceed as follows:
(i) set A as the set of real numbers between �0.3 and 0.15, spaced 0.001;(ii) estimate (6) for each a 2 A and retain the z-statistics for b1ða1 � aÞ½ �;41(iii) construct the 1 � p confidence interval as the set of as such that the z-statistics
is smaller than c(1 � p) where c(1 � p) is the (1 � p)th percentile of a v21distribution.
Applying this procedure to our setting yields a 95% confidence interval for a1 of[�0.300,�0.018], which compares with the narrower interval derived from the usualmaximum likelihood asymptotics of [�0.147,�0.043]. What is important for our
40 Given the validity of the instrument, namely its exogeneity and relevance, the null hypothesis impliesa1 ¼ 0.
41 Notice that, under the null the term ða1 � aÞvicdb disappears from (5), thus simplifying its estimation.
© 2015 Royal Economic Society.
F104 TH E E CONOM I C J O U RN A L [ A U G U S T
purposes is that, in both cases, the entire interval lies on the negative side of the realline and excludes the zero, thus reassuring about the robustness of our finding.
4.2. Alternative Identification Strategy
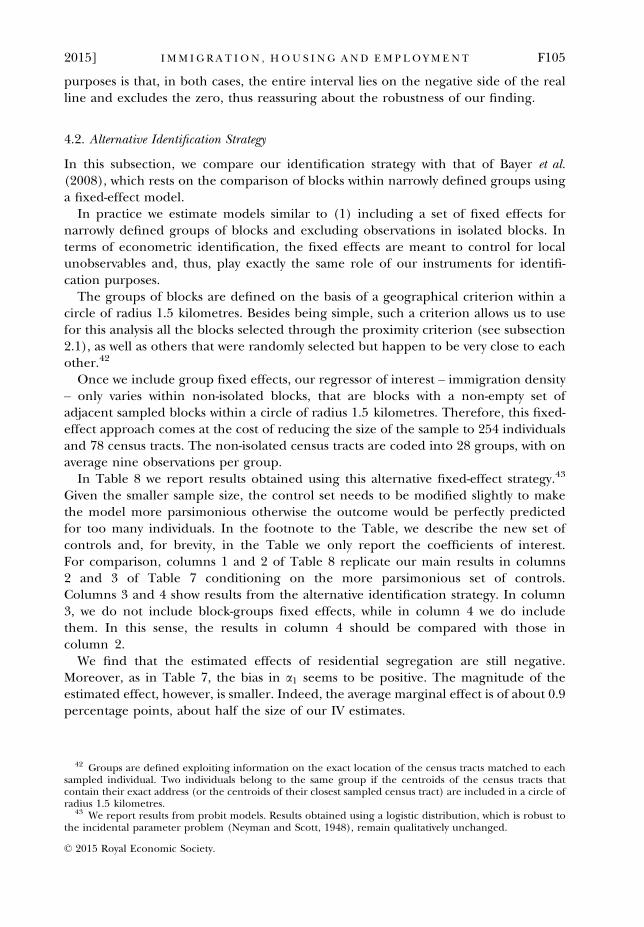
In this subsection, we compare our identification strategy with that of Bayer et al.(2008), which rests on the comparison of blocks within narrowly defined groups usinga fixed-effect model.
In practice we estimate models similar to (1) including a set of fixed effects fornarrowly defined groups of blocks and excluding observations in isolated blocks. Interms of econometric identification, the fixed effects are meant to control for localunobservables and, thus, play exactly the same role of our instruments for identifi-cation purposes.
The groups of blocks are defined on the basis of a geographical criterion within acircle of radius 1.5 kilometres. Besides being simple, such a criterion allows us to usefor this analysis all the blocks selected through the proximity criterion (see subsection2.1), as well as others that were randomly selected but happen to be very close to eachother.42
Once we include group fixed effects, our regressor of interest – immigration density– only varies within non-isolated blocks, that are blocks with a non-empty set ofadjacent sampled blocks within a circle of radius 1.5 kilometres. Therefore, this fixed-effect approach comes at the cost of reducing the size of the sample to 254 individualsand 78 census tracts. The non-isolated census tracts are coded into 28 groups, with onaverage nine observations per group.
In Table 8 we report results obtained using this alternative fixed-effect strategy.43
Given the smaller sample size, the control set needs to be modified slightly to makethe model more parsimonious otherwise the outcome would be perfectly predictedfor too many individuals. In the footnote to the Table, we describe the new set ofcontrols and, for brevity, in the Table we only report the coefficients of interest.For comparison, columns 1 and 2 of Table 8 replicate our main results in columns2 and 3 of Table 7 conditioning on the more parsimonious set of controls.Columns 3 and 4 show results from the alternative identification strategy. In column3, we do not include block-groups fixed effects, while in column 4 we do includethem. In this sense, the results in column 4 should be compared with those incolumn 2.
We find that the estimated effects of residential segregation are still negative.Moreover, as in Table 7, the bias in a1 seems to be positive. The magnitude of theestimated effect, however, is smaller. Indeed, the average marginal effect is of about 0.9percentage points, about half the size of our IV estimates.
42 Groups are defined exploiting information on the exact location of the census tracts matched to eachsampled individual. Two individuals belong to the same group if the centroids of the census tracts thatcontain their exact address (or the centroids of their closest sampled census tract) are included in a circle ofradius 1.5 kilometres.
43 We report results from probit models. Results obtained using a logistic distribution, which is robust tothe incidental parameter problem (Neyman and Scott, 1948), remain qualitatively unchanged.
© 2015 Royal Economic Society.
2015] I MM I G R A T I O N , H OU S I N G A ND EM P LO YM E N T F105
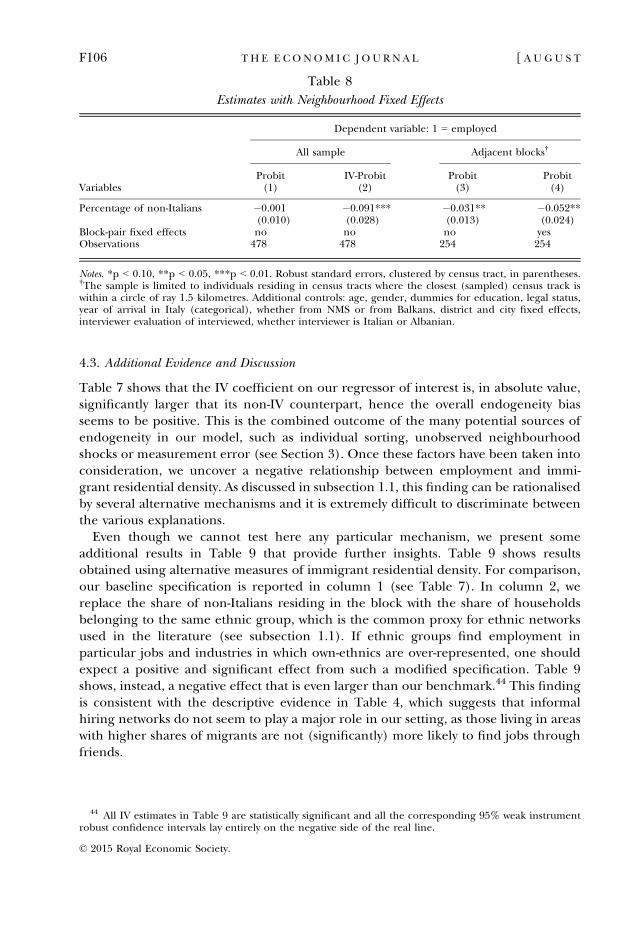
4.3. Additional Evidence and Discussion
Table 7 shows that the IV coefficient on our regressor of interest is, in absolute value,significantly larger that its non-IV counterpart, hence the overall endogeneity biasseems to be positive. This is the combined outcome of the many potential sources ofendogeneity in our model, such as individual sorting, unobserved neighbourhoodshocks or measurement error (see Section 3). Once these factors have been taken intoconsideration, we uncover a negative relationship between employment and immi-grant residential density. As discussed in subsection 1.1, this finding can be rationalisedby several alternative mechanisms and it is extremely difficult to discriminate betweenthe various explanations.
Even though we cannot test here any particular mechanism, we present someadditional results in Table 9 that provide further insights. Table 9 shows resultsobtained using alternative measures of immigrant residential density. For comparison,our baseline specification is reported in column 1 (see Table 7). In column 2, wereplace the share of non-Italians residing in the block with the share of householdsbelonging to the same ethnic group, which is the common proxy for ethnic networksused in the literature (see subsection 1.1). If ethnic groups find employment inparticular jobs and industries in which own-ethnics are over-represented, one shouldexpect a positive and significant effect from such a modified specification. Table 9shows, instead, a negative effect that is even larger than our benchmark.44 This findingis consistent with the descriptive evidence in Table 4, which suggests that informalhiring networks do not seem to play a major role in our setting, as those living in areaswith higher shares of migrants are not (significantly) more likely to find jobs throughfriends.
Table 8
Estimates with Neighbourhood Fixed Effects
Variables
Dependent variable: 1 = employed
All sample Adjacent blocks†
Probit IV-Probit Probit Probit(1) (2) (3) (4)
Percentage of non-Italians �0.001 �0.091*** �0.031** �0.052**(0.010) (0.028) (0.013) (0.024)
Block-pair fixed effects no no no yesObservations 478 478 254 254
Notes. *p < 0.10, **p < 0.05, ***p < 0.01. Robust standard errors, clustered by census tract, in parentheses.†The sample is limited to individuals residing in census tracts where the closest (sampled) census track iswithin a circle of ray 1.5 kilometres. Additional controls: age, gender, dummies for education, legal status,year of arrival in Italy (categorical), whether from NMS or from Balkans, district and city fixed effects,interviewer evaluation of interviewed, whether interviewer is Italian or Albanian.
44 All IV estimates in Table 9 are statistically significant and all the corresponding 95% weak instrumentrobust confidence intervals lay entirely on the negative side of the real line.
© 2015 Royal Economic Society.
F106 TH E E CONOM I C J O U RN A L [ A U G U S T
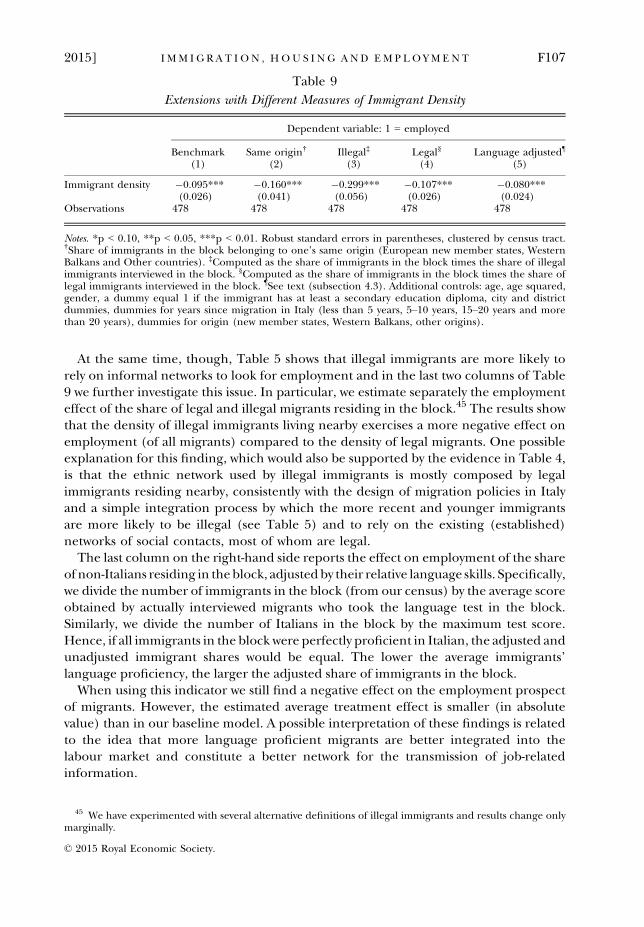
At the same time, though, Table 5 shows that illegal immigrants are more likely torely on informal networks to look for employment and in the last two columns of Table9 we further investigate this issue. In particular, we estimate separately the employmenteffect of the share of legal and illegal migrants residing in the block.45 The results showthat the density of illegal immigrants living nearby exercises a more negative effect onemployment (of all migrants) compared to the density of legal migrants. One possibleexplanation for this finding, which would also be supported by the evidence in Table 4,is that the ethnic network used by illegal immigrants is mostly composed by legalimmigrants residing nearby, consistently with the design of migration policies in Italyand a simple integration process by which the more recent and younger immigrantsare more likely to be illegal (see Table 5) and to rely on the existing (established)networks of social contacts, most of whom are legal.
The last column on the right-hand side reports the effect on employment of the shareof non-Italians residing in theblock, adjustedby their relative language skills. Specifically,we divide the number of immigrants in the block (from our census) by the average scoreobtained by actually interviewed migrants who took the language test in the block.Similarly, we divide the number of Italians in the block by the maximum test score.Hence, if all immigrants in the block were perfectly proficient in Italian, the adjusted andunadjusted immigrant shares would be equal. The lower the average immigrants’language proficiency, the larger the adjusted share of immigrants in the block.
When using this indicator we still find a negative effect on the employment prospectof migrants. However, the estimated average treatment effect is smaller (in absolutevalue) than in our baseline model. A possible interpretation of these findings is relatedto the idea that more language proficient migrants are better integrated into thelabour market and constitute a better network for the transmission of job-relatedinformation.
Table 9
Extensions with Different Measures of Immigrant Density
Dependent variable: 1 = employed
Benchmark Same origin† Illegal‡ Legal§ Language adjusted¶
(1) (2) (3) (4) (5)
Immigrant density �0.095*** �0.160*** �0.299*** �0.107*** �0.080***(0.026) (0.041) (0.056) (0.026) (0.024)
Observations 478 478 478 478 478
Notes. *p < 0.10, **p < 0.05, ***p < 0.01. Robust standard errors in parentheses, clustered by census tract.†Share of immigrants in the block belonging to one’s same origin (European new member states, WesternBalkans and Other countries). ‡Computed as the share of immigrants in the block times the share of illegalimmigrants interviewed in the block. §Computed as the share of immigrants in the block times the share oflegal immigrants interviewed in the block. ¶See text (subsection 4.3). Additional controls: age, age squared,gender, a dummy equal 1 if the immigrant has at least a secondary education diploma, city and districtdummies, dummies for years since migration in Italy (less than 5 years, 5–10 years, 15–20 years and morethan 20 years), dummies for origin (new member states, Western Balkans, other origins).
45 We have experimented with several alternative definitions of illegal immigrants and results change onlymarginally.
© 2015 Royal Economic Society.
2015] I MM I G R A T I O N , H OU S I N G A ND EM P LO YM E N T F107
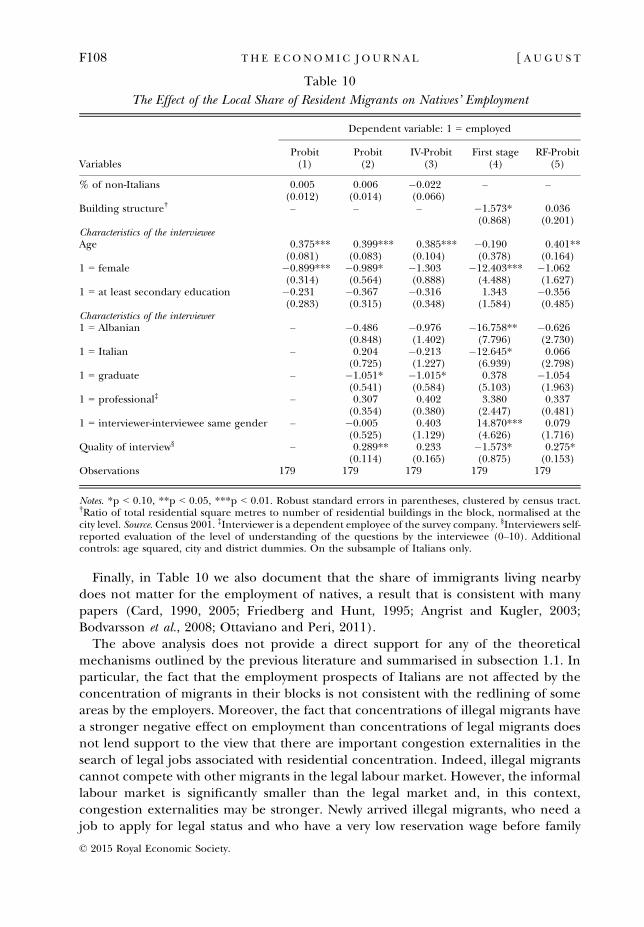
Finally, in Table 10 we also document that the share of immigrants living nearbydoes not matter for the employment of natives, a result that is consistent with manypapers (Card, 1990, 2005; Friedberg and Hunt, 1995; Angrist and Kugler, 2003;Bodvarsson et al., 2008; Ottaviano and Peri, 2011).
The above analysis does not provide a direct support for any of the theoreticalmechanisms outlined by the previous literature and summarised in subsection 1.1. Inparticular, the fact that the employment prospects of Italians are not affected by theconcentration of migrants in their blocks is not consistent with the redlining of someareas by the employers. Moreover, the fact that concentrations of illegal migrants havea stronger negative effect on employment than concentrations of legal migrants doesnot lend support to the view that there are important congestion externalities in thesearch of legal jobs associated with residential concentration. Indeed, illegal migrantscannot compete with other migrants in the legal labour market. However, the informallabour market is significantly smaller than the legal market and, in this context,congestion externalities may be stronger. Newly arrived illegal migrants, who need ajob to apply for legal status and who have a very low reservation wage before family
Table 10
The Effect of the Local Share of Resident Migrants on Natives’ Employment
Variables
Dependent variable: 1 = employed
Probit Probit IV-Probit First stage RF-Probit(1) (2) (3) (4) (5)
% of non-Italians 0.005 0.006 �0.022 – –(0.012) (0.014) (0.066)
Building structure† – – – �1.573* 0.036(0.868) (0.201)
Characteristics of the intervieweeAge 0.375*** 0.399*** 0.385*** �0.190 0.401**
(0.081) (0.083) (0.104) (0.378) (0.164)1 = female �0.899*** �0.989* �1.303 �12.403*** �1.062
(0.314) (0.564) (0.888) (4.488) (1.627)1 = at least secondary education �0.231 �0.367 �0.316 1.343 �0.356
(0.283) (0.315) (0.348) (1.584) (0.485)Characteristics of the interviewer1 = Albanian – �0.486 �0.976 �16.758** �0.626
(0.848) (1.402) (7.796) (2.730)1 = Italian – 0.204 �0.213 �12.645* 0.066
(0.725) (1.227) (6.939) (2.798)1 = graduate – �1.051* �1.015* 0.378 �1.054
(0.541) (0.584) (5.103) (1.963)1 = professional‡ – 0.307 0.402 3.380 0.337
(0.354) (0.380) (2.447) (0.481)1 = interviewer-interviewee same gender – �0.005 0.403 14.870*** 0.079
(0.525) (1.129) (4.626) (1.716)Quality of interview§ – 0.289** 0.233 �1.573* 0.275*
(0.114) (0.165) (0.875) (0.153)Observations 179 179 179 179 179
Notes. *p < 0.10, **p < 0.05, ***p < 0.01. Robust standard errors in parentheses, clustered by census tract.†Ratio of total residential square metres to number of residential buildings in the block, normalised at thecity level. Source. Census 2001. ‡Interviewer is a dependent employee of the survey company. §Interviewers self-reported evaluation of the level of understanding of the questions by the interviewee (0–10). Additionalcontrols: age squared, city and district dummies. On the subsample of Italians only.
© 2015 Royal Economic Society.
F108 TH E E CONOM I C J O U RN A L [ A U G U S T
unification, may crowd out from employment in the informal sector other migrants.This would also be consistent with a stronger negative effect of residential concen-tration in our IV estimates. Illegal migrants prefer to locate in blocks with a relativelylow residential density in order to reduce the risk of detection. Thus, the type ofexternalities which are consistent with our findings call into play the relatively largeshare of illegal migrants in countries like Italy.
5. Conclusions
Europe, notably Southern Europe, experienced very sizeable inflows of immigrants inthe decade before the Great Recession. Policies to promote the economic and socialintegration of newcomers must be supported by an analysis of the relationship betweenresidential patterns and employment prospects of migrants. Due to a lack of data, thisrelationship has barely been investigated by the literature for Southern Europe.Moreover, data on residential concentration of migrants typically do not capture illegalmigration, which is quite sizeable in Southern Europe, and do not generally permitidentification of causal effects of residential concentration on labour market outcomes.
In this article, we take advantage of the information gathered by a survey coveringboth legal and illegal migrants in eight cities in the North of Italy, a regionexperiencing a doubling of its foreign population just while disinvesting in socialhousing. The survey provides detailed information on residential patterns of migrants,that can be matched with the official census data to obtain instruments allowing us toidentify the causal effect of the percentage of migrants living nearby on theemployment status of migrants.
Our analysis uncovers a negative externality, which is higher if the immigrants livingnearby are illegal. The effect is sizeable. Our results suggest that if the incidence ofmigrants in the block increased from its median value (approx. 15%) to the 75thpercentile of its distribution (approx. 25%), the employment rate of migrants in such amedian block would drop by between 10 and 20 percentage points (from 88% to 78–68%), depending to the model specification and estimation strategy.
The relationship between residential proximity of individuals from the same ethnicgroup and the probability of finding a job is extremely complex and our findings canbe rationalised by several alternative mechanisms. While our data do not allow us toevaluate with sufficient precision which particular mechanism is behind our mainresults, we can nevertheless rule out some of the explanations provided by theliterature for the externalities associated with a large share of migrants in the block,and provide alternative tentative explanations.
For example, redlining by employers of areas with a large concentration of migrantsis not supported by our analysis. We likewise do not find support to the view thatresidential concentration is a source of congestion externalities in job search in thelegal market. However, our findings are consistent with a mechanism in which thinlabour market externalities arise in the informal labour market, the only market illegalmigrants have access to.
Analysing the interactions between illegal status, illegal work and residentialconcentration of migrants remains a key area of future research, particularly relevantfor the new destination countries of immigration in Europe. This analysis has
© 2015 Royal Economic Society.
2015] I MM I G R A T I O N , H OU S I N G A ND EM P LO YM E N T F109
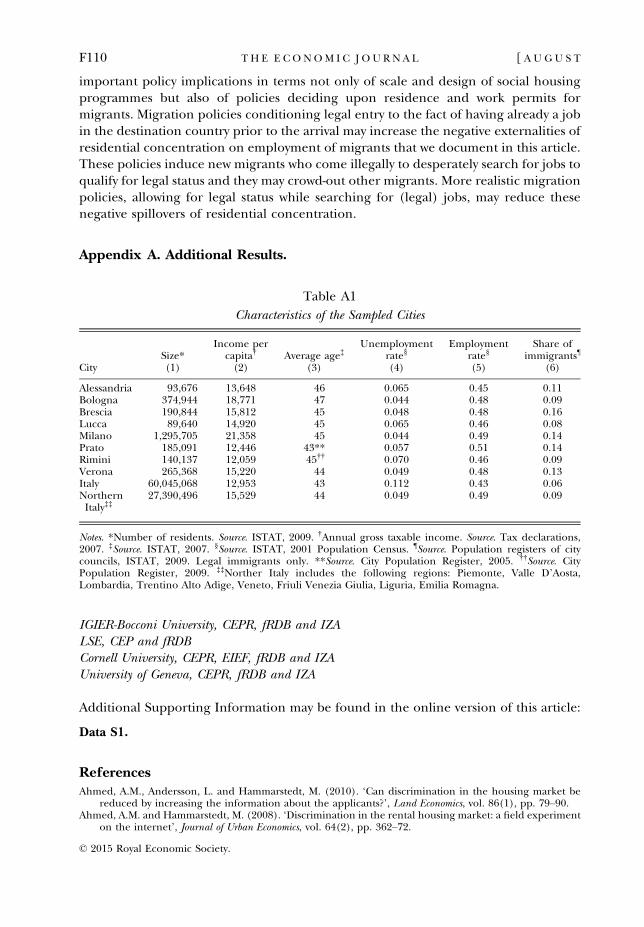
important policy implications in terms not only of scale and design of social housingprogrammes but also of policies deciding upon residence and work permits formigrants. Migration policies conditioning legal entry to the fact of having already a jobin the destination country prior to the arrival may increase the negative externalities ofresidential concentration on employment of migrants that we document in this article.These policies induce new migrants who come illegally to desperately search for jobs toqualify for legal status and they may crowd-out other migrants. More realistic migrationpolicies, allowing for legal status while searching for (legal) jobs, may reduce thesenegative spillovers of residential concentration.
Appendix A. Additional Results.
IGIER-Bocconi University, CEPR, fRDB and IZALSE, CEP and fRDBCornell University, CEPR, EIEF, fRDB and IZAUniversity of Geneva, CEPR, fRDB and IZA
Additional Supporting Information may be found in the online version of this article:
Data S1.
ReferencesAhmed, A.M., Andersson, L. and Hammarstedt, M. (2010). ‘Can discrimination in the housing market be
reduced by increasing the information about the applicants?’, Land Economics, vol. 86(1), pp. 79–90.Ahmed, A.M. and Hammarstedt, M. (2008). ‘Discrimination in the rental housing market: a field experiment
on the internet’, Journal of Urban Economics, vol. 64(2), pp. 362–72.
Table A1
Characteristics of the Sampled Cities
CitySize*
Income percapita† Average age‡
Unemploymentrate§
Employmentrate§
Share ofimmigrants¶
(1) (2) (3) (4) (5) (6)
Alessandria 93,676 13,648 46 0.065 0.45 0.11Bologna 374,944 18,771 47 0.044 0.48 0.09Brescia 190,844 15,812 45 0.048 0.48 0.16Lucca 89,640 14,920 45 0.065 0.46 0.08Milano 1,295,705 21,358 45 0.044 0.49 0.14Prato 185,091 12,446 43** 0.057 0.51 0.14Rimini 140,137 12,059 45†† 0.070 0.46 0.09Verona 265,368 15,220 44 0.049 0.48 0.13Italy 60,045,068 12,953 43 0.112 0.43 0.06NorthernItaly‡‡
27,390,496 15,529 44 0.049 0.49 0.09
Notes. *Number of residents. Source. ISTAT, 2009. †Annual gross taxable income. Source. Tax declarations,2007. ‡Source. ISTAT, 2007. §Source. ISTAT, 2001 Population Census. ¶Source. Population registers of citycouncils, ISTAT, 2009. Legal immigrants only. **Source. City Population Register, 2005. ††Source. CityPopulation Register, 2009. ‡‡Norther Italy includes the following regions: Piemonte, Valle D’Aosta,Lombardia, Trentino Alto Adige, Veneto, Friuli Venezia Giulia, Liguria, Emilia Romagna.
© 2015 Royal Economic Society.
F110 TH E E CONOM I C J O U RN A L [ A U G U S T
Altonji, J.G. and Card, D. (1991). ‘The effects of immigration on the labor market outcomes of less-skillednatives’, in (J.M. Abowd and R. B. Freeman, eds.), Immigration, Trade, and the Labor Market, pp. 201–34,chap. 7, Chicago: The University of Chicago Press.
Angrist, J.D. and Imbens, G.W. (1994). ‘Identification and estimation of local average treatment effects’,Econometrica, vol. 62(2), pp. 467–2.
Angrist, J.D. and Krueger, A.B. (2001). ‘Instrumental variables and the search for identification: from supplyand demand to natural experiments’, Journal of Economic Perspectives, vol. 15(4), pp. 69–85.
Angrist, J.D. and Kugler, A.D. (2003). ‘Protective or counter-productive? Labour market institutions and theeffect of immigration on EU natives’, ECONOMIC JOURNAL, vol. 113(488), pp. F302–31.
Bach, R.L. and Portes, A. (1985). Latin Journey: Cuban and Mexican Immigrants in the United States, Berkeley:University of California Press.
Bailey, T. and Waldinger, R. (1991). ‘Primary, secondary, and enclave labor markets: a training systemsapproach’, American Sociological Review, vol. 56(4), pp. 432–45.
Baldini, M. and Federici, M. (2011). ‘Ethnic discrimination in the Italian rental housing market’, Journal ofHousing Economics, vol. 20(1), pp. 1–14.
Battu, H., Seaman, P. and Zenou, Y. (2011). ‘Job contact networks and the ethnic minorities’, LabourEconomics, vol. 18(1), pp. 48–56.
Bauer, T.K., Flake, R. and Sinning, M. (2011). ‘Labor market effects of immigration: evidence fromneighborhood data’, Institute for the Study of Labor (IZA).
Bayer, P., Ross, S.L. and Topa, G. (2008). ‘Place of work and place of residence: informal hiring networks andlabor market outcomes’, Journal of Political Economy, vol. 116(6), pp. 1150–96.
Beckers, P. and Borghans, L. (2011). ‘Segregation in neighbourhoods and labour market outcomes ofimmigrants: evidence from random assignment in the Netherlands’, United Nations University,Maastricht Economic and social Research and training centre on Innovation and Technology.
Bertrand, M., Luttmer, E.F.P. and Mullainathan, S. (2000). ‘Network effects and welfare cultures’, QuarterlyJournal of Economics, vol. 115(3), pp. 1019–55.
Bisin, A., Patacchini, E., Verdier, T. and Zenou, Y. (2011). ‘Ethnic identity and labour market outcomes ofimmigrants in Europe’, Economic Policy, vol. 26(65), pp. 57–92.
Boccard, N. and Zenou, Y. (2000). ‘Racial discrimination and redlining in cities’, Journal of Urban Economics,vol. 48(2), pp. 260–85.
Bodvarsson, O.B., Van den Berg, H.F. and Lewer, J.J. (2008). ‘Measuring immigration’s effects on labordemand: a reexamination of the Mariel boatlift’, Labour Economics, vol. 15(4), pp. 560–74.
Bonacich, E. and Light, I. (1988). Immigrant Entrepreneurs: Koreans in Los Angeles, Berkeley, CA: University ofCalifornia Press.
Borjas, G.J. (1987). ‘Immigrants, minorities and labour market competition’, Industrial and Labour RelationReview, vol. 40(3), pp. 382–92.
Borjas, G.J. (1995). ‘Ethnicity, neighborhoods, and human-capital externalities’, American Economic Review,vol. 85(3), pp. 365–90.
Borjas, G.J. and Bronars, S.G. (1989). ‘Consumer discrimination and self-employment’, Journal of PoliticalEconomy, vol. 97(3), pp. 581–605.
Bosch, M., Carnero, M.A. and Farr�e, L. (2010). ‘Information and discrimination in the rental housingmarket: evidence from a field experiment’, Regional Science and Urban Economics, vol. 40(1), pp. 11–9.
Brueckner, J.K. and Zenou, Y. (2003). ‘Space and unemployment: the labor-market effects of spatialmismatch’, Journal of Labor Economics, vol. 21(1), pp. 242–62.
Card, D. (1990). ‘The impact of the Mariel boatlift on the Miami labor market’, Industrial and Labor RelationsReview, vol. 43(2), pp. 245–57.
Card, D. (2005). ‘Is the new immigration really so bad?’, ECONOMIC JOURNAL, vol. 115(507), pp. F300–23.Card, D. and Rothstein, J. (2007). ‘Racial segregation and the black-white test score gap’, Journal of Public
Economics, vol. 91(11–12), pp. 2158–84.Carpusor, A.G. and Loges, W.E. (2006). ‘Rental discrimination and ethnicity in names1’, Journal of Applied
Social Psychology, vol. 36(4), pp. 934–52.Cesareo, V. and Blangiardo, G.C. (2009). Indici di integrazione: un indagine empirica sulla realta migratoria
italiana, Milano: FrancoAngeli.Chernozhukov, V. and Hansen, C. (2008). ‘The reduced form: a simple approach to inference with weak
instruments’, Economics Letters, vol. 100(1), pp. 68–71.Chiswick, B.R. (1991). ‘Speaking, reading, and earnings among low-skilled immigrants’, Journal of Labor
Economics, vol. 9(2), pp. 149–70.Chiswick, B.R. and Miller, P.W. (1995). ‘The endogeneity between language and earnings: international
analyses’, Journal of Labor Economics, vol. 13(2), pp. 246–88.Chiswick, B.R. and Miller, P.W. (2005). ‘Do enclaves matter in immigrant adjustment?’, City and Community,
vol. 4(1), pp. 5–35.Conley, T. and Topa, G. (1999). ‘Socio-economic distance and spatial patterns in unemployment’, Journal of
Applied Econometrics, vol. 17(4), pp. 303–27.
© 2015 Royal Economic Society.
2015] I MM I G R A T I O N , H OU S I N G A ND EM P LO YM E N T F111
Coulson, N.E., Laing, D. and Wang, P. (2001). ‘Spatial mismatch in search equilibrium’, Journal of LaborEconomics, vol. 19(4), pp. 949–72.
Cutler, D.M. and Glaeser, E.L. (1997). ‘Are ghettos good or bad?’, Quarterly Journal of Economics, vol. 112(3),pp. 827–72.
Cutler, D.M., Glaeser, E.L. and Vigdor, J.L. (1999). ‘The rise and decline of the American ghetto’, Journal ofPolitical Economy, vol. 107(3), pp. 455–506.
Damm, A.P. (2009). ‘Ethnic enclaves and immigrant labor market outcomes: quasi-experimental evidence’,Journal of Labor Economics, vol. 27(2), pp. 281–314.
Dustmann, C., Fasani, F. and Speciale, B. (2010). ‘Legal status and income allocation of immigranthouseholds’, mimeo, UCL.
Edin, P.A., Fredriksson, P. and Aaslund, O. (2003). ‘Ethnic enclaves and the economic success of immigrants:evidence from a natural experiment’, Quarterly Journal of Economics, vol. 118(1), pp. 329–57.
Evans, W., Oates, W. and Shwab, R. (1992). ‘Measuring peer group effects: a study of teenage behavior’,Journal of Political Economy, vol. 100(5), pp. 966–91.
Falcon, L.M. (2007). ‘Social networks and Latino immigrants in the labor market: a review of the literatureand evidence’, in (M. Montero–Sieburth and E. Melendez, eds.), Latinos in a Changing Society, pp. 83–101,Westport, CT: Praeger.
Falcon, L.M. and Melendez, E. (2001). ‘Racial and ethnic differences in job searching in urban centers’, in(A. O’Connor, C. Tilly and L.D. Bobo, eds.), Urban Inequality: Evidence from Four Cities, pp. 341–71, NewYork: Russell Sage Foundation.
Friedberg, R.M. and Hunt, J. (1995). ‘The impact of immigrants on host country wages, employment andgrowth’, Journal of Economic Perspectives, vol. 9(2), pp. 23–44.
Frijters, P., Shields, M.A. and Price, S.W. (2005). ‘Job search methods and their success: a comparison ofimmigrants and natives in the UK’, ECONOMIC JOURNAL, vol. 115(507), pp. 359–76.
Gabriel, S.A. and Rosenthal, S.S. (1999). ‘Location and the effect of demographic traits on earnings’, RegionalScience and Urban Economics, vol. 29(4), pp. 445–61.
Gautier, P.A. and Zenou, Y. (2010). ‘Car ownership and the labor market of ethnic minorities’, Journal ofUrban Economics, vol. 67(3), pp. 392–403.
Granovetter, M. (1973). ‘The strength of weak ties’, American Journal of Sociology, vol. 78(6), pp. 1360–80.Granovetter, M. (1974). Getting a Job: A Study of Contacts and Careers, Cambridge, MA: Harvard University Press.Granovetter, M. (1983). ‘The strength of weak ties: a network theory revisited’, Sociological Theory, vol. 1, pp.
201–23.Granovetter, M. (1985). ‘Economic action and social structure: the problem of embeddedness’, American
Journal of Sociology, vol. 91(3), pp. 481–510.Hanson, A. and Hawley, Z. (2011). ‘Do landlords discriminate in the rental housing market? Evidence from
an internet field experiment in us cities’, Journal of Urban Economics, vol. 70(2), pp. 99–114.Harris, L. and Rosenbaum, E. (2001). ‘Residential mobility and opportunities: early impacts of the moving to
opportunity demonstration program in Chicago’, Housing Policy Debate, vol. 12(2), pp. 321–46.Hellerstein, J.K., Neumark, D. and McInerney, M. (2008). ‘Spatial mismatch or racial mismatch?’, Journal of
Urban Economics, vol. 64(2), pp. 464–79.Holzer, H.J., Quigley, J.M. and Raphael, S. (2003). ‘Public transit and the spatial distribution of minority
employment: evidence from a natural experiment’, Journal of Policy Analysis and Management, vol. 22(3),pp. 415–42.
Ihlanfeldt, K.R. (1991). ‘A primer on spatial mismatch within urban labor markets’. in (R. Arnott andD. McMillen, eds.), A Companion to Urban Economics, pp. 404–17, Boston, MA: Blackwell Publishing.
Ihlanfeldt, K.R. (1992). Job Accessibility and the Employment and School Enrollment of Teenagers, Kalamazoo,MI: W.E. Upjohn Institute for Employment Research.
Ihlanfeldt, K.R. (1997). ‘Information on the spatial distribution of job opportunities within metropolitanareas’, Journal of Urban Economics, vol. 41(2), pp. 218–42.
Ihlanfeldt, K.R. and Sjoquist, D. (1998). ‘The spatial mismatch hypothesis: a review of recent studies and theirimplications for welfare reform’, Housing Policy Debate, vol. 9(4), pp. 849–92.
Ioannides, Y.M. (2012). From Neighborhoods to Nations: The Economics of Social Interactions, Princeton, NJ:Princeton University Press.
Ioannides, Y.M. and Loury, L.D. (2004). ‘Job information networks, neighborhood effects, and inequality’,Journal of Economic Literature, vol. 42(4), pp. 1056–93.
Kahanec, M. (2006). ‘Ethnic specialization and earnings inequality: why being a minority hurts, but being abig minority hurts more’, Institute for the Study of Labor (IZA).
Kain, J.F. (1968). ‘The spatial mismatch hypotheis: three decades later’, Housing Policy Debate, vol. 3(2), pp.371–92.
Katz, L.F., Kling, J.R. and Liebman, J.B. (2001). ‘Moving to opportunity in Boston: early results of arandomized mobility experiment’, Quarterly Journal of Economics, vol. 116(2), pp. 607–54.
Lazear, E.P. (1999). ‘Culture and language’, Journal of Political Economy, vol. 107(S6), pp. S95–126.
© 2015 Royal Economic Society.
F112 TH E E CONOM I C J O U RN A L [ A U G U S T
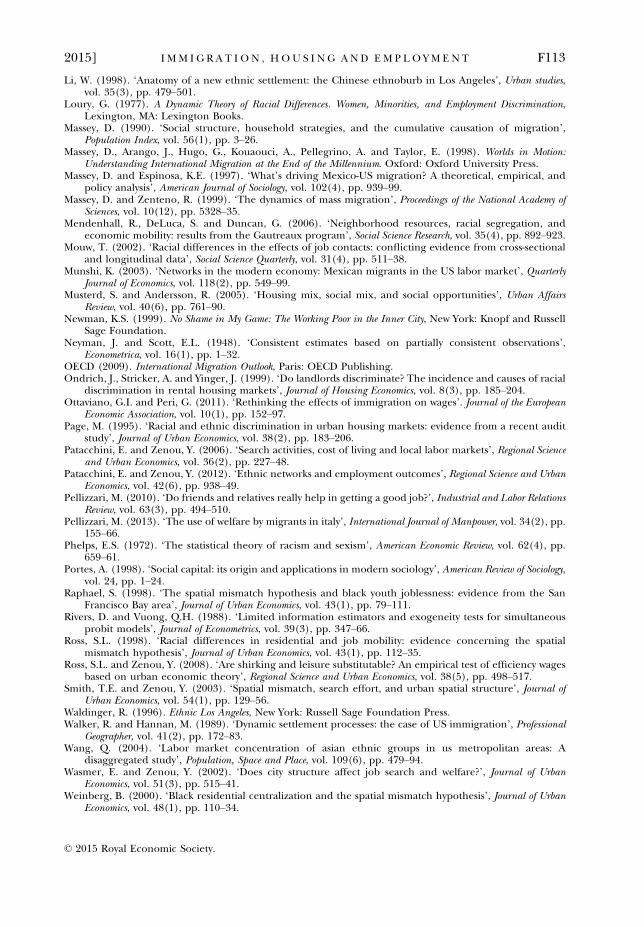
Li, W. (1998). ‘Anatomy of a new ethnic settlement: the Chinese ethnoburb in Los Angeles’, Urban studies,vol. 35(3), pp. 479–501.
Loury, G. (1977). A Dynamic Theory of Racial Differences. Women, Minorities, and Employment Discrimination,Lexington, MA: Lexington Books.
Massey, D. (1990). ‘Social structure, household strategies, and the cumulative causation of migration’,Population Index, vol. 56(1), pp. 3–26.
Massey, D., Arango, J., Hugo, G., Kouaouci, A., Pellegrino, A. and Taylor, E. (1998). Worlds in Motion:Understanding International Migration at the End of the Millennium. Oxford: Oxford University Press.
Massey, D. and Espinosa, K.E. (1997). ‘What’s driving Mexico-US migration? A theoretical, empirical, andpolicy analysis’, American Journal of Sociology, vol. 102(4), pp. 939–99.
Massey, D. and Zenteno, R. (1999). ‘The dynamics of mass migration’, Proceedings of the National Academy ofSciences, vol. 10(12), pp. 5328–35.
Mendenhall, R., DeLuca, S. and Duncan, G. (2006). ‘Neighborhood resources, racial segregation, andeconomic mobility: results from the Gautreaux program’, Social Science Research, vol. 35(4), pp. 892–923.
Mouw, T. (2002). ‘Racial differences in the effects of job contacts: conflicting evidence from cross-sectionaland longitudinal data’, Social Science Quarterly, vol. 31(4), pp. 511–38.
Munshi, K. (2003). ‘Networks in the modern economy: Mexican migrants in the US labor market’, QuarterlyJournal of Economics, vol. 118(2), pp. 549–99.
Musterd, S. and Andersson, R. (2005). ‘Housing mix, social mix, and social opportunities’, Urban AffairsReview, vol. 40(6), pp. 761–90.
Newman, K.S. (1999). No Shame in My Game: The Working Poor in the Inner City, New York: Knopf and RussellSage Foundation.
Neyman, J. and Scott, E.L. (1948). ‘Consistent estimates based on partially consistent observations’,Econometrica, vol. 16(1), pp. 1–32.
OECD (2009). International Migration Outlook, Paris: OECD Publishing.Ondrich, J., Stricker, A. and Yinger, J. (1999). ‘Do landlords discriminate? The incidence and causes of racial
discrimination in rental housing markets’, Journal of Housing Economics, vol. 8(3), pp. 185–204.Ottaviano, G.I. and Peri, G. (2011). ‘Rethinking the effects of immigration on wages’. Journal of the European
Economic Association, vol. 10(1), pp. 152–97.Page, M. (1995). ‘Racial and ethnic discrimination in urban housing markets: evidence from a recent audit
study’, Journal of Urban Economics, vol. 38(2), pp. 183–206.Patacchini, E. and Zenou, Y. (2006). ‘Search activities, cost of living and local labor markets’, Regional Science
and Urban Economics, vol. 36(2), pp. 227–48.Patacchini, E. and Zenou, Y. (2012). ‘Ethnic networks and employment outcomes’, Regional Science and Urban
Economics, vol. 42(6), pp. 938–49.Pellizzari, M. (2010). ‘Do friends and relatives really help in getting a good job?’, Industrial and Labor Relations
Review, vol. 63(3), pp. 494–510.Pellizzari, M. (2013). ‘The use of welfare by migrants in italy’, International Journal of Manpower, vol. 34(2), pp.
155–66.Phelps, E.S. (1972). ‘The statistical theory of racism and sexism’, American Economic Review, vol. 62(4), pp.
659–61.Portes, A. (1998). ‘Social capital: its origin and applications in modern sociology’, American Review of Sociology,
vol. 24, pp. 1–24.Raphael, S. (1998). ‘The spatial mismatch hypothesis and black youth joblessness: evidence from the San
Francisco Bay area’, Journal of Urban Economics, vol. 43(1), pp. 79–111.Rivers, D. and Vuong, Q.H. (1988). ‘Limited information estimators and exogeneity tests for simultaneous
probit models’, Journal of Econometrics, vol. 39(3), pp. 347–66.Ross, S.L. (1998). ‘Racial differences in residential and job mobility: evidence concerning the spatial
mismatch hypothesis’, Journal of Urban Economics, vol. 43(1), pp. 112–35.Ross, S.L. and Zenou, Y. (2008). ‘Are shirking and leisure substitutable? An empirical test of efficiency wages
based on urban economic theory’, Regional Science and Urban Economics, vol. 38(5), pp. 498–517.Smith, T.E. and Zenou, Y. (2003). ‘Spatial mismatch, search effort, and urban spatial structure’, Journal of
Urban Economics, vol. 54(1), pp. 129–56.Waldinger, R. (1996). Ethnic Los Angeles, New York: Russell Sage Foundation Press.Walker, R. and Hannan, M. (1989). ‘Dynamic settlement processes: the case of US immigration’, Professional
Geographer, vol. 41(2), pp. 172–83.Wang, Q. (2004). ‘Labor market concentration of asian ethnic groups in us metropolitan areas: A
disaggregated study’, Population, Space and Place, vol. 109(6), pp. 479–94.Wasmer, E. and Zenou, Y. (2002). ‘Does city structure affect job search and welfare?’, Journal of Urban
Economics, vol. 51(3), pp. 515–41.Weinberg, B. (2000). ‘Black residential centralization and the spatial mismatch hypothesis’, Journal of Urban
Economics, vol. 48(1), pp. 110–34.
© 2015 Royal Economic Society.
2015] I MM I G R A T I O N , H OU S I N G A ND EM P LO YM E N T F113

Weinberg, B. (2004). ‘Testing the spatial mismatch hypothesis using inter-city variations in industrialcomposition’, Regional Science and Urban Economics, vol. 34(5), pp. 505–32.
Wilson, W.J. (1996). When Work Disappears: The World of the New Urban Poor, New York: Knopf.Yinger, J. (1986). ‘Measuring racial discrimination with fair housing audits: caught in the act’, American
Economic Review, vol. 76(5), pp. 881–93.Zenou, Y. (2002). ‘How do firms redline workers?’, Journal of Urban Economics, vol. 52(3), pp. 391–408.Zenou, Y. (2008). ‘The spatial mismatch hypothesis’, in (L. Blume and S. Durlauf, eds.), A Dictionary of
Economics, 2nd edn., pp. 83–101, London: MacMillan Press.Zenou, Y. (2013). ‘Spatial versus social mismatch’, Journal of Urban Economics, vol. 74(C), pp. 113–32.
© 2015 Royal Economic Society.
F114 TH E E CONOM I C J O U RN A L [ A U G U S T 2015]