Embed Size (px)
Citation preview
CONGRESS OF THE UNITED STATESCONGRESSIONAL BUDGET OFFICE
A
P A P E RCBO
Immigration Policyin the United States
FEBRUARY 2006
A Series on Immigration

2499
CBO
Immigration Policy in the United States
February 2006
A
P A P E R
The Congress of th
e United States O Congressional Budget Office
Notes
Numbers in the text and tables may not add up to totals because of rounding.
Unless otherwise indicated, the years referred to in this paper are fiscal years.
Preface
Immigration has been a subject of legislation since the nation’s founding. In 1790, the Congress established a formal process enabling the foreign born to become U.S. citizens. Just over a century later, in response to increasing levels of immigration, the federal government assumed the task of reviewing and processing all immigrants seeking admission to the United States. Since then, numerous changes have been made to U.S. immigration policy.
This paper, requested by the Chairman and Ranking Member of the Senate Finance Commit-tee, is part of a series of reports by the Congressional Budget Office (CBO) on immigration. The paper focuses on the evolution of U.S. immigration policy and presents statistics on the various categories of lawful admission and enforcement of the nation’s immigration laws. In keeping with CBO’s mandate to provide objective, nonpartisan analysis, the paper makes no recommendations.
Douglas Hamilton is coordinating CBO’s series of reports on immigration. Selena Caldera and Paige Piper/Bach wrote the paper under the supervision of Patrice Gordon. Andrew Gisselquist reviewed the manuscript for factual accuracy. David Brauer, Paul Cullinan, Mark Grabowicz, Theresa Gullo, Arlene Holen, Melissa Merrell, Noah Meyerson, Robert Murphy, Kathy Ruffing, Jennifer Smith, Ralph Smith, and Derek Trunkey provided helpful comments on early drafts of the paper, as did Eric Larson and Judith Droitcour of the Government Accountability Office. (The assistance of external reviewers implies no responsibility for the final product, which rests solely with CBO.)
Loretta Lettner edited the paper, and Christine Bogusz proofread it. Maureen Costantino pre-pared the paper for publication and designed the cover. Lenny Skutnik produced the printed copies, and Annette Kalicki and Simone Thomas produced the electronic version for CBO’s Web site (www.cbo.gov).
Donald B. MarronActing Director
February 2006

Contents
Summary vii
The Evolution of U.S. Immigration Policy 1
Categories of Lawful Admission to the United States 2
Permanent Admission 4
Temporary Admission 10
Enforcement of Immigration Laws 11
Unauthorized Aliens 11
Enforcement Procedures 14
Appendix: Becoming a U.S. Citizen 17
Tables
S-1.
Lawful Admissions and Issuances of Visas, 2000 to 2004 viii1.
Permanent (Immigrant) Admissions, by Category ofNew Arrival, 1996 to 2004 42.
Major Immigration Categories 63.
Numerical Ceilings and Admissions, by ImmigrationCategory, 2004 84.
Immigrant Admissions Under the Diversity Program,by Region, 1997 to 2004 105.
Number and Type of Nonimmigrant (Temporary) VisaIssuances, 1992 to 2003 126.
Enforcement Efforts, 1991 to 2004 157.
Administrative Reasons for Formal Removal, 1991 to 2004 16A-1.
Requirements for Naturalization 18
VI IMMIGRATION POLICY IN THE UNITED STATES
Figures
1.
Total Lawful Permanent Admissions, by AdmissionsCategory, 2004 52.
Percentage of Nonimmigrant Visas Issued, by VisaClassification, 2003 11Box
1.
Definition of Terms 3
Summary
Immigration policy in the United States reflects multi-ple goals. First, it serves to reunite families by admitting immigrants who already have family members living in the United States. Second, it seeks to admit workers with specific skills and to fill positions in occupations deemed to be experiencing labor shortages. Third, it attempts to provide a refuge for people who face the risk of political, racial, or religious persecution in their country of origin. Finally, it seeks to ensure diversity by providing admission to people from countries with historically low rates of im-migration to the United States. Several categories of per-manent and temporary admission have been established to implement those wide-ranging goals.
This Congressional Budget Office paper describes who is eligible for the various categories of legal admission and provides the most recent data available about the number of people admitted under each category. The paper also discusses procedures currently used to enforce immigra-tion laws and provides estimates of the number of people who are in the United States illegally.
Lawful EntryU.S. policy provides two distinct paths for the lawful ad-mission of noncitizens, or “aliens”: permanent (immi-grant) admission or temporary (nonimmigrant) admis-sion. In the first category, aliens may be granted permanent admission by being accorded the status of lawful permanent residents (LPRs). Aliens admitted in such a capacity are formally classified as “immigrants” and receive a permanent resident card, commonly re-ferred to as a green card. Lawful permanent residents are eligible to work in the United States and may later apply for U.S. citizenship.
In 2004, the United States granted permanent admission, or LPR status, to about 946,000 noncitizens (see Sum-mary Table 1). That figure is not a measure of first-time entries into the United States, however. The U.S. Citizen-
ship and Immigration Services—a bureau of the Depart-ment of Homeland Security—counts both entries of new immigrants and adjustments to lawful permanent resi-dent status (for those aliens already in the United States) as “admissions.” In 2004, roughly 584,000 adjustments to LPR status were granted, and about 362,000 new im-migrants entered the country.
The second path is admission on a temporary basis. Tem-porary admission encompasses a large and diverse group of people who are granted entry to the United States fora specific purpose for a limited period of time. Reasons for such admissions include tourism, diplomatic mis-sions, study, and temporary work. Under U.S. law,citizens of foreign countries admitted temporarily are classified as “nonimmigrants.” (For definitions of terms used in this paper, see Box 1 on page 3.) Certain non-immigrants may be permitted to work in the United States for a limited time depending on the type of visa they receive. However, they are not eligible for citizenship through naturalization; nonimmigrants wishing to re-main in the United States on a permanent basis mustapply for permanent admission.
In 2004, the State Department issued about 5 million vi-sas authorizing temporary admission to the United States, according to preliminary data. In addition, under the Visa Waiver Program, 15.8 million people were admitted that year on a temporary basis. Under that program, eligi-ble people may enter the United States without a visa for business or pleasure visits of 90 days or less.
The numbers presented in this paper indicate the flow of noncitizens into the United States but not their depar-ture. Such information is not recorded. Official estimates are available only on the departures of lawful permanent residents. The Bureau of the Census has estimated that an average of 217,000 LPRs emigrated from the United States each year between 1990 and 2000.
VIII IMMIGRATION POLICY IN THE UNITED STATES
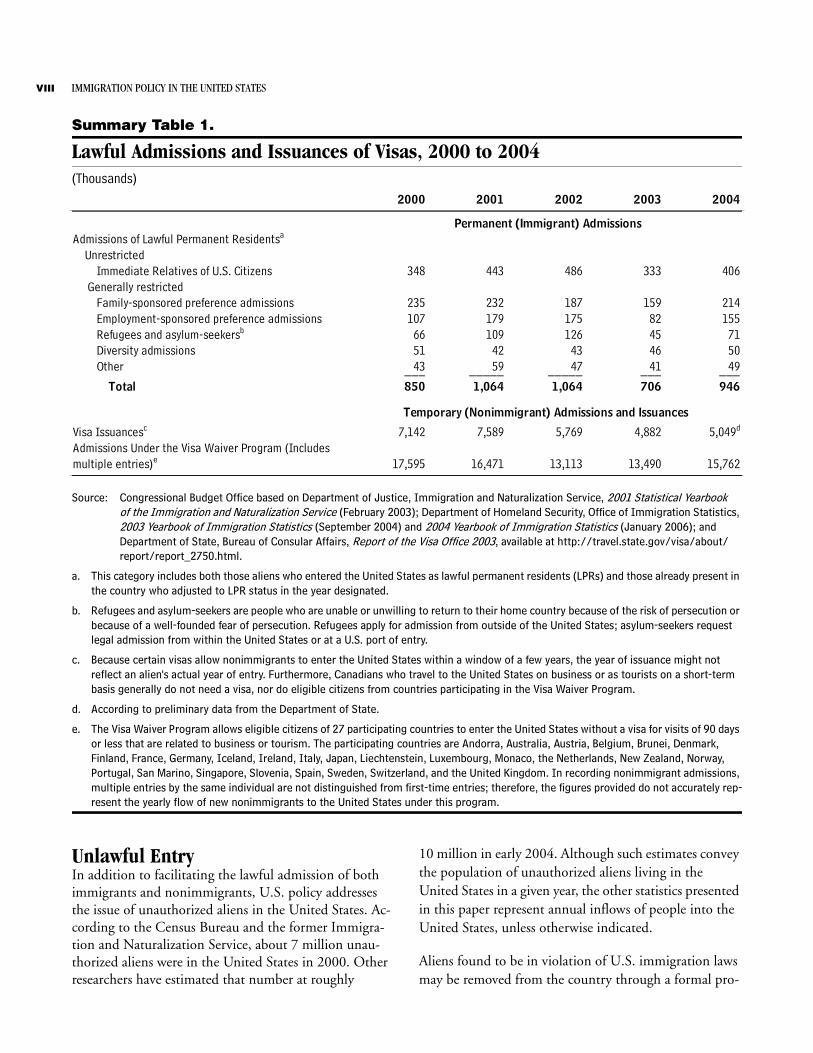
Summary Table 1.
Lawful Admissions and Issuances of Visas, 2000 to 2004(Thousands)
Source: Congressional Budget Office based on Department of Justice, Immigration and Naturalization Service, 2001 Statistical Yearbook of the Immigration and Naturalization Service (February 2003); Department of Homeland Security, Office of Immigration Statistics, 2003 Yearbook of Immigration Statistics (September 2004) and 2004 Yearbook of Immigration Statistics (January 2006); and Department of State, Bureau of Consular Affairs, Report of the Visa Office 2003, available at http://travel.state.gov/visa/about/report/report_2750.html.
a. This category includes both those aliens who entered the United States as lawful permanent residents (LPRs) and those already present in the country who adjusted to LPR status in the year designated.
b. Refugees and asylum-seekers are people who are unable or unwilling to return to their home country because of the risk of persecution or because of a well-founded fear of persecution. Refugees apply for admission from outside of the United States; asylum-seekers request legal admission from within the United States or at a U.S. port of entry.
c. Because certain visas allow nonimmigrants to enter the United States within a window of a few years, the year of issuance might not reflect an alien's actual year of entry. Furthermore, Canadians who travel to the United States on business or as tourists on a short-term basis generally do not need a visa, nor do eligible citizens from countries participating in the Visa Waiver Program.
d. According to preliminary data from the Department of State.
e. The Visa Waiver Program allows eligible citizens of 27 participating countries to enter the United States without a visa for visits of 90 days or less that are related to business or tourism. The participating countries are Andorra, Australia, Austria, Belgium, Brunei, Denmark, Finland, France, Germany, Iceland, Ireland, Italy, Japan, Liechtenstein, Luxembourg, Monaco, the Netherlands, New Zealand, Norway, Portugal, San Marino, Singapore, Slovenia, Spain, Sweden, Switzerland, and the United Kingdom. In recording nonimmigrant admissions, multiple entries by the same individual are not distinguished from first-time entries; therefore, the figures provided do not accurately rep-resent the yearly flow of new nonimmigrants to the United States under this program.
2000 2001 2002 2003 2004
348 443 486 333 406
235 232 187 159 214107 179 175 82 155
66 109 126 45 7151 42 43 46 5043 59 47 41 49___ _____ _____ ___ ___
850 1,064 1,064 706 946
7,142 7,589 5,769 4,882 5,049d
17,595 16,471 13,113 13,490 15,762multiple entries)e
Temporary (Nonimmigrant) Admissions and Issuances
Diversity admissionsRefugees and asylum-seekersb
Other
Total
Permanent (Immigrant) Admissions
Employment-sponsored preference admissions
Immediate Relatives of U.S. Citizens Generally restricted
Family-sponsored preference admissions
Admissions of Lawful Permanent Residentsa
Unrestricted
Visa Issuancesc
Admissions Under the Visa Waiver Program (Includes
Unlawful EntryIn addition to facilitating the lawful admission of both immigrants and nonimmigrants, U.S. policy addresses the issue of unauthorized aliens in the United States. Ac-cording to the Census Bureau and the former Immigra-tion and Naturalization Service, about 7 million unau-thorized aliens were in the United States in 2000. Other researchers have estimated that number at roughly
10 million in early 2004. Although such estimates convey the population of unauthorized aliens living in the United States in a given year, the other statistics presented in this paper represent annual inflows of people into the United States, unless otherwise indicated.
Aliens found to be in violation of U.S. immigration laws may be removed from the country through a formal pro-

SUMMARY IX
cess (which can include penalties such as fines, imprison-ment, or prohibition against future entry) or may be of-fered the chance to depart voluntarily (which does not preclude future entry). In 2004, about 203,000 people were formally removed, and about 1 million others de-
parted voluntarily (some people may have done so more than once). Of the 203,000 formal removals, 42,000 un-authorized aliens were subject to expedited removals, a process designed to speed up the removal of aliens seeking to enter the country illegally.

Immigration Policy in the United States
The Evolution of U.S. Immigration PolicyImmigration has been a subject of legislation for U.S. policymakers since the nation’s founding. In 1790, the Congress established a process enabling people born abroad to become U.S. citizens. The first federal law lim-iting immigration qualitatively was enacted in 1875, pro-hibiting the admission of criminals and prostitutes. The following year, in addressing efforts by the states to con-trol immigration, the Supreme Court declared that the regulation of immigration was the exclusive responsibility of the federal government. As the number of immigrants rose, the Congress established the Immigration Service in 1891, and the federal government assumed responsibility for processing all immigrants seeking admission to the United States.
During World War I, immigration levels were relatively low. However, when mass immigration resumed after the war, quantitative restrictions were introduced. The Con-gress established a new immigration policy: a national-origins quota system, enacted as part of the Quota Law in 1921 and revised in 1924. Immigration was restricted by assigning each nationality a quota based on its representa-tion in past U.S. census figures. The Department of State distributed a limited number of visas each year through U.S. embassies abroad, and the Immigration Service ad-mitted immigrants who arrived with a valid visa. Citizens of other countries could move permanently to the United States by applying for an immigrant visa. Foreign citizens traveling to the United States for a limited time (for in-stance, foreign exchange students, business executives, or tourists) could apply for a nonimmigrant visa.
Family reunification was a fundamental goal of the Quota Law of 1921 and the updated quota law of 1924. Those laws favored immediate relatives of U.S. citizens and other family members, either by exempting them
from numerical restrictions or by granting them prefer-ence within the restrictions. Subsequent laws continued to focus on family reunification as a major goal of immi-gration policy.
The Immigration and Nationality Act Amendments of 1965 abolished the national-origins quota system and established a categorical preference system. The new sys-tem provided preferences for relatives of U.S. citizens and lawful permanent residents and for immigrants with job skills deemed useful to the United States. However, it did not abolish numerical restrictions altogether. For coun-tries in the Eastern Hemisphere (comprising Europe, Asia, Africa, and Australia), the amendments set per-country and total immigration caps, as well as a cap for each of the preference categories. Although there was a total cap established on immigration from the Western Hemisphere, neither the preference categories nor per-country limits were applied to immigrants from the Western Hemisphere. Immediate relatives of U.S. citi-zens—spouses, children under 21, and parents of citizens over 21—were exempted from the caps.
The policies established in the 1965 amendments are still largely in place, although they have been modified at var-ious times. In 1976, the categorical preference system was extended to applicants from the Western Hemisphere. In 1978, the numerical restrictions for Eastern and Western Hemisphere immigration were combined into a single annual worldwide ceiling of 290,000. The Immigration Act of 1990 added a category of admission based on di-versity and increased the worldwide immigration ceiling to the current “flexible” cap of 675,000 per year. That cap can exceed 675,000 in any year when unused visas from the family-sponsored and employment-based categories are available from the previous year. For example, if only 625,000 people were admitted in 2006, the cap would then be raised to 725,000 for 2007.
2 IMMIGRATION POLICY IN THE UNITED STATES
The United States also has participated in the resettle-ment of specific groups of refugees since the close of World War II. The Refugee Act of 1980 created a com-prehensive refugee policy giving the President, in consul-tation with the Congress, the authority to determine the number of refugees that would be admitted on a yearly basis. It brought U.S. policy in line with the 1967 Proto-col to the 1951 United Nations Refugee Convention. The protocol, together with the 1969 Organization of African Unity Convention, expanded the number of peo-ple considered refugees. The Refugee Act adopted the in-ternationally accepted definition of “refugee” contained in the U.N. Convention and Protocol Relating to the Sta-tus of Refugees and applied the same definition to those seeking asylum.
The Immigration Reform and Control Act of 1986 ad-dressed the issue of unauthorized immigration. It sought to enhance enforcement and to create new pathways to legal immigration. Sanctions were imposed on employers who knowingly hired or recruited unauthorized aliens. The law also created two amnesty programs for unautho-rized aliens and a new classification for seasonal agricul-tural workers. The Seasonal Agricultural Worker amnesty program allowed people who had worked for at least 90 days in certain agricultural jobs to apply for permanent resident status. The Legally Authorized Workers amnesty program allowed current unauthorized aliens who had lived in the United States since 1982 to legalize their sta-tus. Under the two amnesty programs, roughly 2.7 mil-lion people residing in the United States illegally became lawful permanent residents.1
In response to continuing concerns about unauthorized immigration, the Illegal Immigration Reform and Immi-grant Responsibility Act of 1996 addressed border en-forcement and the use of social services by immigrants. It increased the number of border patrol agents, introduced new border control measures, reduced government bene-fits available to immigrants, and established a pilot pro-
1. Nancy Rytina, “IRCA Legalization Effects: Lawful Permanent Residence and Naturalization through 2001” (paper presented at The Effects of Immigrant Legalization Programs on the United States: Scientific Evidence on Immigrant Adaptation and Impact on U.S. Economy and Society, The Cloister, Mary Woodward Lasker Center, National Institutes of Health Main Campus, October 25, 2002).
gram in which employers and social services agencies could check by telephone or electronically to verify the el-igibility of immigrants applying for work or social ser-vices benefits.2
The Homeland Security Act of 2002 created the Depart-ment of Homeland Security (DHS) and, in doing so, re-structured the Immigration and Naturalization Service (INS), the agency formerly responsible for immigration services, border enforcement, and border inspections. Nearly all functions of the INS were transferred to DHS. Prior law had combined immigrant service and enforce-ment functions within the same agency; those functions are now divided among different bureaus of DHS. Immi-gration and naturalization are the responsibility of the Bureau of Citizenship and Immigration Services. The border enforcement functions of the INS are split be-tween two bureaus: the Bureau of Customs and Border Protection and the Bureau of Immigration and Customs Enforcement.
Categories of Lawful Admission to the United StatesCurrent immigration policy offers two distinct ways for noncitizens to enter the United States lawfully: perma-nent (or immigrant) admission and temporary (or non-immigrant) admission. People granted permanent admis-sion are formally classified as lawful permanent residents (LPRs) and receive a green card. (The term “immigrant” is correctly applied only to that category of aliens. For more definitions of terms used in this paper, see Box 1.) LPRs are eligible to work in the United States and even-tually may apply for U.S. citizenship.3 Aliens eligible for permanent admission include certain relatives of U.S. cit-izens and workers with specific job skills, among others. In 2004, the United States admitted about 946,000 peo-ple as lawful permanent residents.
2. The employment verification pilot program is voluntary, and the Government Accountability Office has found weaknesses in it. See Government Accountability Office, Immigration Enforcement: Weaknesses Hinder Employment Verification and Worksite Enforce-ment Efforts, GAO-05-813 (August 2005).
3. The naturalization process and requirements for citizenship are described in the appendix.
IMMIGRATION POLICY IN THE UNITED STATES 3
The 946,000 new admissions reported for 2004 include more than first-time entries into the United States. The U.S. Citizenship and Immigration Services (USCIS) counts as “admissions” both new entries of immigrants and adjustments to LPR status for aliens already in the United States. In 2004, for example, roughly 584,000 ad-
Box 1.
Definition of Terms
Terminology used throughout this paper is de-fined by the Department of Homeland Security’s Bureau of Citizenship and Immigration Services:
B Alien refers to any individual who is not a citizen of the United States.
B Immigrant refers to an alien lawfully admit-ted to the United States for permanent resi-dence; such people also may be referred to as lawful permanent residents.
B Nonimmigrant refers to an alien who seeks temporary entry to the United States for a spe-cific purpose. Nonimmigrants include tour-ists, temporary workers, business executives, students, and diplomats.
B Removal is the expulsion of an alien from the United States. The expulsion may be based on grounds of inadmissibility or deportability.
B A U.S. visa allows the bearer to apply for en-try to the United States under a certain classi-fication. Examples of classifications include student (F), visitor (B), and temporary worker (H). A visa does not grant the bearer the right to enter the United States. The Department of State is responsible for visa adjudication at U.S. embassies and consulates outside of the United States. Immigration inspectors with the Department of Homeland Security’s Bu-reau of Customs and Border Protection deter-mine admission into the United States at a port of entry, as well as the duration and con-ditions of stay.
justments to LPR status were granted and about 362,000 aliens entered the country for the first time (see Table 1).
The second path to lawful admission is temporary admis-sion, which is granted to foreign citizens who seek entry to the United States for a limited time and for a specific purpose (such as tourism, diplomacy, temporary work, or study). Under U.S. law, aliens admitted on a temporary basis are classified as “nonimmigrants.” Only non-immigrants with a specific type of visa may be permitted to work in the United States. Nonimmigrants are not eli-gible for citizenship through naturalization; those wish-ing to remain in the United States permanently must ap-ply for permanent admission. In 2004, about 5 million people were granted visas for temporary admission.
Annual issuances of temporary visas, however, are not a measure of the number of nonimmigrants entering the country each year. Most temporary visas are valid for sev-eral years after they are issued. Thus, issuance and entry may occur in different years, and visa holders may enter the country multiple times. The USCIS does report an-nual admissions for nonimmigrants, but those numbers measure entries by nonimmigrants, not just first-time en-tries. For example, each entry by a foreign exchange stu-dent returning from his or her home country after school holidays is counted as an admission. Neither yearly tem-porary visa issuances nor yearly temporary admissions can be directly compared with the measure of yearly perma-nent admissions.
It is important to note that the numbers presented throughout this paper indicate flows of noncitizens into the United States but not their departures. Information on departures of noncitizens from the United States is not recorded, and official estimates are available only on the departures of lawful permanent residents. An earlier pa-per by the Congressional Budget Office found that the best estimates indicate that one-fourth to one-third of le-gal immigrants leave the United States, in most cases within several years of admission.4 The Census Bureau
4. See Congressional Budget Office, A Description of the Immigrant Population (November 2004); and Tammany J. Mulder, Betsy Guzmán, and Angela Brittingham, Evaluating Components of International Migration: Foreign-Born Emigrants, Population Divi-sion Working Paper No. 62 (Department of Commerce, Bureau of the Census, April 2002), p. 6, available at www.census.gov/population/www/techpap.html.
4 IMMIGRATION POLICY IN THE UNITED STATES
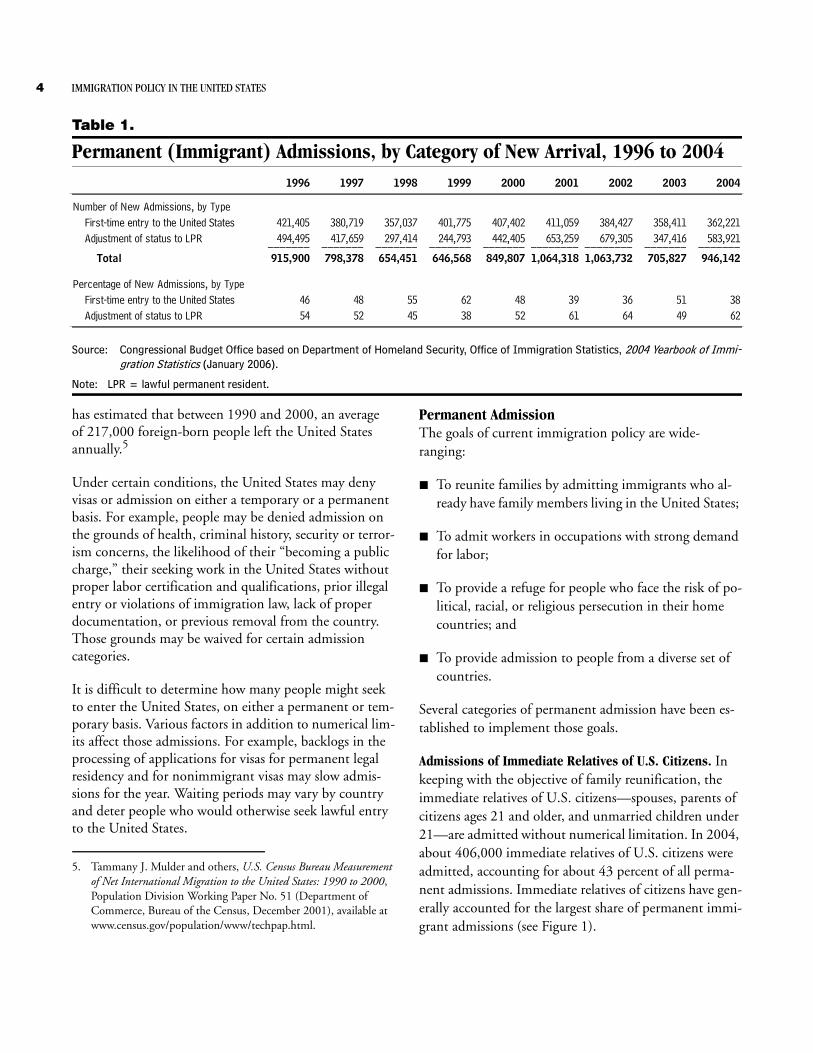
Table 1.
Permanent (Immigrant) Admissions, by Category of New Arrival, 1996 to 2004
Source: Congressional Budget Office based on Department of Homeland Security, Office of Immigration Statistics, 2004 Yearbook of Immi-gration Statistics (January 2006).
Note: LPR = lawful permanent resident.
1996 1997 1998 1999 2000 2001 2002 2003 2004
Number of New Admissions, by TypeFirst-time entry to the United States 421,405 380,719 357,037 401,775 407,402 411,059 384,427 358,411 362,221Adjustment of status to LPR 494,495 417,659 297,414 244,793 442,405 653,259 679,305 347,416 583,921_______ _______ _______ _______ _______ ________ ________ _______ _______
Total 915,900 798,378 654,451 646,568 849,807 1,064,318 1,063,732 705,827 946,142
First-time entry to the United States 46 48 55 62 48 39 36 51 38Adjustment of status to LPR 54 52 45 38 52 61 64 49 62
Percentage of New Admissions, by Type
has estimated that between 1990 and 2000, an averageof 217,000 foreign-born people left the United Statesannually.5
Under certain conditions, the United States may denyvisas or admission on either a temporary or a permanent basis. For example, people may be denied admission on the grounds of health, criminal history, security or terror-ism concerns, the likelihood of their “becoming a public charge,” their seeking work in the United States without proper labor certification and qualifications, prior illegal entry or violations of immigration law, lack of proper documentation, or previous removal from the country. Those grounds may be waived for certain admissioncategories.
It is difficult to determine how many people might seek to enter the United States, on either a permanent or tem-porary basis. Various factors in addition to numerical lim-its affect those admissions. For example, backlogs in the processing of applications for visas for permanent legal residency and for nonimmigrant visas may slow admis-sions for the year. Waiting periods may vary by country and deter people who would otherwise seek lawful entry to the United States.
5. Tammany J. Mulder and others, U.S. Census Bureau Measurement of Net International Migration to the United States: 1990 to 2000, Population Division Working Paper No. 51 (Department of Commerce, Bureau of the Census, December 2001), available at www.census.gov/population/www/techpap.html.
Permanent AdmissionThe goals of current immigration policy are wide-ranging:
B To reunite families by admitting immigrants who al-ready have family members living in the United States;
B To admit workers in occupations with strong demand for labor;
B To provide a refuge for people who face the risk of po-litical, racial, or religious persecution in their home countries; and
B To provide admission to people from a diverse set of countries.
Several categories of permanent admission have been es-tablished to implement those goals.
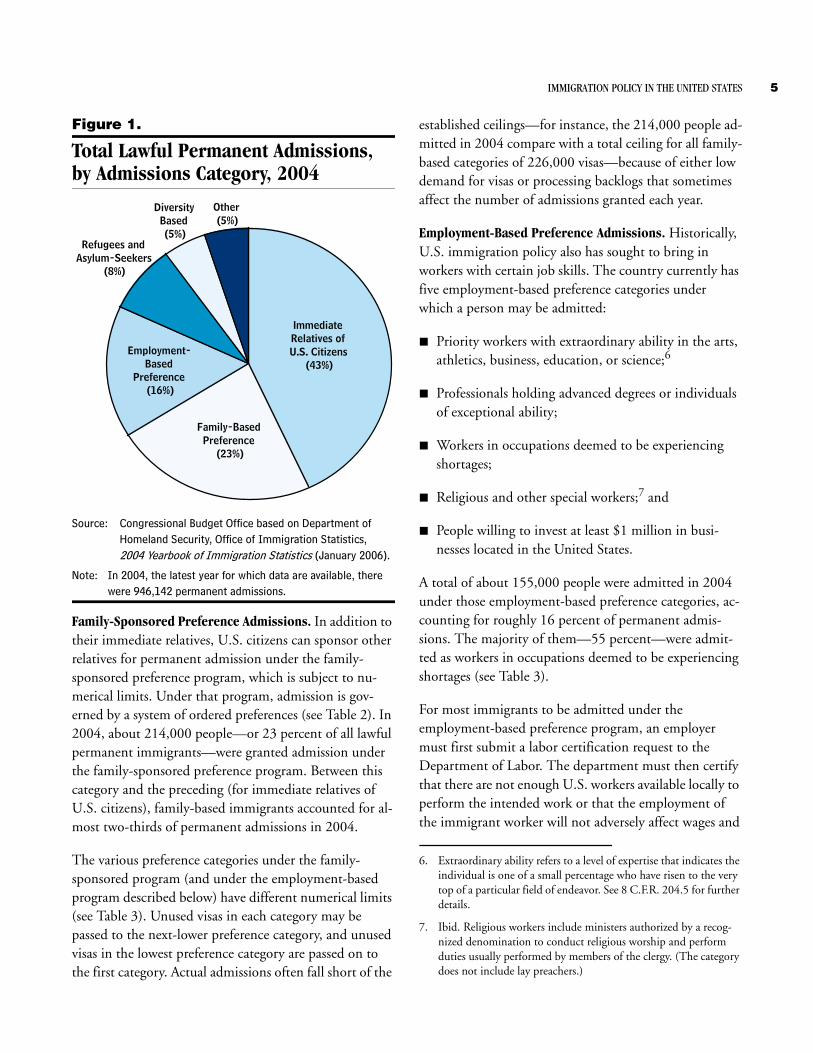
Admissions of Immediate Relatives of U.S. Citizens. In keeping with the objective of family reunification, the immediate relatives of U.S. citizens—spouses, parents of citizens ages 21 and older, and unmarried children under 21—are admitted without numerical limitation. In 2004, about 406,000 immediate relatives of U.S. citizens were admitted, accounting for about 43 percent of all perma-nent admissions. Immediate relatives of citizens have gen-erally accounted for the largest share of permanent immi-grant admissions (see Figure 1).
IMMIGRATION POLICY IN THE UNITED STATES 5
Figure 1.
Total Lawful Permanent Admissions, by Admissions Category, 2004
Source: Congressional Budget Office based on Department of Homeland Security, Office of Immigration Statistics, 2004 Yearbook of Immigration Statistics (January 2006).
Note: In 2004, the latest year for which data are available, there were 946,142 permanent admissions.
Family-Sponsored Preference Admissions. In addition to their immediate relatives, U.S. citizens can sponsor other relatives for permanent admission under the family-sponsored preference program, which is subject to nu-merical limits. Under that program, admission is gov-erned by a system of ordered preferences (see Table 2). In 2004, about 214,000 people—or 23 percent of all lawful permanent immigrants—were granted admission under the family-sponsored preference program. Between this category and the preceding (for immediate relatives of U.S. citizens), family-based immigrants accounted for al-most two-thirds of permanent admissions in 2004.
The various preference categories under the family-sponsored program (and under the employment-based program described below) have different numerical limits (see Table 3). Unused visas in each category may be passed to the next-lower preference category, and unused visas in the lowest preference category are passed on to the first category. Actual admissions often fall short of the
ImmediateRelatives ofU.S. Citizens
(43%)
Family-BasedPreference
(23%)
Employment-Based
Preference (16%)
Refugees andAsylum-Seekers
(8%)
DiversityBased (5%)
Other (5%)
established ceilings—for instance, the 214,000 people ad-mitted in 2004 compare with a total ceiling for all family-based categories of 226,000 visas—because of either low demand for visas or processing backlogs that sometimes affect the number of admissions granted each year.
Employment-Based Preference Admissions. Historically, U.S. immigration policy also has sought to bring in workers with certain job skills. The country currently has five employment-based preference categories under which a person may be admitted:
B Priority workers with extraordinary ability in the arts, athletics, business, education, or science;6
B Professionals holding advanced degrees or individuals of exceptional ability;
B Workers in occupations deemed to be experiencing shortages;
B Religious and other special workers;7 and
B People willing to invest at least $1 million in busi-nesses located in the United States.
A total of about 155,000 people were admitted in 2004 under those employment-based preference categories, ac-counting for roughly 16 percent of permanent admis-sions. The majority of them—55 percent—were admit-ted as workers in occupations deemed to be experiencing shortages (see Table 3).
For most immigrants to be admitted under the employment-based preference program, an employer must first submit a labor certification request to the Department of Labor. The department must then certify that there are not enough U.S. workers available locally to perform the intended work or that the employment of the immigrant worker will not adversely affect wages and
6. Extraordinary ability refers to a level of expertise that indicates the individual is one of a small percentage who have risen to the very top of a particular field of endeavor. See 8 C.F.R. 204.5 for further details.
7. Ibid. Religious workers include ministers authorized by a recog-nized denomination to conduct religious worship and perform duties usually performed by members of the clergy. (The category does not include lay preachers.)
6 IMMIGRATION POLICY IN THE UNITED STATES
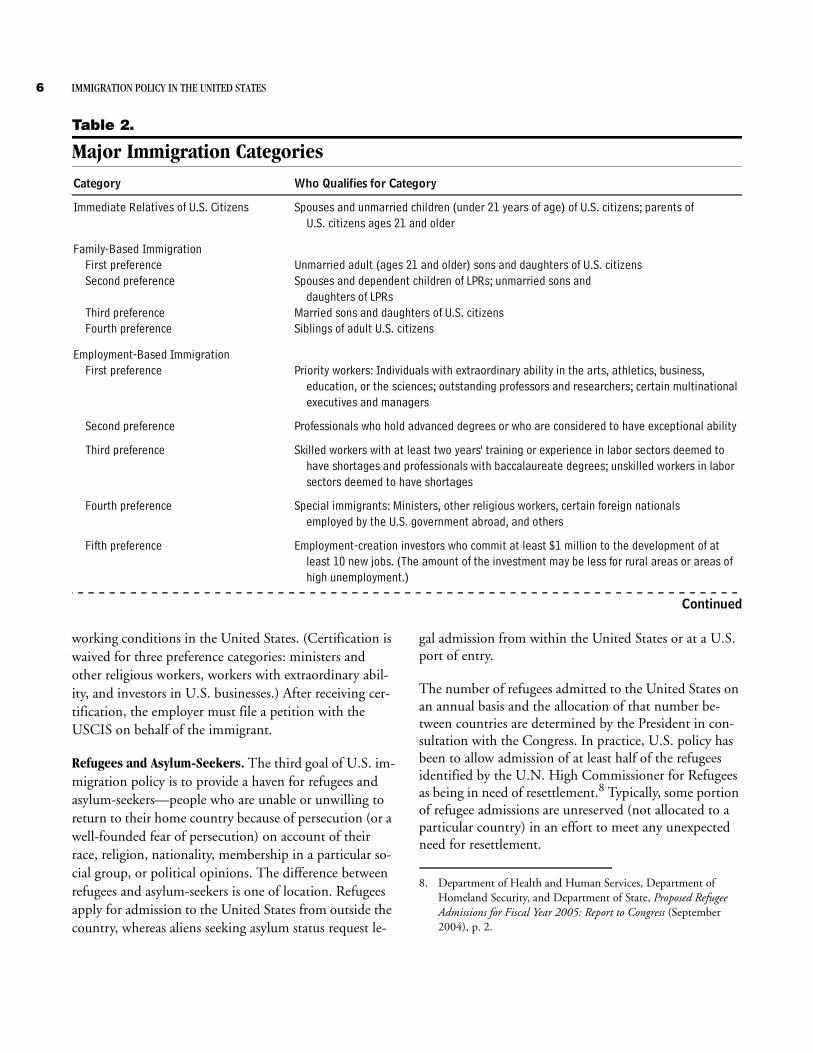
Table 2.
Major Immigration Categories
Continued
Category
Spouses and unmarried children (under 21 years of age) of U.S. citizens; parents of U.S. citizens ages 21 and older
Family-Based ImmigrationFirst preference Unmarried adult (ages 21 and older) sons and daughters of U.S. citizens Second preference Spouses and dependent children of LPRs; unmarried sons and
daughters of LPRs Third preference Married sons and daughters of U.S. citizensFourth preference Siblings of adult U.S. citizens
Employment-Based ImmigrationFirst preference Priority workers: Individuals with extraordinary ability in the arts, athletics, business,
education, or the sciences; outstanding professors and researchers; certain multinational executives and managers
Second preference Professionals who hold advanced degrees or who are considered to have exceptional ability
Third preference Skilled workers with at least two years' training or experience in labor sectors deemed to have shortages and professionals with baccalaureate degrees; unskilled workers in labor sectors deemed to have shortages
Fourth preference Special immigrants: Ministers, other religious workers, certain foreign nationals employed by the U.S. government abroad, and others
Fifth preference Employment-creation investors who commit at least $1 million to the development of at least 10 new jobs. (The amount of the investment may be less for rural areas or areas of high unemployment.)
Who Qualifies for Category
Immediate Relatives of U.S. Citizens
working conditions in the United States. (Certification is waived for three preference categories: ministers and other religious workers, workers with extraordinary abil-ity, and investors in U.S. businesses.) After receiving cer-tification, the employer must file a petition with the USCIS on behalf of the immigrant.
Refugees and Asylum-Seekers. The third goal of U.S. im-migration policy is to provide a haven for refugees and asylum-seekers—people who are unable or unwilling to return to their home country because of persecution (or a well-founded fear of persecution) on account of their race, religion, nationality, membership in a particular so-cial group, or political opinions. The difference between refugees and asylum-seekers is one of location. Refugees apply for admission to the United States from outside the country, whereas aliens seeking asylum status request le-
gal admission from within the United States or at a U.S. port of entry.
The number of refugees admitted to the United States on an annual basis and the allocation of that number be-tween countries are determined by the President in con-sultation with the Congress. In practice, U.S. policy has been to allow admission of at least half of the refugees identified by the U.N. High Commissioner for Refugees as being in need of resettlement.8 Typically, some portion of refugee admissions are unreserved (not allocated to a particular country) in an effort to meet any unexpected need for resettlement.
8. Department of Health and Human Services, Department of Homeland Security, and Department of State, Proposed Refugee Admissions for Fiscal Year 2005: Report to Congress (September 2004), p. 2.
IMMIGRATION POLICY IN THE UNITED STATES 7
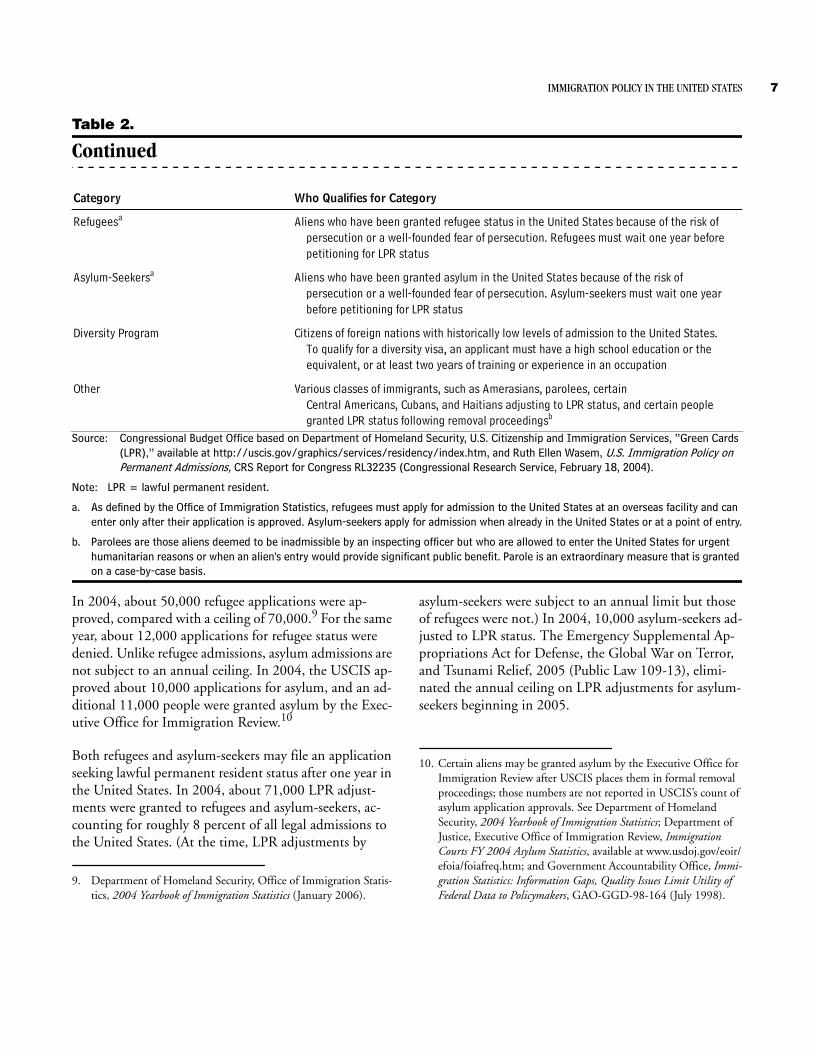
Table 2.
Continued
Source: Congressional Budget Office based on Department of Homeland Security, U.S. Citizenship and Immigration Services, “Green Cards (LPR),” available at http://uscis.gov/graphics/services/residency/index.htm, and Ruth Ellen Wasem, U.S. Immigration Policy on Permanent Admissions, CRS Report for Congress RL32235 (Congressional Research Service, February 18, 2004).
Note: LPR = lawful permanent resident.
a. As defined by the Office of Immigration Statistics, refugees must apply for admission to the United States at an overseas facility and can enter only after their application is approved. Asylum-seekers apply for admission when already in the United States or at a point of entry.
b. Parolees are those aliens deemed to be inadmissible by an inspecting officer but who are allowed to enter the United States for urgent humanitarian reasons or when an alien's entry would provide significant public benefit. Parole is an extraordinary measure that is granted on a case-by-case basis.
Category
Refugeesa Aliens who have been granted refugee status in the United States because of the risk ofpersecution or a well-founded fear of persecution. Refugees must wait one year before petitioning for LPR status
Asylum-Seekersa Aliens who have been granted asylum in the United States because of the risk of persecution or a well-founded fear of persecution. Asylum-seekers must wait one year before petitioning for LPR status
Diversity Program Citizens of foreign nations with historically low levels of admission to the United States. To qualify for a diversity visa, an applicant must have a high school education or the equivalent, or at least two years of training or experience in an occupation
Other Various classes of immigrants, such as Amerasians, parolees, certain Central Americans, Cubans, and Haitians adjusting to LPR status, and certain people granted LPR status following removal proceedingsb
Who Qualifies for Category
In 2004, about 50,000 refugee applications were ap-proved, compared with a ceiling of 70,000.9 For the same year, about 12,000 applications for refugee status were denied. Unlike refugee admissions, asylum admissions are not subject to an annual ceiling. In 2004, the USCIS ap-proved about 10,000 applications for asylum, and an ad-ditional 11,000 people were granted asylum by the Exec-utive Office for Immigration Review.10
Both refugees and asylum-seekers may file an application seeking lawful permanent resident status after one year in the United States. In 2004, about 71,000 LPR adjust-ments were granted to refugees and asylum-seekers, ac-counting for roughly 8 percent of all legal admissions to the United States. (At the time, LPR adjustments by
9. Department of Homeland Security, Office of Immigration Statis-tics, 2004 Yearbook of Immigration Statistics (January 2006).
asylum-seekers were subject to an annual limit but those of refugees were not.) In 2004, 10,000 asylum-seekers ad-justed to LPR status. The Emergency Supplemental Ap-propriations Act for Defense, the Global War on Terror, and Tsunami Relief, 2005 (Public Law 109-13), elimi-nated the annual ceiling on LPR adjustments for asylum-seekers beginning in 2005.
10. Certain aliens may be granted asylum by the Executive Office for Immigration Review after USCIS places them in formal removal proceedings; those numbers are not reported in USCIS’s count of asylum application approvals. See Department of Homeland Security, 2004 Yearbook of Immigration Statistics; Department of Justice, Executive Office of Immigration Review, Immigration Courts FY 2004 Asylum Statistics, available at www.usdoj.gov/eoir/efoia/foiafreq.htm; and Government Accountability Office, Immi-gration Statistics: Information Gaps, Quality Issues Limit Utility of Federal Data to Policymakers, GAO-GGD-98-164 (July 1998).
8 IMMIGRATION POLICY IN THE UNITED STATES
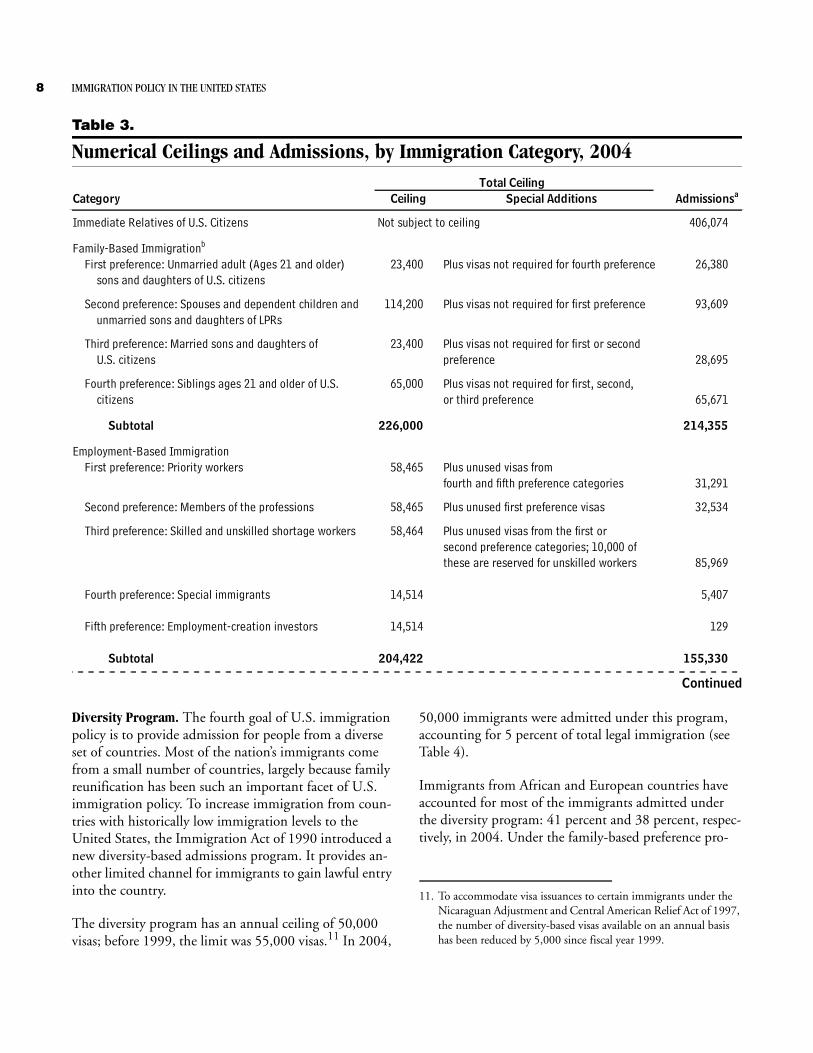
Table 3.
Numerical Ceilings and Admissions, by Immigration Category, 2004
Continued
Total CeilingCategory
Immediate Relatives of U.S. Citizens Not subject to ceiling 406,074
Family-Based Immigrationb
First preference: Unmarried adult (Ages 21 and older) 23,400 Plus visas not required for fourth preference 26,380sons and daughters of U.S. citizens
Second preference: Spouses and dependent children and 114,200 Plus visas not required for first preference 93,609unmarried sons and daughters of LPRs
Third preference: Married sons and daughters of 23,400 Plus visas not required for first or second U.S. citizens preference 28,695
Fourth preference: Siblings ages 21 and older of U.S. 65,000 Plus visas not required for first, second, citizens or third preference 65,671
Subtotal 226,000 214,355
Employment-Based ImmigrationFirst preference: Priority workers 58,465 Plus unused visas from
fourth and fifth preference categories 31,291
Second preference: Members of the professions 58,465 Plus unused first preference visas 32,534
Third preference: Skilled and unskilled shortage workers 58,464 Plus unused visas from the first or second preference categories; 10,000 of these are reserved for unskilled workers 85,969
Fourth preference: Special immigrants 14,514 5,407
Fifth preference: Employment-creation investors 14,514 129
Subtotal 204,422 155,330
Ceiling AdmissionsaSpecial Additions
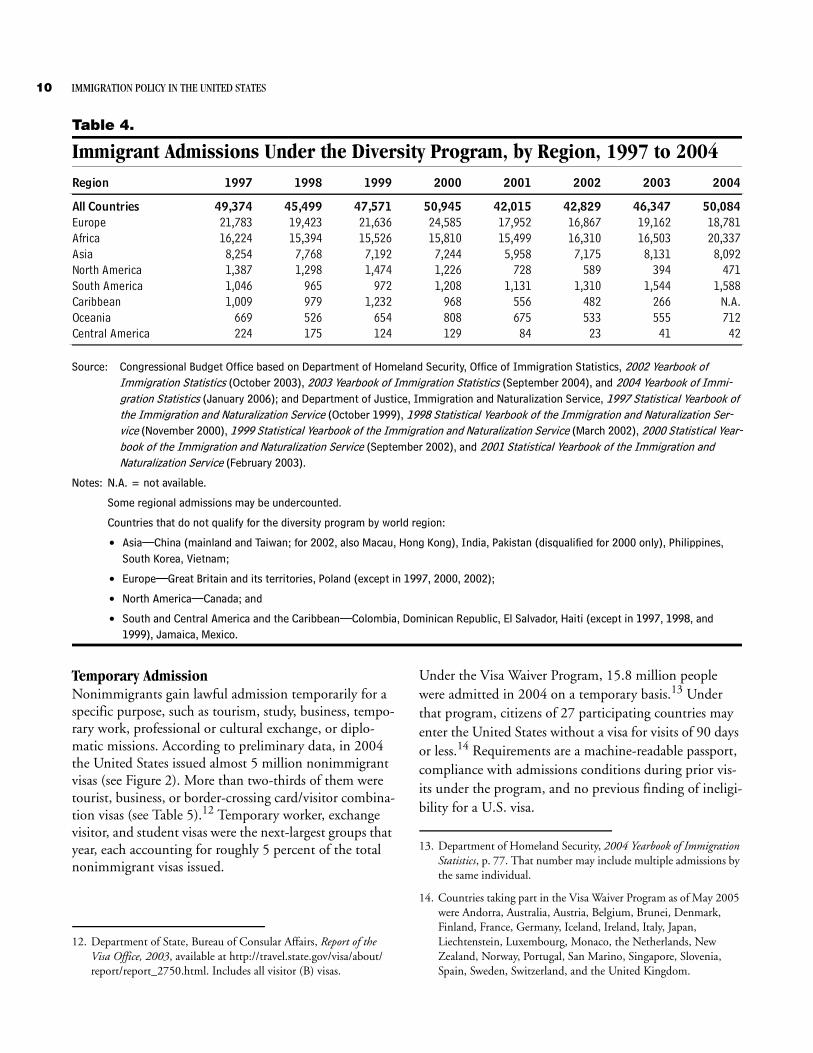
Diversity Program. The fourth goal of U.S. immigration policy is to provide admission for people from a diverse set of countries. Most of the nation’s immigrants come from a small number of countries, largely because family reunification has been such an important facet of U.S. immigration policy. To increase immigration from coun-tries with historically low immigration levels to the United States, the Immigration Act of 1990 introduced a new diversity-based admissions program. It provides an-other limited channel for immigrants to gain lawful entry into the country.
The diversity program has an annual ceiling of 50,000 visas; before 1999, the limit was 55,000 visas.11 In 2004,
50,000 immigrants were admitted under this program, accounting for 5 percent of total legal immigration (see Table 4).
Immigrants from African and European countries have accounted for most of the immigrants admitted under the diversity program: 41 percent and 38 percent, respec-tively, in 2004. Under the family-based preference pro-
11. To accommodate visa issuances to certain immigrants under the Nicaraguan Adjustment and Central American Relief Act of 1997, the number of diversity-based visas available on an annual basis has been reduced by 5,000 since fiscal year 1999.
IMMIGRATION POLICY IN THE UNITED STATES 9
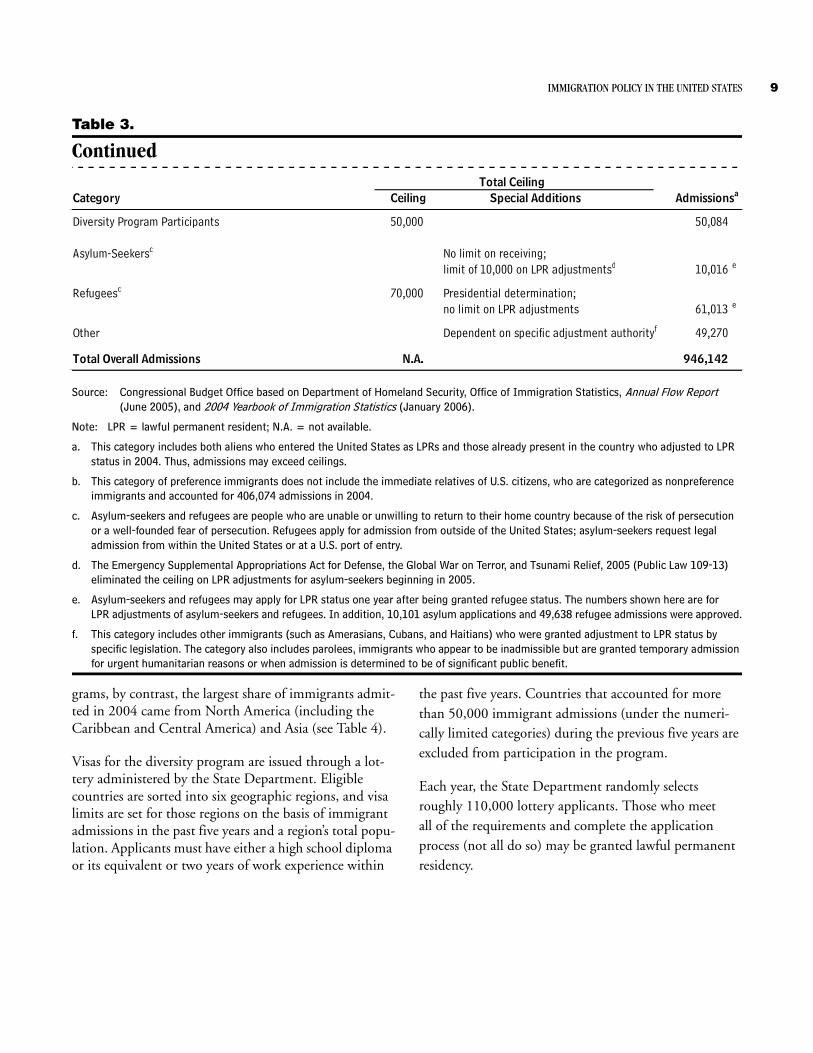
Table 3.
Continued
Source: Congressional Budget Office based on Department of Homeland Security, Office of Immigration Statistics, Annual Flow Report (June 2005), and 2004 Yearbook of Immigration Statistics (January 2006).
Note: LPR = lawful permanent resident; N.A. = not available.
a. This category includes both aliens who entered the United States as LPRs and those already present in the country who adjusted to LPR status in 2004. Thus, admissions may exceed ceilings.
b. This category of preference immigrants does not include the immediate relatives of U.S. citizens, who are categorized as nonpreference immigrants and accounted for 406,074 admissions in 2004.
c. Asylum-seekers and refugees are people who are unable or unwilling to return to their home country because of the risk of persecution or a well-founded fear of persecution. Refugees apply for admission from outside of the United States; asylum-seekers request legal admission from within the United States or at a U.S. port of entry.
d. The Emergency Supplemental Appropriations Act for Defense, the Global War on Terror, and Tsunami Relief, 2005 (Public Law 109-13) eliminated the ceiling on LPR adjustments for asylum-seekers beginning in 2005.
e. Asylum-seekers and refugees may apply for LPR status one year after being granted refugee status. The numbers shown here are for LPR adjustments of asylum-seekers and refugees. In addition, 10,101 asylum applications and 49,638 refugee admissions were approved.
f. This category includes other immigrants (such as Amerasians, Cubans, and Haitians) who were granted adjustment to LPR status by specific legislation. The category also includes parolees, immigrants who appear to be inadmissible but are granted temporary admission for urgent humanitarian reasons or when admission is determined to be of significant public benefit.
Total CeilingCategory Special Additions
Diversity Program Participants 50,000 50,084
Asylum-Seekersc No limit on receiving;limit of 10,000 on LPR adjustmentsd 10,016 e
Refugeesc 70,000 Presidential determination; no limit on LPR adjustments 61,013 e
Other Dependent on specific adjustment authorityf 49,270
Total Overall Admissions N.A. 946,142
Ceiling Admissionsa
grams, by contrast, the largest share of immigrants admit-ted in 2004 came from North America (including the Caribbean and Central America) and Asia (see Table 4).
Visas for the diversity program are issued through a lot-tery administered by the State Department. Eligible countries are sorted into six geographic regions, and visa limits are set for those regions on the basis of immigrant admissions in the past five years and a region’s total popu-lation. Applicants must have either a high school diploma or its equivalent or two years of work experience within
the past five years. Countries that accounted for more than 50,000 immigrant admissions (under the numeri-cally limited categories) during the previous five years are excluded from participation in the program.
Each year, the State Department randomly selects roughly 110,000 lottery applicants. Those who meetall of the requirements and complete the applicationprocess (not all do so) may be granted lawful permanent residency.
10 IMMIGRATION POLICY IN THE UNITED STATES
Table 4.
Immigrant Admissions Under the Diversity Program, by Region, 1997 to 2004
Source: Congressional Budget Office based on Department of Homeland Security, Office of Immigration Statistics, 2002 Yearbook of Immigration Statistics (October 2003), 2003 Yearbook of Immigration Statistics (September 2004), and 2004 Yearbook of Immi-gration Statistics (January 2006); and Department of Justice, Immigration and Naturalization Service, 1997 Statistical Yearbook of the Immigration and Naturalization Service (October 1999), 1998 Statistical Yearbook of the Immigration and Naturalization Ser-vice (November 2000), 1999 Statistical Yearbook of the Immigration and Naturalization Service (March 2002), 2000 Statistical Year-book of the Immigration and Naturalization Service (September 2002), and 2001 Statistical Yearbook of the Immigration and Naturalization Service (February 2003).
Notes: N.A. = not available.
Some regional admissions may be undercounted.
Countries that do not qualify for the diversity program by world region:
• Asia—China (mainland and Taiwan; for 2002, also Macau, Hong Kong), India, Pakistan (disqualified for 2000 only), Philippines, South Korea, Vietnam;
• Europe—Great Britain and its territories, Poland (except in 1997, 2000, 2002);
• North America—Canada; and
• South and Central America and the Caribbean—Colombia, Dominican Republic, El Salvador, Haiti (except in 1997, 1998, and 1999), Jamaica, Mexico.
Region 1997 1998 1999 2000 2001 2002 2003 2004
All Countries 49,374 45,499 47,571 50,945 42,015 42,829 46,347 50,084Europe 21,783 19,423 21,636 24,585 17,952 16,867 19,162 18,781Africa 16,224 15,394 15,526 15,810 15,499 16,310 16,503 20,337Asia 8,254 7,768 7,192 7,244 5,958 7,175 8,131 8,092North America 1,387 1,298 1,474 1,226 728 589 394 471South America 1,046 965 972 1,208 1,131 1,310 1,544 1,588Caribbean 1,009 979 1,232 968 556 482 266 N.A.Oceania 669 526 654 808 675 533 555 712Central America 224 175 124 129 84 23 41 42
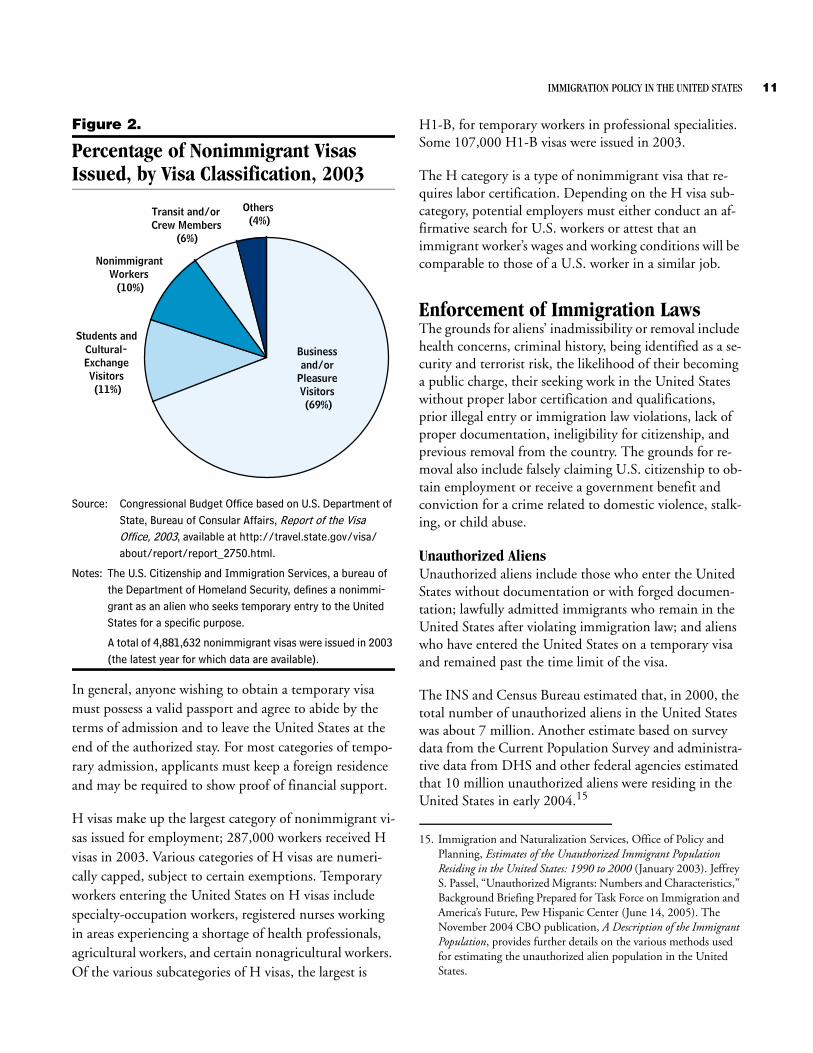
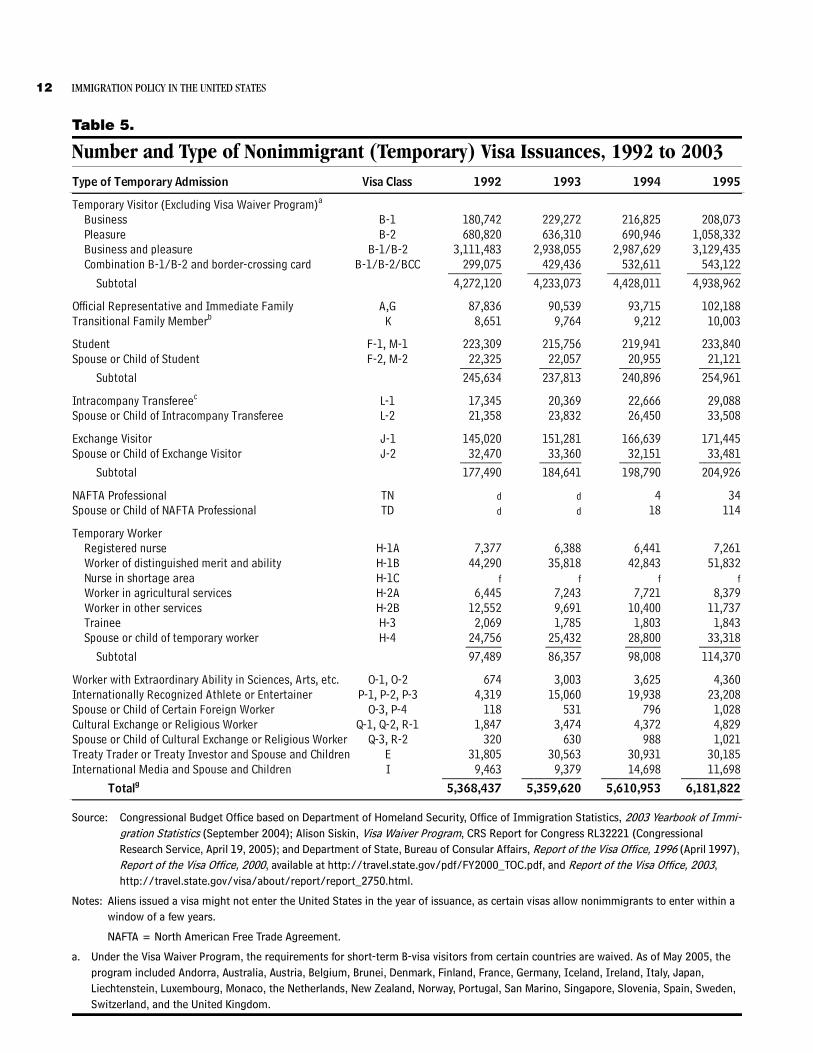
Temporary AdmissionNonimmigrants gain lawful admission temporarily for a specific purpose, such as tourism, study, business, tempo-rary work, professional or cultural exchange, or diplo-matic missions. According to preliminary data, in 2004 the United States issued almost 5 million nonimmigrant visas (see Figure 2). More than two-thirds of them were tourist, business, or border-crossing card/visitor combina-tion visas (see Table 5).12 Temporary worker, exchange visitor, and student visas were the next-largest groups that year, each accounting for roughly 5 percent of the total nonimmigrant visas issued.
12. Department of State, Bureau of Consular Affairs, Report of the Visa Office, 2003, available at http://travel.state.gov/visa/about/report/report_2750.html. Includes all visitor (B) visas.
Under the Visa Waiver Program, 15.8 million people were admitted in 2004 on a temporary basis.13 Under that program, citizens of 27 participating countries may enter the United States without a visa for visits of 90 days or less.14 Requirements are a machine-readable passport, compliance with admissions conditions during prior vis-its under the program, and no previous finding of ineligi-bility for a U.S. visa.
13. Department of Homeland Security, 2004 Yearbook of Immigration Statistics, p. 77. That number may include multiple admissions by the same individual.
14. Countries taking part in the Visa Waiver Program as of May 2005 were Andorra, Australia, Austria, Belgium, Brunei, Denmark, Finland, France, Germany, Iceland, Ireland, Italy, Japan, Liechtenstein, Luxembourg, Monaco, the Netherlands, New Zealand, Norway, Portugal, San Marino, Singapore, Slovenia, Spain, Sweden, Switzerland, and the United Kingdom.
IMMIGRATION POLICY IN THE UNITED STATES 11
Figure 2.
Percentage of Nonimmigrant Visas Issued, by Visa Classification, 2003
Source: Congressional Budget Office based on U.S. Department of State, Bureau of Consular Affairs, Report of the Visa Office, 2003, available at http://travel.state.gov/visa/about/report/report_2750.html.
Notes: The U.S. Citizenship and Immigration Services, a bureau of the Department of Homeland Security, defines a nonimmi-grant as an alien who seeks temporary entry to the United States for a specific purpose.
A total of 4,881,632 nonimmigrant visas were issued in 2003 (the latest year for which data are available).
In general, anyone wishing to obtain a temporary visa must possess a valid passport and agree to abide by the terms of admission and to leave the United States at the end of the authorized stay. For most categories of tempo-rary admission, applicants must keep a foreign residence and may be required to show proof of financial support.
H visas make up the largest category of nonimmigrant vi-sas issued for employment; 287,000 workers received H visas in 2003. Various categories of H visas are numeri-cally capped, subject to certain exemptions. Temporary workers entering the United States on H visas include specialty-occupation workers, registered nurses working in areas experiencing a shortage of health professionals, agricultural workers, and certain nonagricultural workers. Of the various subcategories of H visas, the largest is
Businessand/or
PleasureVisitors (69%)
Students andCultural-ExchangeVisitors (11%)
NonimmigrantWorkers (10%)
Transit and/orCrew Members
(6%)
Others (4%)
H1-B, for temporary workers in professional specialities. Some 107,000 H1-B visas were issued in 2003.
The H category is a type of nonimmigrant visa that re-quires labor certification. Depending on the H visa sub-category, potential employers must either conduct an af-firmative search for U.S. workers or attest that an immigrant worker’s wages and working conditions will be comparable to those of a U.S. worker in a similar job.
Enforcement of Immigration LawsThe grounds for aliens’ inadmissibility or removal include health concerns, criminal history, being identified as a se-curity and terrorist risk, the likelihood of their becoming a public charge, their seeking work in the United States without proper labor certification and qualifications, prior illegal entry or immigration law violations, lack of proper documentation, ineligibility for citizenship, and previous removal from the country. The grounds for re-moval also include falsely claiming U.S. citizenship to ob-tain employment or receive a government benefit and conviction for a crime related to domestic violence, stalk-ing, or child abuse.
Unauthorized AliensUnauthorized aliens include those who enter the United States without documentation or with forged documen-tation; lawfully admitted immigrants who remain in the United States after violating immigration law; and aliens who have entered the United States on a temporary visa and remained past the time limit of the visa.
The INS and Census Bureau estimated that, in 2000, the total number of unauthorized aliens in the United States was about 7 million. Another estimate based on survey data from the Current Population Survey and administra-tive data from DHS and other federal agencies estimated that 10 million unauthorized aliens were residing in the United States in early 2004.15
15. Immigration and Naturalization Services, Office of Policy and Planning, Estimates of the Unauthorized Immigrant Population Residing in the United States: 1990 to 2000 (January 2003). Jeffrey S. Passel, “Unauthorized Migrants: Numbers and Characteristics,” Background Briefing Prepared for Task Force on Immigration and America’s Future, Pew Hispanic Center (June 14, 2005). The November 2004 CBO publication, A Description of the Immigrant Population, provides further details on the various methods used for estimating the unauthorized alien population in the United States.
12 IMMIGRATION POLICY IN THE UNITED STATES
Table 5.
Number and Type of Nonimmigrant (Temporary) Visa Issuances, 1992 to 2003
Source: Congressional Budget Office based on Department of Homeland Security, Office of Immigration Statistics, 2003 Yearbook of Immi-gration Statistics (September 2004); Alison Siskin, Visa Waiver Program, CRS Report for Congress RL32221 (Congressional Research Service, April 19, 2005); and Department of State, Bureau of Consular Affairs, Report of the Visa Office, 1996 (April 1997), Report of the Visa Office, 2000, available at http://travel.state.gov/pdf/FY2000_TOC.pdf, and Report of the Visa Office, 2003, http://travel.state.gov/visa/about/report/report_2750.html.
Notes: Aliens issued a visa might not enter the United States in the year of issuance, as certain visas allow nonimmigrants to enter within a window of a few years.
NAFTA = North American Free Trade Agreement.
a. Under the Visa Waiver Program, the requirements for short-term B-visa visitors from certain countries are waived. As of May 2005, the program included Andorra, Australia, Austria, Belgium, Brunei, Denmark, Finland, France, Germany, Iceland, Ireland, Italy, Japan,Liechtenstein, Luxembourg, Monaco, the Netherlands, New Zealand, Norway, Portugal, San Marino, Singapore, Slovenia, Spain, Sweden, Switzerland, and the United Kingdom.
Type of Temporary Admission Visa Class 1992 1993 1994 1995
Temporary Visitor (Excluding Visa Waiver Program)a
B-1 180,742 229,272 216,825 208,073B-2 680,820 636,310 690,946 1,058,332
B-1/B-2 3,111,483 2,938,055 2,987,629 3,129,435B-1/B-2/BCC 299,075 429,436 532,611 543,122_________ _________ _________ _________
4,272,120 4,233,073 4,428,011 4,938,962
Official Representative and Immediate Family A,G 87,836 90,539 93,715 102,188Transitional Family Memberb K 8,651 9,764 9,212 10,003
Student F-1, M-1 223,309 215,756 219,941 233,840Spouse or Child of Student F-2, M-2 22,325 22,057 20,955 21,121_______ _______ _______ _______
245,634 237,813 240,896 254,961
Intracompany Transfereec L-1 17,345 20,369 22,666 29,088Spouse or Child of Intracompany Transferee L-2 21,358 23,832 26,450 33,508
Exchange Visitor J-1 145,020 151,281 166,639 171,445Spouse or Child of Exchange Visitor J-2 32,470 33,360 32,151 33,481_______ _______ _______ _______
177,490 184,641 198,790 204,926
NAFTA Professional TN d d 4 34Spouse or Child of NAFTA Professional TD d d 18 114
Temporary WorkerRegistered nurse H-1A 7,377 6,388 6,441 7,261Worker of distinguished merit and ability H-1B 44,290 35,818 42,843 51,832Nurse in shortage area H-1C f f f fWorker in agricultural services H-2A 6,445 7,243 7,721 8,379Worker in other services H-2B 12,552 9,691 10,400 11,737Trainee H-3 2,069 1,785 1,803 1,843Spouse or child of temporary worker H-4 24,756 25,432 28,800 33,318______ ______ ______ _______
Subtotal 97,489 86,357 98,008 114,370
Worker with Extraordinary Ability in Sciences, Arts, etc. O-1, O-2 674 3,003 3,625 4,360Internationally Recognized Athlete or Entertainer P-1, P-2, P-3 4,319 15,060 19,938 23,208Spouse or Child of Certain Foreign Worker O-3, P-4 118 531 796 1,028Cultural Exchange or Religious Worker Q-1, Q-2, R-1 1,847 3,474 4,372 4,829Spouse or Child of Cultural Exchange or Religious Worker Q-3, R-2 320 630 988 1,021Treaty Trader or Treaty Investor and Spouse and Children E 31,805 30,563 30,931 30,185International Media and Spouse and Children I 9,463 9,379 14,698 11,698__________ __________ __________ __________
Totalg 5,368,437 5,359,620 5,610,953 6,181,822
Subtotal
Subtotal
BusinessPleasureBusiness and pleasureCombination B-1/B-2 and border-crossing card
Subtotal
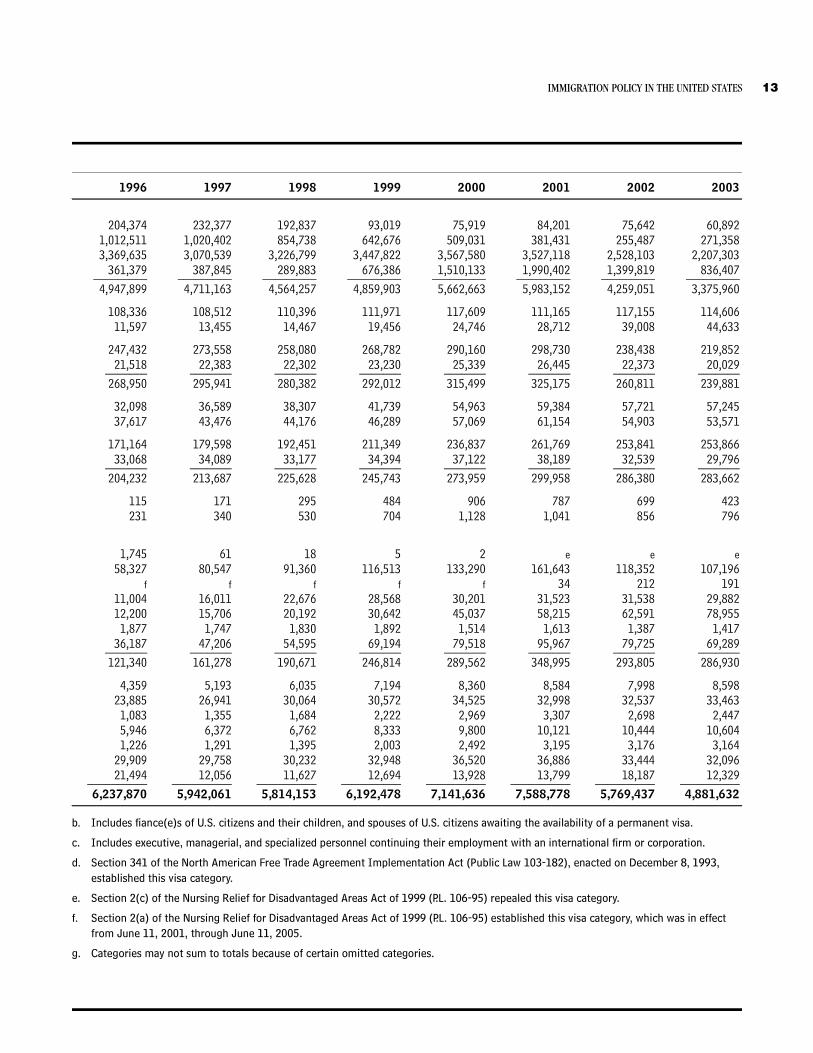
IMMIGRATION POLICY IN THE UNITED STATES 13
b. Includes fiance(e)s of U.S. citizens and their children, and spouses of U.S. citizens awaiting the availability of a permanent visa.
c. Includes executive, managerial, and specialized personnel continuing their employment with an international firm or corporation.
d. Section 341 of the North American Free Trade Agreement Implementation Act (Public Law 103-182), enacted on December 8, 1993, established this visa category.
e. Section 2(c) of the Nursing Relief for Disadvantaged Areas Act of 1999 (P.L. 106-95) repealed this visa category.
f. Section 2(a) of the Nursing Relief for Disadvantaged Areas Act of 1999 (P.L. 106-95) established this visa category, which was in effect from June 11, 2001, through June 11, 2005.
g. Categories may not sum to totals because of certain omitted categories.
1996 1997 1998 1999 2000 2001 2002 2003
204,374 232,377 192,837 93,019 75,919 84,201 75,642 60,8921,012,511 1,020,402 854,738 642,676 509,031 381,431 255,487 271,3583,369,635 3,070,539 3,226,799 3,447,822 3,567,580 3,527,118 2,528,103 2,207,303
361,379 387,845 289,883 676,386 1,510,133 1,990,402 1,399,819 836,407_________ _________ _________ _________ _________ _________ _________ _________4,947,899 4,711,163 4,564,257 4,859,903 5,662,663 5,983,152 4,259,051 3,375,960
108,336 108,512 110,396 111,971 117,609 111,165 117,155 114,60611,597 13,455 14,467 19,456 24,746 28,712 39,008 44,633
247,432 273,558 258,080 268,782 290,160 298,730 238,438 219,85221,518 22,383 22,302 23,230 25,339 26,445 22,373 20,029_______ _______ _______ _______ _______ _______ _______ _______
268,950 295,941 280,382 292,012 315,499 325,175 260,811 239,881
32,098 36,589 38,307 41,739 54,963 59,384 57,721 57,24537,617 43,476 44,176 46,289 57,069 61,154 54,903 53,571
171,164 179,598 192,451 211,349 236,837 261,769 253,841 253,86633,068 34,089 33,177 34,394 37,122 38,189 32,539 29,796_______ _______ _______ _______ _______ _______ _______ _______
204,232 213,687 225,628 245,743 273,959 299,958 286,380 283,662
115 171 295 484 906 787 699 423231 340 530 704 1,128 1,041 856 796
1,745 61 18 5 2 e e e58,327 80,547 91,360 116,513 133,290 161,643 118,352 107,196
f f f f f 34 212 19111,004 16,011 22,676 28,568 30,201 31,523 31,538 29,88212,200 15,706 20,192 30,642 45,037 58,215 62,591 78,955
1,877 1,747 1,830 1,892 1,514 1,613 1,387 1,41736,187 47,206 54,595 69,194 79,518 95,967 79,725 69,289_______ _______ _______ _______ _______ _______ _______ _______
121,340 161,278 190,671 246,814 289,562 348,995 293,805 286,930
4,359 5,193 6,035 7,194 8,360 8,584 7,998 8,59823,885 26,941 30,064 30,572 34,525 32,998 32,537 33,463
1,083 1,355 1,684 2,222 2,969 3,307 2,698 2,4475,946 6,372 6,762 8,333 9,800 10,121 10,444 10,6041,226 1,291 1,395 2,003 2,492 3,195 3,176 3,164
29,909 29,758 30,232 32,948 36,520 36,886 33,444 32,09621,494 12,056 11,627 12,694 13,928 13,799 18,187 12,329__________ __________ __________ __________ __________ __________ __________ __________
6,237,870 5,942,061 5,814,153 6,192,478 7,141,636 7,588,778 5,769,437 4,881,632
14 IMMIGRATION POLICY IN THE UNITED STATES
According to USCIS, about one-third had violated the time limits of their temporary visas, thus rendering those visas invalid.16 However, some studies indicate that USCIS has underestimated the proportion of illegal aliens that violated the time limits of their temporary vi-sas, or overstay. For example, a Government Accountabil-ity Office report found that the USCIS estimate of “over-stayers” did not include Canadian citizens, certain Mexican citizens who enter the United States with a border-crossing card, and other short-term overstayers.17
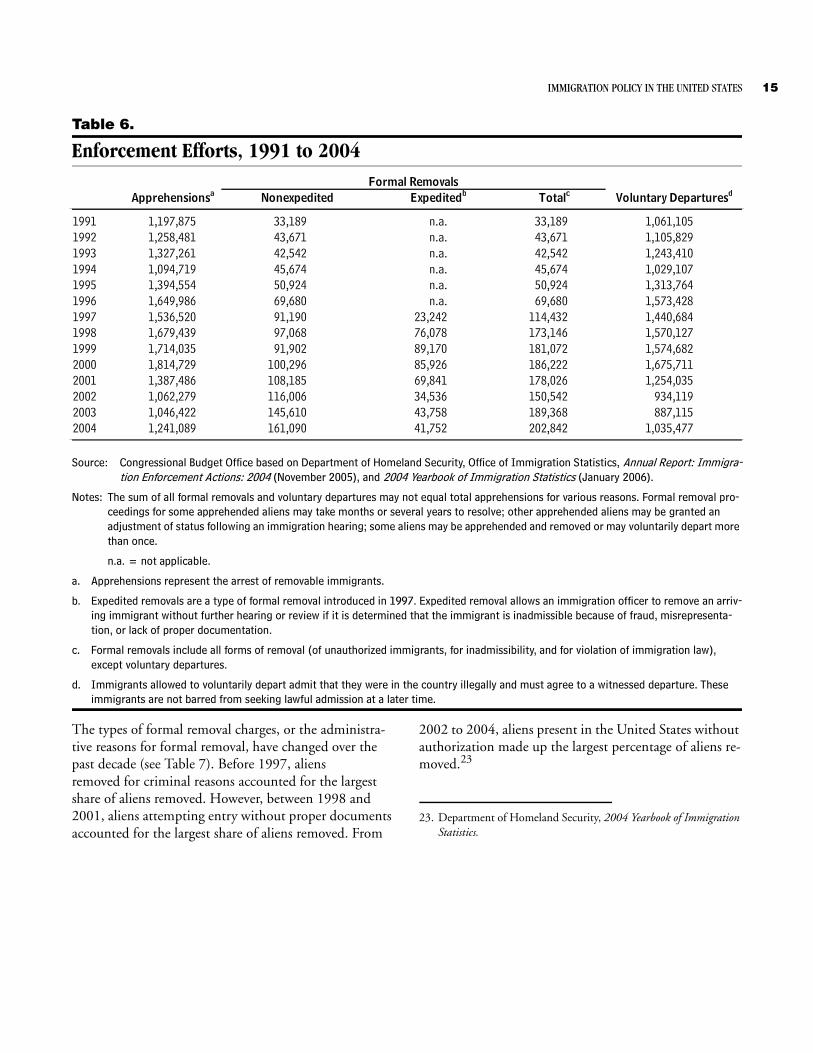
Enforcement Procedures Apprehensions are the arrest of aliens found to be in vio-lation of immigration law. In 2000, apprehensions were at a high of 1.8 million; however, by 2002, apprehensions had dropped to 1.0 million (see Table 6). According to USCIS, apprehensions made along the southwest border between the United States and Mexico accounted for over 98 percent of all apprehensions made by the Border Pa-trol. Apprehensions along the U.S. border with Mexico, as compared with other Border Patrol sectors, accounted for the greatest decline in total apprehensions for the years 2001 through 2003; it is uncertain what factors may have contributed to that decline.18 In 2004, approx-imately 1.2 million aliens were apprehended; the Border Patrol made 93 percent of those apprehensions.19
Aliens apprehended and found in violation of U.S. immi-gration laws may be removed from the country through formal removal or a voluntary departure. Formal removal proceedings are conducted before an immigration judge and may result in the removal of the alien or an adjust-
16. Department of Homeland Security, Office of Immigration Statis-tics, 2002 Yearbook of Immigration Statistics (October 2003).
17. Government Accountability Office, Overstay Trackings: A Key Component of Homeland Security and a Layered Defense, GAO-04-82 (May 2004).
18. Department of Homeland Security, Office of Immigration Statis-tics, 2003 Yearbook of Immigration Statistics (September 2004), pp. 146 and 155.
19. Department of Homeland Security, 2004 Yearbook of Immigration Statistics. According to the 2003 Yearbook of Immigration Statistics (p. 146), immigration inspectors technically do not apprehend aliens, which is the responsibility of the Border Patrol. The remaining apprehensions were administrative apprehensions made by Immigration and Customs Enforcement.
ment of immigration status. Penalties associated with for-mal removal may include fines, imprisonment, and pro-hibition of future legal entry. Under some circumstances, including a history of legal residence in the country or the presence of dependent family in the United States, the court may allow the alien to remain in the United States.
An expedited removal process was introduced in 1997, applicable to aliens attempting to enter the country ille-gally. In an expedited removal, the arriving alien may be removed without further hearing or review if it is deter-mined that the alien is inadmissible because of fraud, misrepresentation, or lack of proper documentation.
Noncriminal, unauthorized aliens attempting entry may be offered voluntary departure in lieu of formal removal. Aliens who are allowed to depart voluntarily must admit that they were in the country illegally and agree to a wit-nessed departure, but they are not barred from seeking le-gal admission at a later time.
Over the past two decades, the number of formal remov-als of aliens has generally increased. From 1981 to 1990, formal removals averaged 23,300; from 1991 to 2000, they averaged 94,000.20 However, formal removals de-creased for 2001 and 2002.21 USCIS suggests that in-creased border security after September 11, 2001, may have deterred some immigrants from entering the coun-try illegally, which resulted in fewer removals. However, some researchers have suggested that more illegal immi-grants are staying longer in the United States, thus result-ing in fewer attempted illegal entries and fewer remov-als.22 In 2004, there were about 203,000 formal removals; 42,000 unauthorized immigrants were subject to expedited removals; and 1 million unauthorized immi-grants departed voluntarily (see Table 6).
20. Department of Homeland Security, 2003 Yearbook of Immigration Statistics, p. 158.
21. Department of Homeland Security, 2002 Yearbook of Immigration Statistics, p. 176; and Department of Justice, Immigration and Naturalization Service, 2001 Statistical Yearbook of the Immigra-tion and Naturalization Service (February 2003), p. 235.
22. Belinda I. Reyes, Hans P. Johnson, and Richard Van Swearingen, Holding the Line? The Effect of Recent Border Build-Up on Unautho-rized Immigration (San Francisco: Public Policy Institute of Cali-fornia, July 2002).
IMMIGRATION POLICY IN THE UNITED STATES 15
Table 6.
Enforcement Efforts, 1991 to 2004
Source: Congressional Budget Office based on Department of Homeland Security, Office of Immigration Statistics, Annual Report: Immigra-tion Enforcement Actions: 2004 (November 2005), and 2004 Yearbook of Immigration Statistics (January 2006).
Notes: The sum of all formal removals and voluntary departures may not equal total apprehensions for various reasons. Formal removal pro-ceedings for some apprehended aliens may take months or several years to resolve; other apprehended aliens may be granted an adjustment of status following an immigration hearing; some aliens may be apprehended and removed or may voluntarily depart more than once.
n.a. = not applicable.
a. Apprehensions represent the arrest of removable immigrants.
b. Expedited removals are a type of formal removal introduced in 1997. Expedited removal allows an immigration officer to remove an arriv-ing immigrant without further hearing or review if it is determined that the immigrant is inadmissible because of fraud, misrepresenta-tion, or lack of proper documentation.
c. Formal removals include all forms of removal (of unauthorized immigrants, for inadmissibility, and for violation of immigration law), except voluntary departures.
d. Immigrants allowed to voluntarily depart admit that they were in the country illegally and must agree to a witnessed departure. These immigrants are not barred from seeking lawful admission at a later time.
1991 1,197,875 33,189 n.a. 33,189 1,061,1051992 1,258,481 43,671 n.a. 43,671 1,105,8291993 1,327,261 42,542 n.a. 42,542 1,243,4101994 1,094,719 45,674 n.a. 45,674 1,029,1071995 1,394,554 50,924 n.a. 50,924 1,313,7641996 1,649,986 69,680 n.a. 69,680 1,573,4281997 1,536,520 91,190 23,242 114,432 1,440,6841998 1,679,439 97,068 76,078 173,146 1,570,1271999 1,714,035 91,902 89,170 181,072 1,574,6822000 1,814,729 100,296 85,926 186,222 1,675,7112001 1,387,486 108,185 69,841 178,026 1,254,0352002 1,062,279 116,006 34,536 150,542 934,1192003 1,046,422 145,610 43,758 189,368 887,1152004 1,241,089 161,090 41,752 202,842 1,035,477
Expeditedb TotalcFormal Removals
Voluntary DeparturesdApprehensionsa Nonexpedited
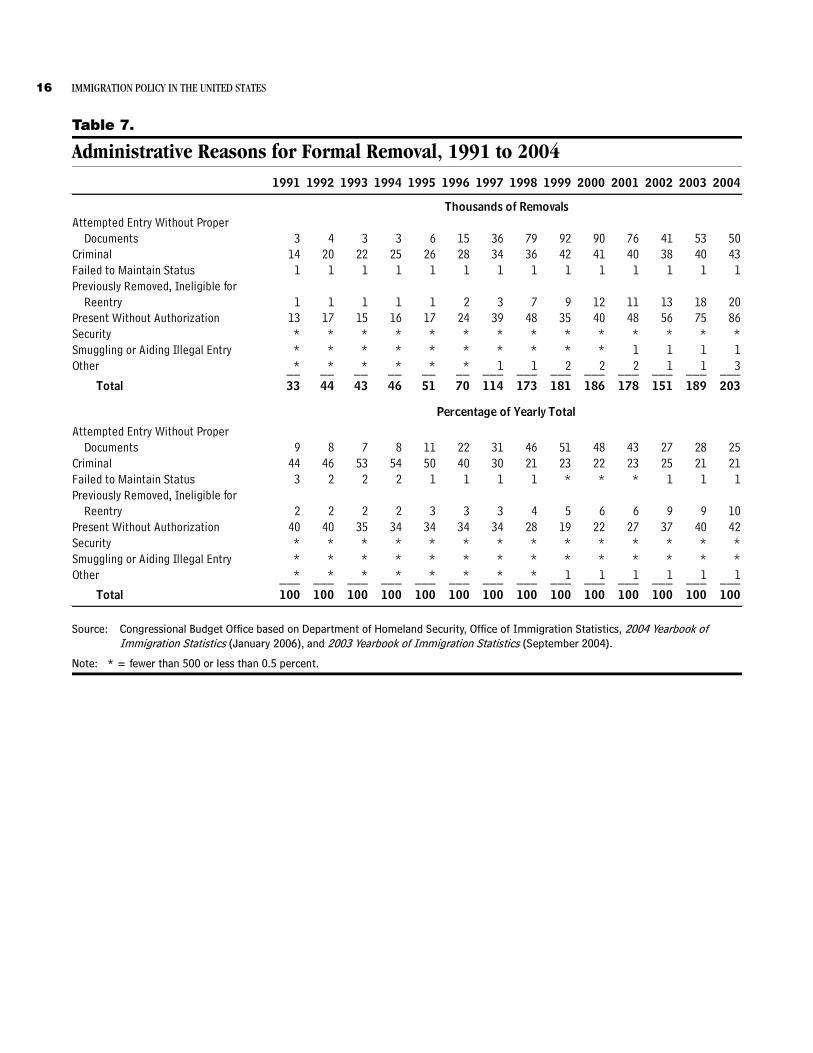
The types of formal removal charges, or the administra-tive reasons for formal removal, have changed over the past decade (see Table 7). Before 1997, aliensremoved for criminal reasons accounted for the largest share of aliens removed. However, between 1998 and 2001, aliens attempting entry without proper documents accounted for the largest share of aliens removed. From
2002 to 2004, aliens present in the United States without authorization made up the largest percentage of aliens re-moved.23
23. Department of Homeland Security, 2004 Yearbook of Immigration Statistics.
16 IMMIGRATION POLICY IN THE UNITED STATES
Table 7.
Administrative Reasons for Formal Removal, 1991 to 2004
Source: Congressional Budget Office based on Department of Homeland Security, Office of Immigration Statistics, 2004 Yearbook of Immigration Statistics (January 2006), and 2003 Yearbook of Immigration Statistics (September 2004).
Note: * = fewer than 500 or less than 0.5 percent.
1991 1992 1993 1994 1995 1996 1997 1998 1999 2000 2001 2002 2003 2004
Attempted Entry Without Proper Documents 3 4 3 3 6 15 36 79 92 90 76 41 53 50
Criminal 14 20 22 25 26 28 34 36 42 41 40 38 40 43Failed to Maintain Status 1 1 1 1 1 1 1 1 1 1 1 1 1 1Previously Removed, Ineligible for
Reentry 1 1 1 1 1 2 3 7 9 12 11 13 18 20Present Without Authorization 13 17 15 16 17 24 39 48 35 40 48 56 75 86Security * * * * * * * * * * * * * *Smuggling or Aiding Illegal Entry * * * * * * * * * * 1 1 1 1Other * * * * * * 1 1 2 2 2 1 1 3__ __ __ __ __ __ ___ ___ ___ ___ ___ ___ ___ ___
Total 33 44 43 46 51 70 114 173 181 186 178 151 189 203
Attempted Entry Without Proper Documents 9 8 7 8 11 22 31 46 51 48 43 27 28 25
Criminal 44 46 53 54 50 40 30 21 23 22 23 25 21 21Failed to Maintain Status 3 2 2 2 1 1 1 1 * * * 1 1 1Previously Removed, Ineligible for
Reentry 2 2 2 2 3 3 3 4 5 6 6 9 9 10Present Without Authorization 40 40 35 34 34 34 34 28 19 22 27 37 40 42Security * * * * * * * * * * * * * *Smuggling or Aiding Illegal Entry * * * * * * * * * * * * * *Other * * * * * * * * 1 1 1 1 1 1___ ___ ___ ___ ___ ___ ___ ___ ___ ___ ___ ___ ___ ___
Total 100 100 100 100 100 100 100 100 100 100 100 100 100 100
Percentage of Yearly Total
Thousands of Removals
Appendix: Becoming a U.S. Citizen
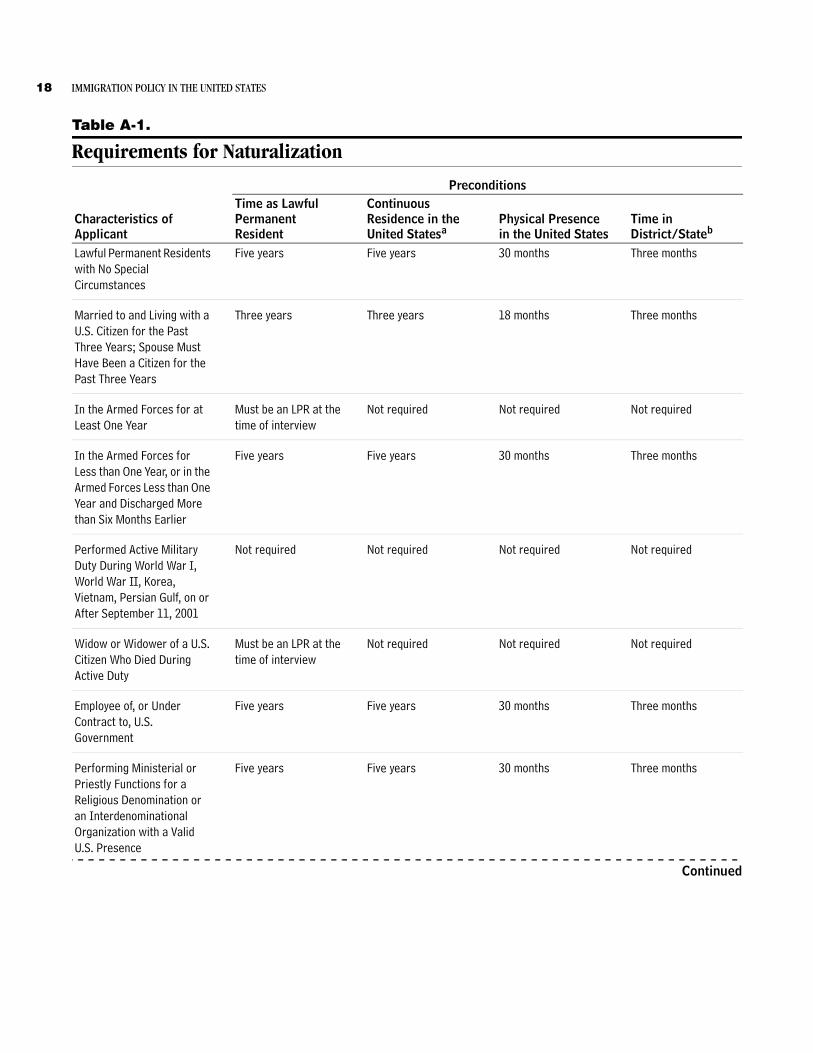
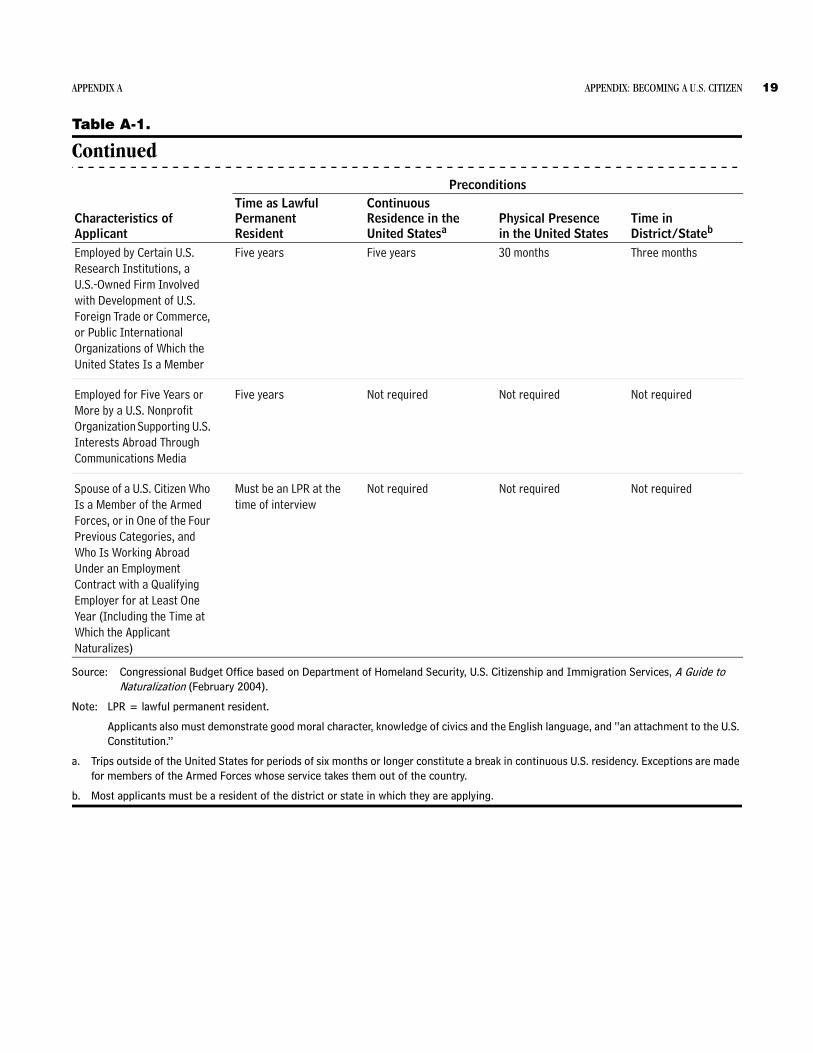
Naturalization is the process by which an immigrant can attain U.S. citizenship. In general, any lawful permanent resident who has maintained a period of continuous resi-dence and presence in the United States can apply for naturalization. Applicants for naturalization must have good moral character, knowledge of U.S. history and gov-ernment and the English language, and a willingness to support and defend the United States and its Constitu-tion. Most immigrants may apply for naturalization after three to five years of permanent residency. For certain groups of immigrants, including those who have served in the U.S. military, the requirements for permanent resi-dency may be shortened or waived. The requirements for U.S. residency and local residency also vary according to the circumstances of the immigrant. (Table A-1 details
the requirements for naturalization for various categories of immigrants.)
In 2004, U.S. citizenship was conferred upon 537,000 individuals through naturalization. That represents an in-crease in the annual number of naturalizations, which had declined since 2000 when 889,000 persons were nat-uralized. According to the Department of Homeland Se-curity, yearly naturalization levels reflect levels of legal im-migration; typically, the number of yearly naturalizations lags behind legal immigration levels by six to seven years. However, because of processing backlogs, naturalization numbers may not accurately reflect demand for citizen-ship among lawful permanent residents.
18 IMMIGRATION POLICY IN THE UNITED STATES
Table A-1.
Requirements for Naturalization
Continued
Characteristics ofApplicant
PreconditionsTime as LawfulPermanentResident
ContinuousResidence in the United Statesa
Physical Presence in the United States
Time inDistrict/Stateb
Lawful Permanent Residents with No Special Circumstances
Five years Five years 30 months Three months
Married to and Living with a U.S. Citizen for the Past Three Years; Spouse Must Have Been a Citizen for the Past Three Years
Three years Three years 18 months Three months
In the Armed Forces for at Least One Year
Must be an LPR at the time of interview
Not required Not required Not required
In the Armed Forces for Less than One Year, or in the Armed Forces Less than One Year and Discharged More than Six Months Earlier
Five years Five years 30 months Three months
Performed Active Military Duty During World War I, World War II, Korea, Vietnam, Persian Gulf, on or After September 11, 2001
Not required Not required Not required Not required
Widow or Widower of a U.S. Citizen Who Died During Active Duty
Must be an LPR at the time of interview
Not required Not required Not required
Employee of, or Under Contract to, U.S. Government
Five years Five years 30 months Three months
Performing Ministerial or Priestly Functions for a Religious Denomination or an Interdenominational Organization with a Valid U.S. Presence
Five years Five years 30 months Three months
APPENDIX A APPENDIX: BECOMING A U.S. CITIZEN 19
Table A-1.
Continued
Source: Congressional Budget Office based on Department of Homeland Security, U.S. Citizenship and Immigration Services, A Guide to Naturalization (February 2004).
Note: LPR = lawful permanent resident.
Applicants also must demonstrate good moral character, knowledge of civics and the English language, and “an attachment to the U.S. Constitution.”
a. Trips outside of the United States for periods of six months or longer constitute a break in continuous U.S. residency. Exceptions are made for members of the Armed Forces whose service takes them out of the country.
b. Most applicants must be a resident of the district or state in which they are applying.
Characteristics ofApplicant
PreconditionsTime as LawfulPermanentResident
ContinuousResidence in the United Statesa
Physical Presence in the United States
Time inDistrict/Stateb
Employed by Certain U.S. Research Institutions, a U.S.-Owned Firm Involved with Development of U.S. Foreign Trade or Commerce, or Public International Organizations of Which the United States Is a Member
Five years Five years 30 months Three months
Employed for Five Years or More by a U.S. Nonprofit Organization Supporting U.S. Interests Abroad Through Communications Media
Five years Not required Not required Not required
Spouse of a U.S. Citizen Who Is a Member of the Armed Forces, or in One of the Four Previous Categories, and Who Is Working Abroad Under an Employment Contract with a Qualifying Employer for at Least One Year (Including the Time at Which the Applicant Naturalizes)
Must be an LPR at the time of interview
Not required Not required Not required


INSIDE MAIL
CONGRESS OF THE UNITED STATESCONGRESSIONAL BUDGET OFFICEWASHINGTON, DC 20515