Embed Size (px)
Citation preview
UNIVERSITY OF NIGERIA, NSUKKA
IMPACT EVALUATION OF COCOA RESUSCITATION PROGRAMMES ON COCOA FARMERS
IN SOUTH WEST NIGERIA
Akinnagbe Oluwole MatthewDepartment of Agricultural Extension, Faculty of Agriculture,
University of Nigeria, Nsukka, Nigeria.E-mails: [email protected] and [email protected]
Presentation at the 2013 AGRODEP Annual Members’ Workshop in Dakar, Senegal
November, 2013
INTRODUCTION
Cocoa is an important crop to the economies of
some countries such as Nigeria, Cote D’Ivoire,
Ghana and Cameroon in West Africa.
Production of cash crop suffered a reduction
and unstable production in recent years in
Nigeria owing to a number of factors.
In 1999, the FGN established Cocoa
Resuscitation Programme (CRP).
UNIVERSITY OF NIGERIA, NSUKKA
Introduction cont’d . . .
Cocoa resuscitation programmes include:
Coppicing or chupon regeneration
Phase replanting
Selective tree replanting or gapping up
Complete farm replacement
Planting of young cocoa seedlings under old trees
Chupon regeneration.
UNIVERSITY OF NIGERIA, NSUKKA
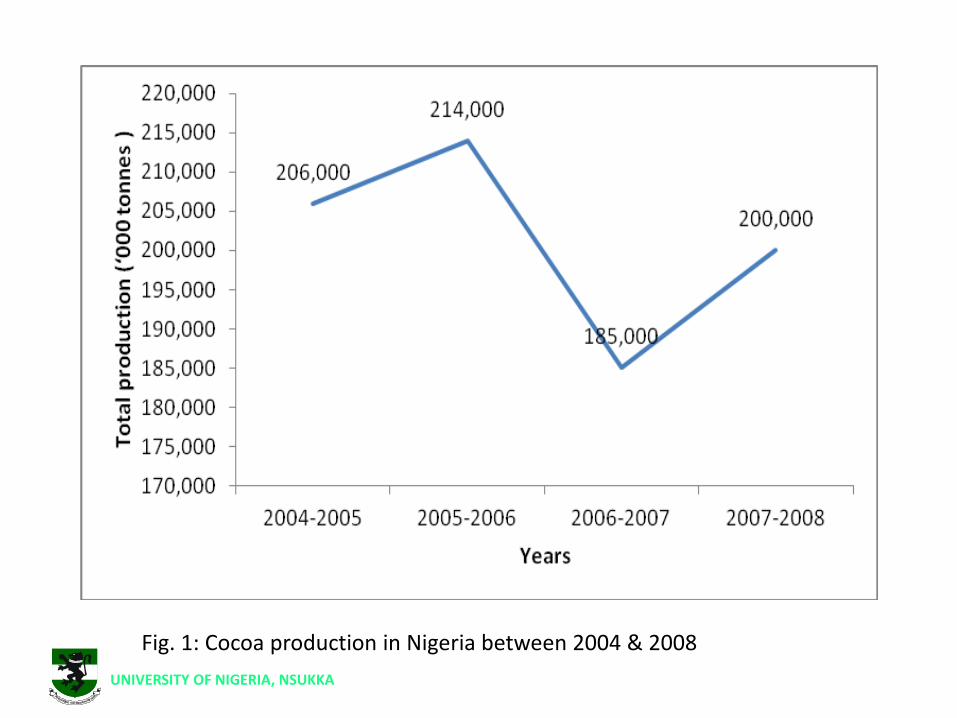
Fig. 1: Cocoa production in Nigeria between 2004 & 2008
UNIVERSITY OF NIGERIA, NSUKKA
To assess the impact of cocoa
resuscitation programmes on
cocoa farmers in south west
Nigeria
UNIVERSITY OF NIGERIA, NSUKKA
Purpose of the study
METHODOLOGY
The study was carried out in South west Nigeria.
Presently, 5 out of the 6 states in south west Nigeria
produce cocoa
All cocoa farmers in South west Nigeria constituted
the population for this study.
The study covered the cocoa resuscitation
programmes of both government and non-
governmental agencies.
UNIVERSITY OF NIGERIA, NSUKKA
Methodology cont’d …
Data for the study were collected from
cocoa farmers through the use of
interview schedule and FGD.
Multistage sampling technique was used
in selecting respondents.
Methodology cont’d
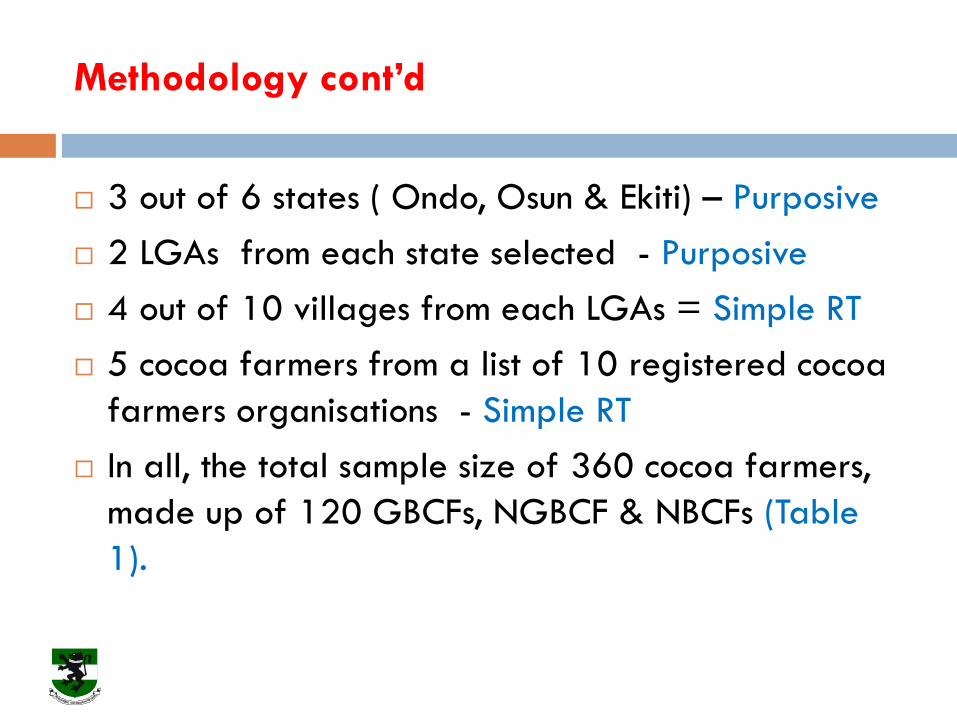
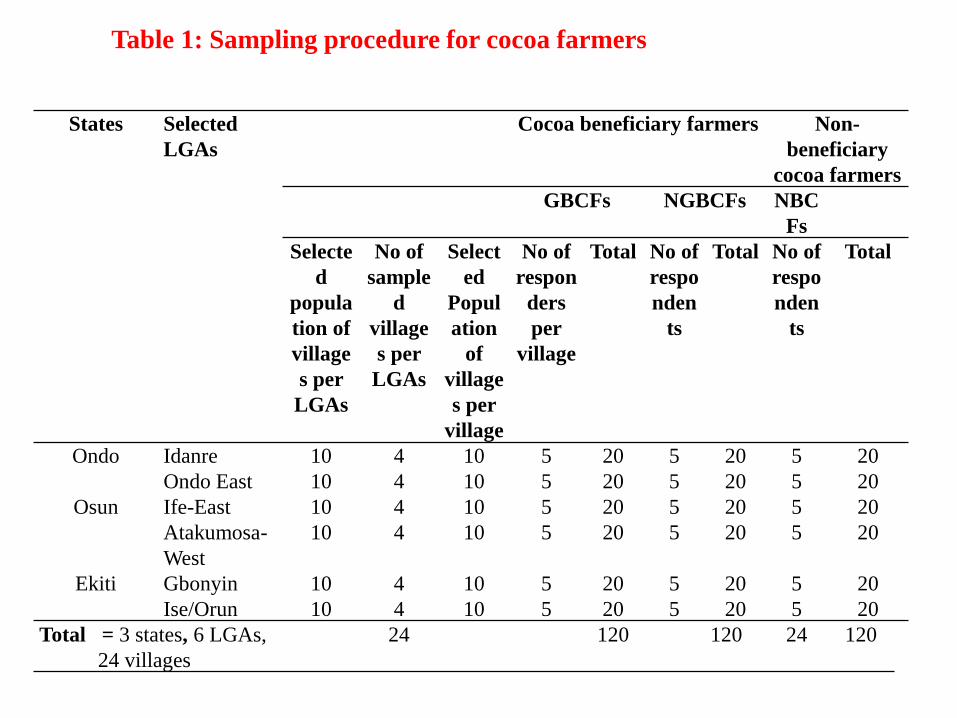
3 out of 6 states ( Ondo, Osun & Ekiti) – Purposive
2 LGAs from each state selected - Purposive
4 out of 10 villages from each LGAs = Simple RT
5 cocoa farmers from a list of 10 registered cocoa
farmers organisations - Simple RT
In all, the total sample size of 360 cocoa farmers,
made up of 120 GBCFs, NGBCF & NBCFs (Table
1).
States Selected
LGAs
Cocoa beneficiary farmers Non-
beneficiary
cocoa farmers
GBCFs NGBCFs NBC
Fs
Selecte
d
popula
tion of
village
s per
LGAs
No of
sample
d
village
s per
LGAs
Select
ed
Popul
ation
of
village
s per
village
No of
respon
ders
per
village
Total No of
respo
nden
ts
Total No of
respo
nden
ts
Total
Ondo Idanre 10 4 10 5 20 5 20 5 20
Ondo East 10 4 10 5 20 5 20 5 20
Osun Ife-East 10 4 10 5 20 5 20 5 20
Atakumosa-
West
10 4 10 5 20 5 20 5 20
Ekiti Gbonyin 10 4 10 5 20 5 20 5 20
Ise/Orun 10 4 10 5 20 5 20 5 20
Total = 3 states, 6 LGAs,
24 villages
24 120 120 24 120
Table 1: Sampling procedure for cocoa farmers
Methodology cont’d …
Data for the study were collected from
the farmers through the use of structured
interview schedule and focus group
discussion (FGD).
Respondents classified into 4 groups later
during data analysis
Methodology – models used
Before and After evaluationmodel
Participants and non-participantmodel
Casley and Lusy (1982) and Ladele (1991)maintained that any memory-recall data,collected as satisfactory as possible, arevalid for use in social research.
Methodology cont’d …
Content and face validity were carried out to
ensure that the instruments collect the data they
were meant to collect.
The instruments were pre-tested
Data were analyzed using percentage, charts,
mean statistic, t-test, chi-square, analysis of
variance (ANOVA) and Duncan’s multiple
range test.
UNIVERSITY OF NIGERIA, NSUKKA
Socio-economic characteristics
Impact of CRPs on farm size, yields and
income
Impact of CRPs on farm inputs possessed
RESULTS
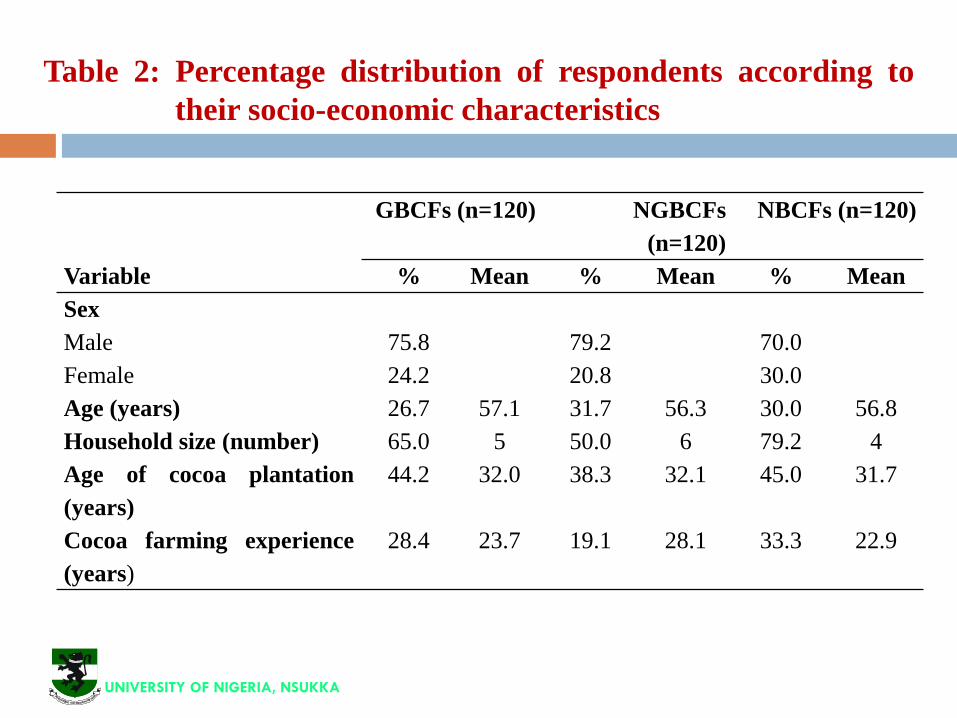
Table 2: Percentage distribution of respondents according to
their socio-economic characteristics
UNIVERSITY OF NIGERIA, NSUKKA
GBCFs (n=120) NGBCFs
(n=120)
NBCFs (n=120)
Variable % Mean % Mean % Mean
Sex
Male 75.8 79.2 70.0
Female 24.2 20.8 30.0
Age (years) 26.7 57.1 31.7 56.3 30.0 56.8
Household size (number) 65.0 5 50.0 6 79.2 4
Age of cocoa plantation
(years)
44.2 32.0 38.3 32.1 45.0 31.7
Cocoa farming experience
(years)
28.4 23.7 19.1 28.1 33.3 22.9
Variable
CRPs beneficiary farmers CRPs non-beneficiary
farmers
GBCFs (n=100) NGBCFs (n=92) GNGBCFs (n=48) NBCFs (n=120)
1999 2009 T-value 1999 2009 T-value 1999 2009 T-value 1999 2009 T-
value
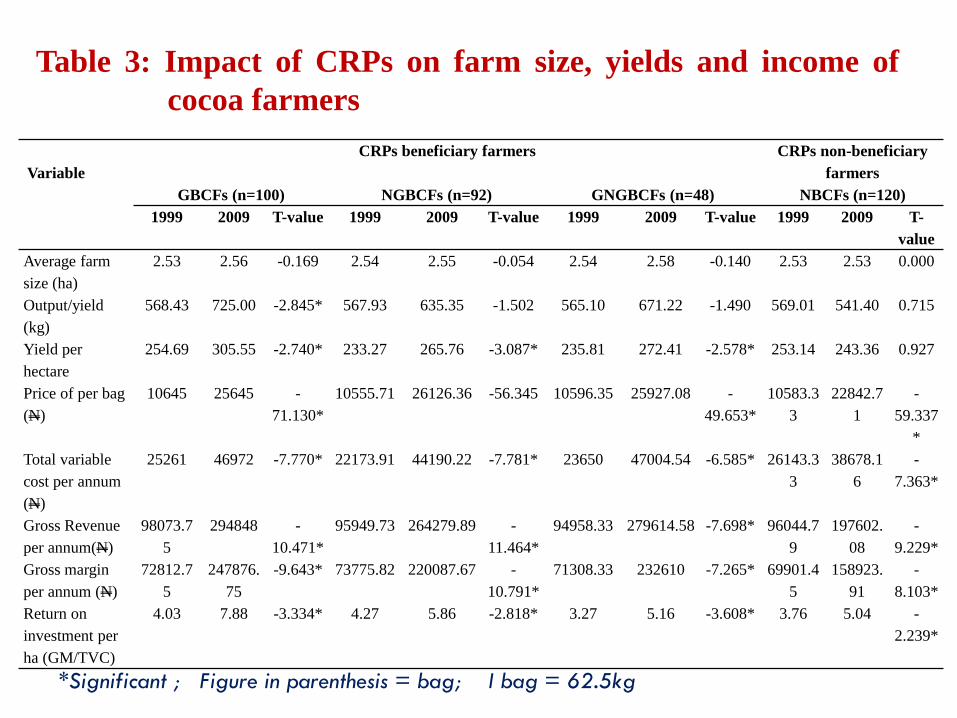
Average farm
size (ha)
2.53 2.56 -0.169 2.54 2.55 -0.054 2.54 2.58 -0.140 2.53 2.53 0.000
Output/yield
(kg)
568.43 725.00 -2.845* 567.93 635.35 -1.502 565.10 671.22 -1.490 569.01 541.40 0.715
Yield per
hectare
254.69 305.55 -2.740* 233.27 265.76 -3.087* 235.81 272.41 -2.578* 253.14 243.36 0.927
Price of per bag
(N)
10645 25645 -
71.130*
10555.71 26126.36 -56.345 10596.35 25927.08 -
49.653*
10583.3
3
22842.7
1
-
59.337
*
Total variable
cost per annum
(N)
25261 46972 -7.770* 22173.91 44190.22 -7.781* 23650 47004.54 -6.585* 26143.3
3
38678.1
6
-
7.363*
Gross Revenue
per annum(N)
98073.7
5
294848 -
10.471*
95949.73 264279.89 -
11.464*
94958.33 279614.58 -7.698* 96044.7
9
197602.
08
-
9.229*
Gross margin
per annum (N)
72812.7
5
247876.
75
-9.643* 73775.82 220087.67 -
10.791*
71308.33 232610 -7.265* 69901.4
5
158923.
91
-
8.103*
Return on
investment per
ha (GM/TVC)
4.03 7.88 -3.334* 4.27 5.86 -2.818* 3.27 5.16 -3.608* 3.76 5.04 -
2.239*
Table 3: Impact of CRPs on farm size, yields and income of
cocoa farmers
*Significant ; Figure in parenthesis = bag; I bag = 62.5kg
Socio-economic
variables
CRPs Beneficiary farmers Non-
beneficiary
farmers
F-value
GBCFs NGBCFs GNGBCFs NBCFs
Farm size, yield and income
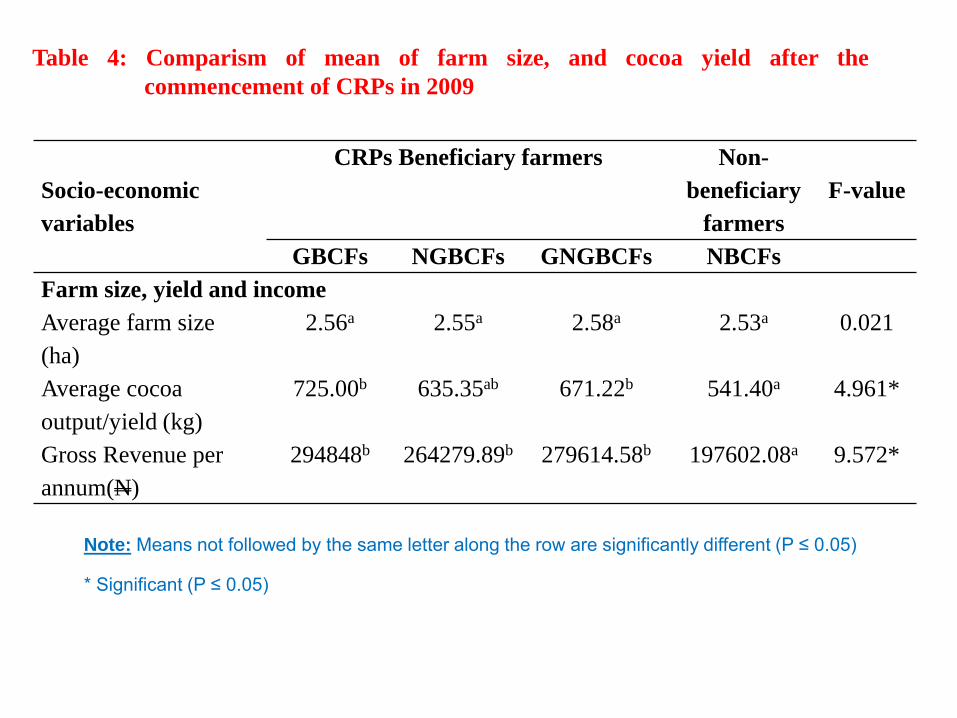
Average farm size
(ha)
2.56a 2.55a 2.58a 2.53a 0.021
Average cocoa
output/yield (kg)
725.00b 635.35ab 671.22b 541.40a 4.961*
Gross Revenue per
annum(N)
294848b 264279.89b 279614.58b 197602.08a 9.572*
Table 4: Comparism of mean of farm size, and cocoa yield after the
commencement of CRPs in 2009
Note: Means not followed by the same letter along the row are significantly different (P ≤ 0.05)
* Significant (P ≤ 0.05)
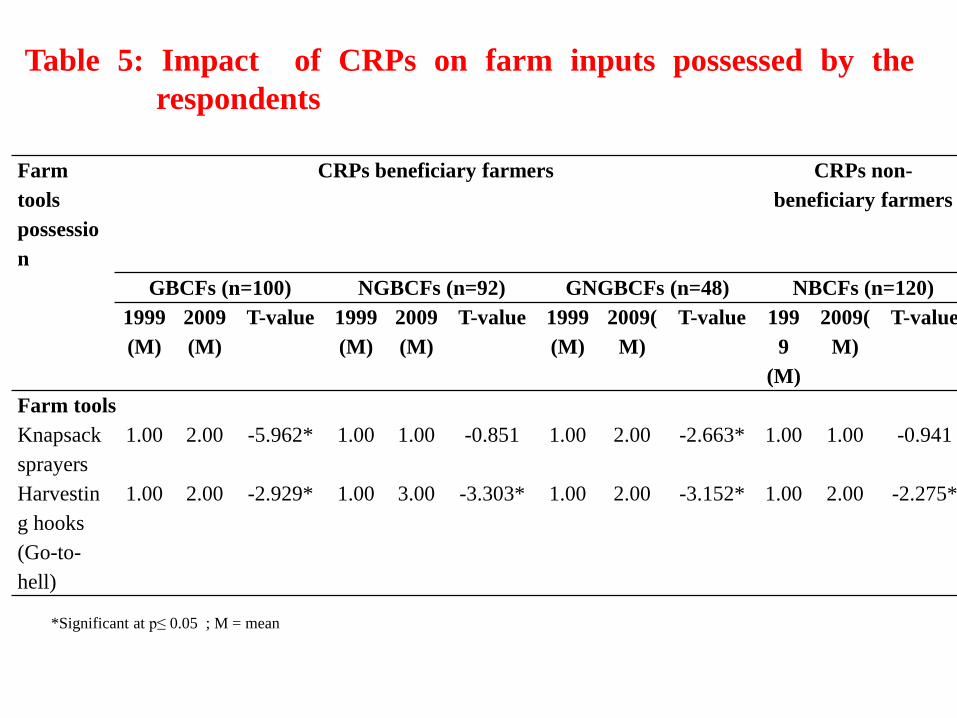
Farm
tools
possessio
n
CRPs beneficiary farmers CRPs non-
beneficiary farmers
GBCFs (n=100) NGBCFs (n=92) GNGBCFs (n=48) NBCFs (n=120)
1999
(M)
2009
(M)
T-value 1999
(M)
2009
(M)
T-value 1999
(M)
2009(
M)
T-value 199
9
(M)
2009(
M)
T-value
Farm tools
Knapsack
sprayers
1.00 2.00 -5.962* 1.00 1.00 -0.851 1.00 2.00 -2.663* 1.00 1.00 -0.941
Harvestin
g hooks
(Go-to-
hell)
1.00 2.00 -2.929* 1.00 3.00 -3.303* 1.00 2.00 -3.152* 1.00 2.00 -2.275*
Table 5: Impact of CRPs on farm inputs possessed by the
respondents
*Significant at p≤ 0.05 ; M = mean
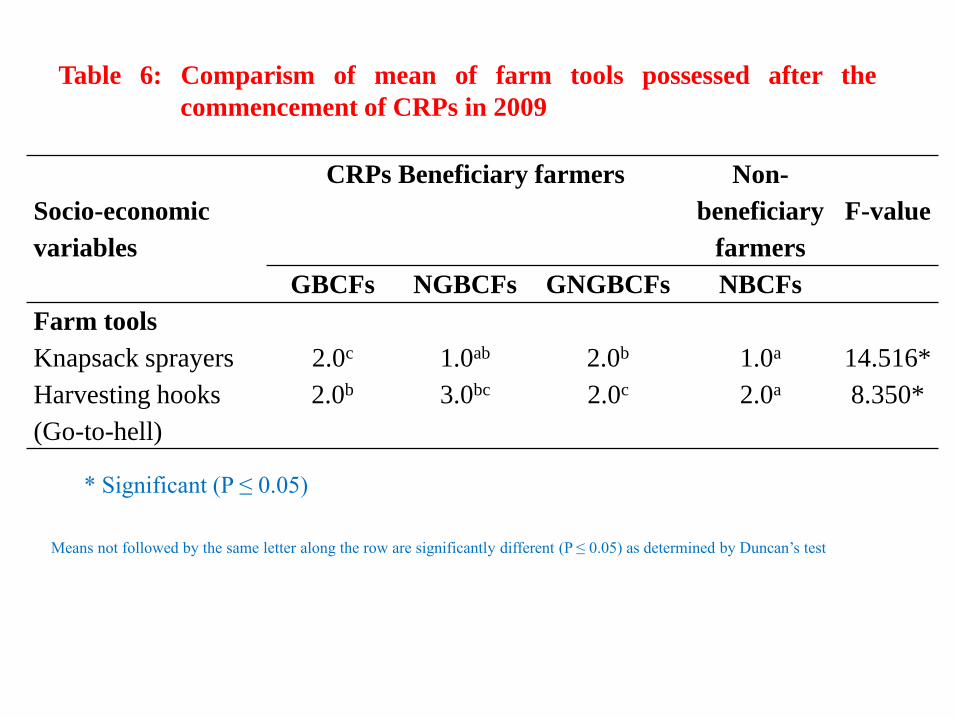
Socio-economic
variables
CRPs Beneficiary farmers Non-
beneficiary
farmers
F-value
GBCFs NGBCFs GNGBCFs NBCFs
Farm tools
Knapsack sprayers 2.0c 1.0ab 2.0b 1.0a 14.516*
Harvesting hooks
(Go-to-hell)
2.0b 3.0bc 2.0c 2.0a 8.350*
Table 6: Comparism of mean of farm tools possessed after the
commencement of CRPs in 2009
* Significant (P ≤ 0.05)
Means not followed by the same letter along the row are significantly different (P ≤ 0.05) as determined by Duncan’s test
CONCLUSION AND RECOMMENDATIONS
The CRPs of government and non-governmentalagencies had made an appreciable impact inimproving the average yield of cocoa beansproduced.
The programmes also led to increased in grossrevenue, gross margin accruable to the farmers andnumber of farm tools purchased.
The study recommends that to improve on theachievement recorded so far, the activities of bothorganizations in CRPs should be review regularly.
UNIVERSITY OF NIGERIA, NSUKKA
Appreciation
I wish to thank AGRODEP management team for
funding the paper to be presented at InternationalConference on “Extension EducationalStrategies for Sustainable AgriculturalDevelopment – A Global Perspective”scheduled to be held on December 5th – 8th,2013 at University of Agricultural Sciences,Bangalore, India.
UNIVERSITY OF NIGERIA, NSUKKA
Thanks for listening
UNIVERSITY OF NIGERIA, NSUKKA
![UNIVERSITY OF NIGERIA, NSUKKA 1 · IGBO/HAUSA], University of Nigeria Nsukka [BA/ED IGBO/LINGUISTICS], University ... Dr E.E. Mbah UNIVERSITY OF NIGERIA NSUKKA [B.A(ED)], UNIVERSITY](https://img.pdfslide.net/doc/110x75/5b8215817f8b9a2b678dcc3a/university-of-nigeria-nsukka-1-igbohausa-university-of-nigeria-nsukka-baed.jpg)