Embed Size (px)
Citation preview
Contents lists available at SciVerse ScienceDirect
Can J Diabetes 36 (2012) 193e198
Canadian Journal of Diabetesjournal homepage:
www.canadianjournalofdiabetes.com
Original Research
Impact of Socio-economic Status on Utilization of Diabetes Educators and DiabetesControl: A Canadian Experience
Atul Sharma MD, MSc, FRCP(C) a, Katie Palmer MSc, PhD b, Celia Rodd MD, MSc, FRCP(C) c,*aDepartment of Pediatrics, McGill University, Montreal, Quebec, CanadabDepartment of Clinical and Behavioral Neurology, Fondazione Santa Lucia, Istituto di Ricovero e Cura a Carettere Scientifico (IRCCS), Rome, ItalycDivision of Pediatric Endocrinology, Department of Pediatrics, McGill University, Montreal, Quebec, Canada
a r t i c l e i n f o
Article history:Received 8 April 2012Received in revised form4 June 2012Accepted 20 June 2012
Keywords:A1CDKAhospitalizationSEStype 1 diabetes mellitus
Mots clés:HbA1cACDhospitalisationSSÉdiabète sucré de type 1
* Address for correspondence: Celia Rodd, 2300Children’s Hospital, Montreal, Quebec H3H 1P3.
E-mail address: [email protected] (C. Rodd).
1499-2671/$ e see front matter � 2012 Canadian Diahttp://dx.doi.org/10.1016/j.jcjd.2012.06.005
a b s t r a c t
Objective: To determine if there is an association between lower socio-economic status (SES) anddecreased utilization of diabetes educators or inferior diabetes control as measured by both glycatedhemoglobin (A1C) and number of diabetes-related hospitalizations.Patients and Methods: Our cohort consisted of all children aged <18 years in a clinic database in Montreal,Canada who were diagnosed with type 1 diabetes mellitus for at least 12 months (n¼353). Subjectsneeded 12 months of follow up in the calendar year 2008 with at least 2 A1C measurements. Diabeteseducators logged all interactions with patients with diabetes in the database, including A1C and hospitaladmissions. SES was measured using validated area-based deprivation indices. Multivariable regressionmodelling was used to adjust for potential confounders, such as gender, age, diabetes duration, bodymass index and treatment modality.Results: There were 2500 contacts made by 353 children (mean age 12.3 years, mean diabetes duration5.4 years, mean A1C 8.8%). Even though the number of educator contacts was a significant negativepredictor of A1C (coefficient, �0.010, 95% confidence interval [CI] �0.199 to �0.001), there was noassociation between the number of contacts and SES even after adjustment for multiple potentialconfounders (material centile deprivation coefficient 0.003, 95% CI �0.001 to 0.008; social deprivationcentile coefficient �0.001, 95% CI �0.0006 to 0.004). Nor was there an association between SES anddiabetes control even after adjustment.Conclusions: Lower SES was not associated with reduced utilization of educator services, implying thatoutpatient resources are used equitably when available. Moreover those of lower SES did not experienceinferior control or more frequent hospitalizations.
� 2012 Canadian Diabetes Association
r é s u m é
Objectifs : Déterminer si un lien existe entre un statut socio-économique (SSÉ) plus faible, et un moindrerecours aux éducateurs spécialisés en diabète ou une maîtrise inférieure du diabète selon l’hémoglobineglyquée (HbA1c) et le nombre d’hospitalisations liées au diabète.Patients et méthodes : Notre cohorte comportait tous les enfants < 18 ans inscrits dans une base dedonnées clinique de Montréal, au Canada, qui avaient reçu un diagnostic de diabète sucré de type1 depuis au moins 12 mois (n ¼ 353). Les sujets ont nécessité un suivi de 12 mois au cours de l’annéecivile 2008 incluant au moins 2 mesures de l’HbA1c. Les éducateurs spécialisés en diabète ont recensétoutes les interactions des patients ayant le diabète dans la base de données, incluant l’HbA1c et lesadmissions à l’hôpital. Le SSÉ a été mesuré en utilisant la validation des indices de défavorisation selon larégion. Le modèle de régression multiple a été utilisé pour ajuster les facteurs de confusion potentiels telsque le sexe, l’âge, la durée du diabète, l’indice de masse corporelle et la modalité de traitement.Résultats : Il y a eu 2500 contacts composés de 353 enfants (âge moyen de 12,3 ans, durée moyenne dudiabète de 5,4 ans, HbA1c moyenne de 8,8 %). Même si le nombre de contacts avec un éducateur était unprédicteur négatif significatif de l’HbA1c (coefficient, �0,010, intervalle de confiance [IC] à 95 %, �0,199 à�0,001), il n’existait aucun lien entre le nombre de contacts et le SSÉ même après l’ajustement desmultiples facteurs de confusion potentiels (centile de défavorisation matérielle, 0,003, IC à 95 % �0,001 à
Tupper St., E315, Montreal
betes Association
A. Sharma et al. / Can J Diabetes 36 (2012) 193e198194
0,008; centile de défavorisation sociale, �0,001, IC à 95 %, �0,0006 à 0,004). Il n’existait pas non plus delien entre le SSÉ et la maîtrise du diabète même après l’ajustement.Conclusions : Un plus faible SSÉ n’était pas associé à une diminution de l’utilisation des services d’unéducateur, ce qui signifie que les ressources externes sont utilisées équitablement lorsqu’elles sontdisponibles. De plus, ceux ayant un plus faible SSÉ n’expérimentaient pas une maîtrise inférieure ou deplus fréquentes hospitalisations.
� 2012 Canadian Diabetes Association
Introduction
Numerous reports outline various barriers to optimal type 1diabetes mellitus outcomes (1e6). These encompass several largethemes, including family (single parent status, lack of parentalknowledgedespecially maternaldand immigrant status), indi-vidual (age, gender) and socio-economic status (lower) (1e9).Socio-economic status (SES) has been determined by both area-and individual-based assessments and reported from manyjurisdictions, including the United States, the United Kingdom,Germany, Argentina and New Zealand (1,10e14). In general, lowerSES has been associated with higher glycated hemoglobin (A1C)(poorer control) and with more hospitalizations for diabeticketoacidosis (DKA) and hyperglycemia (1,10e14).
Recent publications cite specific factors as to why those withlower SES fare less well, including inability to purchase diabetessupplies, suboptimal initial teaching, irregular follow up andnonspecialist care (1,4,15,16). Lack of outpatient support for familieswas also felt to be a significant barrier resulting in more hospital-izations (1,4). Importantly, diabetes educators provide key outpa-tient resources; their care has been credited withw1% drop in A1Cacross all ages, and their membership in the diabetes team isendorsed by international diabetes organizations (17e20). More-over, they are a potentially modifiable resource. Nevertheless, therehave been no studies to date to assess whether families access thiscare equitably. A priori we hypothesized that families of lower SESengaged diabetes educators less frequently than families withhigher SES given the general observation of poorer diabetesoutcomes associated with lower SES. To place these findings incontext, we also examined the relations between SES and A1C/hospitalizations. Important confounders (lack of supplies andhealth insurance) were mitigated, because our province is uniquein Canada in having both universal health and prescription insur-ance. This allowed us to focus more clearly on the associationbetween SES and diabetes outpatient resource utilization usingobservational cohort data from a proprietary diabetes clinic data-base and validated, Canadian, area-based deprivation indices.
Methods
Study population
The diabetes clinic at the Montreal Children’s Hospital isrepresentative of pediatric diabetes centres across Canada, wherepediatric diabetes care is largely centred in specialized university-based tertiary care hospitals, each with a large multidisciplinarydiabetes team. The composition of the teams typically followsCanadian Diabetes Association guidelines (18). Data from the 2008calendar year was used; all contacts between January 1 andDecember 31 2008 were included.
Diabetes diagnosis and inclusion criteria
Type 1 diabetes was diagnosed according to standard definition(18). We included children age 17 years or less, who had had type 1diabetes for at least 12 months duration as of January 1, 2008
(to reduce the “honeymoon” effect). A 12-month follow up during2008 was also required, with at least 2 A1C measurements duringthat time. Assignment of each child’s insulin regimen (standard vs.multiple daily injections [MDI] vs. continuous subcutaneous insulininfusion pump [CSII]) was based on the modality used for>9 months during the 2008 calendar year, treated as a nonordinalcategorical variable. All children met this criterion. We excludedchildren with other types of diabetes, such as maturity onset dia-betes of youth or type 2 diabetes, and those whowere not residentsin Canada (i.e. no Canadian postal code).
Power calculation
A priori power calculations were used to assess the adequacy ofsample size in the design phase of the study, after calculating ourtotal number of eligible children but prior to any detailed analyses.Taking either A1C or the number of contacts with the diabeteseducator as the outcome variable, the SAS multiple linear regres-sion power calculator was used to calculate power in terms of thepartial correlation between the outcome and the 2 deprivationindices (centiles). Having assumed on clinical grounds that theminimum effect of interest is a squared partial correlation of at least10% (i.e. the 2 deprivation indices together explain at least 10% ofthe observed variance in A1C), the power was determined to be>95% with an alpha of 0.05 and using our sample of n¼353.
Database
The Montreal Children’s Hospital utilizes a customized Micro-soft Access (Seattle, WA) database to document all contacts withthe children, parents and allied caregivers (e.g., schools). Formedicolegal reasons, diabetes educators document all contactsincluding telephone calls, office visits, e-mails or faxes. Printedcopies are then added to the hospital chart. In total, there are 2educators dealing with children using CSII and 2 for children usingother modalities. Admissions, reason for admissions, and locationof admission if outside of our centre, height, weight and A1Cconcentrations are recorded at all clinic visits.
Outcomes: Contacts, A1C, and admissions
All contacts with the diabetes educators were extracted fromthe database using Structured Query Language. A1C was measuredusing point-of-care technology (DCA2000þ Siemens/Bayer, witha CV <3%) (21). The A1C arithmetic mean, number of measure-ments and standard deviation (SD) were calculated for each child.All admissions for poor control or DKA were obtained from thedatabase and verified by review of the hospital chart; all otheradmissions were not included in the study for analyses. Admissionswere grouped as a binary variable in the analyses.
Covariates
Age was calculated at study initiation on January 1, 2008;duration of diabetes was calculated from time of diagnosis toJanuary 1, 2008. Standard hospital scale and stadiometer were used
A. Sharma et al. / Can J Diabetes 36 (2012) 193e198 195
to collect heights and weights for all physician visits, which wereaveraged and used to calculate the body mass index (BMI); gender-specific BMI z-scores were generated using the SAS programprovided by the Center for Disease Control (22). Each insulinregimen (standard vs. MDI vs. CSII) was assigned if that modalitywas used for >9 months during the calendar year of 2008.
A Quebec-specific deprivation index modelled after the Town-send Index has been used for health and welfare planning inQuebec for 2 decades, and was further generalized and validatednationwide in 2001 (23,24). Patient postal codes are used to iden-tify census dissemination areas, which allows each neighbourhoodto be assignedmaterial and social deprivation scores based on 2006Census data, which covers 96% of the population (25). In Canada,census dissemination areas are the smallest geographic unit forwhich census data are available, comprise w600 individuals, andare homogenous with regards to SES (23). Two independent formsof deprivation are identified: material and social. The materialindex encompasses the number of persons without high schooldiplomas, employment rate and average income. The social indexincludes the proportion of persons who are separated, divorced orwidowed; the proportion of single parent families; and theproportion of those living alone. Census measures were combinedby principle component analysis, resulting in 2 uncorrelatedindices. For both, higher centiles or quintiles correspond toincreasing deprivation (23).
Statistical methods
Descriptive analyses and association were assessed by scatter-plots, Box plots and Pearson correlations.
T-tests, chi-square and analysis of variance (ANOVA) analyseswere used to compare patients included in the analyses (n¼353) tothose for whom outcome measures were not available (postal codedid not generate deprivation index, n¼5 and those with <2 A1Cvalues, n¼15).
Crude associations between the primary number of contactswith diabetes educators and potential confounders were measuredby Poisson regression, adding potential confounders individuallyand comparing to the crude model by likelihood ratio test. Thosewith associations of p<0.1 were included in the final model.Because overdispersion was present in the Poisson model, anoverdispersion correction was applied to the final model. Theassociation between SES and admissions involved a logisticregression model, and the association between SES and A1C wasexamined by linear regression. Candidate variables were similarlyassessed for the logistic and linear regression models, with thesame potential confounders identified in each case (26). Multi-collinearity and model assumptions were tested by standard posthoc methods (27,28).
STATA version 10 (College Station, USA) was used for moststatistical analyses, with SAS version 9.2 (Cary, NC) used for thepower calculations. Level of significance was <0.05 unless other-wise stipulated.
Ethics
Administrative approval was obtained from both the divisionand hospital director to access the hospital charts and electronicdatabases, anonymized through hospital record numbers.
Results
Of nearly 500 patients followed in the tertiary care pediatriccentre (n¼495), 373 (75.4%) met inclusion criteria: type 1 diabetesfor at least 12 months; clinic attendance in 2008; and concomitantassessment of diabetes control using A1C and anthropometrics. Of
these 373, 20 children (5.4%) were excluded because their postalcodes did not generate a deprivation index (n¼5) or they had <2A1Cmeasurements in 2008 (n¼15). These 20 children did not differfrom the final cohort in age (12.8 vs. 12.3 years, p¼0.5), gender(p¼0.6), duration of diabetes (5.6 vs. 5.4 years, p¼0.8), number ofcontacts with educators (3.4 vs. 6.7, p¼0.2), average A1C (8.2 vs. 8.8,p¼0.06) or insulinmodality (57.8% standard, vs. 29.4%MDI vs.12.8%CSII, p¼0.3). Fifteen of the excluded had postal codes for calculationof deprivation indices, with no difference in deprivation indexcentiles compared to the final 353 (material centile, p¼0.1 andsocial centile, p¼0.7).
Clinical characteristics in the remaining 353 children aredescribed in Table 1. About half the children utilized standard(twice or three times daily) insulin regimens with the remainingchildren having more intensified therapies (MDI or CSII). Thoseusing CSII were of higher SES than those using MDI or standardregimen (CSII vs. non-CSII users; social or material centile, p¼0.01).
Most children had never been admitted to hospital (n¼331,93.8%); the 22 children (6.2%) who were admitted for poor controlor DKA accounted for 27 admissions at either our centre or anyother hospital. DKA represented 30% of the admission (n¼8) equalto an annual rate of 2.3%. Themajority of patients (70%) and/or theirfamilies contacted the educators whereas aminority had no contact(n¼106) during 2008. Importantly, for those who did not contact,there was no SES differential (data not shown).
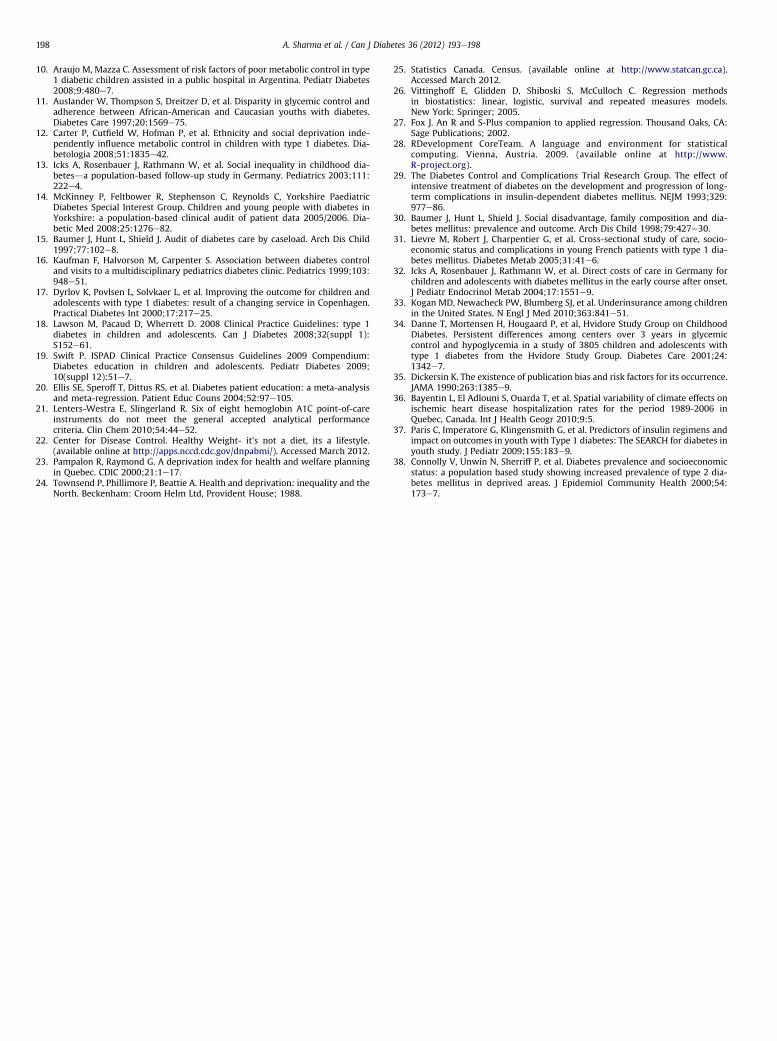
We examined the association between SES and 3 outcomes,namely number of contacts with educators (Table 2), diabetescontrolmeasuredbyA1C (Table 3) andhospital admissions (Table 4).With the overdispersed Poisson model, no association was notedbetween SES and number of contacts with educators, even afteradjustment for confounders and interaction terms (Table 2). Therewas no association between SES and diabetes control as measuredbyA1C (Table 3), even after adjustment for all potential confoundersand interaction terms. No significant associations were noted in thefully adjusted logistic regression model examining the associationbetween SES and hospital admissions (Table 4).
Globally, none of the 3 outcomes were associated with SES.Post hoc power calculations (Monte Carlo simulations) confirmedthe sensitivity of all 3 analyses for detecting clinically significantassociations with SES (not shown).
Discussion
We found that families of lower SES did not contact our diabeteseducators less frequently than those of higher SES for the calendaryear 2008. As described above, educators are key team membersproviding outpatient support, and our work suggests that if thisresource is available, families will access it (17). The linear regres-sion model (Table 3) confirms that more educator contacts wereassociated with lower A1C (improved diabetes control, p¼0.03). Inpractical terms, weekly contacts predicted a 0.5% reduction in A1C,although most families did not use the resource this frequently.Nonetheless, a 0.5% decrease in A1C is of biological significancevis-à-vis chronic complications (29).
Although our overall admission rate appears lower than re-ported in other centres (7.6%; 2.3% for DKA and 5.3% for poorcontrol), the logistic regression demonstrated a positive odds ratiofor the effect of educator contacts on admission risk (Table 4,p¼0.015), presumably the result of increased surveillance followingadmission. Unfortunately, this study design is not capable ofassessing causality. Nevertheless, lack of equitable access toeducators might also explain the higher rates of hospitalization andpoor control reported in other centres as a consequence of lowerSES (vide infra). This study could not address questions such asconsistency of findings across centres; how the educators managedto engage the families; whether contacts were self-initiated or
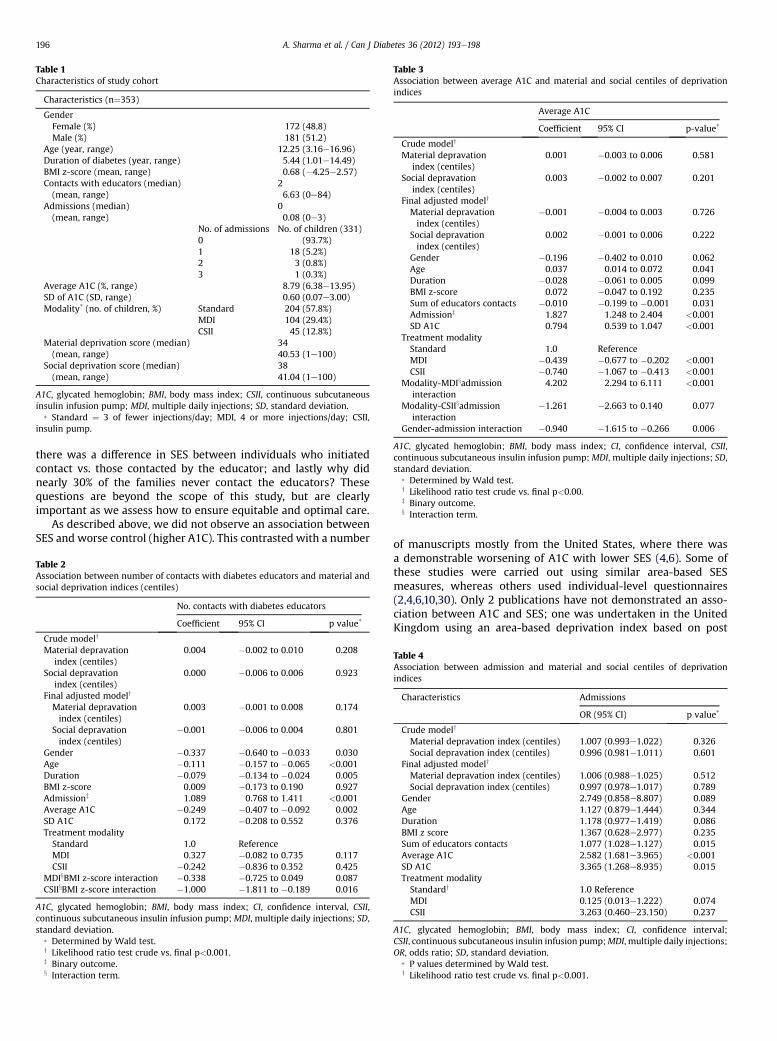
Table 3Association between average A1C and material and social centiles of deprivationindices
Average A1C
Coefficient 95% CI p-value*
Crude modely
Material depravationindex (centiles)
0.001 �0.003 to 0.006 0.581
Social depravationindex (centiles)
0.003 �0.002 to 0.007 0.201
Final adjusted modely
Material depravationindex (centiles)
�0.001 �0.004 to 0.003 0.726
Social depravationindex (centiles)
0.002 �0.001 to 0.006 0.222
Gender �0.196 �0.402 to 0.010 0.062Age 0.037 0.014 to 0.072 0.041Duration �0.028 �0.061 to 0.005 0.099BMI z-score 0.072 �0.047 to 0.192 0.235Sum of educators contacts �0.010 �0.199 to �0.001 0.031Admissionz 1.827 1.248 to 2.404 <0.001SD A1C 0.794 0.539 to 1.047 <0.001
Treatment modalityStandard 1.0 ReferenceMDI �0.439 �0.677 to �0.202 <0.001CSII �0.740 �1.067 to �0.413 <0.001
Modality-MDIxadmissioninteraction
4.202 2.294 to 6.111 <0.001
Modality-CSIIxadmissioninteraction
�1.261 �2.663 to 0.140 0.077
Gender-admission interaction �0.940 �1.615 to �0.266 0.006
A1C, glycated hemoglobin; BMI, body mass index; CI, confidence interval, CSII,continuous subcutaneous insulin infusion pump; MDI, multiple daily injections; SD,standard deviation.
* Determined by Wald test.y Likelihood ratio test crude vs. final p<0.00.z Binary outcome.x Interaction term.
Table 1Characteristics of study cohort
Characteristics (n¼353)
GenderFemale (%) 172 (48.8)Male (%) 181 (51.2)
Age (year, range) 12.25 (3.16e16.96)Duration of diabetes (year, range) 5.44 (1.01e14.49)BMI z-score (mean, range) 0.68 (�4.25e2.57)Contacts with educators (median) 2(mean, range) 6.63 (0e84)
Admissions (median) 0(mean, range) 0.08 (0e3)
No. of admissions No. of children (331)0 (93.7%)1 18 (5.2%)2 3 (0.8%)3 1 (0.3%)
Average A1C (%, range) 8.79 (6.38e13.95)SD of A1C (SD, range) 0.60 (0.07e3.00)Modality* (no. of children, %) Standard 204 (57.8%)
MDI 104 (29.4%)CSII 45 (12.8%)
Material deprivation score (median) 34(mean, range) 40.53 (1e100)
Social deprivation score (median) 38(mean, range) 41.04 (1e100)
A1C, glycated hemoglobin; BMI, body mass index; CSII, continuous subcutaneousinsulin infusion pump; MDI, multiple daily injections; SD, standard deviation.
* Standard ¼ 3 of fewer injections/day; MDI, 4 or more injections/day; CSII,insulin pump.
A. Sharma et al. / Can J Diabetes 36 (2012) 193e198196
there was a difference in SES between individuals who initiatedcontact vs. those contacted by the educator; and lastly why didnearly 30% of the families never contact the educators? Thesequestions are beyond the scope of this study, but are clearlyimportant as we assess how to ensure equitable and optimal care.
As described above, we did not observe an association betweenSES and worse control (higher A1C). This contrasted with a number
Table 2Association between number of contacts with diabetes educators and material andsocial deprivation indices (centiles)
No. contacts with diabetes educators
Coefficient 95% CI p value*
Crude modely
Material depravationindex (centiles)
0.004 �0.002 to 0.010 0.208
Social depravationindex (centiles)
0.000 �0.006 to 0.006 0.923
Final adjusted modely
Material depravationindex (centiles)
0.003 �0.001 to 0.008 0.174
Social depravationindex (centiles)
�0.001 �0.006 to 0.004 0.801
Gender �0.337 �0.640 to �0.033 0.030Age �0.111 �0.157 to �0.065 <0.001Duration �0.079 �0.134 to �0.024 0.005BMI z-score 0.009 �0.173 to 0.190 0.927Admissionz 1.089 0.768 to 1.411 <0.001Average A1C �0.249 �0.407 to �0.092 0.002SD A1C 0.172 �0.208 to 0.552 0.376Treatment modalityStandard 1.0 ReferenceMDI 0.327 �0.082 to 0.735 0.117CSII �0.242 �0.836 to 0.352 0.425
MDIxBMI z-score interaction �0.338 �0.725 to 0.049 0.087CSIIxBMI z-score interaction �1.000 �1.811 to �0.189 0.016
A1C, glycated hemoglobin; BMI, body mass index; CI, confidence interval, CSII,continuous subcutaneous insulin infusion pump; MDI, multiple daily injections; SD,standard deviation.
* Determined by Wald test.y Likelihood ratio test crude vs. final p<0.001.z Binary outcome.x Interaction term.
of manuscripts mostly from the United States, where there wasa demonstrable worsening of A1C with lower SES (4,6). Some ofthese studies were carried out using similar area-based SESmeasures, whereas others used individual-level questionnaires(2,4,6,10,30). Only 2 publications have not demonstrated an asso-ciation between A1C and SES; one was undertaken in the UnitedKingdom using an area-based deprivation index based on post
Table 4Association between admission and material and social centiles of deprivationindices
Characteristics Admissions
OR (95% CI) p value*
Crude modely
Material depravation index (centiles) 1.007 (0.993e1.022) 0.326Social depravation index (centiles) 0.996 (0.981e1.011) 0.601
Final adjusted modely
Material depravation index (centiles) 1.006 (0.988e1.025) 0.512Social depravation index (centiles) 0.997 (0.978e1.017) 0.789
Gender 2.749 (0.858e8.807) 0.089Age 1.127 (0.879e1.444) 0.344Duration 1.178 (0.977e1.419) 0.086BMI z score 1.367 (0.628e2.977) 0.235Sum of educators contacts 1.077 (1.028e1.127) 0.015Average A1C 2.582 (1.681e3.965) <0.001SD A1C 3.365 (1.268e8.935) 0.015Treatment modalityStandardy 1.0 ReferenceMDI 0.125 (0.013e1.222) 0.074CSII 3.263 (0.460e23.150) 0.237
A1C, glycated hemoglobin; BMI, body mass index; CI, confidence interval;CSII, continuous subcutaneous insulin infusion pump;MDI, multiple daily injections;OR, odds ratio; SD, standard deviation.
* P values determined by Wald test.y Likelihood ratio test crude vs. final p<0.001.
A. Sharma et al. / Can J Diabetes 36 (2012) 193e198 197
codes in the 1990s and the second in France (30,31). These incon-sistent findingswill be discussed further below in the context of therelationship between hospitalizations and SES.
In addition, we found no association between SES and hospi-talization for poor control (hyperglycemia) or ketoacidosis. This isin agreement with a 1998 report from the United Kingdom usingarea-based indices to assess control of type 1 diabetes (30). Itcontrasted with findings from the United States, Argentina,Germany, France and a more recent United Kingdom study(1,10,13,14,31). The study from Germany described outcomes fromthe vast majority of pediatric diabetes centres in that country; 42%of all children were admitted in the 4 years post-diagnosis withw50% of these for hyperglycemia or DKA (3). Admission rates werehigher in children with parents of lower education, single-parentfamilies or those with a migration history. These admissions rateswere generally higher than our rates (7.6%) but comparable to thosein Chicago (46%) (1). Many possible explanation for the differencein admission rates could be suggested: the type of specialist vs.nonspecialist care was not consistently defined, the decision toadmit may be subjective, different criteria might be used to admit,or reduced bed availability may limit hospitalizations in our centre.Prospective studies are needed to assess the impact of more equi-table access to outpatient resources and determine whether tar-geting services to vulnerable populations could in fact reduceadmissions for DKA, poor control or severe hypoglycemia in centreswhere lack of outpatient resources is felt to be a problem. That thisquestion warrants further attention is clear. With appropriate tar-geting, educator services might be an effective tool for avoidingonerous admissions, reducing healthcare costs for both state andfamily (32), improving overall diabetes control, and reducing thefrequency of chronic complications.
Theremay be several reasons whymost of the cited publicationsdemonstrate higher A1C or more frequent hospitalizations forthose of lower SES. First, it is plausible that these associations aretruly found in many countries and particularly in the United States,where there are health disparities across all ages (33). Thesuggestion that these differences in outcomes might be attributedto the kind of healthcare system might seem too simplistic, butworse outcomes were noted in the United States with its lack ofuniversal coverage (33). In contrast, the United Kingdom andCanada have single-payer systems and no associations with SESwere noted (for A1C and admissions in Canada and A1C in theUnited Kingdom) (30). This was also true in France for A1C, butthere were more cases of DKA in those of lower SES despite theiruniversal health coverage (31). Despite universal coverage, provi-sion of supplies or access to diabetes team members differ indifferent systems, which may explain some of the conflictingresults. These provisions were not consistently examined in all ofthe cited studies and may need to be explored further, becauseaccess to multidisciplinary team support and availability of costlytest reagents and/or diabetes supplies are likely to be at least asimportant as access to physician services.
There may be other reasons for divergent results. Because theaverage clinic A1C values can vary over time (34), analysis of onlya single year might be misleading. Additional issues to ponderinclude underreporting of negative studies as a form of publica-tion bias (35). Nonetheless, we believe that our failure to observethe reported associations with SES stems from the fact that ourobservations are true within the context of our centre and howwe provide care relatively blind to SES. In this regard, post hocpower calculations (Monte Carlo simulations) confirmed suffi-cient power (>90%) to detect an increase of 0.1% in A1C fromlowest to highest SES quintiles. Moreover, children in Quebec notonly benefit from universal healthcare (i.e., free access to clinicsand/or physicians and diabetes educators), but the province ofQuebec has also established a universal prescription drug
insurance program ensuring free coverage for all diabetessupplies. In fact, the lack of diabetes testing supplies was felt tobe a major reason for poor control in the study by Overstreet inNew Orleans, Louisiana (4).
The strengths of this study include the fact that we seem to bethe first to have examined the association between SES and dia-betes educators utilization. This study utilized validated area-baseddeprivation indices (23,36) and detected findings consistent withothers (e.g. intensive therapy associated with lower A1C, p<0.001from Table 3), providing external validity (6,37). Potential limita-tions include the fact that additional individual-based data may beimportant; these include ethnicity, immigration status, individualfamily situation among others (1,4). Residual selection biases couldarise if many children were not cared for at the typical tertiary caresetting or if the diagnosis of type 1 diabetes varied by SES. Neither isfelt to be true in Canada (38). With regards to information biases,medicolegal obligations and clinical workflow ensure that theeducators are extremely diligent in their use of diabetes database todocument all contacts.
In conclusion, there were no associations noted betweenlower SES and the reduced utilization of diabetes educatorservices, poorer diabetes control as defined by higher A1C, oradmissions for poor diabetes control. If outpatient resources areavailable, this suggests that they will be used equitably. Thesecontacts may translate into better control and fewer admissionsparticularly in a setting with universal healthcare and medicationinsurance.
Acknowledgements
We acknowledgework of educators in diligently entering data inthe database and the families followed at the Montreal Children’sHospital.
Author Disclosure
The authors do not have any conflict of interest to disclose.
Author Contributions
All authors substantially contributed to the conception, design,interpretation of the data, revised the manuscript and gave theirfinal approval of the version to be published.
References
1. Estrada C, Danielson K, Drum M, Lipton R. Hospitalization subsequent todiagnosis in young patients with diabetes in Chicago, Illinois. Pediatrics 2009;124:936e44.
2. Gallegos-Macias A, Macias S, Kaufman E, et al. Relationship between glycemiccontrol, ethnicity and socioeconomic status in Hispanic and white non-Hispanic youths with type 1 diabetes mellitus. Pediatr Diabetes 2003;4:19e23.
3. Icks A, Rosenbauer J, Strassburger K, et al, PDV and Wiss Initiative. Persistentsocial disparities in the risk of hospital admission of paediatric diabetic patientsin Germanydprospective data from 1277 diabetic children and adolescents.Diabetic Med 2007;23:440e2.
4. Overstreet S, Holmes C, Dunlap W, Frentz J. Sociodemographic risk factors todisease control in children with diabetes. Diabetic Med 1997;14:156e7.
5. Schillinger D, Grumbach K, Piette J, et al. Association of health literacy withdiabetes outcomes. JAMA 2002;288:475e82.
6. Springer D, Dziura J, Tambolane W, et al. Optimal control of Type 1 diabetesmellitus in youth receiving intensive treatment. J Pediatr 2006;149:227e32.
7. Frey M, Templin T, Ellis D, et al. Predicting metabolic control in the first 5 yearsafter diagnosis for youths with type 1 diabetes: the role of ethnicity and familystructure. Pediatr Diabetes 2007;8:220e7.
8. Nordly S, Mortensen H, Andreasen A, Jorgensen T. Factors associated withglycaemic outcome of childhood diabetes care in Denmark. Diabetic Med 2005;22:1566e73.
9. Lipton R, Zierold K, Drum M, et al. Re-hospitalization after diagnosis of diabetesvaries by gender and socioeconomic status in urban African-American andLatino young people. Pediatr Diabetes 2002;3:16e22.
A. Sharma et al. / Can J Diabetes 36 (2012) 193e198198
10. Araujo M, Mazza C. Assessment of risk factors of poor metabolic control in type1 diabetic children assisted in a public hospital in Argentina. Pediatr Diabetes2008;9:480e7.
11. Auslander W, Thompson S, Dreitzer D, et al. Disparity in glycemic control andadherence between African-American and Caucasian youths with diabetes.Diabetes Care 1997;20:1569e75.
12. Carter P, Cutfield W, Hofman P, et al. Ethnicity and social deprivation inde-pendently influence metabolic control in children with type 1 diabetes. Dia-betologia 2008;51:1835e42.
13. Icks A, Rosenbauer J, Rathmann W, et al. Social inequality in childhood dia-betesda population-based follow-up study in Germany. Pediatrics 2003;111:222e4.
14. McKinney P, Feltbower R, Stephenson C, Reynolds C, Yorkshire PaediatricDiabetes Special Interest Group. Children and young people with diabetes inYorkshire: a population-based clinical audit of patient data 2005/2006. Dia-betic Med 2008;25:1276e82.
15. Baumer J, Hunt L, Shield J. Audit of diabetes care by caseload. Arch Dis Child1997;77:102e8.
16. Kaufman F, Halvorson M, Carpenter S. Association between diabetes controland visits to a multidisciplinary pediatrics diabetes clinic. Pediatrics 1999;103:948e51.
17. Dyrlov K, Povlsen L, Solvkaer L, et al. Improving the outcome for children andadolescents with type 1 diabetes: result of a changing service in Copenhagen.Practical Diabetes Int 2000;17:217e25.
18. Lawson M, Pacaud D, Wherrett D. 2008 Clinical Practice Guidelines: type 1diabetes in children and adolescents. Can J Diabetes 2008;32(suppl 1):S152e61.
19. Swift P. ISPAD Clinical Practice Consensus Guidelines 2009 Compendium:Diabetes education in children and adolescents. Pediatr Diabetes 2009;10(suppl 12):51e7.
20. Ellis SE, Speroff T, Dittus RS, et al. Diabetes patient education: a meta-analysisand meta-regression. Patient Educ Couns 2004;52:97e105.
21. Lenters-Westra E, Slingerland R. Six of eight hemoglobin A1C point-of-careinstruments do not meet the general accepted analytical performancecriteria. Clin Chem 2010;54:44e52.
22. Center for Disease Control. Healthy Weight- it’s not a diet, its a lifestyle.(available online at http://apps.nccd.cdc.gov/dnpabmi/). Accessed March 2012.
23. Pampalon R, Raymond G. A deprivation index for health and welfare planningin Quebec. CDIC 2000;21:1e17.
24. Townsend P, Phillimore P, Beattie A. Health and deprivation: inequality and theNorth. Beckenham: Croom Helm Ltd, Provident House; 1988.
25. Statistics Canada. Census. (available online at http://www.statcan.gc.ca).Accessed March 2012.
26. Vittinghoff E, Glidden D, Shiboski S, McCulloch C. Regression methodsin biostatistics: linear, logistic, survival and repeated measures models.New York: Springer; 2005.
27. Fox J. An R and S-Plus companion to applied regression. Thousand Oaks, CA:Sage Publications; 2002.
28. RDevelopment CoreTeam. A language and environment for statisticalcomputing. Vienna, Austria. 2009. (available online at http://www.R-project.org).
29. The Diabetes Control and Complications Trial Research Group. The effect ofintensive treatment of diabetes on the development and progression of long-term complications in insulin-dependent diabetes mellitus. NEJM 1993;329:977e86.
30. Baumer J, Hunt L, Shield J. Social disadvantage, family composition and dia-betes mellitus: prevalence and outcome. Arch Dis Child 1998;79:427e30.
31. Lievre M, Robert J, Charpentier G, et al. Cross-sectional study of care, socio-economic status and complications in young French patients with type 1 dia-betes mellitus. Diabetes Metab 2005;31:41e6.
32. Icks A, Rosenbauer J, Rathmann W, et al. Direct costs of care in Germany forchildren and adolescents with diabetes mellitus in the early course after onset.J Pediatr Endocrinol Metab 2004;17:1551e9.
33. Kogan MD, Newacheck PW, Blumberg SJ, et al. Underinsurance among childrenin the United States. N Engl J Med 2010;363:841e51.
34. Danne T, Mortensen H, Hougaard P, et al, Hvidore Study Group on ChildhoodDiabetes. Persistent differences among centers over 3 years in glycemiccontrol and hypoglycemia in a study of 3805 children and adolescents withtype 1 diabetes from the Hvidore Study Group. Diabetes Care 2001;24:1342e7.
35. Dickersin K. The existence of publication bias and risk factors for its occurrence.JAMA 1990;263:1385e9.
36. Bayentin L, El Adlouni S, Ouarda T, et al. Spatial variability of climate effects onischemic heart disease hospitalization rates for the period 1989-2006 inQuebec, Canada. Int J Health Geogr 2010;9:5.
37. Paris C, Imperatore G, Klingensmith G, et al. Predictors of insulin regimens andimpact on outcomes in youth with Type 1 diabetes: The SEARCH for diabetes inyouth study. J Pediatr 2009;155:183e9.
38. Connolly V, Unwin N, Sherriff P, et al. Diabetes prevalence and socioeconomicstatus: a population based study showing increased prevalence of type 2 dia-betes mellitus in deprived areas. J Epidemiol Community Health 2000;54:173e7.