Embed Size (px)
Citation preview
Impala Platinum Holdings LimitedInterim results1 March 2018
Impala Rustenburg 16 Shaft
Certain statements contained in this presentation other than the statements of historical fact contain forward-looking statements regardingImplats’ operations, economic performance or financial condition, including, without limitation, those concerning the economic outlook forthe platinum industry, expectations regarding metal prices, production, cash costs and other operating results, growth prospects and theoutlook of Implats’ operations, including the completion and commencement of commercial operations of certain of Implats’ explorationand production projects, its liquidity and capital resources and expenditure and the outcome and consequences of any pending litigation,regulatory approvals and/or legislative frameworks currently in the process of amendment, or any enforcement proceedings. AlthoughImplats believes that the expectations reflected in such forward-looking statements are reasonable, no assurance can be given that suchexpectations will prove to be correct. Accordingly, results may differ materially from those set out in the forward-looking statements as aresult of, among other factors, changes in economic and market conditions, success of business and operating initiatives, changes in theregulatory environment and other government actions, fluctuations in metal prices and exchange rates and business and operational riskmanagement. For a discussion on such factors, refer to the risk management section of the company’s Annual Report. Implats is not obligedto update publicly or release any revisions to these forward-looking statements to reflect events or circumstances after the dates of theAnnual Report or to reflect the occurrence of unanticipated events. All subsequent written or oral forward-looking statements attributableto Implats or any person acting on its behalf are qualified by the cautionary statements herein.
Forward looking statement
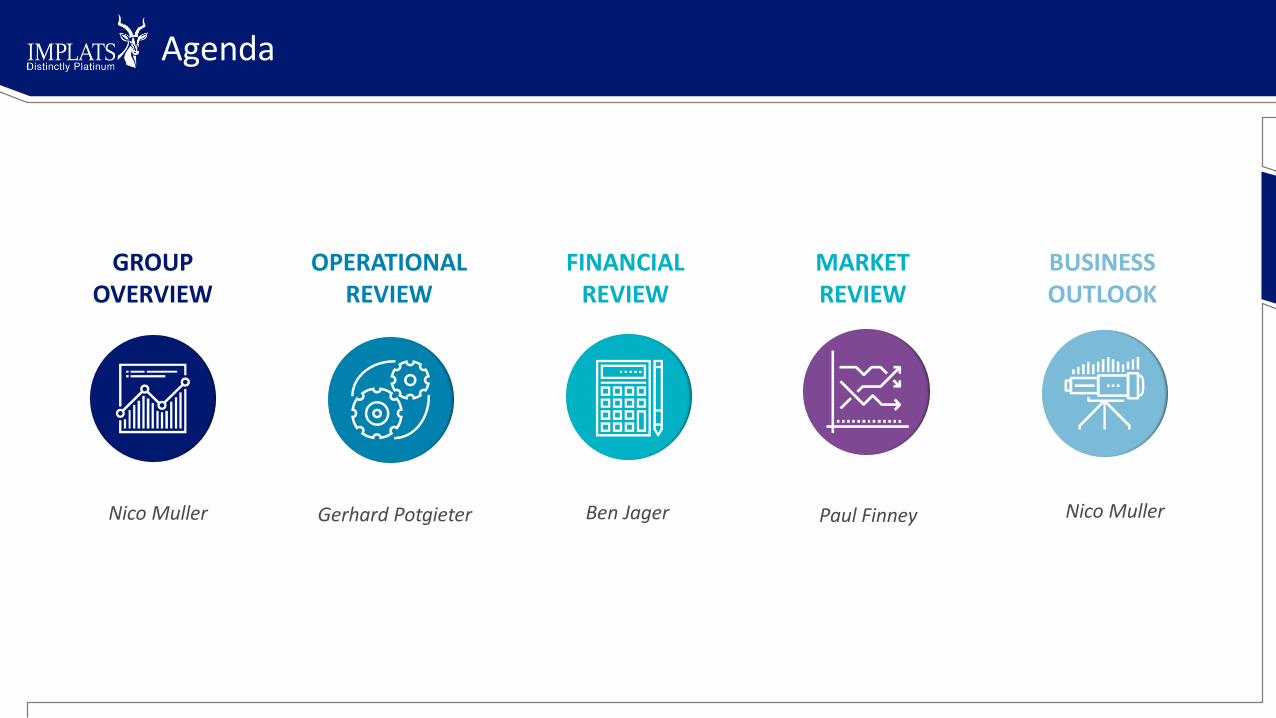
Agenda
GROUPOVERVIEW
OPERATIONAL REVIEW
FINANCIAL REVIEW
Nico Muller Gerhard Potgieter Ben Jager
MARKET REVIEW
Paul Finney
BUSINESS OUTLOOK
Nico Muller

OVERVIEWNico Muller, CEO
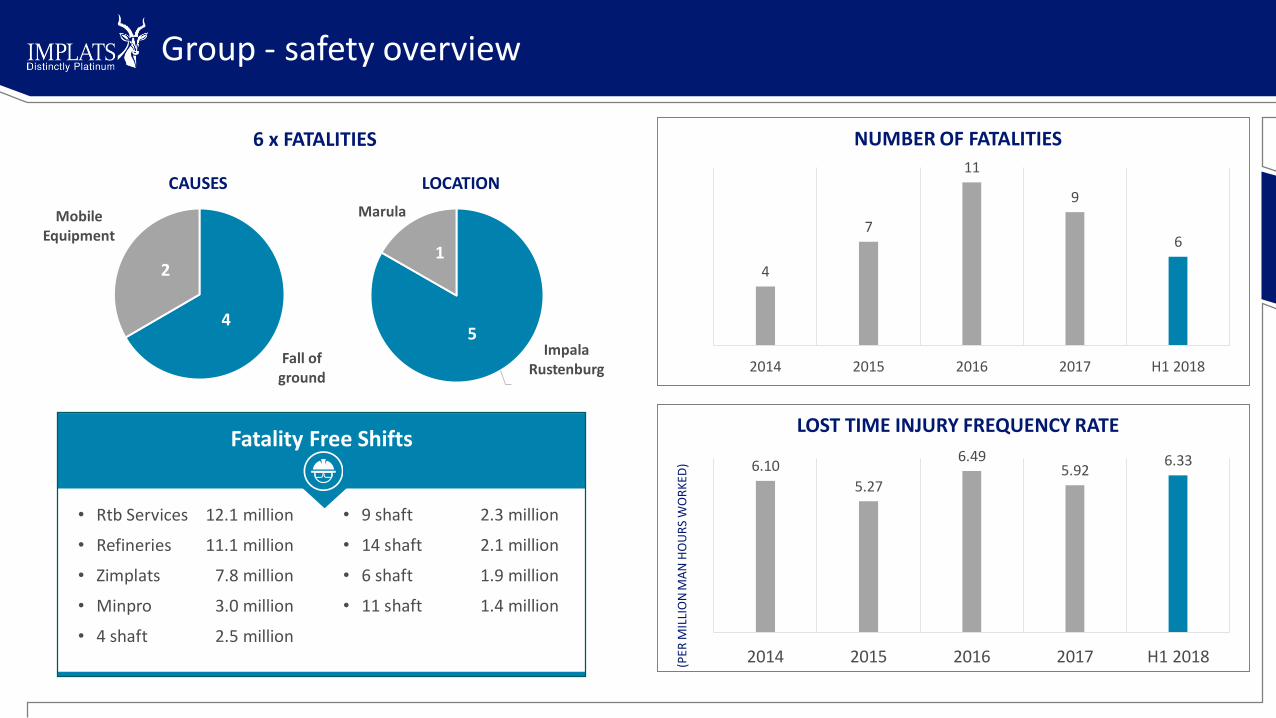
• 9 shaft 2.3 million
• 14 shaft 2.1 million
• 6 shaft 1.9 million
• 11 shaft 1.4 million
Group - safety overview
4
7
11
9
6
2014 2015 2016 2017 H1 2018
NUMBER OF FATALITIES
6.10
5.27
6.495.92
6.33
2014 2015 2016 2017 H1 2018(PER
MIL
LIO
N M
AN
HO
UR
S W
OR
KED
)
LOST TIME INJURY FREQUENCY RATE
• Rtb Services 12.1 million
• Refineries 11.1 million
• Zimplats 7.8 million
• Minpro 3.0 million
• 4 shaft 2.5 million
Impala Rustenburg
Marula
LOCATION
1
5
Fall of ground
Mobile Equipment
CAUSES
4
2
Fatality Free Shifts
6 x FATALITIES

Description H1 2018 H1 2017 Var (%) Remarks
Tonnes Milled Mt 9.94 9.26 7 • Encouraging period-on-period improvement
Concentrate production
Mine-to-market production
ImpalaZimplatsTwo RiversMimosaMarula
Third-party purchased
Pt koz
Pt koz
Pt kozPt kozPt kozPt kozPt koz
Pt koz
763
678
348140
836343
86
766
658
318139
976143
108
(0)
3
91
(14)30
(21)
• Mine-to market increases offset by lower IRS 3rd party receipts
• Good improvement from Impala (14 and 16 shafts)
• Lower grade and platinum ounces produced due to mining of split reef
• Lower receipts from third parties
Refined production Pt koz 727 779 (7) • Impacted by Impala stock build-up due to furnace repairs (75 Pt koz)
Unit cost (milled)
Unit cost (refined)
Unit cost (stock adjusted)
R/t
R/oz
R/oz
961
28 206
24 055
928
22 797
22 795
(4)
(24)
(6)
• Operating costs well controlled
• Unit cost (refined) impacted by temporary stock build-up
• Stock-adjusted unit costs (refined) in line with inflation
Capital expenditure
Impala stay-in-business capitalImpala replacement projectsZimplats replacement projects
Rbn
RmRmRm
1.90
1 052390
99
1.59
865332
70
20
221741
• Increase in capitalised development• Ramp-up work at 16 and 20 Shafts• Ramp-up at Mupani project (approved during H1 2017)
Waterberg project Rm 408 - - • New investment
Group - operational overview• 6

Description H1 2018 H1 2017 Var (%)
Platinum ounces produced (refined) koz 726 700 778 500 (7)
Platinum ounces sold koz 648 800 730 700 (11)
Revenue per platinum ounce sold R/oz 25 968 24 921 4
Revenue Rbn 17.28 18.48 (7)
Cost of sales Rbn 16.55 18.62 11
Gross profit Rm 733 (139) 627
Loss after tax Rm (164) (328) 50
Cash movement Rbn (3.55) (1.32) (169)
Group - business overview
-
5 000
10 000
15 000
20 000
25 000
30 000
TwoRivers in
conc
Zimplatsin matte
Mimosa inconc
Marula inconc
Impalarefined
Grouprefined
R/P
t o
z
Replacement capital Stay-in-Business capital
Cash cost 2018 basket revenue R/Pt oz sold
• 7
REVENUE AND COST OF PRODUCTION

OPERATIONAL REVIEWGerhard Potgieter, COO

Impala
318 333 348
319 336272
0
50
100
150
200
250
300
350
400
0
50
100
150
200
250
300
350
400
H1 2017 H2 2017 H1 2018
Pt
oz
(00
0)
PRODUCTION
Pt in concentrate Pt refined
23 304 23 76930 405
23 301 24 398 23 822
0
5000
10000
15000
20000
25000
30000
0
5000
10000
15000
20000
25000
30000
H1 2017 H2 2017 H1 2018
R/o
z
COSTS
Cost/Pt oz refined Stock-adjusted
-1 508
-1 871-1 625
H1 2017 H2 2017 H1 2018
Rm
CASH MOVEMENT
Description H1 2018 H1 2017Var(%) Remarks
Tonnes milled Mt 5.67 5.05 12• Fatalities and lower volumes at 10 & 20 shafts• Higher production from 1, 11, 12, 14 & 16
shafts
PGE head grade g/t 4.05 4.15 (2) • 16 shaft ore passes
Refined platinumPlatinum in concentrate
kozkoz
272348
319318
(15)9
• 75 koz stock build-up (furnace 5 rebuild)• Improvement from 14 and 16 Shaft
Cost per platinum ounceStock adjusted
R/ozR/oz
30 40523 822
23 30423 301
(30)(2)
• Lower refined production volumes• Supported by higher production
Capital expenditure Rbn 1.44 1.20 (20)• R1 052 million stay-in-business capital• R390 million replacement projects
Cash flow before financing and working capital
Rm (1 625) (1 508) (8) • R1.44 billion capex
• Impala Rustenburg CE (Mark Munroe) commenced on 18 January
• Strategic review underway
• Replacement projects: increased focus on operational readiness
• Transformer fire at the furnace will impact contingency capacity resulting in expected inventorybuild of 60 000 ounces by year end

318.4
348.332.5
10.1
4.7
4.3 2.0 0.4 0.0 0.2 1.6
2.3 3.2
8.4
8.5
H1 2017 14 16 11 1 12 EF 6 20 10 4 9 7 7A H1 2018
Oz
(000
)
Ram
p –
up
aft
er f
ire
Bu
ild u
p S
haf
t
Pro
du
ctio
n im
pro
vem
en
t
Shaf
t cl
ose
dSafe
ty in
cid
ent
Shaf
t in
har
vest
mo
de
Impala Shafts - Movement in platinum contribution
Safe
ty in
cid
ent
Shaf
t cl
ose
d
Shaf
t cl
ose
d
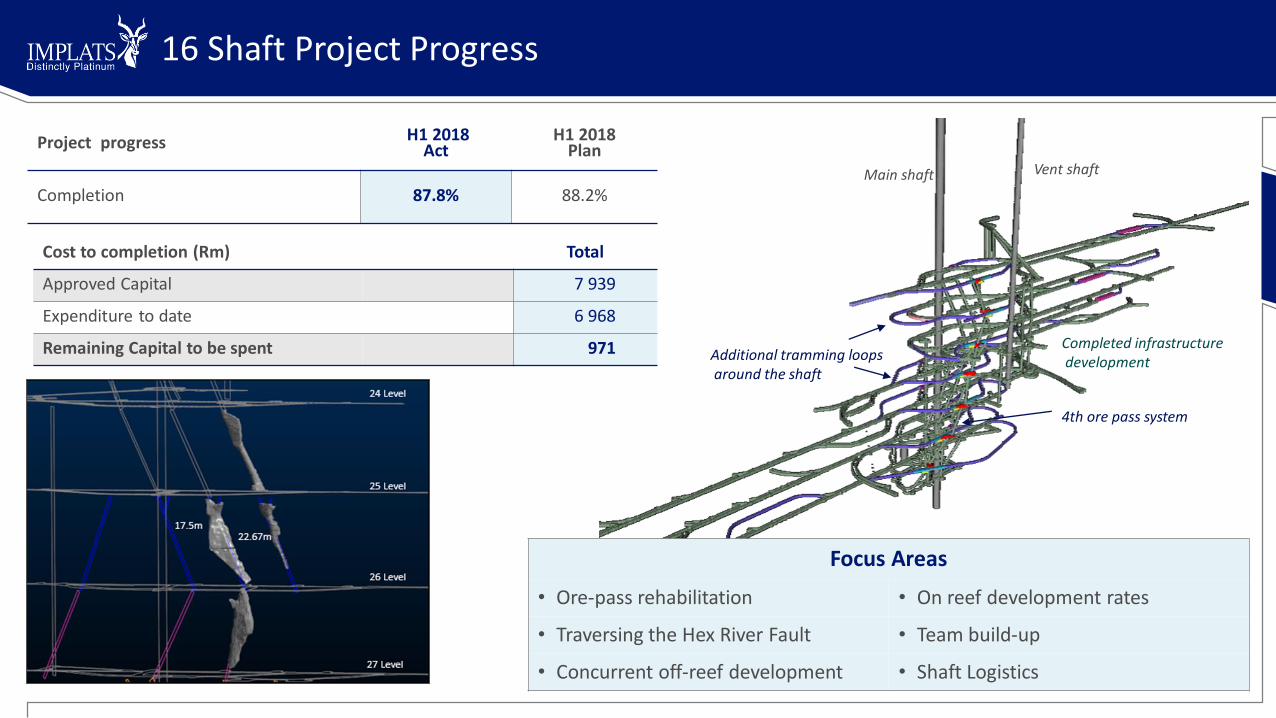
16 Shaft Project Progress
Project progress H1 2018Act
H1 2018Plan
Completion 87.8% 88.2%
Additional tramming loopsaround the shaft
4th ore pass system
Main shaft Vent shaft
Completed infrastructuredevelopment
Focus Areas
• Ore-pass rehabilitation • On reef development rates
• Traversing the Hex River Fault • Team build-up
• Concurrent off-reef development • Shaft Logistics
Cost to completion (Rm) Total
Approved Capital 7 939
Expenditure to date 6 968
Remaining Capital to be spent 971
0
20
40
60
80
100
0
500
1 000
1 500
2 000
2 500
3 000
2014 2015 2016 2017 2018 2019 2020 2021 2022
Per
cen
tage
of
Ram
p -
up
An
nu
al t
on
nes
(00
0)
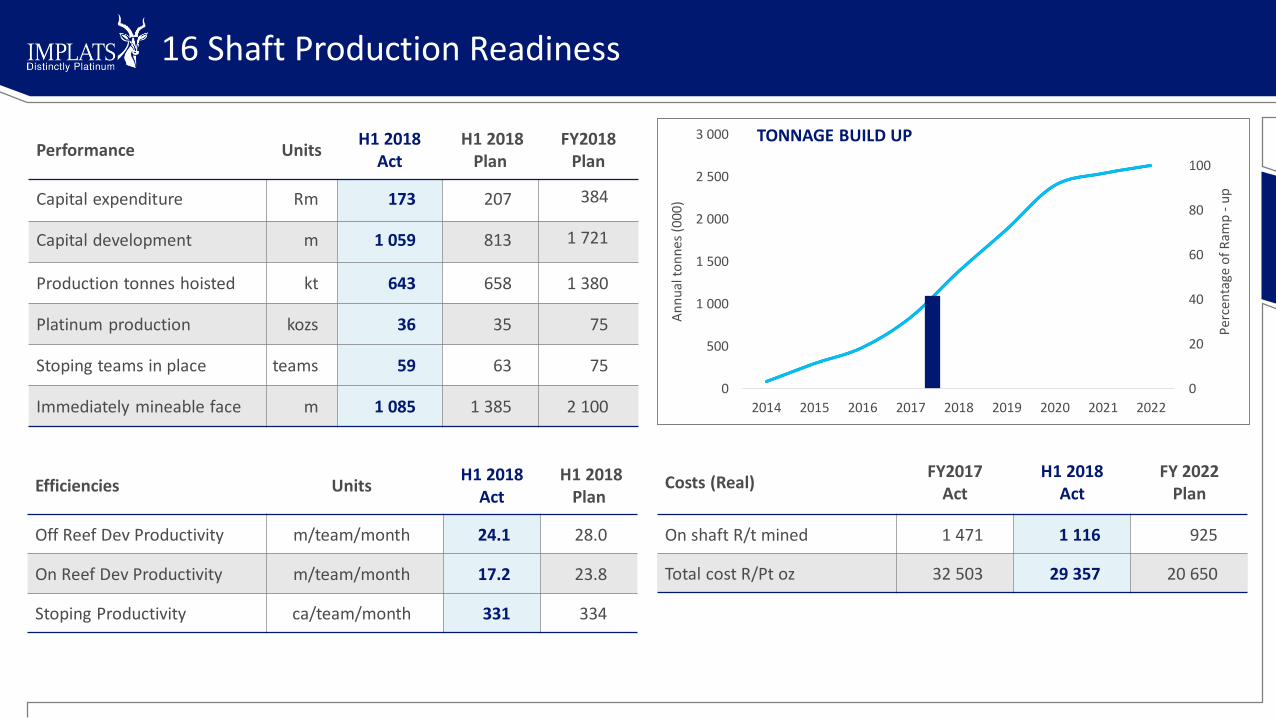
Efficiencies UnitsH1 2018
ActH1 2018
Plan
Off Reef Dev Productivity m/team/month 24.1 28.0
On Reef Dev Productivity m/team/month 17.2 23.8
Stoping Productivity ca/team/month 331 334
TONNAGE BUILD UP
Costs (Real)FY2017
ActH1 2018
ActFY 2022
Plan
On shaft R/t mined 1 471 1 116 925
Total cost R/Pt oz 32 503 29 357 20 650
Performance UnitsH1 2018
ActH1 2018
PlanFY2018
Plan
Capital expenditure Rm 173 207 384
Capital development m 1 059 813 1 721
Production tonnes hoisted kt 643 658 1 380
Platinum production kozs 36 35 75
Stoping teams in place teams 59 63 75
Immediately mineable face m 1 085 1 385 2 100
16 Shaft Production Readiness

Project progress H1 2018Act
H1 2018Plan
Completion 87.8% 88.2%
Focus areas
• Mineable face length• Stope team productivity• Managing complex geology
Capital development still to be done
Incline development Completed 22 to 18 level
Decline development completed 23 to 25 level
Main shaft Vent shaft
Cost to completion (Rm) Total
Approved capital 8 375
Expenditure to date 7 667
Remaining capital to be spent 708
20 Shaft Project Progress
Fault lines Mining

EfficienciesUnits H1 2018
ActH1 2018
Plan
Off reef dev productivity m/team/month 25.1 22.9
On reef dev productivity m/team/month 17.5 17.5
Stoping productivity ca/team/month 251 327
-
20
40
60
80
100
0
400
800
1 200
1 600
2 000
2011 2012 2013 2014 2015 2016 2017 2018 2019 2020 2021 2022
Per
cen
t o
f R
amp
up
An
nu
al t
on
nes
(00
0)
TONNAGE BUILD UPPerformance Units
H1 2018Act
H1 2018Plan
FY2018Plan
Capital expenditure Rm 167 204 338
Capital development m 523 653 1 399
Production tonnes hoisted ktpa 490 590 1 200
Platinum production koz/a 35 43 110
Stoping teams in place teams 54 58 75
Immediately mineable face m 1 599 1 850 2 700
Costs (Real)FY2017
ActH1 2018
ActFY 2022
Plan
On shaft R/t mined 1 281 1390 850
Total cost R/Pt oz 28 028 28 564 19 700
20 Shaft Production Readiness
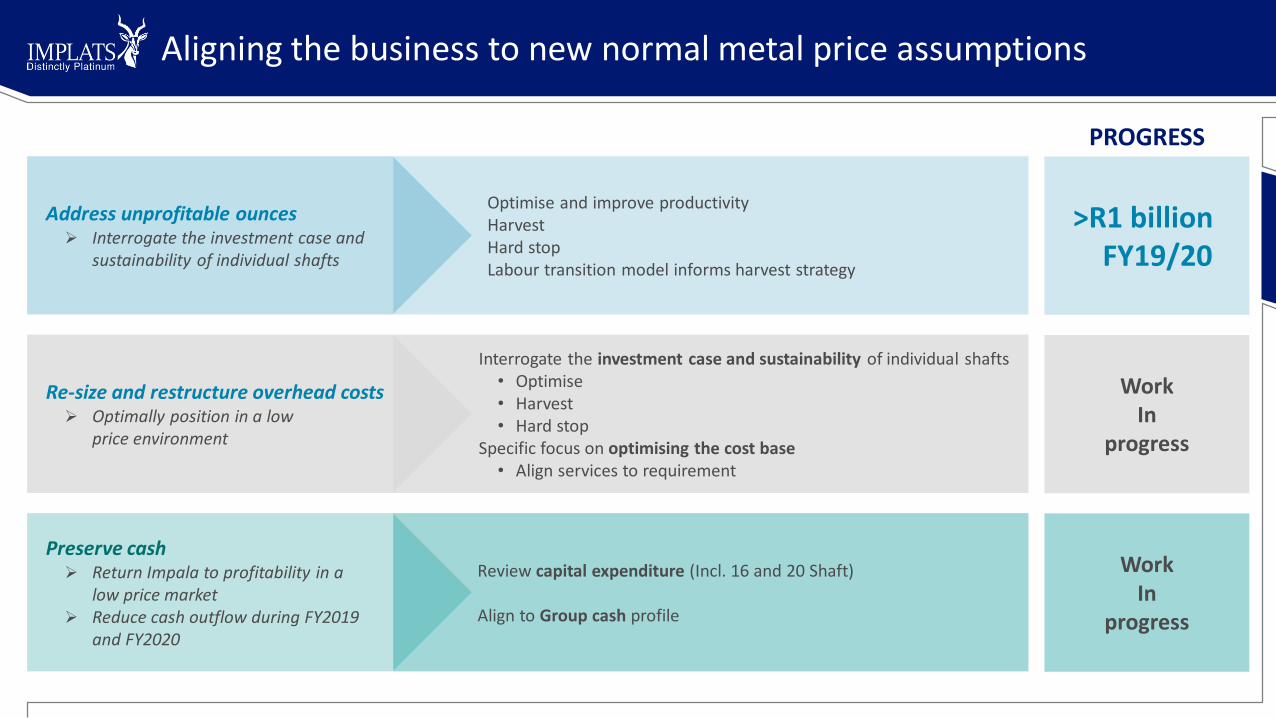
WorkIn
progress
WorkIn
progress
>R1 billionFY19/20
Aligning the business to new normal metal price assumptions
PROGRESS
Preserve cash➢ Return Impala to profitability in a
low price market➢ Reduce cash outflow during FY2019
and FY2020
Review capital expenditure (Incl. 16 and 20 Shaft)
Align to Group cash profile
Re-size and restructure overhead costs➢ Optimally position in a low
price environment
Interrogate the investment case and sustainability of individual shafts • Optimise• Harvest• Hard stop
Specific focus on optimising the cost base• Align services to requirement
Address unprofitable ounces➢ Interrogate the investment case and
sustainability of individual shafts
Optimise and improve productivityHarvestHard stopLabour transition model informs harvest strategy
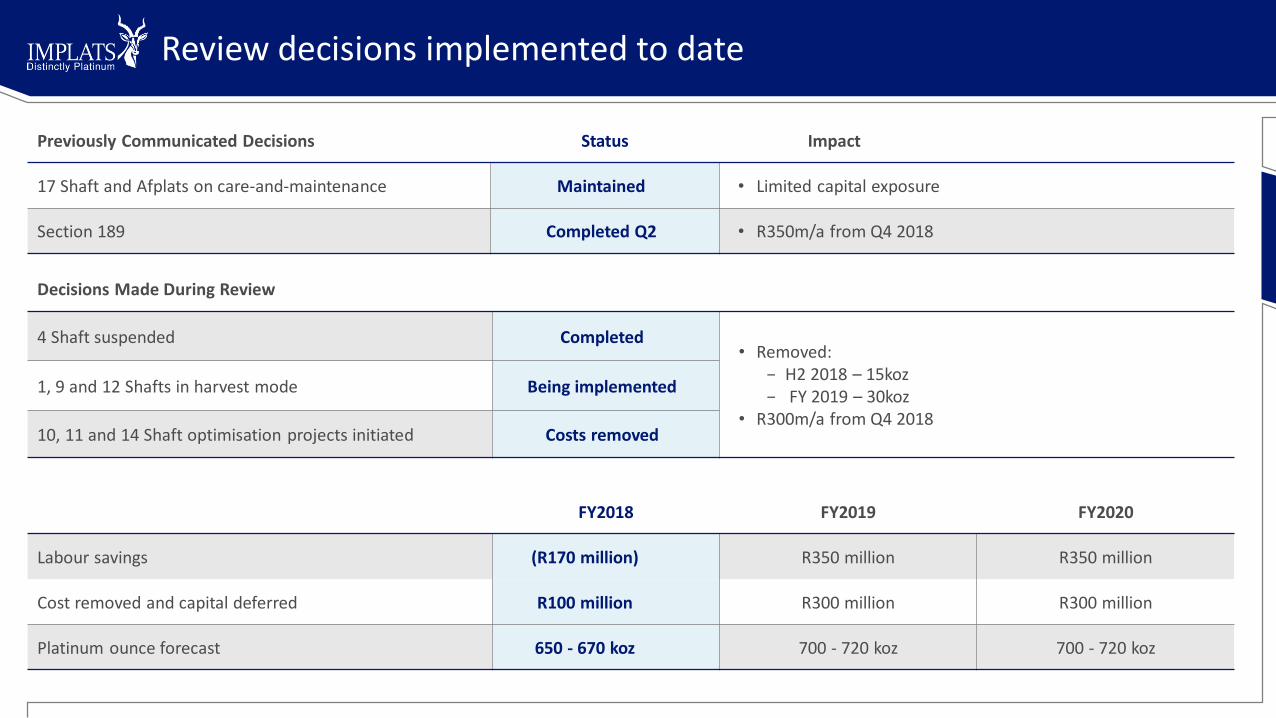
Review decisions implemented to date
Previously Communicated Decisions Status Impact
17 Shaft and Afplats on care-and-maintenance Maintained • Limited capital exposure
Section 189 Completed Q2 • R350m/a from Q4 2018
Decisions Made During Review
4 Shaft suspended Completed• Removed:
− H2 2018 – 15koz− FY 2019 – 30koz
• R300m/a from Q4 2018
1, 9 and 12 Shafts in harvest mode Being implemented
10, 11 and 14 Shaft optimisation projects initiated Costs removed
FY2018 FY2019 FY2020
Labour savings (R170 million) R350 million R350 million
Cost removed and capital deferred R100 million R300 million R300 million
Platinum ounce forecast 650 - 670 koz 700 - 720 koz 700 - 720 koz

Marula
43
25
43
-10
10
30
50
H1 2017 H2 2017 H1 2018Pt
oz
in c
on
c(0
00
)
PRODUCTION
24 060
39 718
24 954
H1 2017 H2 2017 H1 2018
R/o
z
COSTS
-295
-545
36
H1 2017 H2 2017 H1 2018
Rm
CASH MOVEMENT
Description H1 2018 H1 2017Var(%)
Remarks
Tonnes milled kt 941 909 4 • Fatality at Clapham in October 2017
PGE head grade g/t 4.36 4.42 (1) • Increase in development/stoping ratio
Platinum ounces in concentrate
koz 43 43 0 • Production maintained
Cost per platinum ounce in concentrate
R/oz 24 954 24 060 (4) • Costs well contained
Capital expenditure Rm 29 58 50 • Cash preservation
Cash flow before financing and working capital
Rm 36 (295) 112 • Higher revenue off higher metal prices
Operational continuity maintained
• Only minor community related issues, addressed at mine level• Chrome plant restarted in January 2018
Operating performance
• Q2 fatality set back• Encouraging unit cost trend• R156 million contribution to Group gross profit including IRS
Sustained community relations and focus on profitability
17

Two Rivers
9785 83
0
10
20
30
40
50
60
70
80
90
100
H1 2017 H2 2017 H1 2018
Pt
oz
in c
on
c(0
00)
PRODUCTION
12 17213 791 14 688
H1 2017 H2 2017 H1 2018
R/o
z
COSTS
276287
272
H1 2017 H2 2017 H1 2018
Rm
CASH MOVEMENT
Description H1 2018 H1 2017Var(%)
Remarks
Tonnes milled Mt 1.71 1.75 (2) • Additional toll treated tonnage in H1 2017
PGE head grade g/t 3.70 4.03 (8) • Dilution from split reef
Platinum ounces in concentrate
000 oz 83 97 (14) • Lower grade from split reef
Cost per platinum ounce in concentrate
R/oz 14 688 12 172 (21) • Lower grades increased unit costs
Capital expenditure Rm 226 175 29• Deepening of Main Decline delayed due to
delays in mining right transfer
Cash flow before financing and working capital
Rm 272 276 (2) • Cash flow maintained
Business Performance
• Mining volumes remain strong• Lower grade split reef impacting on
Mitigation Strategies
• Concentrator expansion• study underway, early study outcomes yield positive financial returns• Impact on Group cash flow critical
• Remaining extent of Kalkfontein: Regulatory approval obtained
Zimplats
137 144 136
0
20
40
60
80
100
120
140
160
H1 2017 H2 2017 H1 2018Pt
oz
in m
atte
(00
0)
PRODUCTION
1 233 1 2641 336
H1 2017 H2 2017 H1 2018
US$
/oz
COSTS
4237
58
H1 2017 H2 2017 H1 2018
US$
m
CASH MOVEMENT
Description H1 2018 H1 2017Var(%)
Remarks
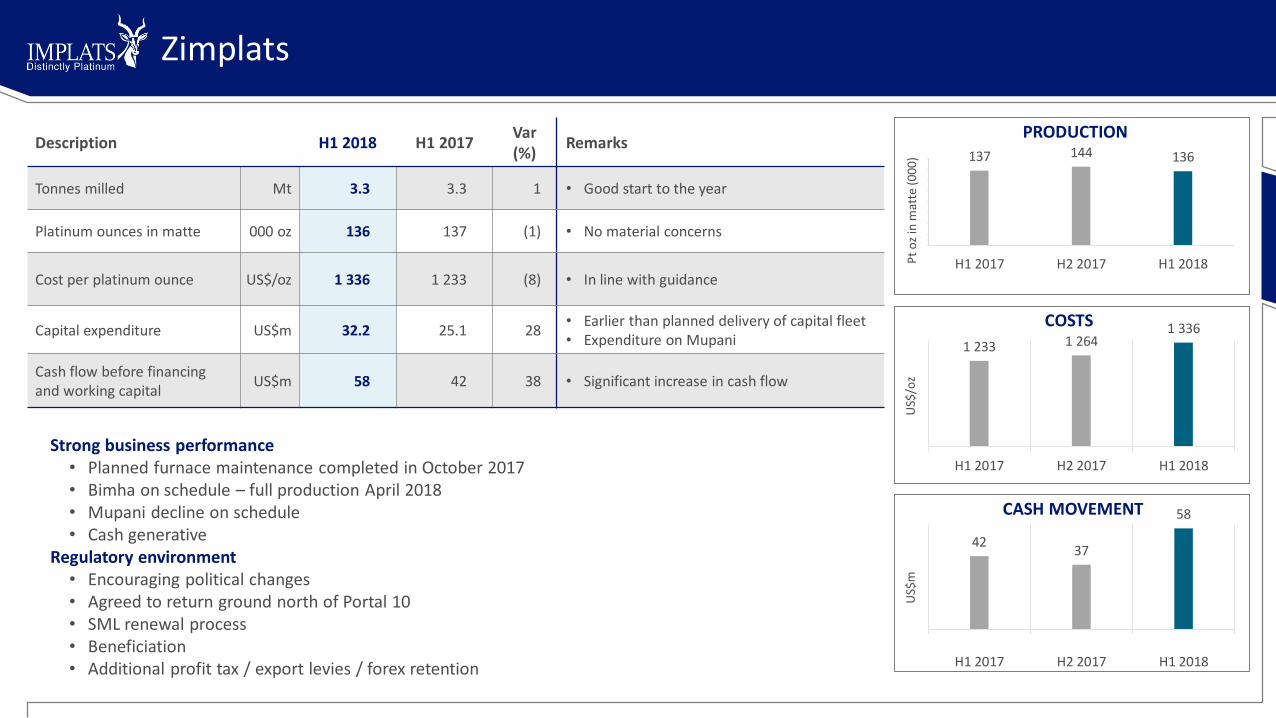
Tonnes milled Mt 3.3 3.3 1 • Good start to the year
Platinum ounces in matte 000 oz 136 137 (1) • No material concerns
Cost per platinum ounce US$/oz 1 336 1 233 (8) • In line with guidance
Capital expenditure US$m 32.2 25.1 28• Earlier than planned delivery of capital fleet• Expenditure on Mupani
Cash flow before financing and working capital
US$m 58 42 38 • Significant increase in cash flow
Strong business performance• Planned furnace maintenance completed in October 2017• Bimha on schedule – full production April 2018• Mupani decline on schedule• Cash generative
Regulatory environment• Encouraging political changes• Agreed to return ground north of Portal 10• SML renewal process• Beneficiation• Additional profit tax / export levies / forex retention
Mimosa
61 61 63
0
10
20
30
40
50
60
70
H1 2017 H2 2017 H1 2018Pt
oz
in c
on
c(0
00
)
PRODUCTION
1 539 1 484 1 479
H1 2017 H2 2017 H1 2018
US$
/oz
COSTS
27
1
25
H1 2017 H2 2017 H1 2018
US$
m
CASH MOVEMENT
Description H1 2018 H1 2017Var(%)
Remarks
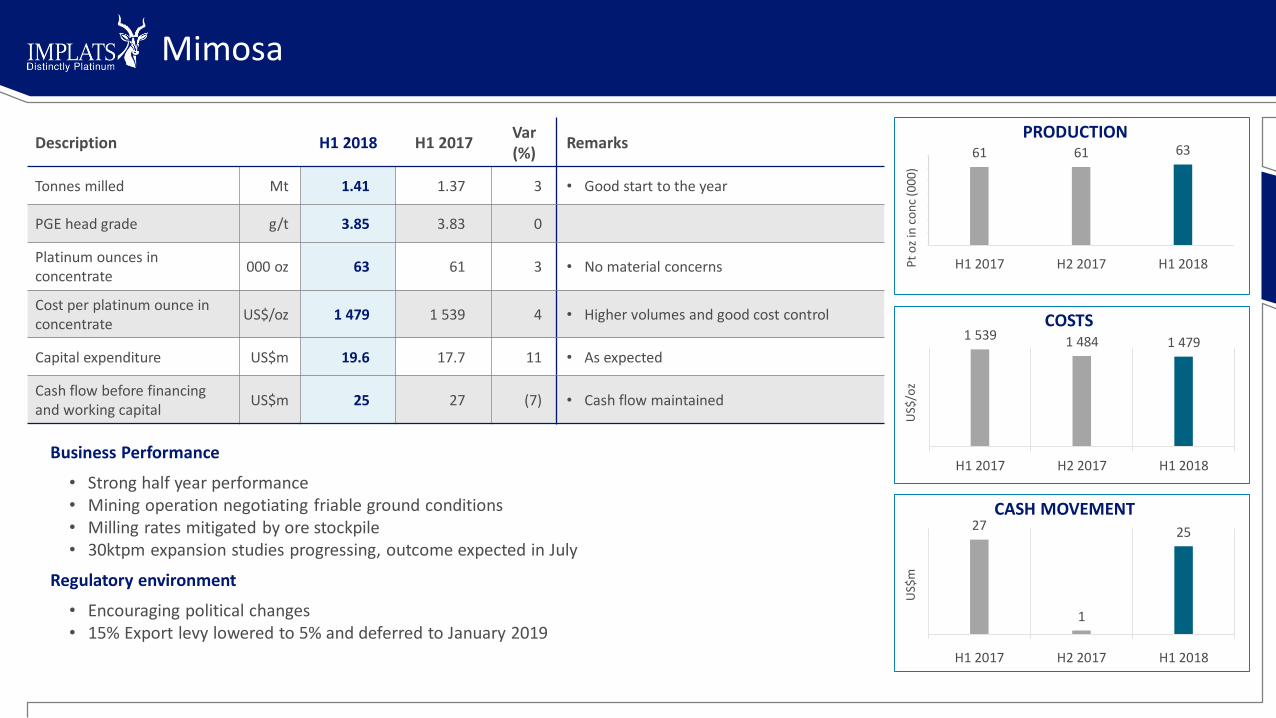
Tonnes milled Mt 1.41 1.37 3 • Good start to the year
PGE head grade g/t 3.85 3.83 0
Platinum ounces in concentrate
000 oz 63 61 3 • No material concerns
Cost per platinum ounce in concentrate
US$/oz 1 479 1 539 4 • Higher volumes and good cost control
Capital expenditure US$m 19.6 17.7 11 • As expected
Cash flow before financing and working capital
US$m 25 27 (7) • Cash flow maintained
Business Performance
• Strong half year performance• Mining operation negotiating friable ground conditions• Milling rates mitigated by ore stockpile• 30ktpm expansion studies progressing, outcome expected in July
Regulatory environment
• Encouraging political changes• 15% Export levy lowered to 5% and deferred to January 2019

IRS
• Once off treatment for a toll refining customer
• Refined output constrained by Rustenburg smelter maintenance
• R819 million cash generated in first half
330 306 317
H1 2017 H2 2017 H1 2018
oz
(00
0)
MINE-TO-MARKET RECEIPTS
108
88 86
56104
H1 2017 H2 2017 H1 2018
oz
(000
)
THIRD-PARTY RECEIPTS
788
502
819
H1 2017 H2 2017 H1 2018
Rm
CASH MOVEMENT
Description H1 2018 H1 2017Var(%)
Remarks
Receipts purchased 000 oz 403 439 8
Mine-to-market 000 oz 317 330 (4) • Lower receipts from Two Rivers
3rd Party purchased 000 oz 86 108 (21) • Lower third party volumes
Receipts returned 000 oz 104 - - • Once-off third party receipts
Refined output 000 oz 455 460 (1) • Impacted by furnace 5 rebuild
Cash flow before financing and working capital
Rm 819 788 4 • Once-off third party toll treatment

Waterberg Transaction
▪ Implats buys 15% for $30m
▪ PTM sells 8.6% for $17.2m
▪ JOGMEC sells 6.4% for $12.8m
▪ Implats buys 12.2% from JOGMEC for $34.8m
▪ Implats invests S130m to earn in 22.8% (4.75% from JOGMEC & 18.1% from PTM)
▪ First right of refusal on concentrate offtake
PTM45.65%
Mnombo*
26.00%
JOGMEC28.35%
BEFORE IMPLATS
PTM37.05%
Mnombo*
26.00%
JOGMEC21.95%
Implats15.00%
CURRENT
PTM18.99%
Mnombo*
26.00%
JOGMEC5.00%
Implats50.01%
OPTION
* PTM holds 49.90% of Mnombo

Waterberg definitive feasibility study
Joint owners team selected for the DFS withtwo options being considered:
▪ Option 1: 600 ktpm mining complex- same as the existing PFS
▪ Option 2: 250 to 350 ktpm mining complex
▪ DFS to be completed in accordance with both SAMREC (South Africa) and NI 43-101 (Canada) standards
▪ Lower capital option best matches the current available capacity at RTB Smelter
▪ The DFS is expected to be completed in early 2019
Lead consultants– tendered, contracts being finalised
▪ Overall project management contract
▪ Design
▪ Processing
▪ Infrastructure
▪ Mining
▪ Early study work in progress
▪ Geotechnical studies on the critical path
▪ Priority on final geological model / resource evaluation, bulk services, integrated

FINANCIAL REVIEWBen Jager, Acting CFO

Income statement
R million Dec-2017 Dec-2016 % change
Sales 17 280 18 484 (7)
Cost of sales (16 547) (18 623) 11
Gross profit 733 (139) 627
Gross margin (%) 4.2 (0.8) 625
Profit / Loss from operations 554 (399) 239
Other (361) 160 (326)
Profit/(Loss) before tax 193 (238) 181
Income tax expense (357) (90) (297)
Loss for the year (164) (328) 50
HEPS (cps) (21) (71) 70
Group unit cost (R/Ptoz) 28 206 22 797 (24)
▪ Revenue reduced due to lower sales volumes▪ Smelter maintenance
▪ Cost of sales reduced by 11%▪ Inventory build-up
▪ Group unit cost up 24% to R28 206 per platinum ounce refined
▪ Stock adjusted unit cost up 5.5% toR 24 055 per platinum ounce refined
Sales revenue
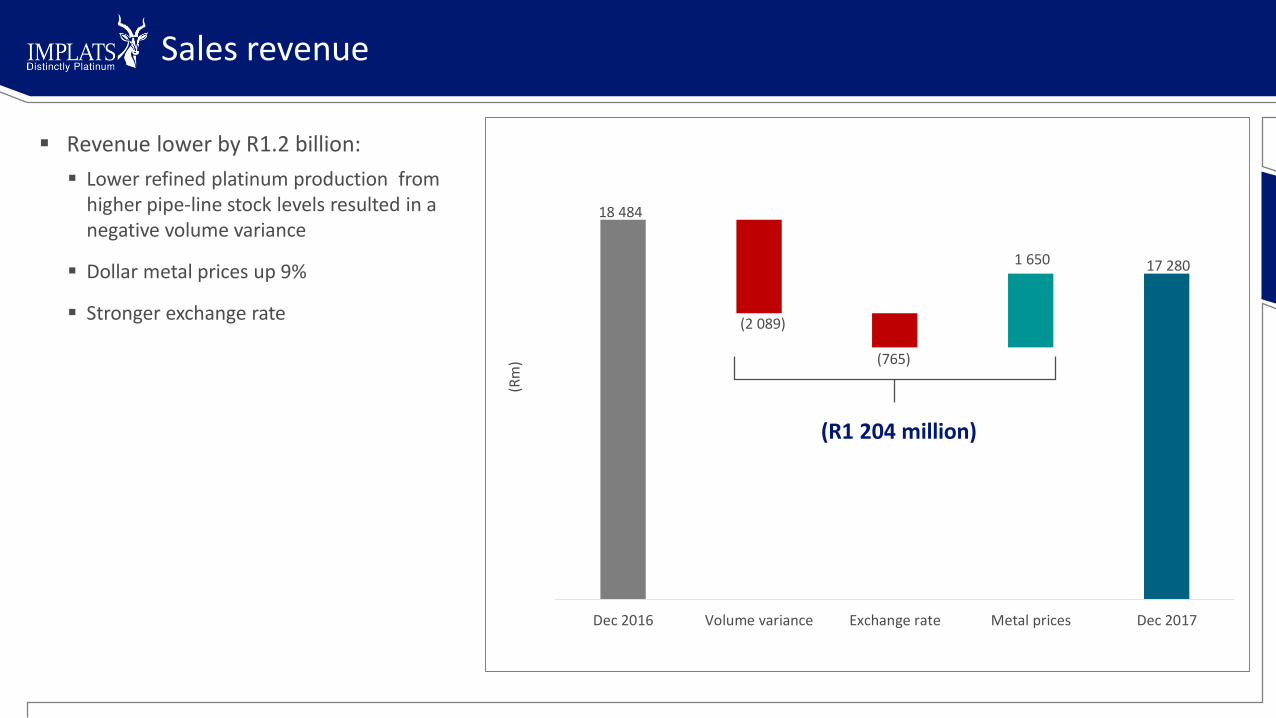
18 484
16 39515 630 15 630
17 280
(2 089)
(765)
1 650
Dec 2016 Volume variance Exchange rate Metal prices Dec 2017
(R1 204 million)
(Rm
)
▪ Revenue lower by R1.2 billion:
▪ Lower refined platinum production from higher pipe-line stock levels resulted in a negative volume variance
▪ Dollar metal prices up 9%
▪ Stronger exchange rate
Cost of sales movement
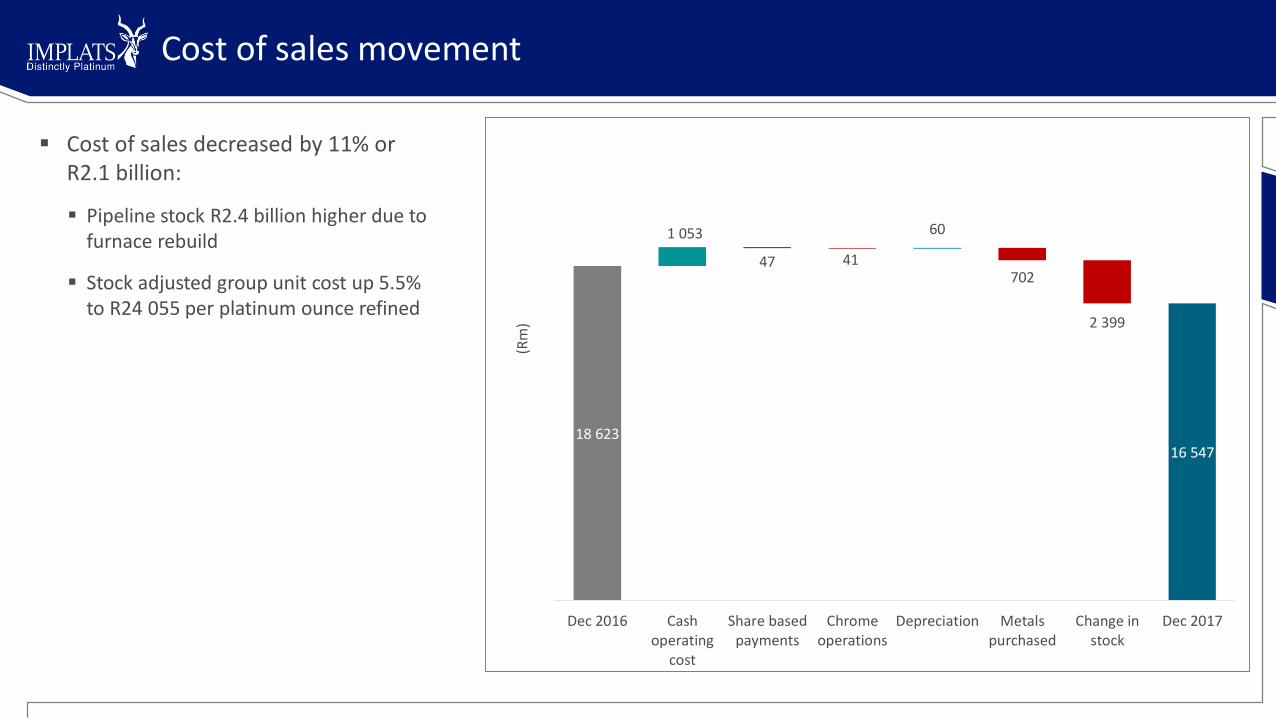
▪ Cost of sales decreased by 11% or R2.1 billion:
▪ Pipeline stock R2.4 billion higher due to furnace rebuild
▪ Stock adjusted group unit cost up 5.5% to R24 055 per platinum ounce refined
18 623 18 62319 629 19 588 19 588 18 946
16 547 16 547
47 41702
2 399
1 053 60
Dec 2016 Cashoperating
cost
Share basedpayments
Chromeoperations
Depreciation Metalspurchased
Change instock
Dec 2017
(Rm
)
Headline earnings movement
(Rm
)
(508)
(150)
872
(155)
(355)
116
(325)
205
Dec 2016 Gross profit Insurance -H1 2016
Fair value -IRS metalcreditors
Net foreignexchange gain
Taxation Other Dec 2017
(Rm
)
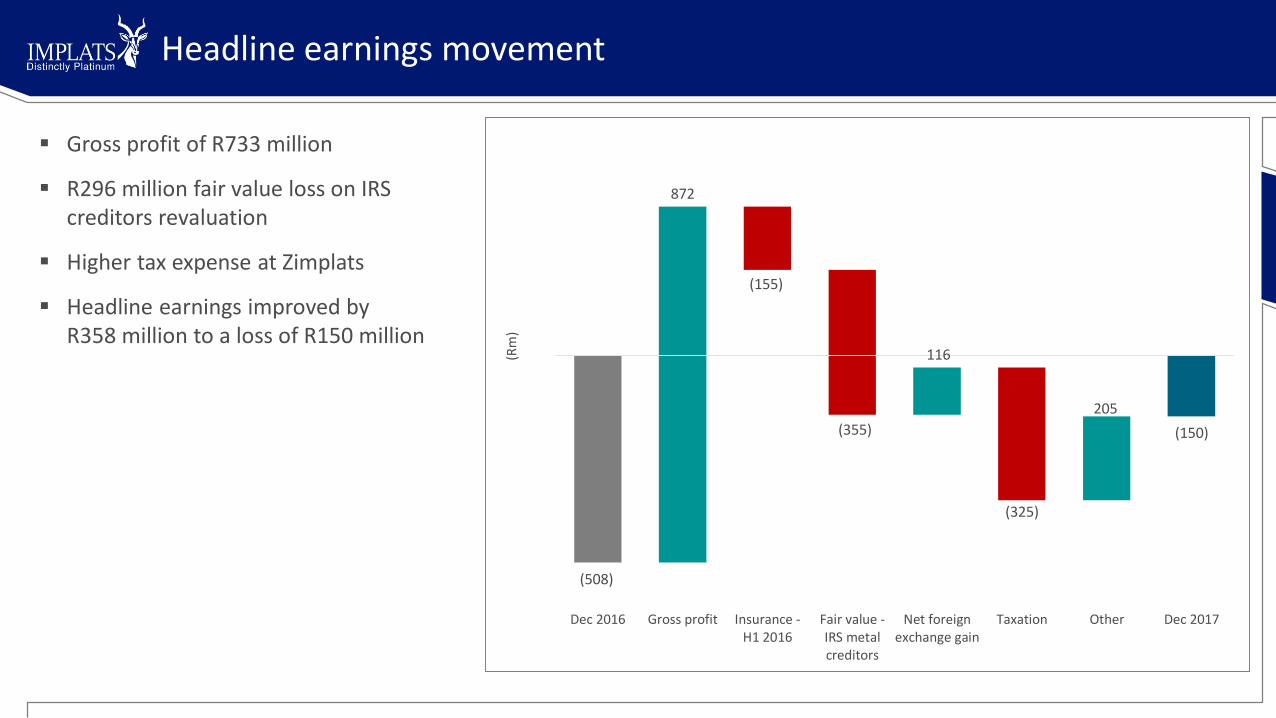
▪ Gross profit of R733 million
▪ R296 million fair value loss on IRS creditors revaluation
▪ Higher tax expense at Zimplats
▪ Headline earnings improved by R358 million to a loss of R150 million

Headline earnings by company
▪ Impala: gross margin at -17% , impacted by high stock levels
▪ IRS made a headline profit of R725 million utilising the spare capacity at Impala
(Rm
)
(150)
19
67
119
725
51
(1 066)
(65)
Impala Marula Zimplats Mimosa Two Rivers IRS Other Dec 2017
(Rm
)

Cash flow
R million Dec-2017 Dec-2016 Difference
Total cash used in operating activities (1 138) (146) (922)
Cash generated from operations 2 919 1 997 922
Inventory (3 464) (1 240) (2 224)
Other working capital, tax and finance cost (593) (903) 310
Cash used in investing activities: (1 995) (1 260) (735)
Purchase of property, plant and equipment (1 903) (1 595) (308)
Waterberg investment (408) - (408)
Finance income 316 335 (19)
Cash (used)/from financing activities (412) 89 (501)
Morokotso trust - 479 (479)
Borrowing repayments and other (412) (390) (22)
Net decrease in cash (3 545) (1 317) (2 228)
▪ Cash outflow of R3.5 billion for inventory inclusive of temporary build-up in the pipeline of R2.5 billion
▪ Total capital expenditure on PPE ofR1.9 billion
▪ Acquired a 15% stake in the Waterberg project for R408 million
Net debt
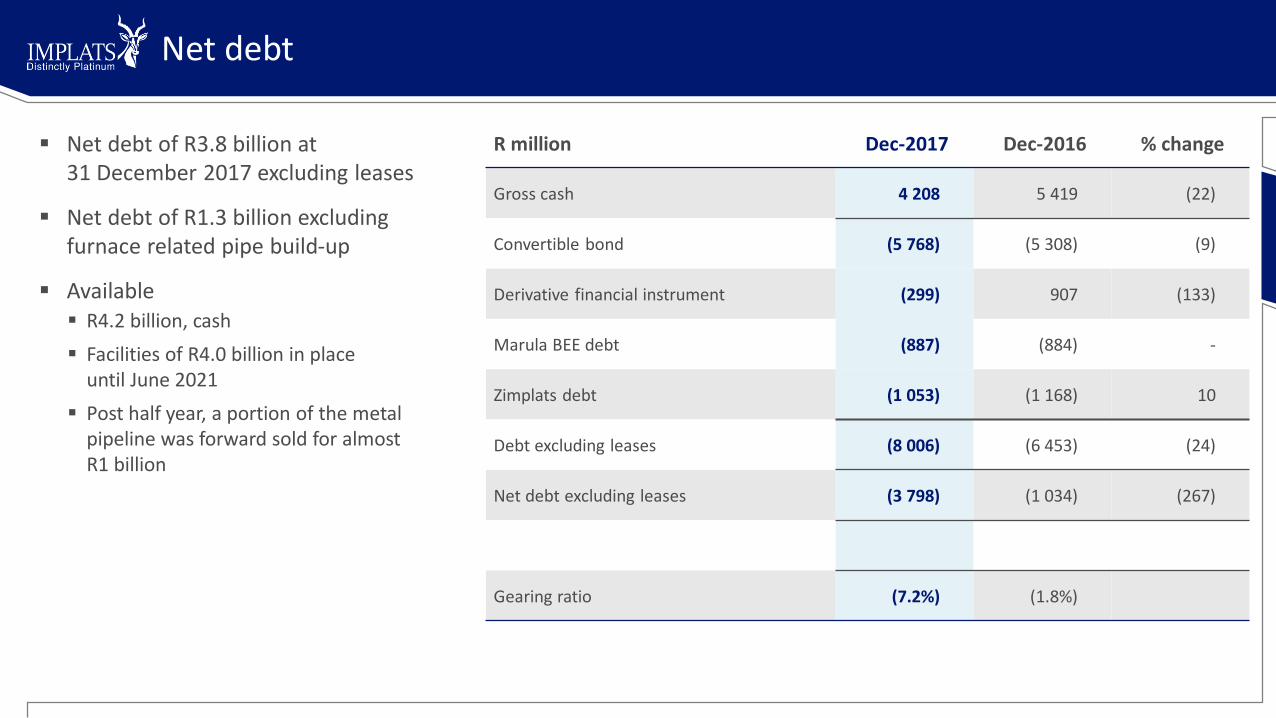
▪ Net debt of R3.8 billion at31 December 2017 excluding leases
▪ Net debt of R1.3 billion excluding furnace related pipe build-up
▪ Available▪ R4.2 billion, cash
▪ Facilities of R4.0 billion in placeuntil June 2021
▪ Post half year, a portion of the metal pipeline was forward sold for almost R1 billion
R million Dec-2017 Dec-2016 % change
Gross cash 4 208 5 419 (22)
Convertible bond (5 768) (5 308) (9)
Derivative financial instrument (299) 907 (133)
Marula BEE debt (887) (884) -
Zimplats debt (1 053) (1 168) 10
Debt excluding leases (8 006) (6 453) (24)
Net debt excluding leases (3 798) (1 034) (267)
Gearing ratio (7.2%) (1.8%)

MARKET REVIEWPaul Finney, Group Executive – Refining and Marketing
Overview
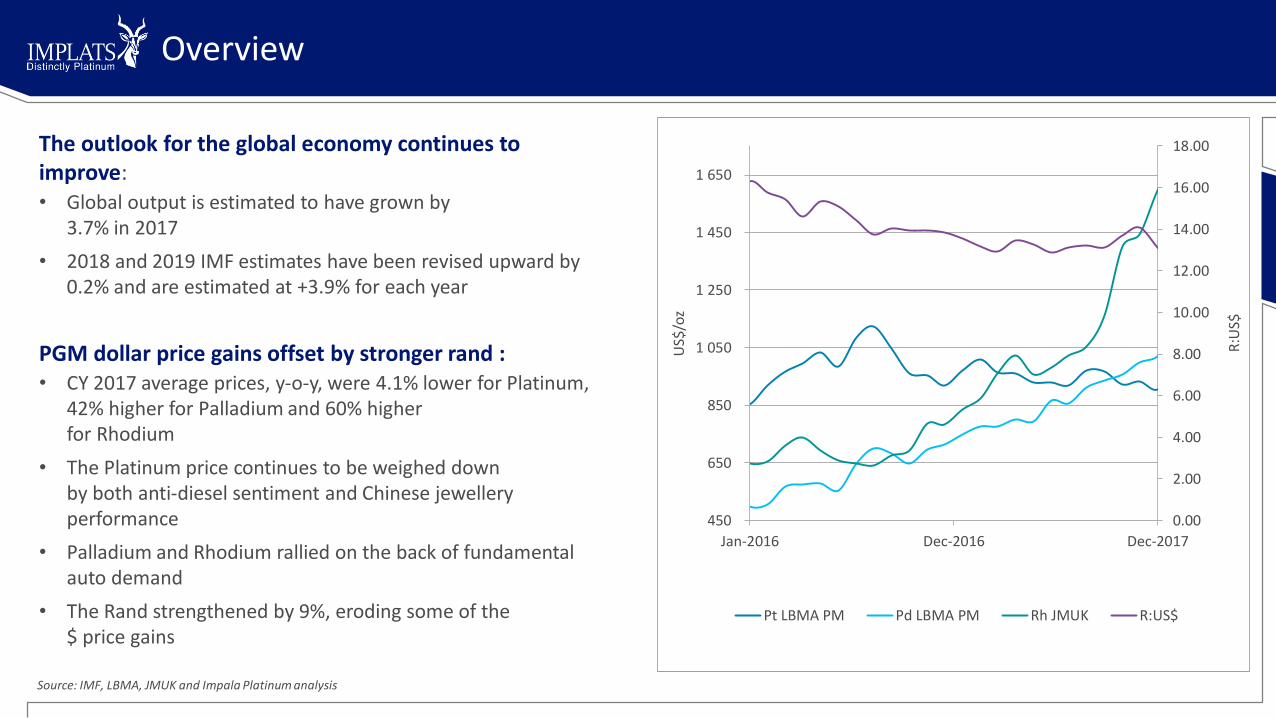
The outlook for the global economy continues to improve:• Global output is estimated to have grown by
3.7% in 2017
• 2018 and 2019 IMF estimates have been revised upward by 0.2% and are estimated at +3.9% for each year
PGM dollar price gains offset by stronger rand :• CY 2017 average prices, y-o-y, were 4.1% lower for Platinum,
42% higher for Palladium and 60% higherfor Rhodium
• The Platinum price continues to be weighed downby both anti-diesel sentiment and Chinese jewellery performance
• Palladium and Rhodium rallied on the back of fundamental auto demand
• The Rand strengthened by 9%, eroding some of the$ price gains
Source: IMF, LBMA, JMUK and Impala Platinum analysis
0.00
2.00
4.00
6.00
8.00
10.00
12.00
14.00
16.00
18.00
450
650
850
1 050
1 250
1 450
1 650
Jan-2016 Dec-2016 Dec-2017
R:U
S$
US$
/oz
Pt LBMA PM Pd LBMA PM Rh JMUK R:US$

Light-duty vehicle sales
2017: Strong auto sales growth at +2.4%
Growth primarily driven by the increases in:• China (+1.5%),
• Western Europe (+2.5%),
• Eastern Europe (+8.4%) and
• Latin America (+13.9%),
North America was down 1.9%, however,• More SUVs, crossovers and pickups sold
– a positive for Pd and Rh
Our 2018 global Light Duty sales forecast is further growth of 2%
World Light-duty vehicle sales by region – 2017 forecast
2016
(millions)
2017(est.)
(millions)
2017Growth
(%)
North America 17.51 17.18 (1.9)
Western Europe 13.95 14.30 2.5
China 24.38 24.74 1.5
Japan 4.97 5.23 5.3
Rest of the World 32.24 33.86 5.0
93.04 95.31 2.4
Source: Reuters , CAAM, LMC, Nikkei Sangyo and Impala Platinum analysis
Automotive Markets
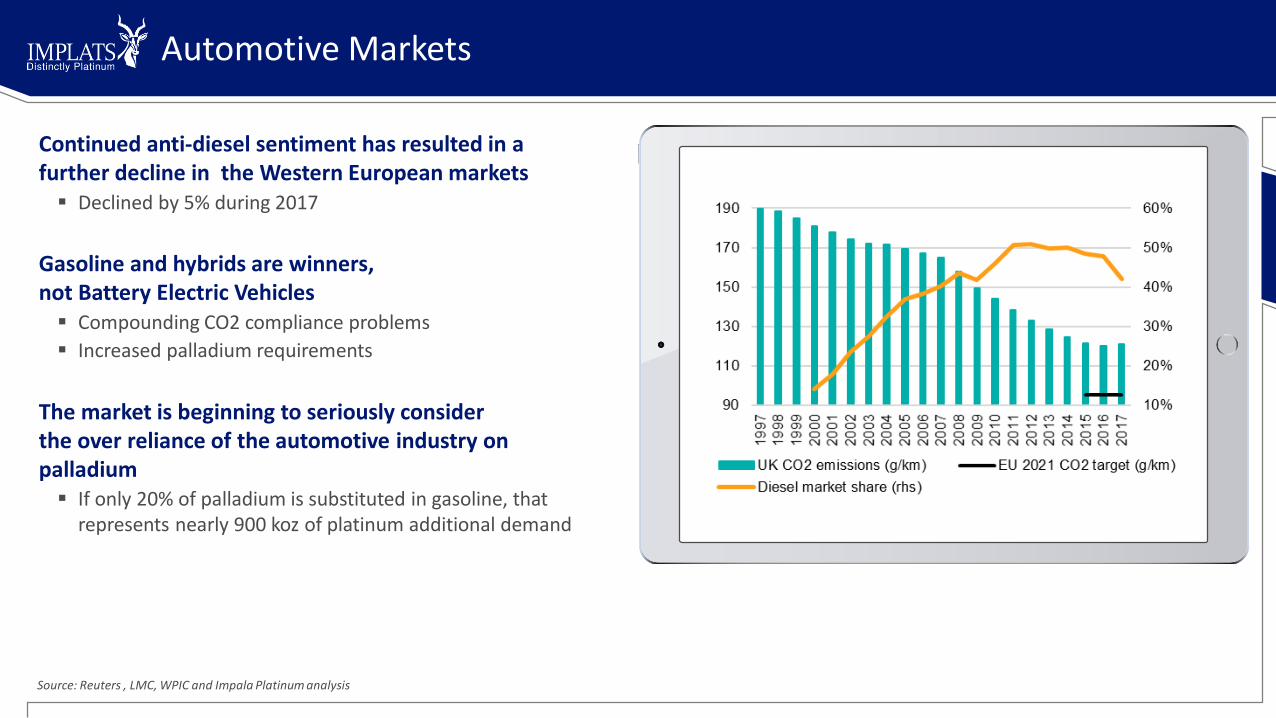
Continued anti-diesel sentiment has resulted in a further decline in the Western European markets ▪ Declined by 5% during 2017
Gasoline and hybrids are winners, not Battery Electric Vehicles ▪ Compounding CO2 compliance problems
▪ Increased palladium requirements
The market is beginning to seriously considerthe over reliance of the automotive industry on palladium▪ If only 20% of palladium is substituted in gasoline, that
represents nearly 900 koz of platinum additional demand
Source: Reuters , LMC, WPIC and Impala Platinum analysis
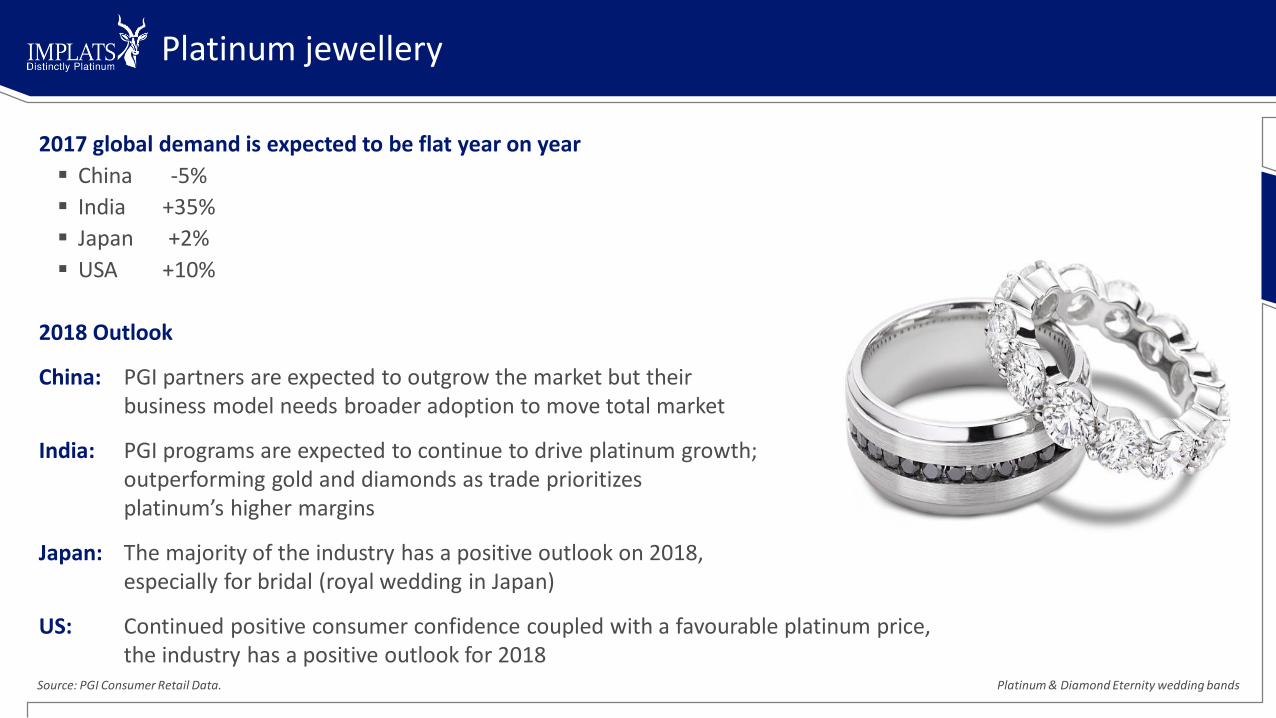
2017 global demand is expected to be flat year on year
▪ China -5%
▪ India +35%
▪ Japan +2%
▪ USA +10%
2018 Outlook
China: PGI partners are expected to outgrow the market but theirbusiness model needs broader adoption to move total market
India: PGI programs are expected to continue to drive platinum growth;outperforming gold and diamonds as trade prioritizesplatinum’s higher margins
Japan: The majority of the industry has a positive outlook on 2018,especially for bridal (royal wedding in Japan)
US: Continued positive consumer confidence coupled with a favourable platinum price,the industry has a positive outlook for 2018
Platinum jewellery
Source: PGI Consumer Retail Data. Platinum & Diamond Eternity wedding bands
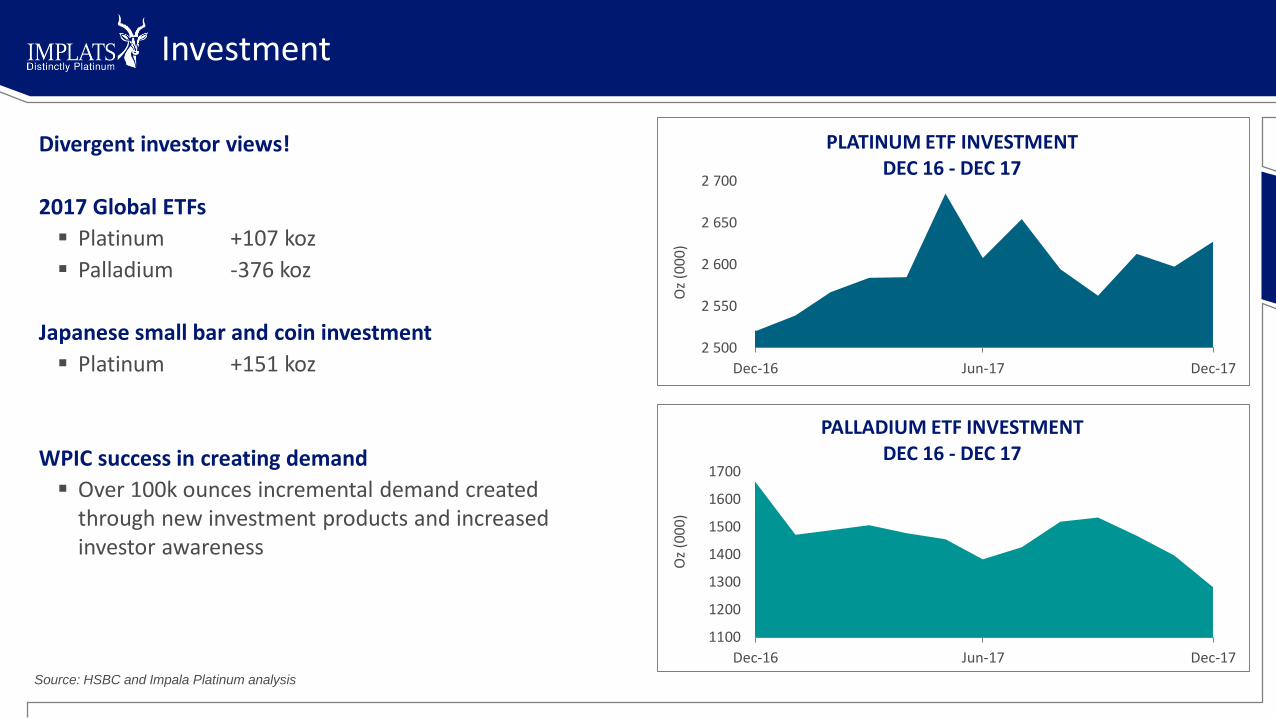
Investment
Divergent investor views!
2017 Global ETFs
▪ Platinum +107 koz
▪ Palladium -376 koz
Japanese small bar and coin investment
▪ Platinum +151 koz
WPIC success in creating demand
▪ Over 100k ounces incremental demand created through new investment products and increased investor awareness
Source: HSBC and Impala Platinum analysis
2 500
2 550
2 600
2 650
2 700
Dec-16 Jun-17 Dec-17
Oz
(000
)
PLATINUM ETF INVESTMENT DEC 16 - DEC 17
1100
1200
1300
1400
1500
1600
1700
Dec-16 Jun-17 Dec-17
Oz
(000
)
PALLADIUM ETF INVESTMENT DEC 16 - DEC 17
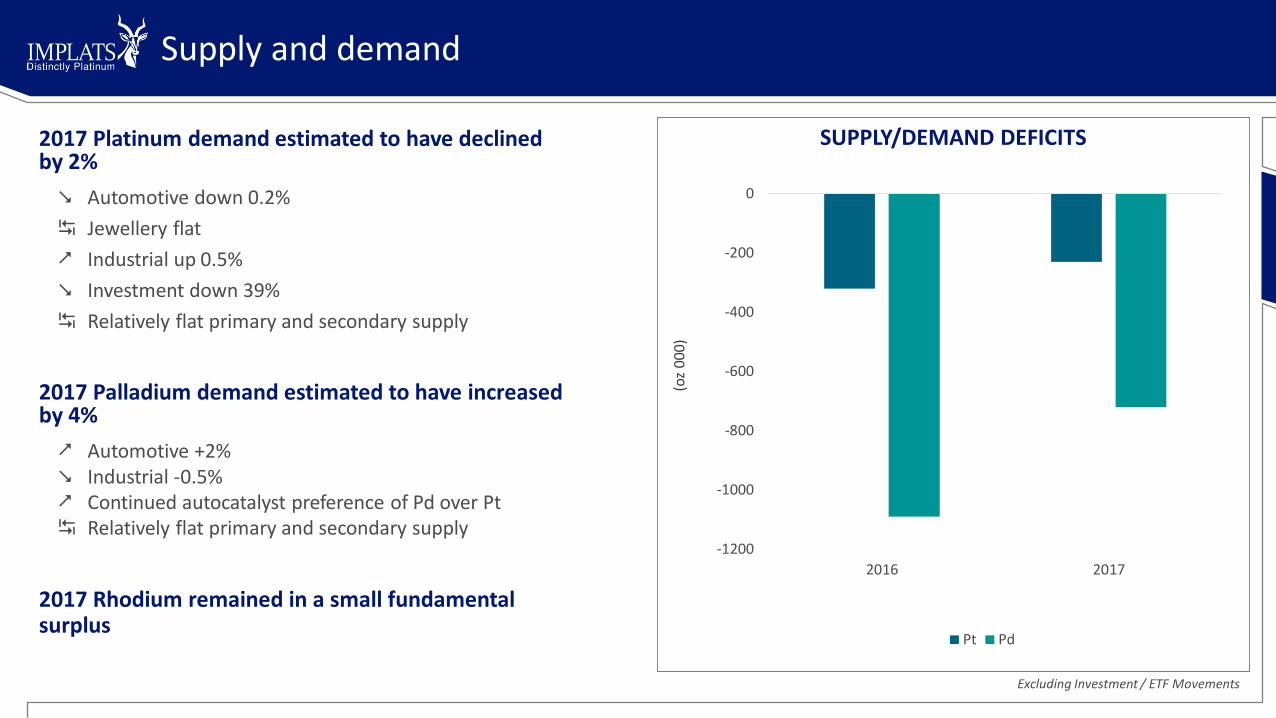
Supply and demand
2017 Platinum demand estimated to have declinedby 2%
Automotive down 0.2%
Jewellery flat
Industrial up 0.5%
Investment down 39%
Relatively flat primary and secondary supply
2017 Palladium demand estimated to have increased by 4%
Automotive +2% Industrial -0.5% Continued autocatalyst preference of Pd over Pt Relatively flat primary and secondary supply
2017 Rhodium remained in a small fundamental surplus
-1200
-1000
-800
-600
-400
-200
0
2016 2017
Pt Pd
(oz
000)
SUPPLY/DEMAND DEFICITS
Excluding Investment / ETF Movements

Palladium and rhodium market fundamentals to remain sound during 2018
▪ Palladium and rhodium automotive demand will remain healthy, driven by both strong vehicle sales and tightening emissions legislation
Whilst we see a relatively balanced platinum market for 2018, the medium term fundamentals for platinum are healthy
▪ Back-substitution into gasoline systems as palladium deficits continue
▪ Potential increase in the use of lean NOx traps in diesel systems for real driving emissions testing
▪ Increased usage in heavy-duty vehicles as new legislation in China and India is enacted
▪ Stabilising platinum jewellery market
▪ Steady industrial demand growth in line with global GDP
The PGM market outlook
CONCLUSION and OUTLOOKNico Muller, CEO
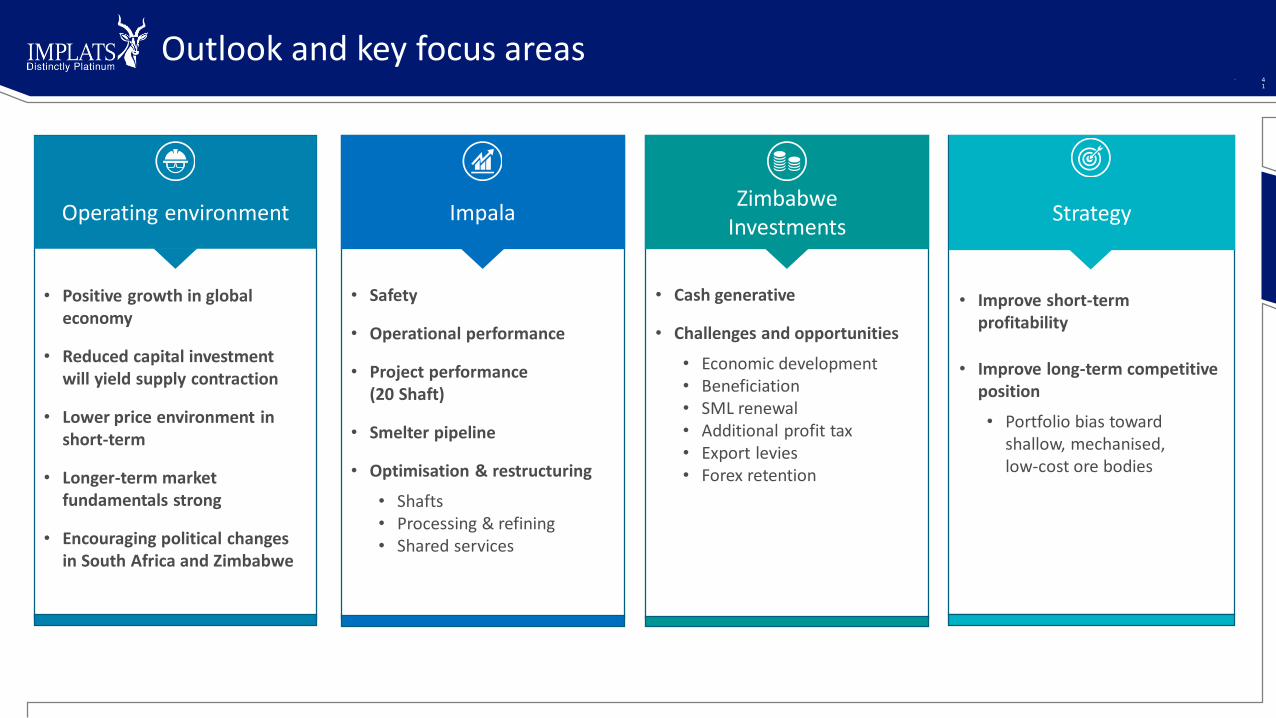
Outlook and key focus areas• 4
1
• Improve short-term profitability
• Improve long-term competitive position
• Portfolio bias toward shallow, mechanised,low-cost ore bodies
Strategy
• Cash generative
• Challenges and opportunities
• Economic development• Beneficiation• SML renewal• Additional profit tax• Export levies• Forex retention
ZimbabweInvestments
Impala
• Positive growth in global economy
• Reduced capital investment will yield supply contraction
• Lower price environment in short-term
• Longer-term market fundamentals strong
• Encouraging political changes in South Africa and Zimbabwe
Operating environment
• Safety
• Operational performance
• Project performance (20 Shaft)
• Smelter pipeline
• Optimisation & restructuring
• Shafts• Processing & refining• Shared services
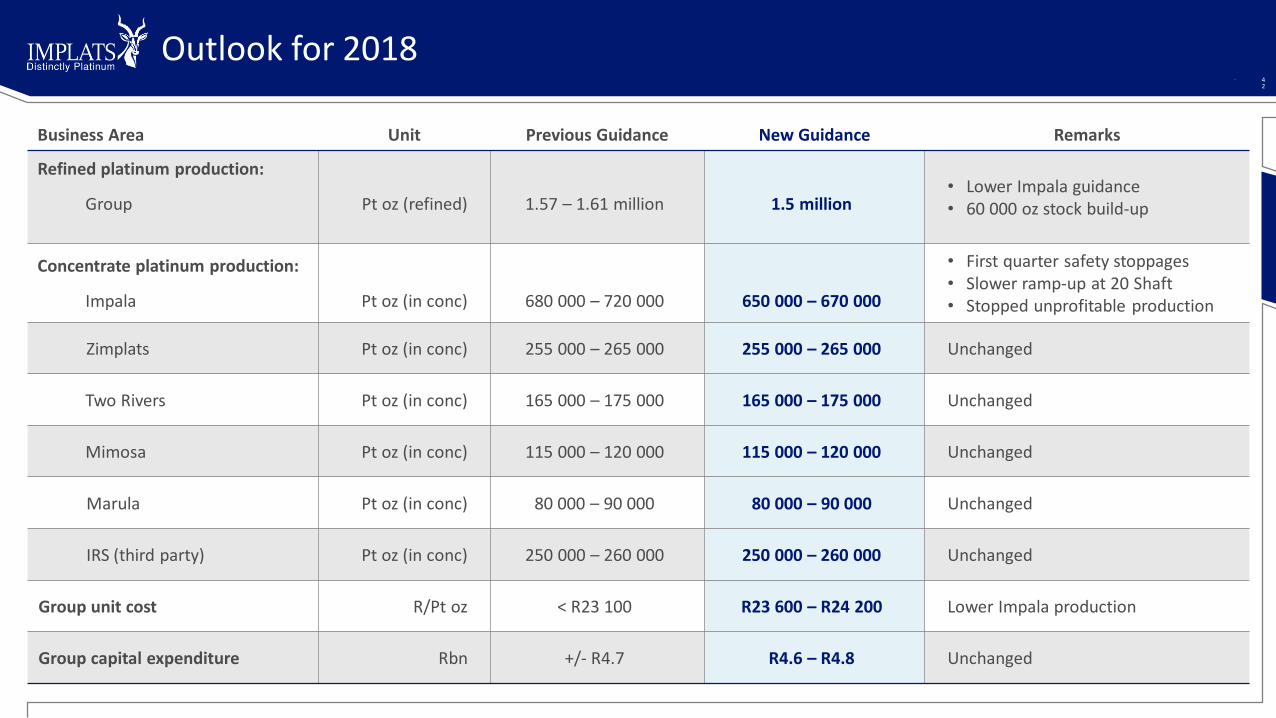
Business Area Unit Previous Guidance New Guidance Remarks
Refined platinum production:
Group Pt oz (refined) 1.57 – 1.61 million 1.5 million• Lower Impala guidance• 60 000 oz stock build-up
Concentrate platinum production:
Impala Pt oz (in conc) 680 000 – 720 000 650 000 – 670 000
• First quarter safety stoppages• Slower ramp-up at 20 Shaft• Stopped unprofitable production
Zimplats Pt oz (in conc) 255 000 – 265 000 255 000 – 265 000 Unchanged
Two Rivers Pt oz (in conc) 165 000 – 175 000 165 000 – 175 000 Unchanged
Mimosa Pt oz (in conc) 115 000 – 120 000 115 000 – 120 000 Unchanged
Marula Pt oz (in conc) 80 000 – 90 000 80 000 – 90 000 Unchanged
IRS (third party) Pt oz (in conc) 250 000 – 260 000 250 000 – 260 000 Unchanged
Group unit cost R/Pt oz < R23 100 R23 600 – R24 200 Lower Impala production
Group capital expenditure Rbn +/- R4.7 R4.6 – R4.8 Unchanged
Outlook for 2018• 4
2

Impala Platinum Holdings LimitedInterim results1 March 2018