Embed Size (px)
Citation preview
Imperial County Cross-Border Survey
Report
Prepared for:
Southern California Association of
Governments 818 7th Street, 12th Floor Los Angeles, CA 90017
Imperial Valley Association of Governments
940 W. Main Street, Suite 208 El Centro, CA 92243
Prepared by: Rea & Parker Research
San Diego, California 92142 858-279-5070
www.rea-parker.com
June, 2007
Imperial County Cross-Border Survey Rea & Parker Research Southern California Association of Governments June, 2007
ii
Table of Contents Page Acknowledgements iii List of Tables iv List of Charts v List of Maps vii Report Summary viii Introduction 1 Methodology 3 Border Crossing Counts 4 Survey Sample 7 Geocoding of SCAG Region Origin/Destination Locations 9 Survey Respondent Characteristics 11 Cross-Border Travel Behavior & Characteristics 15 Mexicali/Calexico Downtown 17 Passenger Vehicles 17 Pedestrians 28 Calexico-East: Northbound Passenger Vehicles 41 Algodones 47 Northbound Passenger Vehicles 47 Pedestrians 52 Calexico-East: Commercial Trucks 62 Appendix 89 Surveyor/Counter Positions Schedule of Surveyor/Counter Assignments Survey Instruments Counts in 15 Minute Intervals
Imperial County Cross-Border Survey Rea & Parker Research Southern California Association of Governments June, 2007
iii
Acknowledgements
Rea & Parker Research wishes to take this opportunity to acknowledge and thank those agencies
and general governments in Mexico and in the United States that have so generously contributed
their time, counsel, and invaluable support to this project.
These agencies and general governments include the following:
Southern California Association of Governments
Imperial Valley Association of Governments
State of California Department of Transportation
County of Imperial
City of Calexico
United States General Services Administration
United States Department of Homeland Security—Customs and Border Protection
Instituto de Administracion y Avaluos de Bienes Nacionales (Mexico)
Ayuntamiento de Mexicali—Relaciones Internacionales (Mexico)
Instituto Municipal de Investigacion y Planeacion Urbana de Mexicali (Municipality of
Mexicali)
Aduana Mexicana (Mexican Customs)
Quechan Tribe of the Fort Yuma-Quechan Reservation
Imperial County Cross-Border Survey Rea & Parker Research Southern California Association of Governments June, 2007
iv
List of Tables
Table Page 1—Imperial County Daily Border Crossing Counts 4 2—Comparison of Rea & Parker Research Cross Border Northbound Counts to March 2006 Customs and Border Protection Counts 7 3—Distribution of Completed Surveys by Location, Direction, and Mode of Transportation 8 4—Distribution of Completed Surveys by Survey Location 8 5—Distribution of Completed Surveys by Mode of Transportation 9 6—Total Trips Geocoded 10 7—Northbound Passenger Vehicles—Vehicle Type and Passenger Demographics 11 8—Southbound Passenger Vehicles—Vehicle Type and Passenger Demographics 12 9—Mexicali/Calexico Downtown—Pedestrian Residence 14 10—Algodones—Pedestrian Residence 14 11—Surveyed Truck Types—Calexico East 15 12—Estimated Number of Passenger Vehicles Traveling on Imperial County Roads as a Part of Northbound Vehicle Trip across Border at Mexicali/Calexico Downtown 27 13—Estimated Number of Passenger Vehicles Traveling on Imperial County Roads as a Part of Northbound Vehicle Trip across Border at Calexico East 46 14--Estimated Number of Commercial Trucks Traveling on Major Regional Roads as a Part of Trip across Border at Calexico East 88
Imperial County Cross-Border Survey Rea & Parker Research Southern California Association of Governments June, 2007
v
List of Charts Chart Page Mexicali/Calexico Downtown Passenger Vehicles 1—Trip Purpose—Northbound 17 2—Occupation of Commuters to/from Work 18 3—Trip Purpose-Southbound 19 4—Occupation of Commuters to/from Work 19 5—Origin-Destination (Northbound and Southbound Weekday—Northbound Weekend) 20 6—U.S. City of Destination—Northbound 21 7—City of Origin—Southbound 22 8—Trip Frequency—Northbound 25 9—Trip Frequency—Southbound 25 10—Major Roads Used—Northbound 26 11—Major Roads Used—Southbound 26 Mexicali/Calexico Downtown Pedestrians 12—Trip Purpose—Northbound 28 13—Trip Purpose—Southbound 29 14—Occupation of Commuters to/from Work—Northbound 30 15—Occupation of Commuters to/from Work—Southbound 30 16—Origin-Destination—Northbound 31 17—Origin-Destination—Southbound 31 18—U.S. City Destinations—Northbound 32 19—U.S. City of Origin—Southbound 35 20—Trip Frequency—Northbound 35 21—Trip Frequency—Southbound 36 22—Length of Stay—Northbound 37 23—Length of Stay—Southbound 37 24—Mode of Transportation to Border—Northbound 38 25—Mode of Transportation to Border—Southbound 39 26—Mode of Transportation from Border—Northbound 39 27—Mode of Transportation from Border—Southbound 40 Calexico East—Northbound Passenger Vehicles 28—Trip Purpose 42 29—Occupation of Commuters to/from Work 42 30—Origin-Destination 43 31—U.S. City of Destination 43 32—Trip Frequency 45 33—Major Roads Used 46 Algodones—Northbound Passenger Vehicles 34—Trip Purpose 48 35—Origin-Destination 48 36—Mexican City/Region of Origin 49 37—U.S. State of Trip Destination 50 38—U.S. City of Destination 50 39—Trip Frequency 51
Imperial County Cross-Border Survey Rea & Parker Research Southern California Association of Governments June, 2007
vi
Algodones—Pedestrians 40—Trip Purpose—Northbound and Southbound 52 41—Origin-Destination—Northbound 53 42—Origin-Destination—Southbound 53 43—U.S. State of Origin—Southbound 54 44—U.S. City of Origin—Southbound 55 45—U.S. State of Destination—Northbound 55 46—U.S. City of Destination—Southbound 56 47—Trip Frequency—Northbound 57 48—Trip Frequency—Southbound 58 49—Length of Stay—Northbound 58 50—Length of Stay—Southbound 59 51—Mode of Transportation to Border—Northbound 60 52—Mode of Transportation to Border—Southbound 60 53—Mode of Transportation from Border—Northbound 61 54—Mode of Transportation from Border—Southbound 61 Calexico East—Commercial Trucks 55—Where Picked Up Cargo—Northbound 63 56—Where Picked Up Cargo—Southbound 64 57—Mexican City/Region Where Cargo Picked Up—Northbound 64 58—U.S. City Where Cargo Picked Up—Southbound 65 59—Where Cargo Originated—Northbound 67 60—Mexican City/Region Where Cargo Originated—Northbound 67 61—Where Cargo Originated—Southbound 68 62—U.S. City Where Cargo Originated—Southbound 69 63—Empty Northbound Trucks: Where Empty Trip Started 69 64—Empty Southbound Trucks: Where Empty Trip Started 70 65—U.S. City Where Empty Trip Started—Southbound 70 66—Empty Northbound Trucks: Where Cargo to be Picked Up 73 67—U.S. City Where Cargo to be Picked Up by Empty Northbound Trucks 74 68—Empty Southbound Trucks: Where Cargo to be Picked Up 74 69—Mexican City/Region Where Cargo to be Picked Up by Empty Southbound Trucks 76 70—Where Cargo to be Dropped Off—Northbound 77 71—U.S. City Where Cargo to be Dropped Off—Northbound 77 72—Where Cargo to be Dropped Off—Southbound 79 73—Percentage of Northbound Trucks with Cargo that Continues Beyond Drop-Off 80 74—Percentage of Southbound Trucks with Cargo that Continues Beyond Drop-Off 80 75—Percentage of Northbound Trucks that Change Drivers at Border 81 76— Percentage of Northbound Trucks that Change Drivers at Border 82 77—Percentage of Northbound Trucks that Process Papers at Border 82 78—Percentage of Southbound Trucks that Process Papers at Border 83 79—Type Of Cargo—Northbound 84 80—Type of Cargo—Southbound 84 81—Trip Frequency—Northbound 85 82—Trip Frequency—Southbound 86 83—Major Roads Used—Northbound 86 84—Major Roads Used—Southbound 87
Imperial County Cross-Border Survey Rea & Parker Research Southern California Association of Governments June, 2007
vii
List of Maps of Geocoded Survey Results
Map Page 1—Imperial County Study Area 2 2—Mexicali/Calexico Downtown Northbound Passenger Vehicles —U.S. Destinations 23 3—Mexicali/Calexico Downtown Southbound Passenger Vehicles— U.S. Origins 24 4—Mexicali/Calexico Downtown Northbound Pedestrians —U.S. Destinations 33 5—Mexicali/Calexico Downtown Southbound Pedestrians— U.S. Origins 34 6—Calexico East Northbound Passenger Vehicles —U.S. Destinations 44 7—Calexico East Southbound Commercial Trucks —U.S. Cargo Pick-up 66 8—Calexico East Southbound Commercial Trucks —U.S. Cargo Origin 71 9—Calexico East Empty Southbound Commercial Trucks —U.S. Start 72 10—Calexico East Empty Northbound Commercial Trucks —U.S. Cargo Pick-up 75 11—Calexico East Northbound Commercial Trucks —U.S. Cargo Drop-off 78
Imperial County Cross-Border Survey Rea & Parker Research Southern California Association of Governments June, 2007
viii
Report Summary
Study Purpose and Need
The Imperial County Transportation Model was jointly developed by Imperial County, the Southern California Association of Governments (SCAG), and CALTRANS. This model is being updated by CALTRANS and the Imperial Valley Association of Governments (IVAG), a critical component of which is travel across the international border between the United States and Mexico. Rea & Parker Research was chosen to provide consultative assistance to this endeavor and to develop a survey database of cross-border travel on weekdays and weekends by pedestrians, passenger vehicles, and commercial trucks. This database included the following cross-border characteristics, among others:
Trip origin/destination (including geocoded SCAG region locations) Trip purpose Travel Route Vehicle Type Trip Frequency Traveler Characteristics
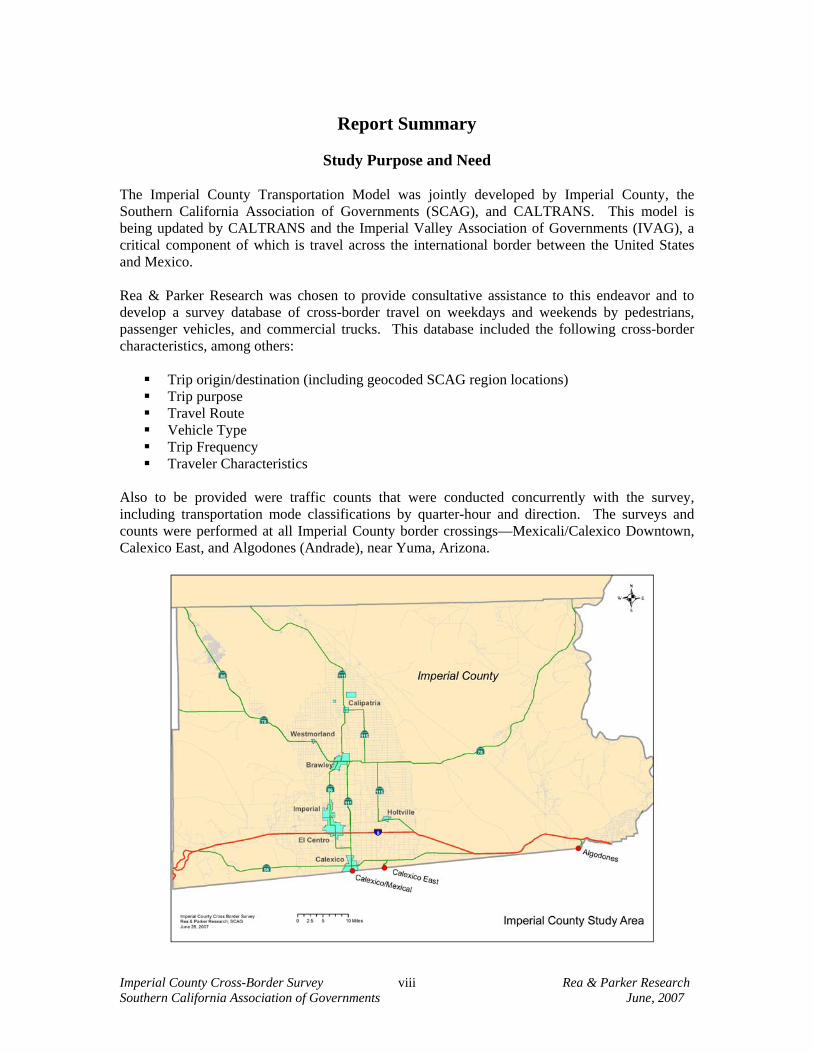
Also to be provided were traffic counts that were conducted concurrently with the survey, including transportation mode classifications by quarter-hour and direction. The surveys and counts were performed at all Imperial County border crossings—Mexicali/Calexico Downtown, Calexico East, and Algodones (Andrade), near Yuma, Arizona.
Imperial County Cross-Border Survey Rea & Parker Research Southern California Association of Governments June, 2007
ix
Study Methods
Surveys and counts were performed on selected weekdays and weekend days between February 25, 2007 and March 11, 2007. Counts were made for passenger vehicles, pedestrians, trucks, and buses northbound and southbound. Pedestrian surveys were administered northbound and southbound at Mexicali/Calexico Downtown and Algodones by interviewers who interviewed stopped vehicles passengers and pedestrians as they approached or just completed crossing the border. There were separate personnel assigned to count and to survey at each site. Truck surveys were administered northbound and southbound at Calexico East. Surveys were administered to passenger vehicles northbound and southbound at Mexicali/Calexico Downtown and northbound only at Calexico East and Algodones. The southbound surveys at Mexicali/Calexico Downtown were limited to rush hour periods and times when CALTRANS personnel could otherwise stop traffic. For other times at Mexicali/Calexico Downtown and at the other two crossings, southbound traffic moves unimpeded, making it impossible to obtain intercept surveys. Completed surveys were input into the Statistical Package for the Social Sciences (SPSS version 13.0) and analyzed. Counts, made in 15 minute intervals, were input into Microsoft Excel and tallied. Survey Sample
A total of 5,282 surveys are included in this analysis—the distribution between weekday and weekend surveys is approximately equal.
The majority (58 percent) of surveys was obtained at the Mexicali/Calexico Downtown border crossing (n=3,043), with the other two sites dividing the remainder approximately in half.
Passenger vehicle surveys (n=2,918) represented 55 percent of all surveys completed, with another 36 percent (n=1,873) having been obtained from pedestrians and 9 percent (n=491) from commercial trucks.
Completed surveys were weighted to reflect the distribution of counts in 15 minute intervals so that the analysis that follows is proportionately representative of the population of border crossers in direct relationship to the times that they cross the border.
Cross Border Counts The Mexicali/Calexico Downtown border crossing is the core of the Imperial County-Baja California trans-border interaction. Calexico East also has a significant passenger vehicle component along with its being the commercial cross border hub of the region, and Algodones experiences a large number of pedestrians moving back and forth across its border. There are complexities in the movement back and forth, shifting the symmetry of travel from being all within one day and one crossing to a network of cross border travel that involves different crossings and different days for the two directions of movement.
In total, for all three border crossings, there were 24,289 northbound weekday passenger vehicles counted (58 percent at Mexicali/Calexico Downtown) and 27,921 southbound vehicles counted (76 percent at Mexicali/Calexico Downtown).
Imperial County Cross-Border Survey Rea & Parker Research Southern California Association of Governments June, 2007
x
Total weekend northbound passenger vehicles at all three crossings on weekends were 25,203, with 23,698 southbound. The Mexicali/Calexico Downtown share of passenger vehicles on weekends was 57 percent northbound and 65 percent southbound.
As for pedestrian crossings, northbound weekdays totaled 23,278 (75 percent at Mexicali/Calexico Downtown). Southbound, there were 18,643 pedestrian crossings (72 percent Mexicali/Calexico Downtown).
Weekend pedestrian crossings were 23,584 northbound (76 percent at Mexicali/Calexico Downtown) and 17,937 southbound (72 percent at Mexicali/Calexico Downtown).
Truck crossings on the weekday at Calexico East totaled 1,071 northbound and 1,093 southbound. On weekends, these totals dropped by more than 50 percent to 404 northbound and 500 southbound.
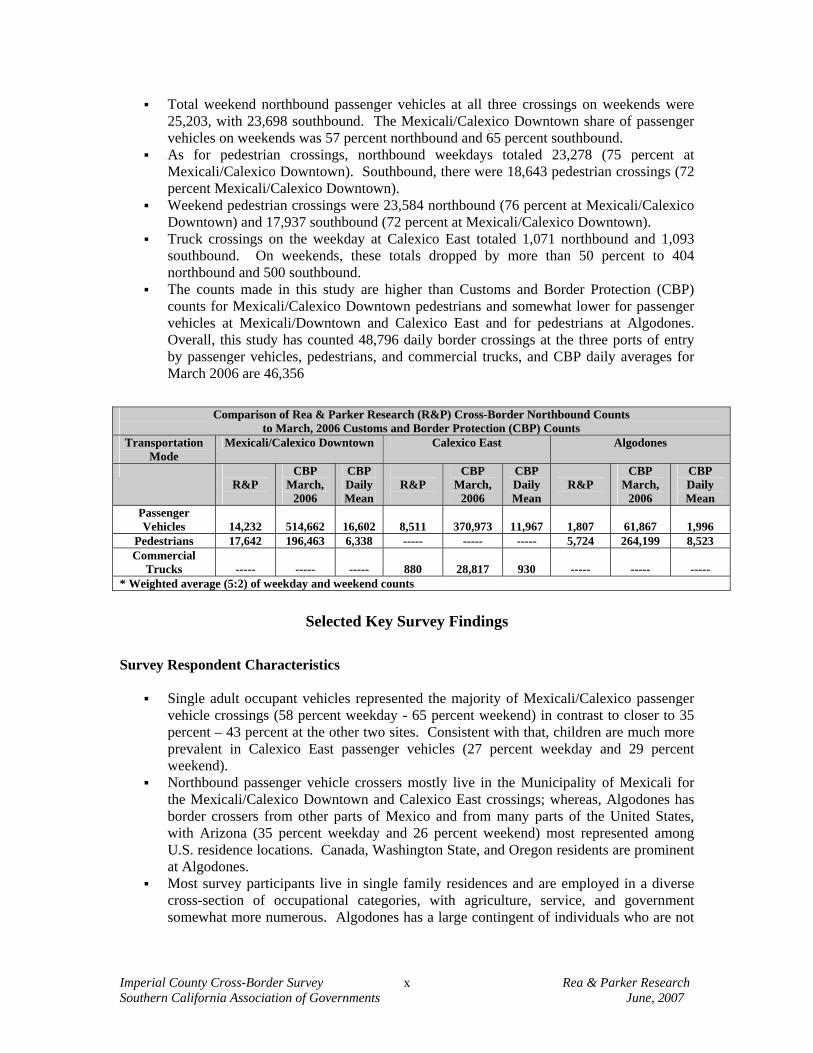
The counts made in this study are higher than Customs and Border Protection (CBP) counts for Mexicali/Calexico Downtown pedestrians and somewhat lower for passenger vehicles at Mexicali/Downtown and Calexico East and for pedestrians at Algodones. Overall, this study has counted 48,796 daily border crossings at the three ports of entry by passenger vehicles, pedestrians, and commercial trucks, and CBP daily averages for March 2006 are 46,356
Comparison of Rea & Parker Research (R&P) Cross-Border Northbound Counts
to March, 2006 Customs and Border Protection (CBP) Counts Transportation
Mode Mexicali/Calexico Downtown Calexico East Algodones
R&P
CBP March,
2006
CBP Daily Mean
R&P
CBP March,
2006
CBP Daily Mean
R&P
CBP March,
2006
CBP Daily Mean
Passenger Vehicles
14,232
514,662
16,602
8,511
370,973
11,967
1,807
61,867
1,996
Pedestrians 17,642 196,463 6,338 ----- ----- ----- 5,724 264,199 8,523 Commercial
Trucks
-----
-----
-----
880
28,817
930
-----
-----
----- * Weighted average (5:2) of weekday and weekend counts
Selected Key Survey Findings Survey Respondent Characteristics
Single adult occupant vehicles represented the majority of Mexicali/Calexico passenger vehicle crossings (58 percent weekday - 65 percent weekend) in contrast to closer to 35 percent – 43 percent at the other two sites. Consistent with that, children are much more prevalent in Calexico East passenger vehicles (27 percent weekday and 29 percent weekend).
Northbound passenger vehicle crossers mostly live in the Municipality of Mexicali for the Mexicali/Calexico Downtown and Calexico East crossings; whereas, Algodones has border crossers from other parts of Mexico and from many parts of the United States, with Arizona (35 percent weekday and 26 percent weekend) most represented among U.S. residence locations. Canada, Washington State, and Oregon residents are prominent at Algodones.
Most survey participants live in single family residences and are employed in a diverse cross-section of occupational categories, with agriculture, service, and government somewhat more numerous. Algodones has a large contingent of individuals who are not
Imperial County Cross-Border Survey Rea & Parker Research Southern California Association of Governments June, 2007
xi
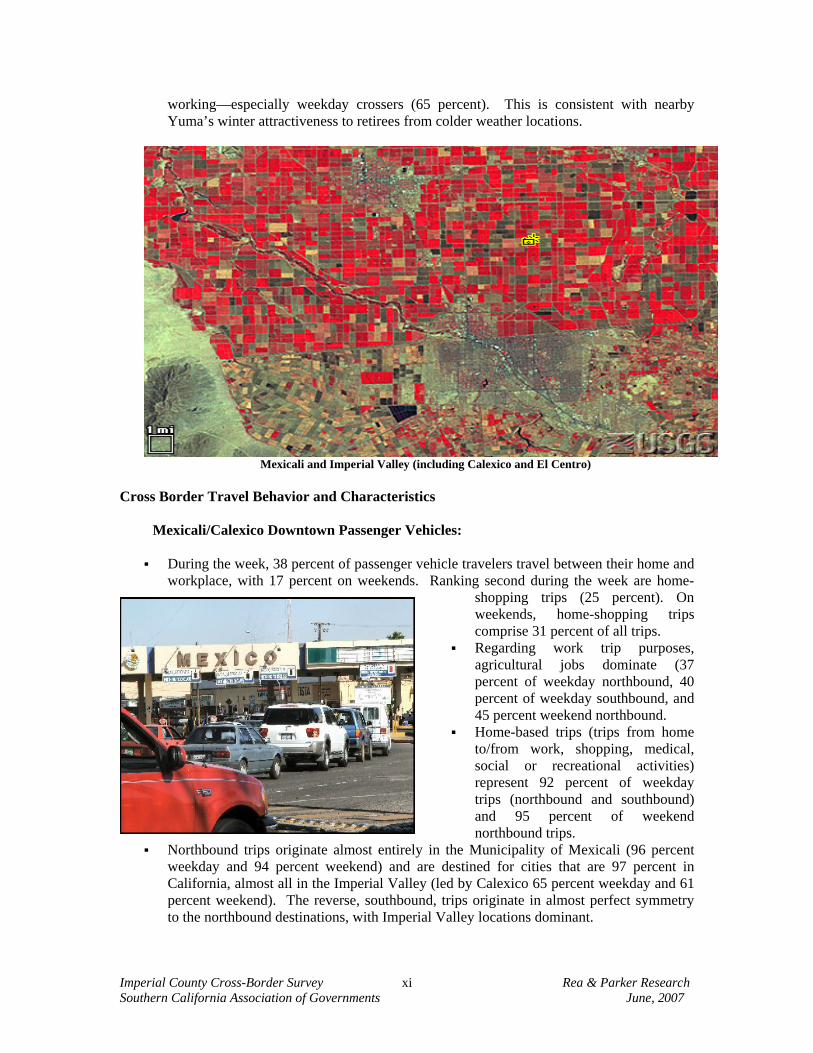
working—especially weekday crossers (65 percent). This is consistent with nearby Yuma’s winter attractiveness to retirees from colder weather locations.
Mexicali and Imperial Valley (including Calexico and El Centro) Cross Border Travel Behavior and Characteristics Mexicali/Calexico Downtown Passenger Vehicles:
During the week, 38 percent of passenger vehicle travelers travel between their home and workplace, with 17 percent on weekends. Ranking second during the week are home-
shopping trips (25 percent). On weekends, home-shopping trips comprise 31 percent of all trips.
Regarding work trip purposes, agricultural jobs dominate (37 percent of weekday northbound, 40 percent of weekday southbound, and 45 percent weekend northbound.
Home-based trips (trips from home to/from work, shopping, medical, social or recreational activities) represent 92 percent of weekday trips (northbound and southbound) and 95 percent of weekend northbound trips.
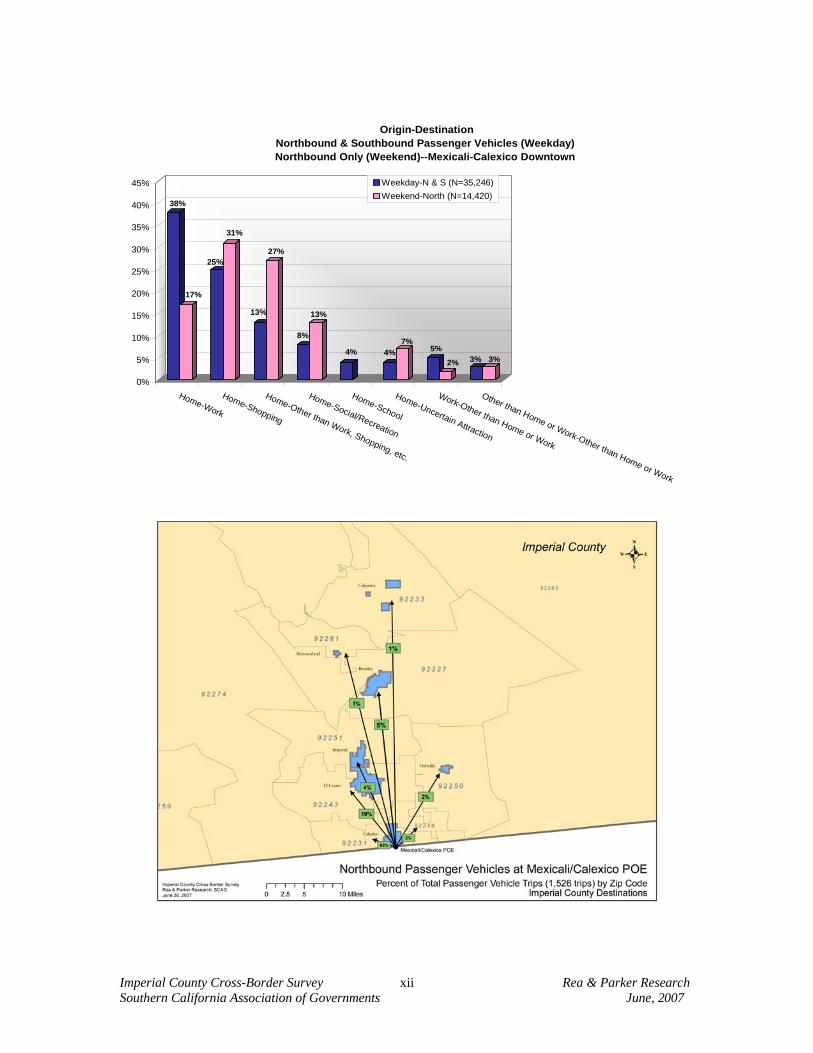
Northbound trips originate almost entirely in the Municipality of Mexicali (96 percent weekday and 94 percent weekend) and are destined for cities that are 97 percent in California, almost all in the Imperial Valley (led by Calexico 65 percent weekday and 61 percent weekend). The reverse, southbound, trips originate in almost perfect symmetry to the northbound destinations, with Imperial Valley locations dominant.
Imperial County Cross-Border Survey Rea & Parker Research Southern California Association of Governments June, 2007
xii
38%
17%
25%
31%
13%
27%
8%
13%
4% 4%7%
5%
2% 3% 3%
0%
5%
10%
15%
20%
25%
30%
35%
40%
45%
Home-Work
Home-Shopping
Home-Other than Work, Shopping, etc.
Home-Social/Recreation
Home-School
Home-Uncertain Attraction
Work-Other than Home or Work
Other than Home or Work-Other than Home or Work
Origin-DestinationNorthbound & Southbound Passenger Vehicles (Weekday)Northbound Only (Weekend)--Mexicali-Calexico Downtown
Weekday-N & S (N=35,246)Weekend-North (N=14,420)
Imperial County Cross-Border Survey Rea & Parker Research Southern California Association of Governments June, 2007
xiii
Approximately one-third (32 percent) of weekday southbound and 19 percent of weekday northbound passenger vehicles cross the border at least once daily. Weekly trips (averaging between 2.0 and 3.5 trips per week) are more commonplace—72 percent weekday northbound, 53 percent weekday southbound, and 75 percent weekend northbound.
State Route 111 plays a role in transporting approximately 90 percent of passenger vehicle border crossers at Mexicali/Calexico Downtown, with State Route 98 and Interstate 8 following in importance.
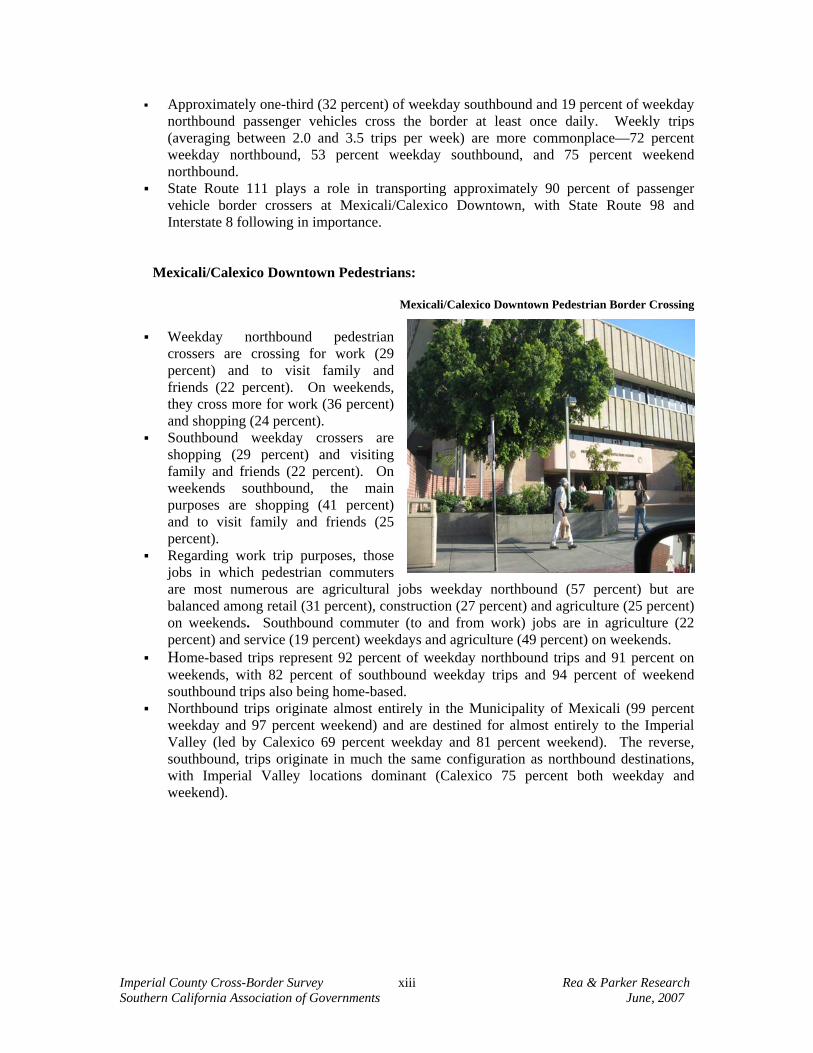
Mexicali/Calexico Downtown Pedestrians:
Mexicali/Calexico Downtown Pedestrian Border Crossing
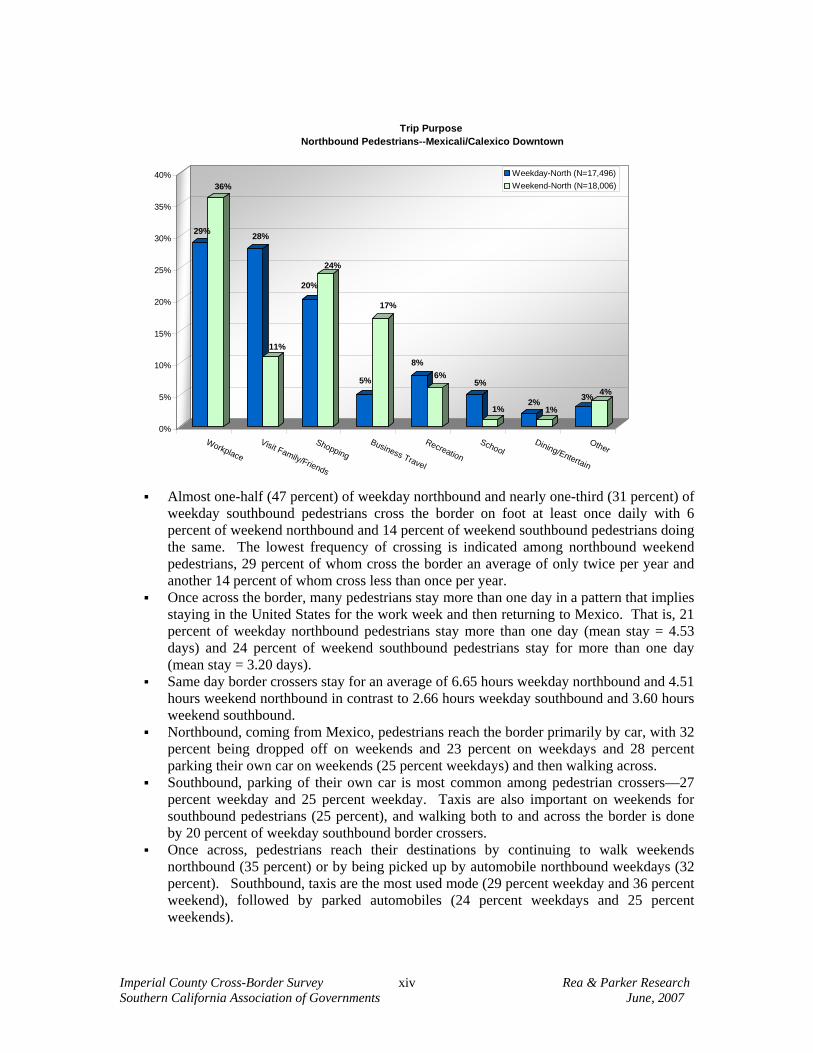
Weekday northbound pedestrian crossers are crossing for work (29 percent) and to visit family and friends (22 percent). On weekends, they cross more for work (36 percent) and shopping (24 percent).
Southbound weekday crossers are shopping (29 percent) and visiting family and friends (22 percent). On weekends southbound, the main purposes are shopping (41 percent) and to visit family and friends (25 percent).
Regarding work trip purposes, those jobs in which pedestrian commuters are most numerous are agricultural jobs weekday northbound (57 percent) but are balanced among retail (31 percent), construction (27 percent) and agriculture (25 percent) on weekends. Southbound commuter (to and from work) jobs are in agriculture (22 percent) and service (19 percent) weekdays and agriculture (49 percent) on weekends.
Home-based trips represent 92 percent of weekday northbound trips and 91 percent on weekends, with 82 percent of southbound weekday trips and 94 percent of weekend southbound trips also being home-based.
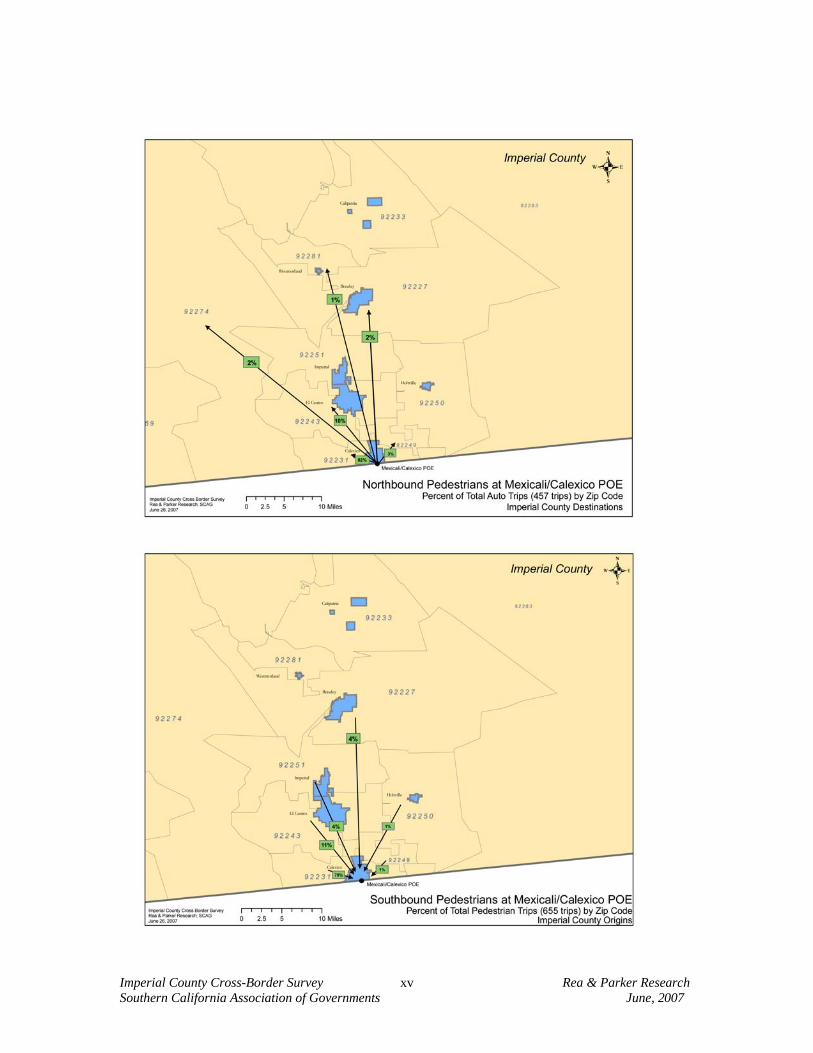
Northbound trips originate almost entirely in the Municipality of Mexicali (99 percent weekday and 97 percent weekend) and are destined for almost entirely to the Imperial Valley (led by Calexico 69 percent weekday and 81 percent weekend). The reverse, southbound, trips originate in much the same configuration as northbound destinations, with Imperial Valley locations dominant (Calexico 75 percent both weekday and weekend).
Imperial County Cross-Border Survey Rea & Parker Research Southern California Association of Governments June, 2007
xiv
29%
36%
28%
11%
20%
24%
5%
17%
8%6%
5%
1%2%
1%3% 4%
0%
5%
10%
15%
20%
25%
30%
35%
40%
Workplace
Visit Family/Friends
ShoppingBusiness Travel
Recreation
SchoolDining/Entertain
Other
Trip Purpose Northbound Pedestrians--Mexicali/Calexico Downtown
Weekday-North (N=17,496)Weekend-North (N=18,006)
Almost one-half (47 percent) of weekday northbound and nearly one-third (31 percent) of
weekday southbound pedestrians cross the border on foot at least once daily with 6 percent of weekend northbound and 14 percent of weekend southbound pedestrians doing the same. The lowest frequency of crossing is indicated among northbound weekend pedestrians, 29 percent of whom cross the border an average of only twice per year and another 14 percent of whom cross less than once per year.
Once across the border, many pedestrians stay more than one day in a pattern that implies staying in the United States for the work week and then returning to Mexico. That is, 21 percent of weekday northbound pedestrians stay more than one day (mean stay = 4.53 days) and 24 percent of weekend southbound pedestrians stay for more than one day (mean stay = 3.20 days).
Same day border crossers stay for an average of 6.65 hours weekday northbound and 4.51 hours weekend northbound in contrast to 2.66 hours weekday southbound and 3.60 hours weekend southbound.
Northbound, coming from Mexico, pedestrians reach the border primarily by car, with 32 percent being dropped off on weekends and 23 percent on weekdays and 28 percent parking their own car on weekends (25 percent weekdays) and then walking across.
Southbound, parking of their own car is most common among pedestrian crossers—27 percent weekday and 25 percent weekday. Taxis are also important on weekends for southbound pedestrians (25 percent), and walking both to and across the border is done by 20 percent of weekday southbound border crossers.
Once across, pedestrians reach their destinations by continuing to walk weekends northbound (35 percent) or by being picked up by automobile northbound weekdays (32 percent). Southbound, taxis are the most used mode (29 percent weekday and 36 percent weekend), followed by parked automobiles (24 percent weekdays and 25 percent weekends).
Imperial County Cross-Border Survey Rea & Parker Research Southern California Association of Governments June, 2007
xv
Imperial County Cross-Border Survey Rea & Parker Research Southern California Association of Governments June, 2007
xvi
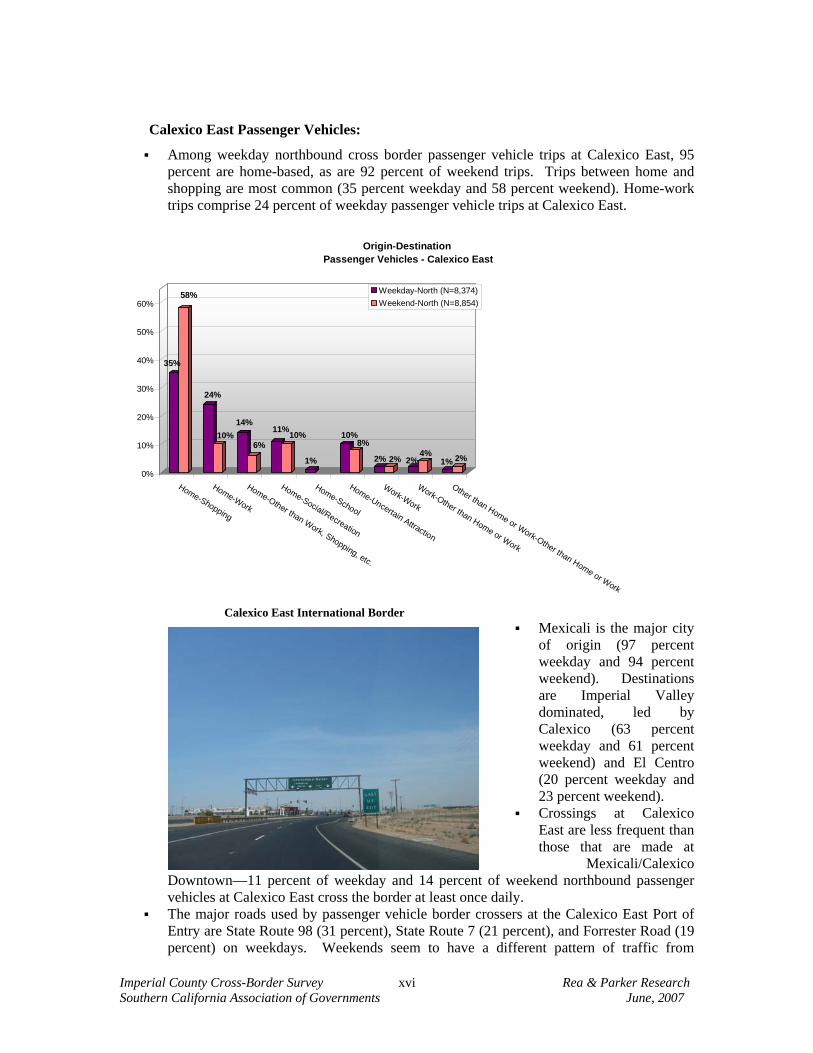
Calexico East Passenger Vehicles:
Among weekday northbound cross border passenger vehicle trips at Calexico East, 95 percent are home-based, as are 92 percent of weekend trips. Trips between home and shopping are most common (35 percent weekday and 58 percent weekend). Home-work trips comprise 24 percent of weekday passenger vehicle trips at Calexico East.
35%
58%
24%
10%14%
6%
11%10%
1%
10%8%
2% 2% 2%4%
1% 2%
0%
10%
20%
30%
40%
50%
60%
Home-Shopping
Home-Work
Home-Other than Work, Shopping, etc.
Home-Social/Recreation
Home-School
Home-Uncertain Attraction
Work-Work
Work-Other than Home or Work
Other than Home or Work-Other than Home or Work
Origin-Destination Passenger Vehicles - Calexico East
Weekday-North (N=8,374)Weekend-North (N=8,854)
Calexico East International Border
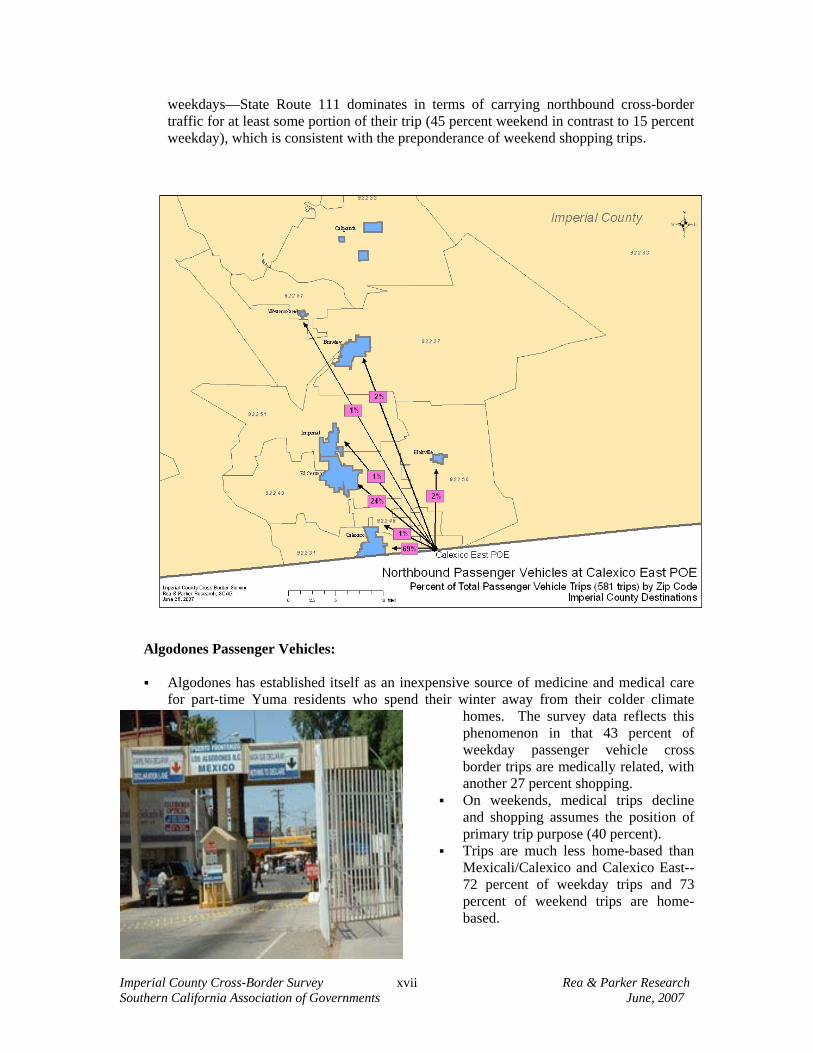
Mexicali is the major city of origin (97 percent weekday and 94 percent weekend). Destinations are Imperial Valley dominated, led by Calexico (63 percent weekday and 61 percent weekend) and El Centro (20 percent weekday and 23 percent weekend).
Crossings at Calexico East are less frequent than those that are made at
Mexicali/Calexico Downtown—11 percent of weekday and 14 percent of weekend northbound passenger vehicles at Calexico East cross the border at least once daily.
The major roads used by passenger vehicle border crossers at the Calexico East Port of Entry are State Route 98 (31 percent), State Route 7 (21 percent), and Forrester Road (19 percent) on weekdays. Weekends seem to have a different pattern of traffic from
Imperial County Cross-Border Survey Rea & Parker Research Southern California Association of Governments June, 2007
xvii
weekdays—State Route 111 dominates in terms of carrying northbound cross-border traffic for at least some portion of their trip (45 percent weekend in contrast to 15 percent weekday), which is consistent with the preponderance of weekend shopping trips.
Algodones Passenger Vehicles:
Algodones has established itself as an inexpensive source of medicine and medical care
for part-time Yuma residents who spend their winter away from their colder climate homes. The survey data reflects this phenomenon in that 43 percent of weekday passenger vehicle cross border trips are medically related, with another 27 percent shopping.
On weekends, medical trips decline and shopping assumes the position of primary trip purpose (40 percent).
Trips are much less home-based than Mexicali/Calexico and Calexico East-- 72 percent of weekday trips and 73 percent of weekend trips are home-based.
Imperial County Cross-Border Survey Rea & Parker Research Southern California Association of Governments June, 2007
xviii
Daily crossers represent a smaller proportion than passenger vehicles at Calexico East and Mexicali/Calexico Downtown (10 percent weekday and 6 percent weekend).
Algodones Pedestrians:
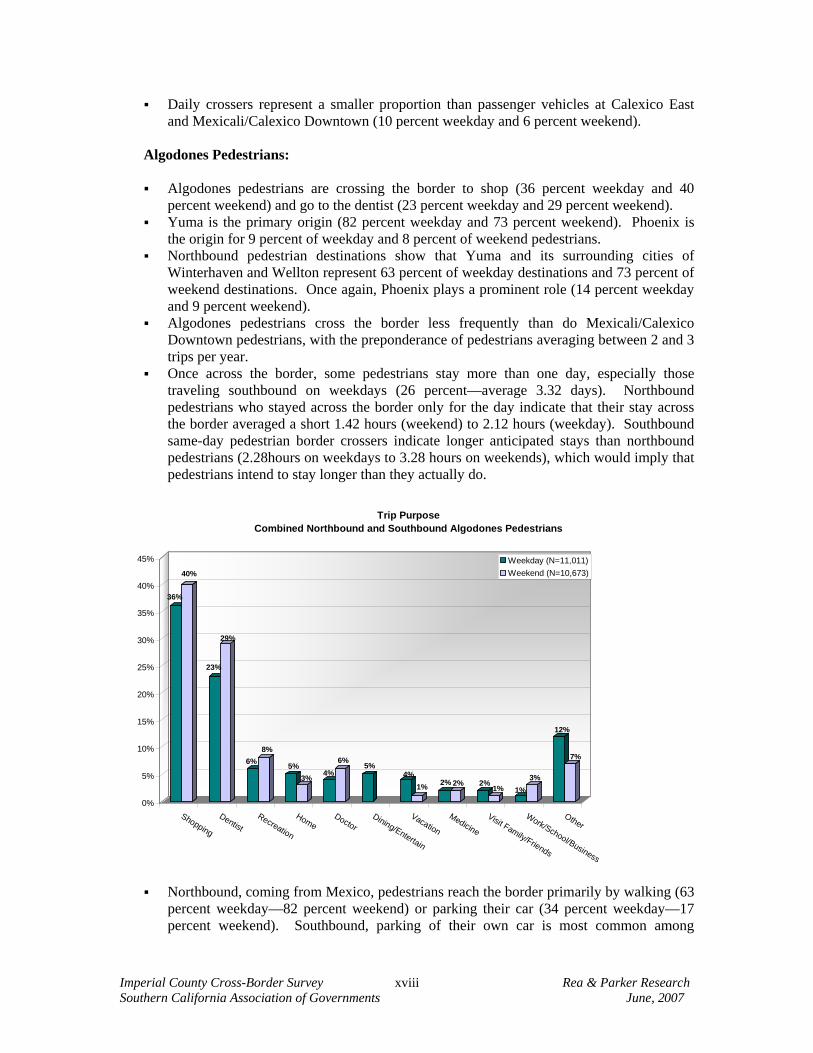
Algodones pedestrians are crossing the border to shop (36 percent weekday and 40
percent weekend) and go to the dentist (23 percent weekday and 29 percent weekend). Yuma is the primary origin (82 percent weekday and 73 percent weekend). Phoenix is
the origin for 9 percent of weekday and 8 percent of weekend pedestrians. Northbound pedestrian destinations show that Yuma and its surrounding cities of
Winterhaven and Wellton represent 63 percent of weekday destinations and 73 percent of weekend destinations. Once again, Phoenix plays a prominent role (14 percent weekday and 9 percent weekend).
Algodones pedestrians cross the border less frequently than do Mexicali/Calexico Downtown pedestrians, with the preponderance of pedestrians averaging between 2 and 3 trips per year.
Once across the border, some pedestrians stay more than one day, especially those traveling southbound on weekdays (26 percent—average 3.32 days). Northbound pedestrians who stayed across the border only for the day indicate that their stay across the border averaged a short 1.42 hours (weekend) to 2.12 hours (weekday). Southbound same-day pedestrian border crossers indicate longer anticipated stays than northbound pedestrians (2.28hours on weekdays to 3.28 hours on weekends), which would imply that pedestrians intend to stay longer than they actually do.
36%
40%
23%
29%
6%8%
5%3% 4%
6%5%
4%1% 2% 2% 2%
1% 1%3%
12%
7%
0%
5%
10%
15%
20%
25%
30%
35%
40%
45%
Shopping
DentistRecreation
HomeDoctor
Dining/Entertain
Vacation
Medicine
Visit Family/Friends
Work/School/Business
Other
Trip Purpose Combined Northbound and Southbound Algodones Pedestrians
Weekday (N=11,011)Weekend (N=10,673)
Northbound, coming from Mexico, pedestrians reach the border primarily by walking (63
percent weekday—82 percent weekend) or parking their car (34 percent weekday—17 percent weekend). Southbound, parking of their own car is most common among
Imperial County Cross-Border Survey Rea & Parker Research Southern California Association of Governments June, 2007
xix
pedestrian crossers—80 percent weekday and 94 percent weekday. Buses (public and private) and taxis are also important on weekdays for southbound pedestrians.
Once across, pedestrians reach their destinations by using their parked automobiles northbound (95 percent both weekday and weekend) or by walking southbound (89 percent weekday and 83 percent weekend).
Calexico East Commercial Trucks:
Cargo Pick-Up
Among northbound trucks crossing the border at Calexico East, 78 percent of weekday trucks were carrying cargo when surveyed as were 72 percent of weekend northbound trucks. Cargo is picked up predominantly at warehouses (41 percent weekday and 30 percent weekend), followed by maquiladoras—29 percent weekday and 20 percent weekend.
In contrast, 84 percent of weekday southbound trucks were empty when surveyed and 40 percent of weekend southbound trucks were also empty. Among those with cargo, pick-ups were almost entirely at warehouses.
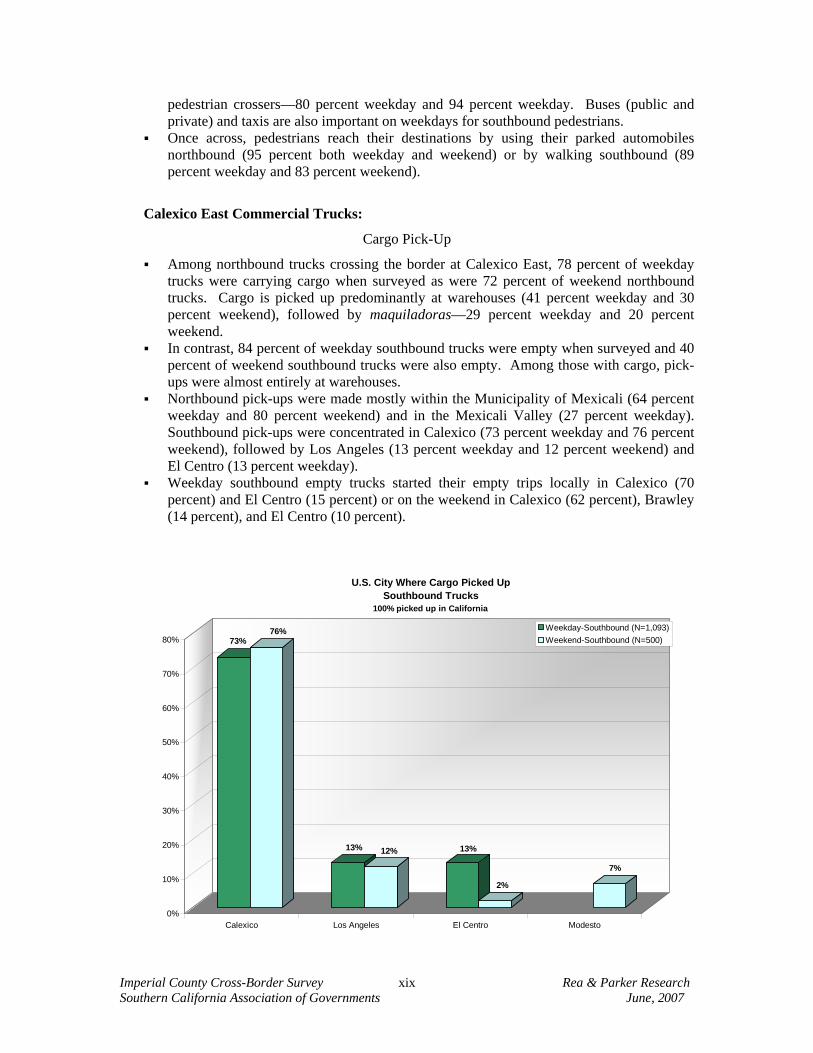
Northbound pick-ups were made mostly within the Municipality of Mexicali (64 percent weekday and 80 percent weekend) and in the Mexicali Valley (27 percent weekday). Southbound pick-ups were concentrated in Calexico (73 percent weekday and 76 percent weekend), followed by Los Angeles (13 percent weekday and 12 percent weekend) and El Centro (13 percent weekday).
Weekday southbound empty trucks started their empty trips locally in Calexico (70 percent) and El Centro (15 percent) or on the weekend in Calexico (62 percent), Brawley (14 percent), and El Centro (10 percent).
73%76%
13% 12% 13%
2%
7%
0%
10%
20%
30%
40%
50%
60%
70%
80%
Calexico Los Angeles El Centro Modesto
U.S. City Where Cargo Picked Up Southbound Trucks
Weekday-Southbound (N=1,093)Weekend-Southbound (N=500)
100% picked up in California
Imperial County Cross-Border Survey Rea & Parker Research Southern California Association of Governments June, 2007
xx
Empty northbound trucks will ultimately pick up their cargo at truck parking areas (45 percent weekday and 49 percent weekend) and at warehouses (34 percent weekday and 36 percent weekend). These sites are located in Calexico (51 percent), Los Angeles (21 percent), and El Centro (10 percent) for weekday trucks and for weekend trucks substantially at Calexico (82 percent) and Heber (13 percent).
Empty southbound trucks will ultimately pick up their cargo at truck parking areas (69 percent weekday) and warehouses (28 percent weekday and 77 percent weekend)—mostly in the Municipality of Mexicali (88 percent weekday and 79 percent weekend) and Caborca, Sonora (15 percent weekend).
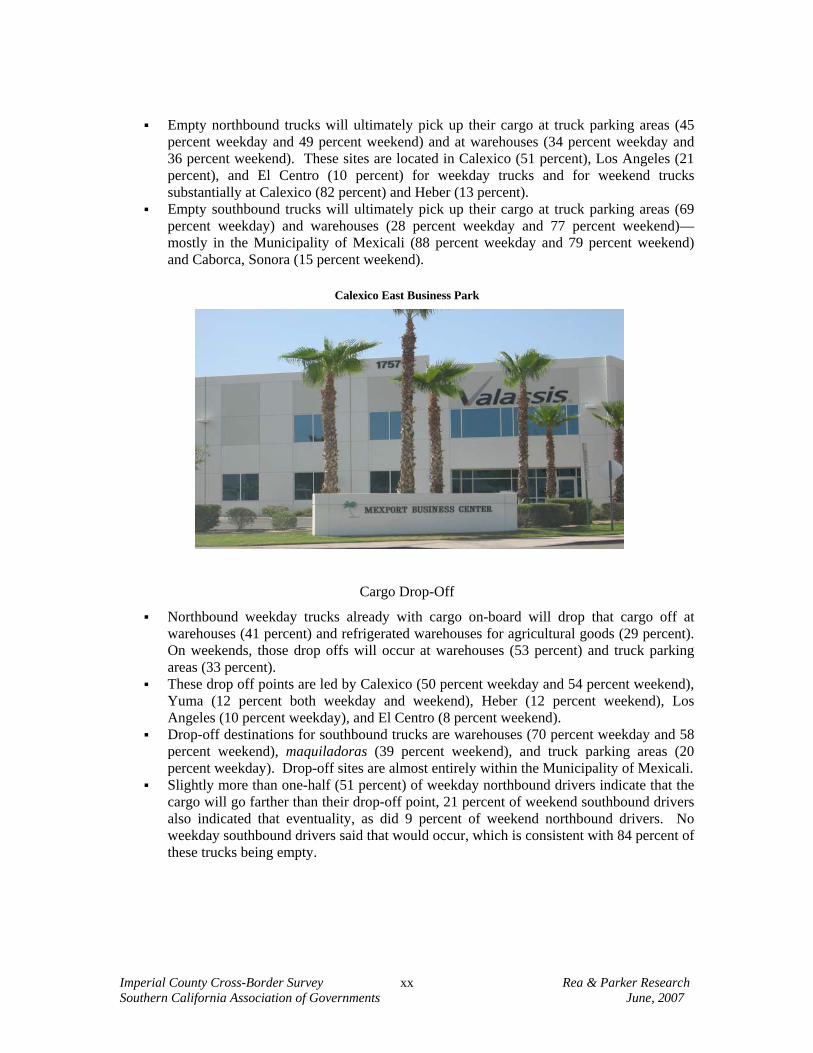
Calexico East Business Park
Cargo Drop-Off
Northbound weekday trucks already with cargo on-board will drop that cargo off at warehouses (41 percent) and refrigerated warehouses for agricultural goods (29 percent). On weekends, those drop offs will occur at warehouses (53 percent) and truck parking areas (33 percent).
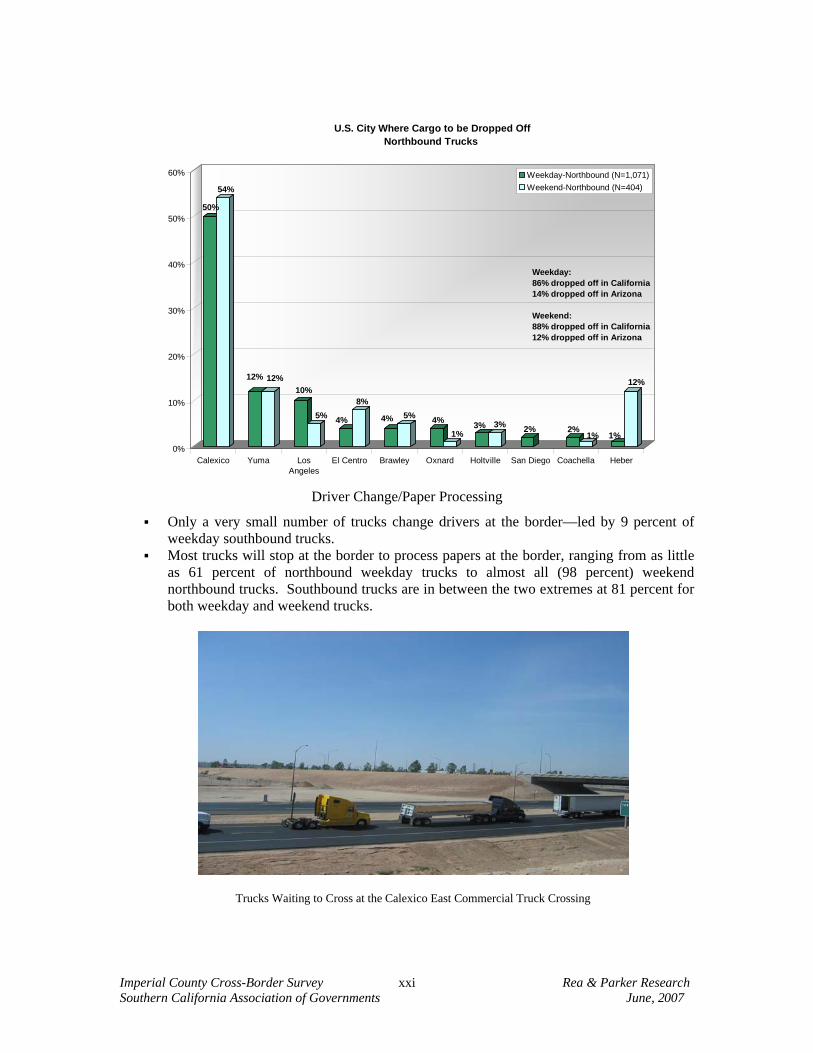
These drop off points are led by Calexico (50 percent weekday and 54 percent weekend), Yuma (12 percent both weekday and weekend), Heber (12 percent weekend), Los Angeles (10 percent weekday), and El Centro (8 percent weekend).
Drop-off destinations for southbound trucks are warehouses (70 percent weekday and 58 percent weekend), maquiladoras (39 percent weekend), and truck parking areas (20 percent weekday). Drop-off sites are almost entirely within the Municipality of Mexicali.
Slightly more than one-half (51 percent) of weekday northbound drivers indicate that the cargo will go farther than their drop-off point, 21 percent of weekend southbound drivers also indicated that eventuality, as did 9 percent of weekend northbound drivers. No weekday southbound drivers said that would occur, which is consistent with 84 percent of these trucks being empty.
Imperial County Cross-Border Survey Rea & Parker Research Southern California Association of Governments June, 2007
xxi
50%
54%
12% 12%10%
5% 4%
8%
4% 5% 4%1%
3% 3% 2% 2%1% 1%
12%
0%
10%
20%
30%
40%
50%
60%
Calexico Yuma LosAngeles
El Centro Brawley Oxnard Holtville San Diego Coachella Heber
U.S. City Where Cargo to be Dropped OffNorthbound Trucks
Weekday-Northbound (N=1,071)Weekend-Northbound (N=404)
Weekday:86% dropped off in California14% dropped off in Arizona
Weekend:88% dropped off in California12% dropped off in Arizona
Driver Change/Paper Processing
Only a very small number of trucks change drivers at the border—led by 9 percent of weekday southbound trucks.
Most trucks will stop at the border to process papers at the border, ranging from as little as 61 percent of northbound weekday trucks to almost all (98 percent) weekend northbound trucks. Southbound trucks are in between the two extremes at 81 percent for both weekday and weekend trucks.
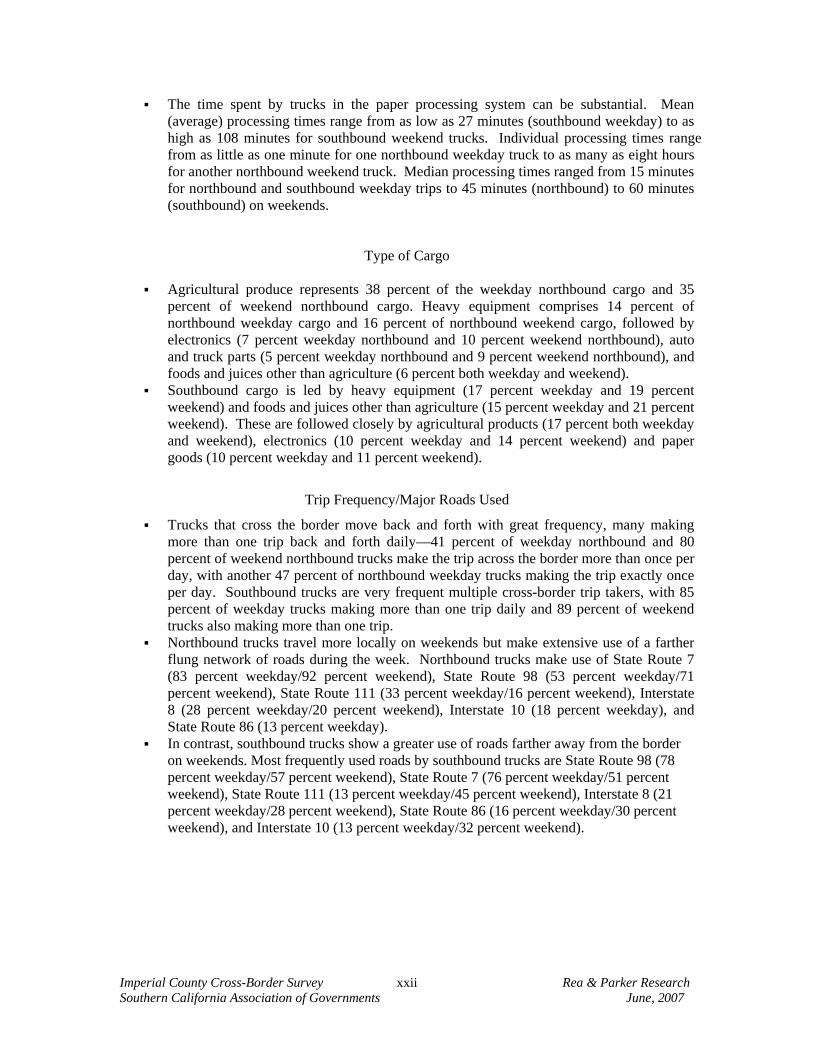
Trucks Waiting to Cross at the Calexico East Commercial Truck Crossing
Imperial County Cross-Border Survey Rea & Parker Research Southern California Association of Governments June, 2007
xxii
The time spent by trucks in the paper processing system can be substantial. Mean (average) processing times range from as low as 27 minutes (southbound weekday) to as high as 108 minutes for southbound weekend trucks. Individual processing times range from as little as one minute for one northbound weekday truck to as many as eight hours for another northbound weekend truck. Median processing times ranged from 15 minutes for northbound and southbound weekday trips to 45 minutes (northbound) to 60 minutes (southbound) on weekends.
Type of Cargo
Agricultural produce represents 38 percent of the weekday northbound cargo and 35 percent of weekend northbound cargo. Heavy equipment comprises 14 percent of northbound weekday cargo and 16 percent of northbound weekend cargo, followed by electronics (7 percent weekday northbound and 10 percent weekend northbound), auto and truck parts (5 percent weekday northbound and 9 percent weekend northbound), and foods and juices other than agriculture (6 percent both weekday and weekend).
Southbound cargo is led by heavy equipment (17 percent weekday and 19 percent weekend) and foods and juices other than agriculture (15 percent weekday and 21 percent weekend). These are followed closely by agricultural products (17 percent both weekday and weekend), electronics (10 percent weekday and 14 percent weekend) and paper goods (10 percent weekday and 11 percent weekend).
Trip Frequency/Major Roads Used
Trucks that cross the border move back and forth with great frequency, many making more than one trip back and forth daily—41 percent of weekday northbound and 80 percent of weekend northbound trucks make the trip across the border more than once per day, with another 47 percent of northbound weekday trucks making the trip exactly once per day. Southbound trucks are very frequent multiple cross-border trip takers, with 85 percent of weekday trucks making more than one trip daily and 89 percent of weekend trucks also making more than one trip.
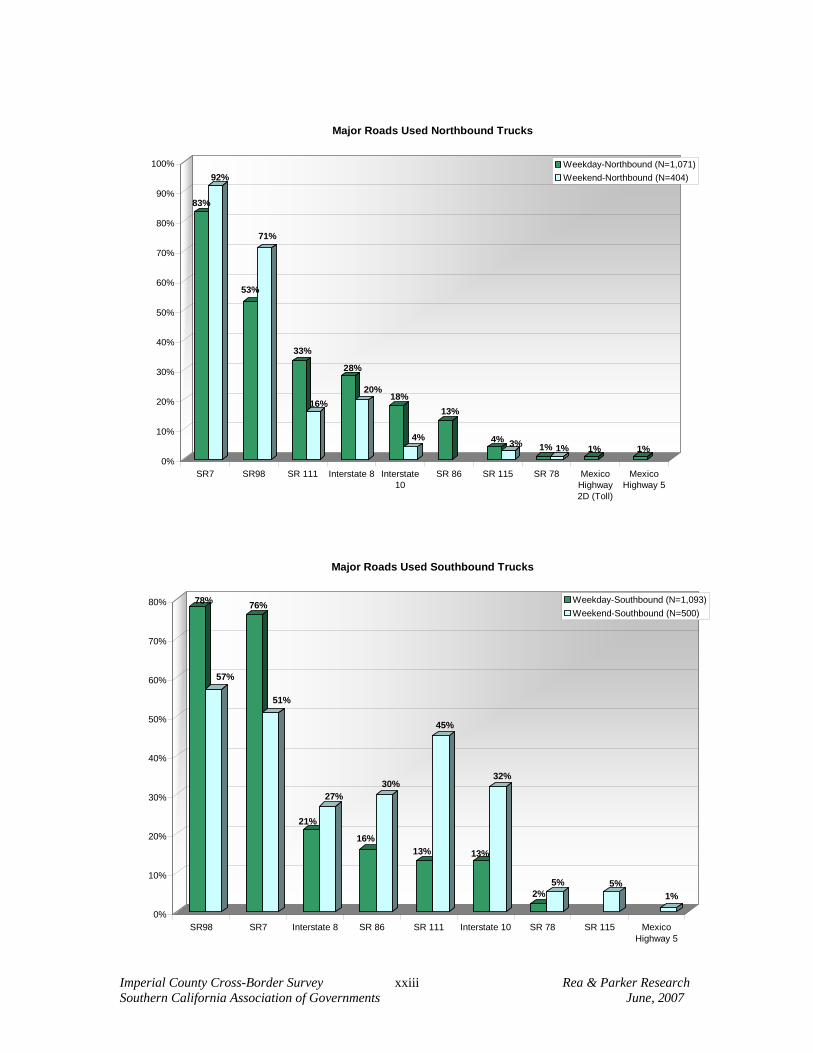
Northbound trucks travel more locally on weekends but make extensive use of a farther flung network of roads during the week. Northbound trucks make use of State Route 7 (83 percent weekday/92 percent weekend), State Route 98 (53 percent weekday/71 percent weekend), State Route 111 (33 percent weekday/16 percent weekend), Interstate 8 (28 percent weekday/20 percent weekend), Interstate 10 (18 percent weekday), and State Route 86 (13 percent weekday).
In contrast, southbound trucks show a greater use of roads farther away from the border on weekends. Most frequently used roads by southbound trucks are State Route 98 (78 percent weekday/57 percent weekend), State Route 7 (76 percent weekday/51 percent weekend), State Route 111 (13 percent weekday/45 percent weekend), Interstate 8 (21 percent weekday/28 percent weekend), State Route 86 (16 percent weekday/30 percent weekend), and Interstate 10 (13 percent weekday/32 percent weekend).
Imperial County Cross-Border Survey Rea & Parker Research Southern California Association of Governments June, 2007
xxiii
83%
92%
53%
71%
33%
16%
28%
20%18%
4%
13%
4% 3% 1% 1% 1% 1%0%
10%
20%
30%
40%
50%
60%
70%
80%
90%
100%
SR7 SR98 SR 111 Interstate 8 Interstate10
SR 86 SR 115 SR 78 MexicoHighway2D (Toll)
MexicoHighway 5
Major Roads Used Northbound Trucks
Weekday-Northbound (N=1,071)Weekend-Northbound (N=404)
78%
57%
76%
51%
21%
27%
16%
30%
13%
45%
13%
32%
2%5% 5%
1%
0%
10%
20%
30%
40%
50%
60%
70%
80%
SR98 SR7 Interstate 8 SR 86 SR 111 Interstate 10 SR 78 SR 115 MexicoHighway 5
Major Roads Used Southbound Trucks
Weekday-Southbound (N=1,093)Weekend-Southbound (N=500)
Imperial County Cross-Border Survey Rea & Parker Research Southern California Association of Governments June, 2007
1
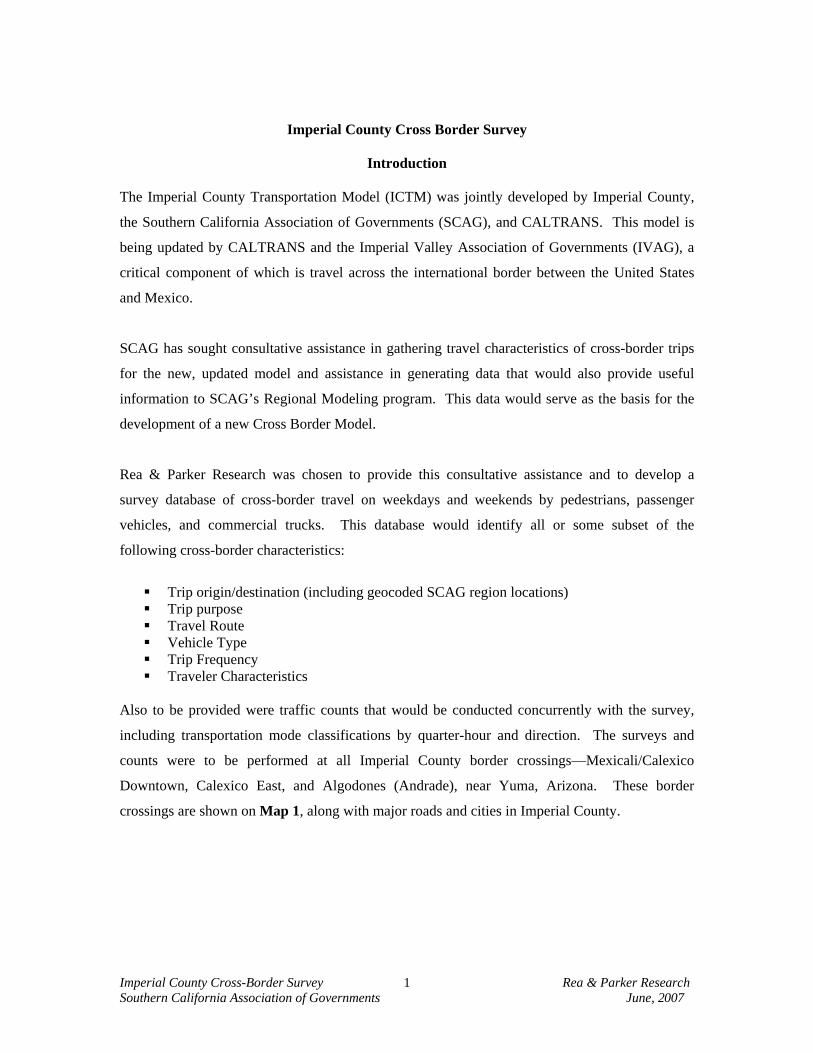
Imperial County Cross Border Survey
Introduction
The Imperial County Transportation Model (ICTM) was jointly developed by Imperial County,
the Southern California Association of Governments (SCAG), and CALTRANS. This model is
being updated by CALTRANS and the Imperial Valley Association of Governments (IVAG), a
critical component of which is travel across the international border between the United States
and Mexico.
SCAG has sought consultative assistance in gathering travel characteristics of cross-border trips
for the new, updated model and assistance in generating data that would also provide useful
information to SCAG’s Regional Modeling program. This data would serve as the basis for the
development of a new Cross Border Model.
Rea & Parker Research was chosen to provide this consultative assistance and to develop a
survey database of cross-border travel on weekdays and weekends by pedestrians, passenger
vehicles, and commercial trucks. This database would identify all or some subset of the
following cross-border characteristics:
Trip origin/destination (including geocoded SCAG region locations) Trip purpose Travel Route Vehicle Type Trip Frequency Traveler Characteristics
Also to be provided were traffic counts that would be conducted concurrently with the survey,
including transportation mode classifications by quarter-hour and direction. The surveys and
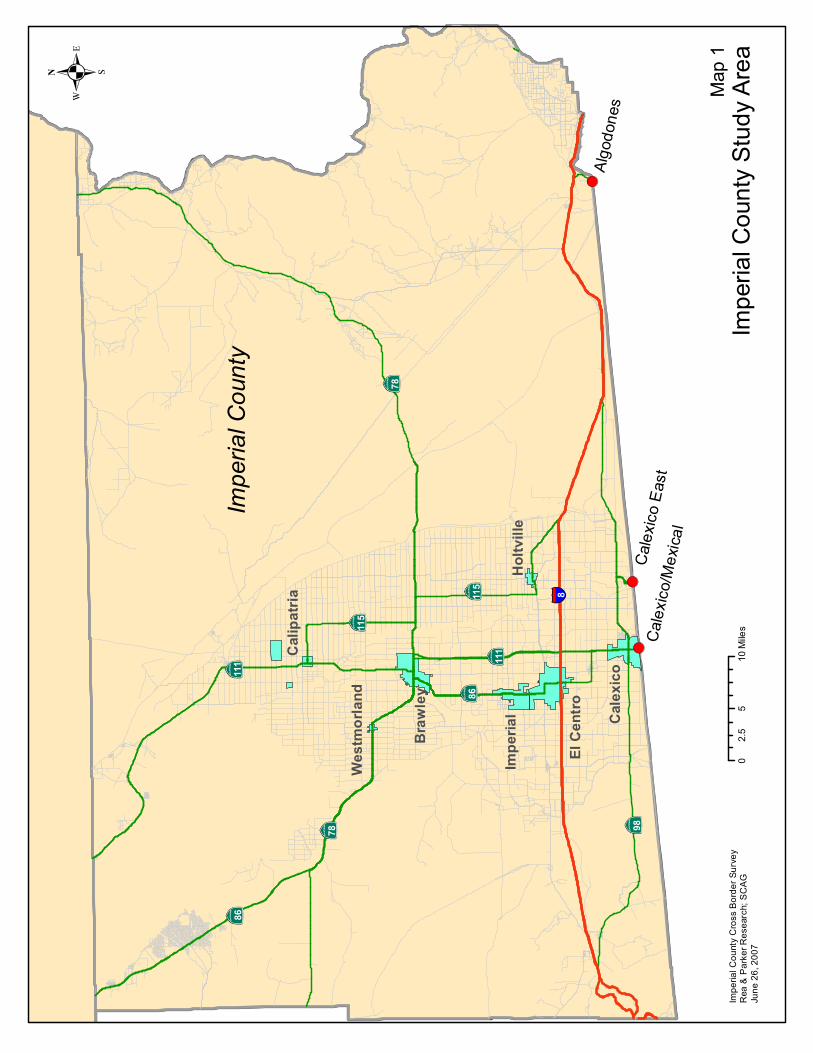
counts were to be performed at all Imperial County border crossings—Mexicali/Calexico
Downtown, Calexico East, and Algodones (Andrade), near Yuma, Arizona. These border
crossings are shown on Map 1, along with major roads and cities in Imperial County.
! (! (
! (
.
Impe
rialC
ount
ySt
udy
Area
Impe
rialC
ount
yC
ross
Bor
derS
urve
yR
ea&
Par
kerR
esea
rch;
SC
AG
June
26,2
007
Impe
rialC
ount
y
ElC
entr
o
Impe
rial
Hol
tvill
e
Cal
exic
o
Bra
wle
y
Wes
tmor
land
Cal
ipat
ria
Cal
exic
o/M
exic
al
Cal
exic
oE
ast
Algo
done
s
Map
10
510
2.5
Mile
s
·|}þ111
·|}þ115
§̈ ¦8
·|}þ86
·|}þ78
·|}þ86
·|}þ111
·|}þ115
·|}þ78
·|}þ98
Imperial County Cross-Border Survey Rea & Parker Research Southern California Association of Governments June, 2007
3
Methodology
Many meetings were conducted among the parties—Rea & Parker Research, SCAG,
CALTRANS, IVAG, and representatives of Imperial County, City of Calexico, United States
General Services Administration (GSA), United States Department of Homeland Security—
Customs and Border Protection, Instituto de Administracion y Avaluos de Bienes Nacionales
(INDAABIN--Mexico), Ayuntamiento de Mexicali—Relaciones Internacionales (Mexico),
Instituto Municipal de Investigacion y Planeacion Urbana de Mexicali (Municipality of
Mexicali), Aduana Mexicana (Mexican Customs), the Quechan Tribe of the Fort Yuma-Quechan
Reservation, and others in order to establish the two distinct methodological components that
were required. The first involved the positioning of traffic counters and survey takers, and the
second concerned the development of the survey instruments. Over the course of these meetings,
the count and survey positions were established that are included in the appendix. A schedule of
assignments and personnel requirements for these sites is also attached in the appendix.
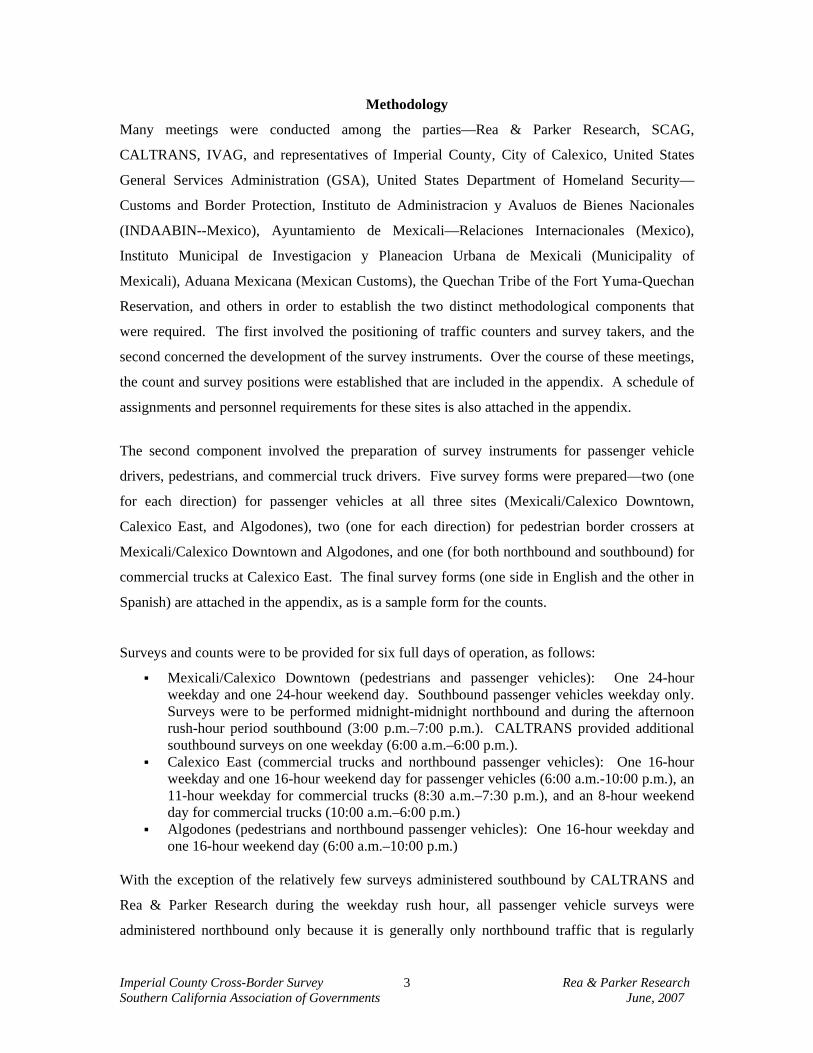
The second component involved the preparation of survey instruments for passenger vehicle
drivers, pedestrians, and commercial truck drivers. Five survey forms were prepared—two (one
for each direction) for passenger vehicles at all three sites (Mexicali/Calexico Downtown,
Calexico East, and Algodones), two (one for each direction) for pedestrian border crossers at
Mexicali/Calexico Downtown and Algodones, and one (for both northbound and southbound) for
commercial trucks at Calexico East. The final survey forms (one side in English and the other in
Spanish) are attached in the appendix, as is a sample form for the counts.
Surveys and counts were to be provided for six full days of operation, as follows:
Mexicali/Calexico Downtown (pedestrians and passenger vehicles): One 24-hour weekday and one 24-hour weekend day. Southbound passenger vehicles weekday only. Surveys were to be performed midnight-midnight northbound and during the afternoon rush-hour period southbound (3:00 p.m.–7:00 p.m.). CALTRANS provided additional southbound surveys on one weekday (6:00 a.m.–6:00 p.m.).
Calexico East (commercial trucks and northbound passenger vehicles): One 16-hour weekday and one 16-hour weekend day for passenger vehicles (6:00 a.m.-10:00 p.m.), an 11-hour weekday for commercial trucks (8:30 a.m.–7:30 p.m.), and an 8-hour weekend day for commercial trucks (10:00 a.m.–6:00 p.m.)
Algodones (pedestrians and northbound passenger vehicles): One 16-hour weekday and one 16-hour weekend day (6:00 a.m.–10:00 p.m.)
With the exception of the relatively few surveys administered southbound by CALTRANS and
Rea & Parker Research during the weekday rush hour, all passenger vehicle surveys were
administered northbound only because it is generally only northbound traffic that is regularly
Imperial County Cross-Border Survey Rea & Parker Research Southern California Association of Governments June, 2007
4
delayed at the border and, therefore, becomes available to be approached and interviewed by
survey personnel.
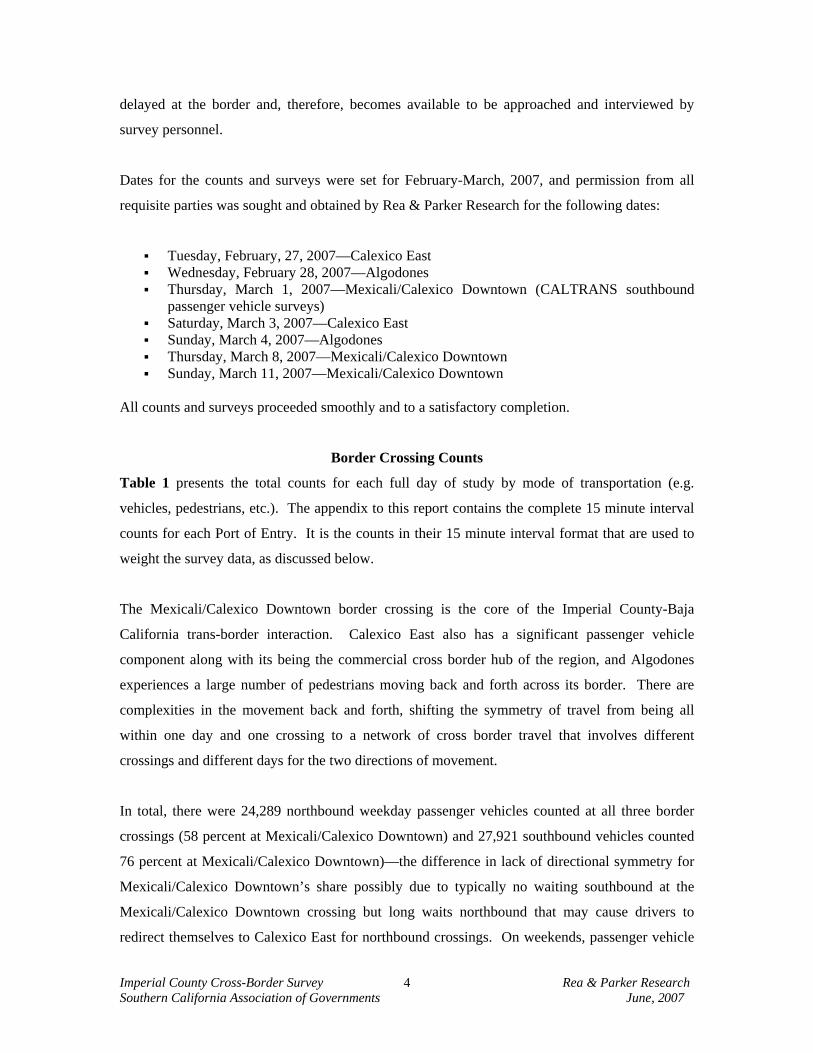
Dates for the counts and surveys were set for February-March, 2007, and permission from all
requisite parties was sought and obtained by Rea & Parker Research for the following dates:
Tuesday, February, 27, 2007—Calexico East Wednesday, February 28, 2007—Algodones Thursday, March 1, 2007—Mexicali/Calexico Downtown (CALTRANS southbound
passenger vehicle surveys) Saturday, March 3, 2007—Calexico East Sunday, March 4, 2007—Algodones Thursday, March 8, 2007—Mexicali/Calexico Downtown Sunday, March 11, 2007—Mexicali/Calexico Downtown
All counts and surveys proceeded smoothly and to a satisfactory completion.
Border Crossing Counts
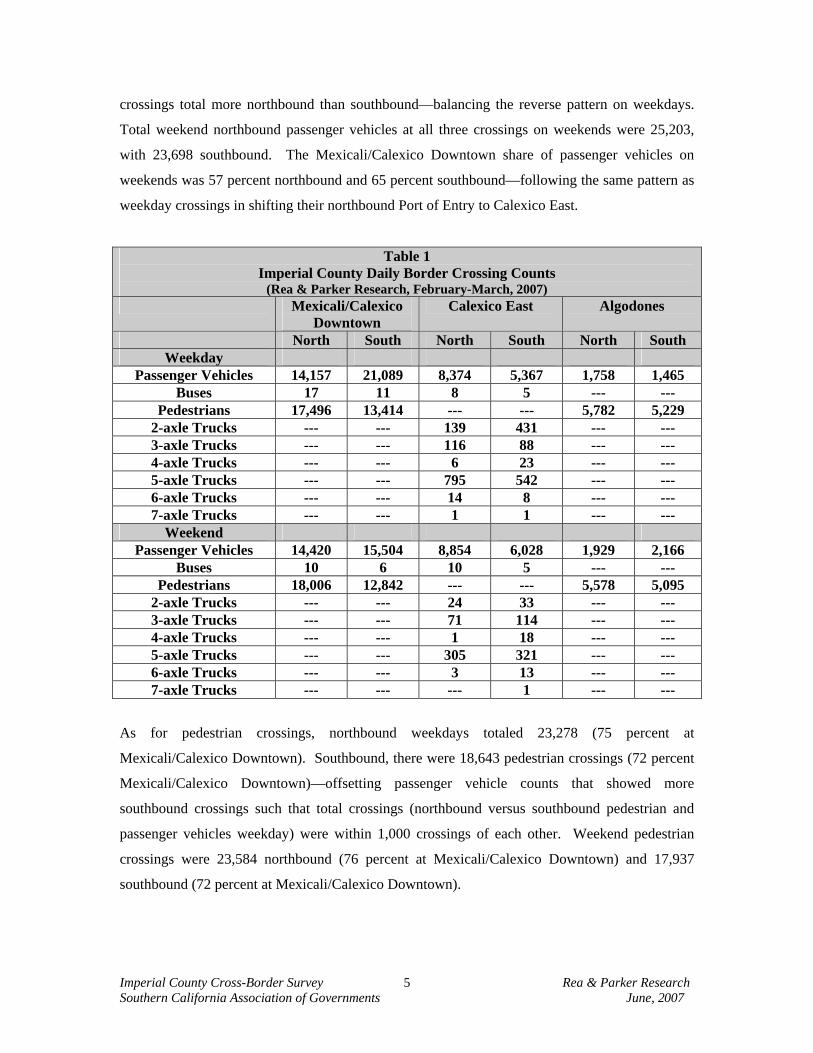
Table 1 presents the total counts for each full day of study by mode of transportation (e.g.
vehicles, pedestrians, etc.). The appendix to this report contains the complete 15 minute interval
counts for each Port of Entry. It is the counts in their 15 minute interval format that are used to
weight the survey data, as discussed below.
The Mexicali/Calexico Downtown border crossing is the core of the Imperial County-Baja
California trans-border interaction. Calexico East also has a significant passenger vehicle
component along with its being the commercial cross border hub of the region, and Algodones
experiences a large number of pedestrians moving back and forth across its border. There are
complexities in the movement back and forth, shifting the symmetry of travel from being all
within one day and one crossing to a network of cross border travel that involves different
crossings and different days for the two directions of movement.
In total, there were 24,289 northbound weekday passenger vehicles counted at all three border
crossings (58 percent at Mexicali/Calexico Downtown) and 27,921 southbound vehicles counted
76 percent at Mexicali/Calexico Downtown)—the difference in lack of directional symmetry for
Mexicali/Calexico Downtown’s share possibly due to typically no waiting southbound at the
Mexicali/Calexico Downtown crossing but long waits northbound that may cause drivers to
redirect themselves to Calexico East for northbound crossings. On weekends, passenger vehicle
Imperial County Cross-Border Survey Rea & Parker Research Southern California Association of Governments June, 2007
5
crossings total more northbound than southbound—balancing the reverse pattern on weekdays.
Total weekend northbound passenger vehicles at all three crossings on weekends were 25,203,
with 23,698 southbound. The Mexicali/Calexico Downtown share of passenger vehicles on
weekends was 57 percent northbound and 65 percent southbound—following the same pattern as
weekday crossings in shifting their northbound Port of Entry to Calexico East.
Table 1 Imperial County Daily Border Crossing Counts
(Rea & Parker Research, February-March, 2007) Mexicali/Calexico
Downtown Calexico East Algodones
North South North South North South Weekday
Passenger Vehicles 14,157 21,089 8,374 5,367 1,758 1,465 Buses 17 11 8 5 --- ---
Pedestrians 17,496 13,414 --- --- 5,782 5,229 2-axle Trucks --- --- 139 431 --- --- 3-axle Trucks --- --- 116 88 --- --- 4-axle Trucks --- --- 6 23 --- --- 5-axle Trucks --- --- 795 542 --- --- 6-axle Trucks --- --- 14 8 --- --- 7-axle Trucks --- --- 1 1 --- ---
Weekend Passenger Vehicles 14,420 15,504 8,854 6,028 1,929 2,166
Buses 10 6 10 5 --- --- Pedestrians 18,006 12,842 --- --- 5,578 5,095
2-axle Trucks --- --- 24 33 --- --- 3-axle Trucks --- --- 71 114 --- --- 4-axle Trucks --- --- 1 18 --- --- 5-axle Trucks --- --- 305 321 --- --- 6-axle Trucks --- --- 3 13 --- --- 7-axle Trucks --- --- --- 1 --- ---
As for pedestrian crossings, northbound weekdays totaled 23,278 (75 percent at
Mexicali/Calexico Downtown). Southbound, there were 18,643 pedestrian crossings (72 percent
Mexicali/Calexico Downtown)—offsetting passenger vehicle counts that showed more
southbound crossings such that total crossings (northbound versus southbound pedestrian and
passenger vehicles weekday) were within 1,000 crossings of each other. Weekend pedestrian
crossings were 23,584 northbound (76 percent at Mexicali/Calexico Downtown) and 17,937
southbound (72 percent at Mexicali/Calexico Downtown).
Imperial County Cross-Border Survey Rea & Parker Research Southern California Association of Governments June, 2007
6
Truck crossings at Calexico East totaled 1,071 weekday northbound and 1,093 weekday
southbound. On weekends, these totals dropped by more than 50 percent to 404 northbound and
500 southbound.
The counts in Table 1 have been added to the tables and charts in the Survey Respondent
Characteristics and Cross Border Travel Behavior and Characteristics sections of this report to
provide reference and context to those tables and charts. Completed surveys were weighted to
reflect the distribution of counts in 15 minute intervals so that the analysis that is contained in this
report is representative of the population of border crossers in direct proportion to the times that
they crossed the borders. The weighted percentages can be applied to the identified counts in the
charts and tables to provide estimated actual trip numbers.
The weighting/expansion process undertaken by Rea & Parker Research in this study entails
comparing the 15 minute interval counts to the completed survey times (also grouped into the
same 15 minute intervals) such that, for example, for northbound pedestrian border crossers at
Mexicali/Calexico Downtown, there were 120 pedestrians counted during the period 7:30 p.m. to
7:45 p.m. That represents 0.80 percent of crossers for the 15 minute intervals that actually
obtained surveys. The total number of northbound pedestrian surveys that were obtained during
that period represents 0.63 percent of surveys for that day—or less than its proportionate 0.80
share. A weight of 1.27 (0.80 divided by 0.63) was applied to all surveys obtained during that 15
minute period in order to establish proportionality and representativeness. There were in excess
of 1,000 such weights applied to the data based upon Port of Entry, transportation mode and
direction. These weights are included in the SPSS data file in the electronic appendix.
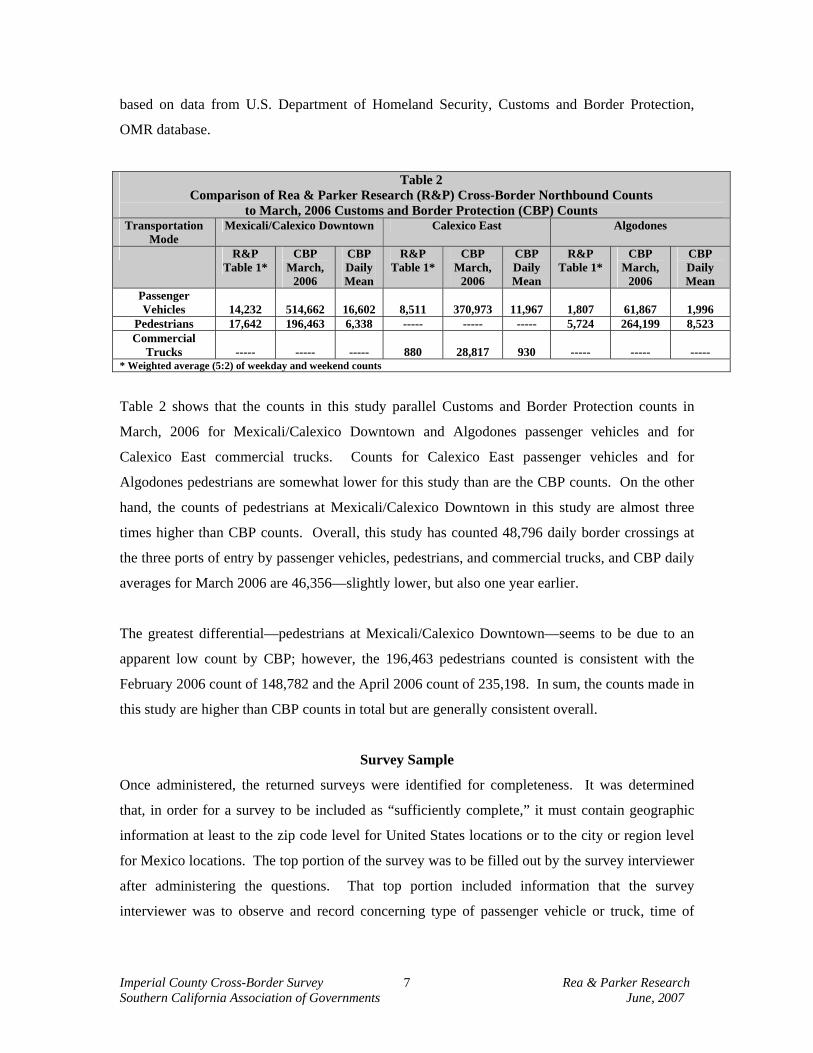
Comparing the counts made in this study to “official” counts for March, 2006 (2007 is not yet
publicly available) is interesting. Table 2 shows the “official” northbound counts of pedestrians,
passenger vehicles, and commercial trucks at Mexicali/Calexico Downtown, Calexico East, and
Algodones (Andrade). These counts are provided for the full month and have been divided by 31
to obtain a daily average. This averaging method does not take account of daily fluctuations and
is therefore not to be relied upon for precise counts; however, the daily average does provide a
contextual data point for comparative purposes.
The source of these counts is the U.S. Department of Transportation, Research and Innovative
Technology Administration, Bureau of Transportation Statistics, Border Crossing/Entry Data;
Imperial County Cross-Border Survey Rea & Parker Research Southern California Association of Governments June, 2007
7
based on data from U.S. Department of Homeland Security, Customs and Border Protection,
OMR database.
Table 2 Comparison of Rea & Parker Research (R&P) Cross-Border Northbound Counts
to March, 2006 Customs and Border Protection (CBP) Counts Transportation
Mode Mexicali/Calexico Downtown Calexico East Algodones
R&P Table 1*
CBP March,
2006
CBP Daily Mean
R&P Table 1*
CBP March,
2006
CBP Daily Mean
R&P Table 1*
CBP March,
2006
CBP Daily Mean
Passenger Vehicles
14,232
514,662
16,602
8,511
370,973
11,967
1,807
61,867
1,996
Pedestrians 17,642 196,463 6,338 ----- ----- ----- 5,724 264,199 8,523 Commercial
Trucks
-----
-----
-----
880
28,817
930
-----
-----
----- * Weighted average (5:2) of weekday and weekend counts
Table 2 shows that the counts in this study parallel Customs and Border Protection counts in
March, 2006 for Mexicali/Calexico Downtown and Algodones passenger vehicles and for
Calexico East commercial trucks. Counts for Calexico East passenger vehicles and for
Algodones pedestrians are somewhat lower for this study than are the CBP counts. On the other
hand, the counts of pedestrians at Mexicali/Calexico Downtown in this study are almost three
times higher than CBP counts. Overall, this study has counted 48,796 daily border crossings at
the three ports of entry by passenger vehicles, pedestrians, and commercial trucks, and CBP daily
averages for March 2006 are 46,356—slightly lower, but also one year earlier.
The greatest differential—pedestrians at Mexicali/Calexico Downtown—seems to be due to an
apparent low count by CBP; however, the 196,463 pedestrians counted is consistent with the
February 2006 count of 148,782 and the April 2006 count of 235,198. In sum, the counts made in
this study are higher than CBP counts in total but are generally consistent overall.
Survey Sample
Once administered, the returned surveys were identified for completeness. It was determined
that, in order for a survey to be included as “sufficiently complete,” it must contain geographic
information at least to the zip code level for United States locations or to the city or region level
for Mexico locations. The top portion of the survey was to be filled out by the survey interviewer
after administering the questions. That top portion included information that the survey
interviewer was to observe and record concerning type of passenger vehicle or truck, time of
Imperial County Cross-Border Survey Rea & Parker Research Southern California Association of Governments June, 2007
8
survey, and number of travelers. Further, in order to be deemed sufficiently complete, surveys
were to include trip purpose, origin location type, and destination location type.
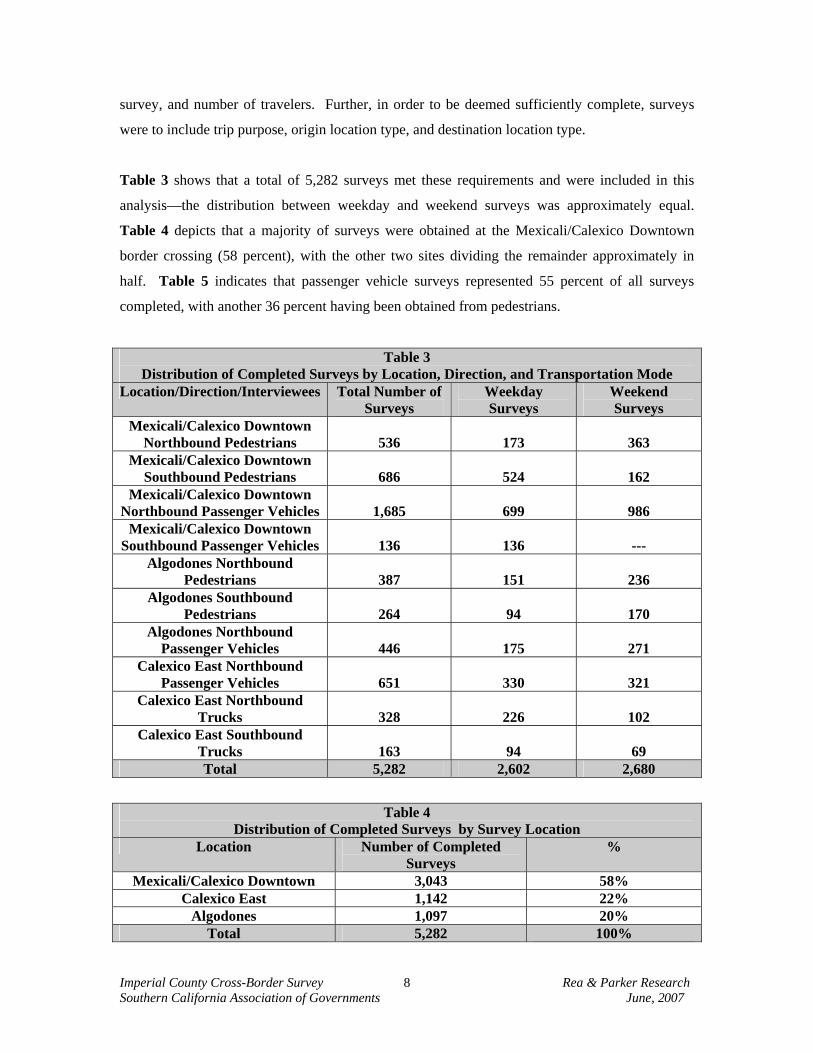
Table 3 shows that a total of 5,282 surveys met these requirements and were included in this
analysis—the distribution between weekday and weekend surveys was approximately equal.
Table 4 depicts that a majority of surveys were obtained at the Mexicali/Calexico Downtown
border crossing (58 percent), with the other two sites dividing the remainder approximately in
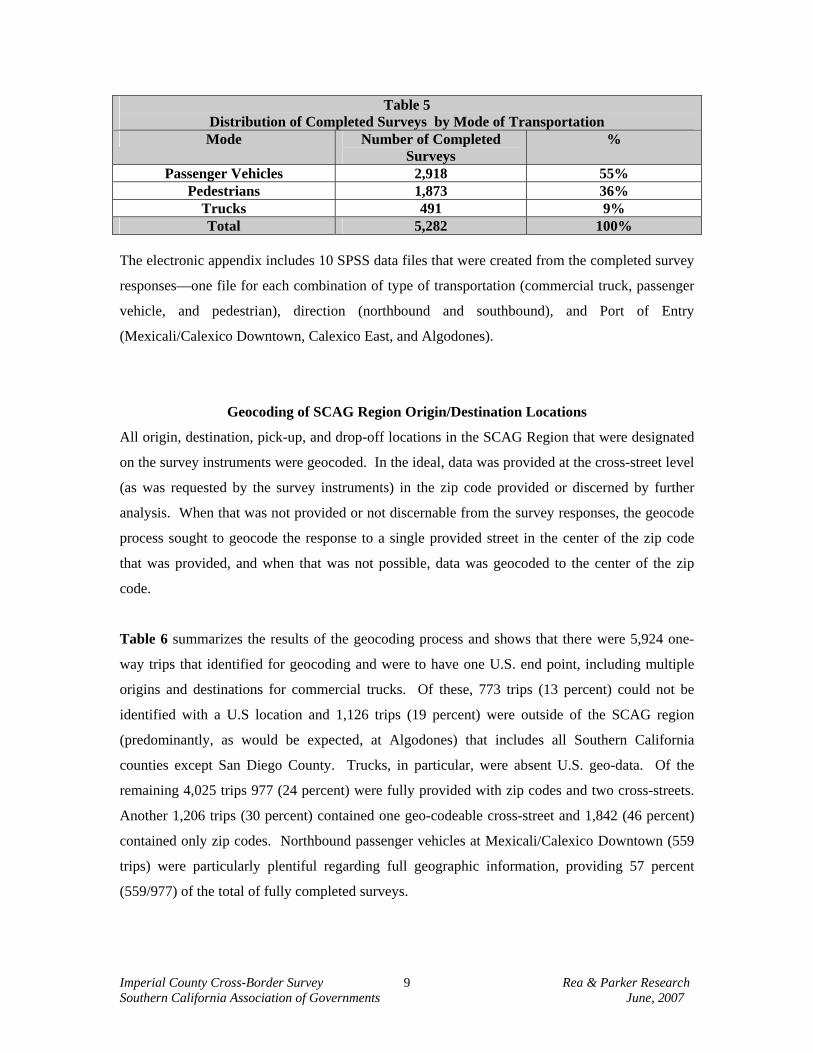
half. Table 5 indicates that passenger vehicle surveys represented 55 percent of all surveys
completed, with another 36 percent having been obtained from pedestrians.
Table 3 Distribution of Completed Surveys by Location, Direction, and Transportation Mode
Location/Direction/Interviewees Total Number of Surveys
Weekday Surveys
Weekend Surveys
Mexicali/Calexico Downtown Northbound Pedestrians
536
173
363
Mexicali/Calexico Downtown Southbound Pedestrians
686
524
162
Mexicali/Calexico Downtown Northbound Passenger Vehicles
1,685
699
986
Mexicali/Calexico Downtown Southbound Passenger Vehicles
136
136
---
Algodones Northbound Pedestrians
387
151
236
Algodones Southbound Pedestrians
264
94
170
Algodones Northbound Passenger Vehicles
446
175
271
Calexico East Northbound Passenger Vehicles
651
330
321
Calexico East Northbound Trucks
328
226
102
Calexico East Southbound Trucks
163
94
69
Total 5,282 2,602 2,680
Table 4 Distribution of Completed Surveys by Survey Location
Location Number of Completed Surveys
%
Mexicali/Calexico Downtown 3,043 58% Calexico East 1,142 22%
Algodones 1,097 20% Total 5,282 100%
Imperial County Cross-Border Survey Rea & Parker Research Southern California Association of Governments June, 2007
9
Table 5 Distribution of Completed Surveys by Mode of Transportation Mode Number of Completed
Surveys %
Passenger Vehicles 2,918 55% Pedestrians 1,873 36%
Trucks 491 9% Total 5,282 100%
The electronic appendix includes 10 SPSS data files that were created from the completed survey
responses—one file for each combination of type of transportation (commercial truck, passenger
vehicle, and pedestrian), direction (northbound and southbound), and Port of Entry
(Mexicali/Calexico Downtown, Calexico East, and Algodones).
Geocoding of SCAG Region Origin/Destination Locations
All origin, destination, pick-up, and drop-off locations in the SCAG Region that were designated
on the survey instruments were geocoded. In the ideal, data was provided at the cross-street level
(as was requested by the survey instruments) in the zip code provided or discerned by further
analysis. When that was not provided or not discernable from the survey responses, the geocode
process sought to geocode the response to a single provided street in the center of the zip code
that was provided, and when that was not possible, data was geocoded to the center of the zip
code.
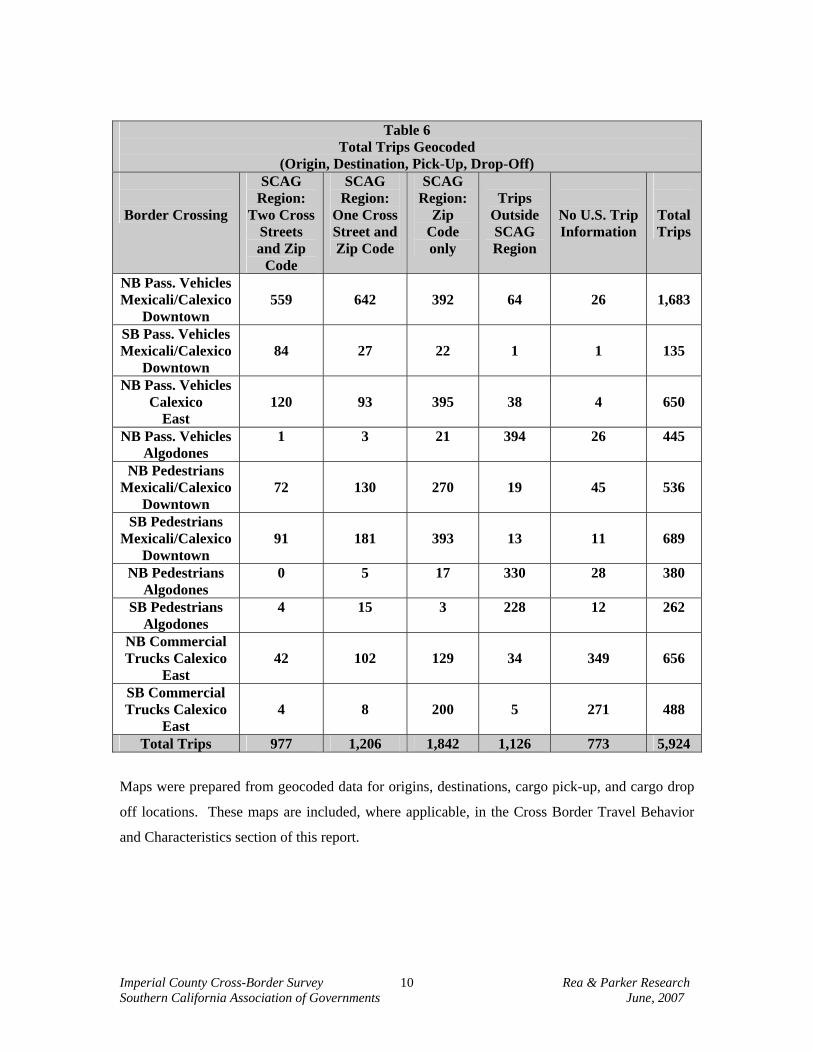
Table 6 summarizes the results of the geocoding process and shows that there were 5,924 one-
way trips that identified for geocoding and were to have one U.S. end point, including multiple
origins and destinations for commercial trucks. Of these, 773 trips (13 percent) could not be
identified with a U.S location and 1,126 trips (19 percent) were outside of the SCAG region
(predominantly, as would be expected, at Algodones) that includes all Southern California
counties except San Diego County. Trucks, in particular, were absent U.S. geo-data. Of the
remaining 4,025 trips 977 (24 percent) were fully provided with zip codes and two cross-streets.
Another 1,206 trips (30 percent) contained one geo-codeable cross-street and 1,842 (46 percent)
contained only zip codes. Northbound passenger vehicles at Mexicali/Calexico Downtown (559
trips) were particularly plentiful regarding full geographic information, providing 57 percent
(559/977) of the total of fully completed surveys.
Imperial County Cross-Border Survey Rea & Parker Research Southern California Association of Governments June, 2007
10
Table 6 Total Trips Geocoded
(Origin, Destination, Pick-Up, Drop-Off)
Border Crossing
SCAG Region:
Two Cross Streets and Zip
Code
SCAG Region:
One Cross Street and Zip Code
SCAG Region:
Zip Code only
Trips
Outside SCAG Region
No U.S. Trip Information
Total Trips
NB Pass. Vehicles Mexicali/Calexico
Downtown
559
642
392
64
26
1,683
SB Pass. Vehicles Mexicali/Calexico
Downtown
84
27
22
1
1
135
NB Pass. Vehicles Calexico
East
120
93
395
38
4
650
NB Pass. Vehicles Algodones
1 3 21 394 26 445
NB Pedestrians Mexicali/Calexico
Downtown
72
130
270
19
45
536
SB Pedestrians Mexicali/Calexico
Downtown
91
181
393
13
11
689
NB Pedestrians Algodones
0 5 17 330 28 380
SB Pedestrians Algodones
4 15 3 228 12 262
NB Commercial Trucks Calexico
East
42
102
129
34
349
656
SB Commercial Trucks Calexico
East
4
8
200
5
271
488
Total Trips 977 1,206 1,842 1,126 773 5,924
Maps were prepared from geocoded data for origins, destinations, cargo pick-up, and cargo drop
off locations. These maps are included, where applicable, in the Cross Border Travel Behavior
and Characteristics section of this report.
Imperial County Cross-Border Survey Rea & Parker Research Southern California Association of Governments June, 2007
11
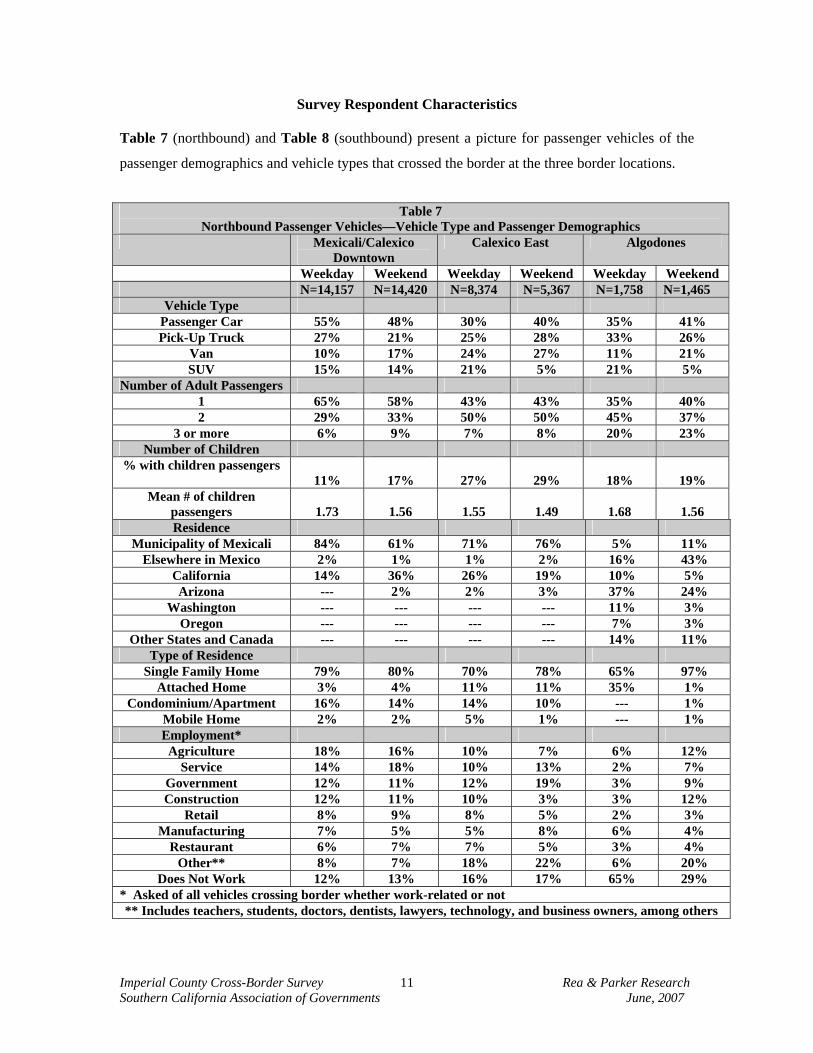
Survey Respondent Characteristics Table 7 (northbound) and Table 8 (southbound) present a picture for passenger vehicles of the
passenger demographics and vehicle types that crossed the border at the three border locations.
Table 7 Northbound Passenger Vehicles—Vehicle Type and Passenger Demographics Mexicali/Calexico
Downtown Calexico East Algodones
Weekday Weekend Weekday Weekend Weekday Weekend N=14,157 N=14,420 N=8,374 N=5,367 N=1,758 N=1,465
Vehicle Type Passenger Car 55% 48% 30% 40% 35% 41% Pick-Up Truck 27% 21% 25% 28% 33% 26%
Van 10% 17% 24% 27% 11% 21% SUV 15% 14% 21% 5% 21% 5%
Number of Adult Passengers 1 65% 58% 43% 43% 35% 40% 2 29% 33% 50% 50% 45% 37%
3 or more 6% 9% 7% 8% 20% 23% Number of Children
% with children passengers 11%
17%
27%
29%
18%
19%
Mean # of children passengers
1.73
1.56
1.55
1.49
1.68
1.56
Residence Municipality of Mexicali 84% 61% 71% 76% 5% 11%
Elsewhere in Mexico 2% 1% 1% 2% 16% 43% California 14% 36% 26% 19% 10% 5% Arizona --- 2% 2% 3% 37% 24%
Washington --- --- --- --- 11% 3% Oregon --- --- --- --- 7% 3%
Other States and Canada --- --- --- --- 14% 11% Type of Residence
Single Family Home 79% 80% 70% 78% 65% 97% Attached Home 3% 4% 11% 11% 35% 1%
Condominium/Apartment 16% 14% 14% 10% --- 1% Mobile Home 2% 2% 5% 1% --- 1% Employment* Agriculture 18% 16% 10% 7% 6% 12%
Service 14% 18% 10% 13% 2% 7% Government 12% 11% 12% 19% 3% 9% Construction 12% 11% 10% 3% 3% 12%
Retail 8% 9% 8% 5% 2% 3% Manufacturing 7% 5% 5% 8% 6% 4%
Restaurant 6% 7% 7% 5% 3% 4% Other** 8% 7% 18% 22% 6% 20%
Does Not Work 12% 13% 16% 17% 65% 29% * Asked of all vehicles crossing border whether work-related or not ** Includes teachers, students, doctors, dentists, lawyers, technology, and business owners, among others
Imperial County Cross-Border Survey Rea & Parker Research Southern California Association of Governments June, 2007
12
Table 7 depicts Mexicali/Calexico Downtown as having more passenger vehicles and a smaller
number of passengers per vehicle than the other two crossings, with 55 percent of weekday and
48 percent of weekend vehicles being passenger cars at Mexicali/Calexico Downtown. In
contrast there is a relatively even distribution among passenger cars, pick-up trucks and sports
utility vehicles at Calexico East and between passenger cars and pick-up trucks at Algodones,
particularly on weekdays.
Table 8
Southbound Passenger Vehicles Vehicle Type and Passenger Demographics
Mexicali/Calexico Downtown—Weekday only (N=21,089)
Vehicle Type Passenger Car 56% Pick-Up Truck 19%
Van 16% SUV 9%
Number of Adult Passengers 1 50% 2 38%
3 or more 12% Number of Children
% with children passengers 16% Mean # of children passengers 1.31
Residence Municipality of Mexicali 56%
Elsewhere in Mexico 1% California 43%
Type of Residence Single Family Home 87%
Attached Home 3% Condominium/Apartment 9%
Mobile Home 1% Employment*
Agriculture 14% Service 21%
Government 4% Construction 4%
Retail 6% Manufacturing 3%
Restaurant 2% Other** 24%
Does Not Work 21% * Asked of all vehicles crossing border whether work-related or not ** Includes teachers, students, doctors, dentists, lawyers, technology and business owners, among others
Imperial County Cross-Border Survey Rea & Parker Research Southern California Association of Governments June, 2007
13
Single adult occupant vehicles represent the majority (65 percent weekday and 58 percent
weekend) of Mexicali/Calexico passenger vehicle crossings in contrast to closer to 40 percent at
the other two sites. Consistent with that, children are much more prevalent in Calexico East
passenger vehicles (27 percent weekday and 29 percent weekend). Northbound crossers mostly
live in the Municipality of Mexicali (61 percent to 84 percent, depending upon day of week and
direction) for the Mexicali/Calexico Downtown and Calexico East crossings; whereas, Algodones
has crossers from other parts of Mexico (16 percent weekday and 43 percent weekend) and from
many parts of the United States, with Arizona most represented among U.S. residence locations
(37 percent weekday and 24 percent weekend). Calexico and other Imperial Valley communities
are the residence locations for all but 2 percent to 4 percent of the 28 percent (weekday) to 38
percent (weekend) U.S. resident passenger vehicle border crossers at Mexicali/Calexico
Downtown and all but 6 percent to 8 percent of U.S. resident passenger vehicle border crossers
(28 percent weekday and 22 percent weekend) at Calexico East. Weekend passenger vehicle
crossers at Calexico East demonstrate the greatest non-Imperial Valley component—3 percent
from Arizona and 5 percent from other parts of California.
Most survey participants live in single family residences (65 percent to 97 percent) and are
employed in a diverse cross-section of occupational categories, with agriculture, service, and
government somewhat more numerous. Algodones has a large contingent of individuals who are
not working—especially weekday crossers (65 percent), which is consistent with the winter
visitors to nearby Yuma who are retirees from colder weather locations.
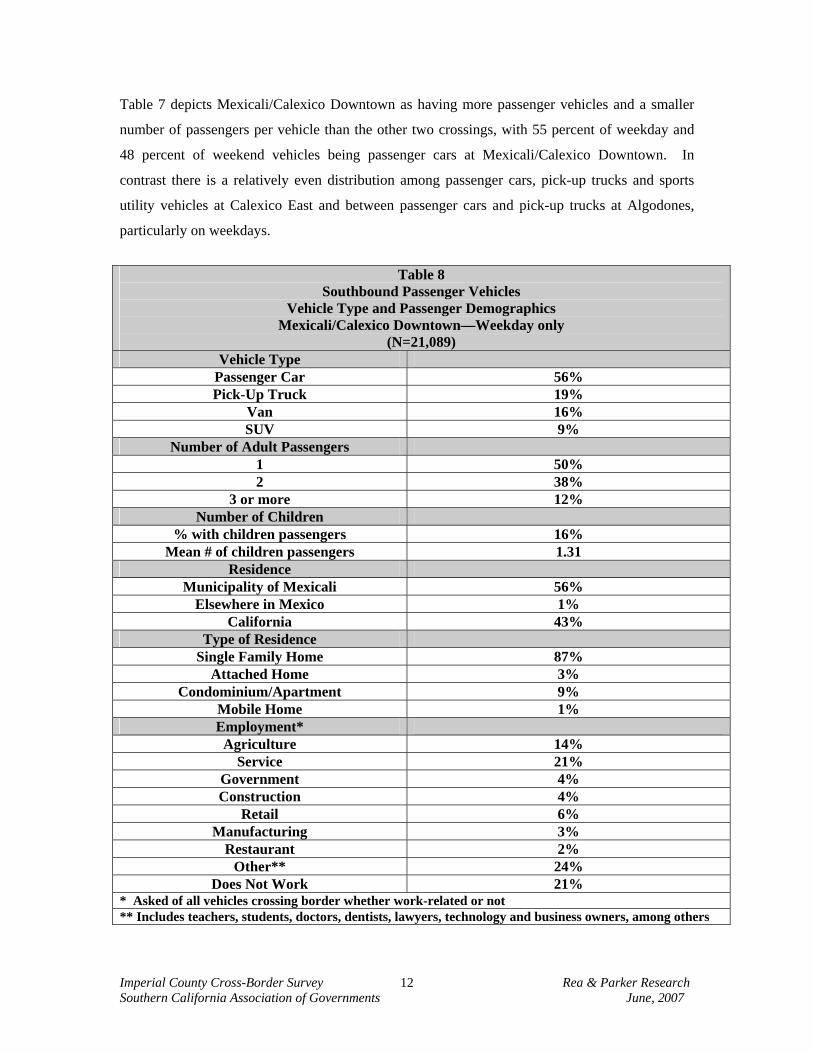
Table 8 presents the same information for weekday southbound passenger vehicles interviewed at
Mexicali/Calexico Downtown. Table 7 is consistent with the Mexicali/Calexico Downtown data
in Table 6—passenger cars (56 percent), single occupant vehicles (50 percent), Mexicali
residence (56 percent) and single family home (87 percent). Employment differs somewhat, with
service increasing from 14 percent weekday northbound to 21 percent southbound, government
and construction both declining from 12 percent to 4 percent, and non-workers increasing from
12 percent to 21 percent.
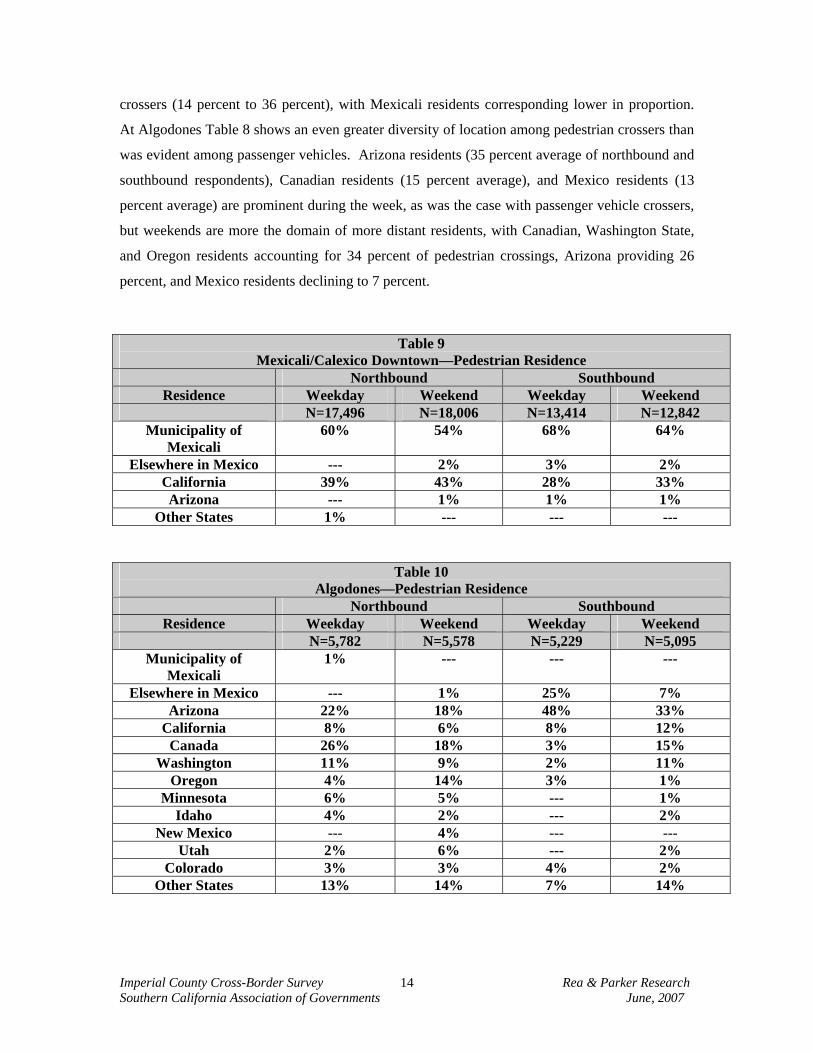
Table 9 and Table 10 show residential locations for northbound and southbound pedestrian
border crossers at Mexicali/Calexico Downtown and at Algodones. Table 9 indicates that
California residents are a larger part of pedestrian crossers at Mexicali/Calexico Downtown (28
percent to 43 percent depending upon direction and day of week) than they are among vehicle
Imperial County Cross-Border Survey Rea & Parker Research Southern California Association of Governments June, 2007
14
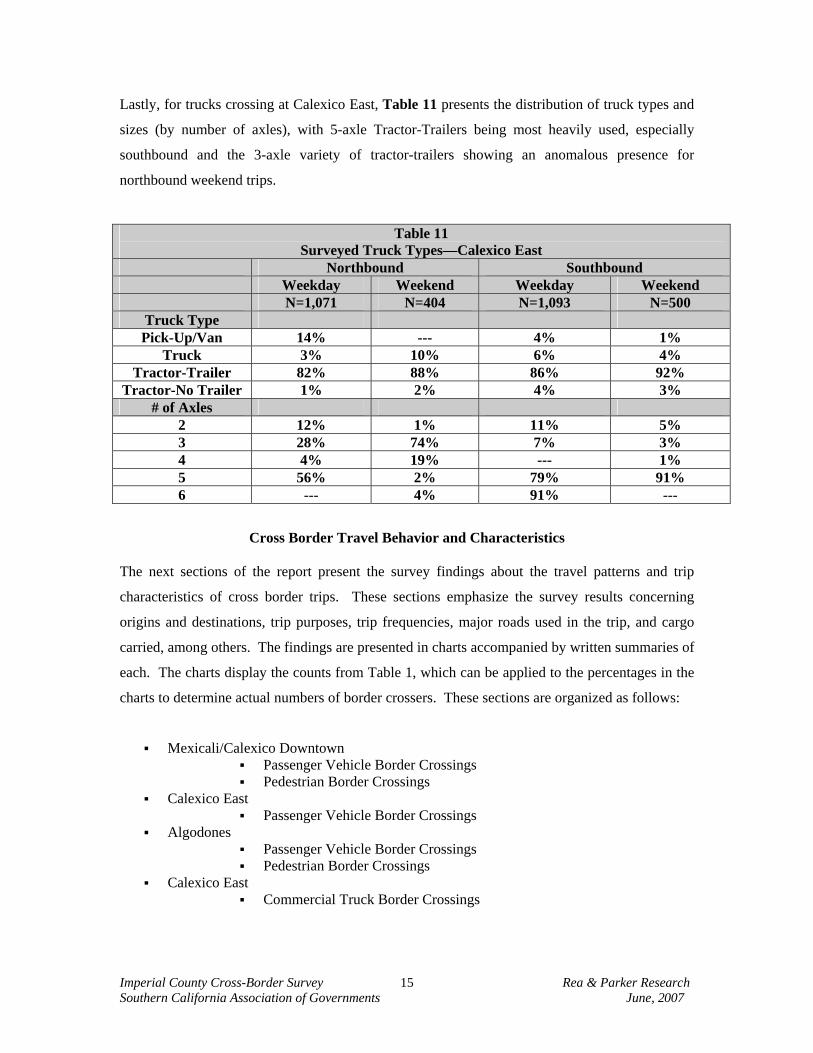
crossers (14 percent to 36 percent), with Mexicali residents corresponding lower in proportion.
At Algodones Table 8 shows an even greater diversity of location among pedestrian crossers than
was evident among passenger vehicles. Arizona residents (35 percent average of northbound and
southbound respondents), Canadian residents (15 percent average), and Mexico residents (13
percent average) are prominent during the week, as was the case with passenger vehicle crossers,
but weekends are more the domain of more distant residents, with Canadian, Washington State,
and Oregon residents accounting for 34 percent of pedestrian crossings, Arizona providing 26
percent, and Mexico residents declining to 7 percent.
Table 9 Mexicali/Calexico Downtown—Pedestrian Residence
Northbound Southbound Residence Weekday Weekend Weekday Weekend
N=17,496 N=18,006 N=13,414 N=12,842 Municipality of
Mexicali 60% 54% 68% 64%
Elsewhere in Mexico --- 2% 3% 2% California 39% 43% 28% 33% Arizona --- 1% 1% 1%
Other States 1% --- --- ---
Table 10 Algodones—Pedestrian Residence
Northbound Southbound Residence Weekday Weekend Weekday Weekend
N=5,782 N=5,578 N=5,229 N=5,095 Municipality of
Mexicali 1% --- --- ---
Elsewhere in Mexico --- 1% 25% 7% Arizona 22% 18% 48% 33%
California 8% 6% 8% 12% Canada 26% 18% 3% 15%
Washington 11% 9% 2% 11% Oregon 4% 14% 3% 1%
Minnesota 6% 5% --- 1% Idaho 4% 2% --- 2%
New Mexico --- 4% --- --- Utah 2% 6% --- 2%
Colorado 3% 3% 4% 2% Other States 13% 14% 7% 14%
Imperial County Cross-Border Survey Rea & Parker Research Southern California Association of Governments June, 2007
15
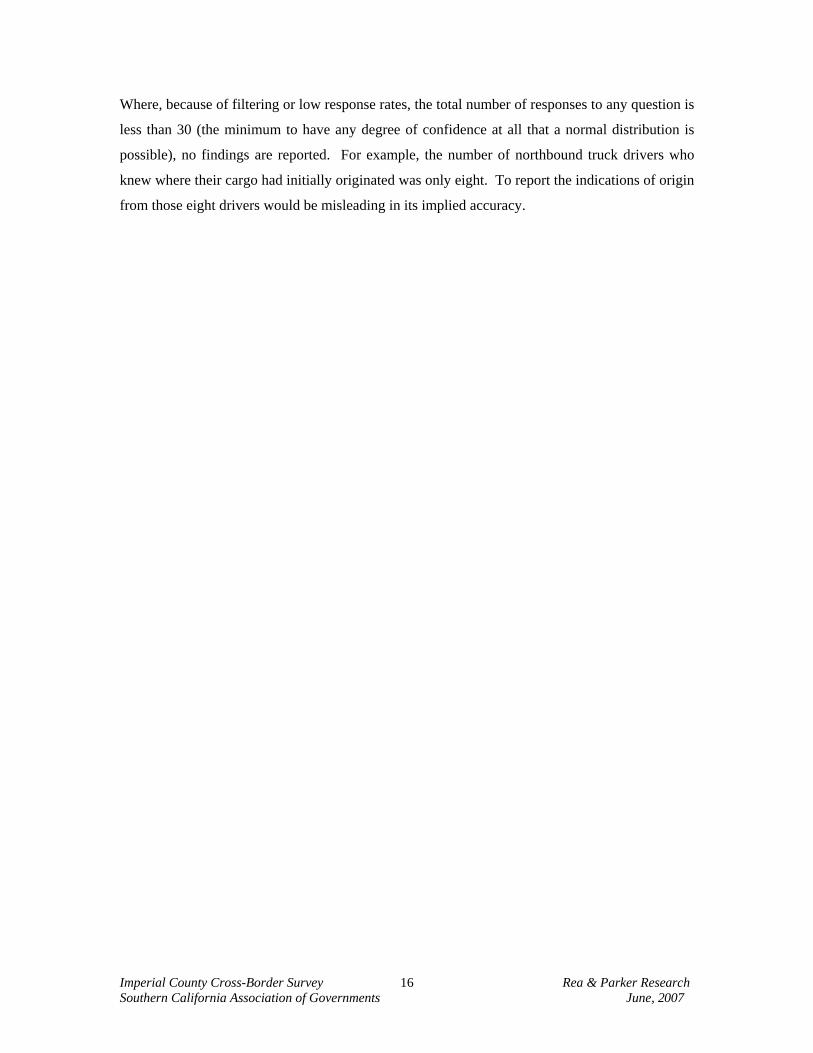
Lastly, for trucks crossing at Calexico East, Table 11 presents the distribution of truck types and
sizes (by number of axles), with 5-axle Tractor-Trailers being most heavily used, especially
southbound and the 3-axle variety of tractor-trailers showing an anomalous presence for
northbound weekend trips.
Table 11 Surveyed Truck Types—Calexico East
Northbound Southbound Weekday Weekend Weekday Weekend N=1,071 N=404 N=1,093 N=500
Truck Type Pick-Up/Van 14% --- 4% 1%
Truck 3% 10% 6% 4% Tractor-Trailer 82% 88% 86% 92%
Tractor-No Trailer 1% 2% 4% 3% # of Axles
2 12% 1% 11% 5% 3 28% 74% 7% 3% 4 4% 19% --- 1% 5 56% 2% 79% 91% 6 --- 4% 91% ---
Cross Border Travel Behavior and Characteristics
The next sections of the report present the survey findings about the travel patterns and trip
characteristics of cross border trips. These sections emphasize the survey results concerning
origins and destinations, trip purposes, trip frequencies, major roads used in the trip, and cargo
carried, among others. The findings are presented in charts accompanied by written summaries of
each. The charts display the counts from Table 1, which can be applied to the percentages in the
charts to determine actual numbers of border crossers. These sections are organized as follows:
Mexicali/Calexico Downtown Passenger Vehicle Border Crossings Pedestrian Border Crossings
Calexico East Passenger Vehicle Border Crossings
Algodones Passenger Vehicle Border Crossings Pedestrian Border Crossings
Calexico East Commercial Truck Border Crossings
Imperial County Cross-Border Survey Rea & Parker Research Southern California Association of Governments June, 2007
16
Where, because of filtering or low response rates, the total number of responses to any question is
less than 30 (the minimum to have any degree of confidence at all that a normal distribution is
possible), no findings are reported. For example, the number of northbound truck drivers who
knew where their cargo had initially originated was only eight. To report the indications of origin
from those eight drivers would be misleading in its implied accuracy.
Imperial County Cross-Border Survey Rea & Parker Research Southern California Association of Governments June, 2007
17
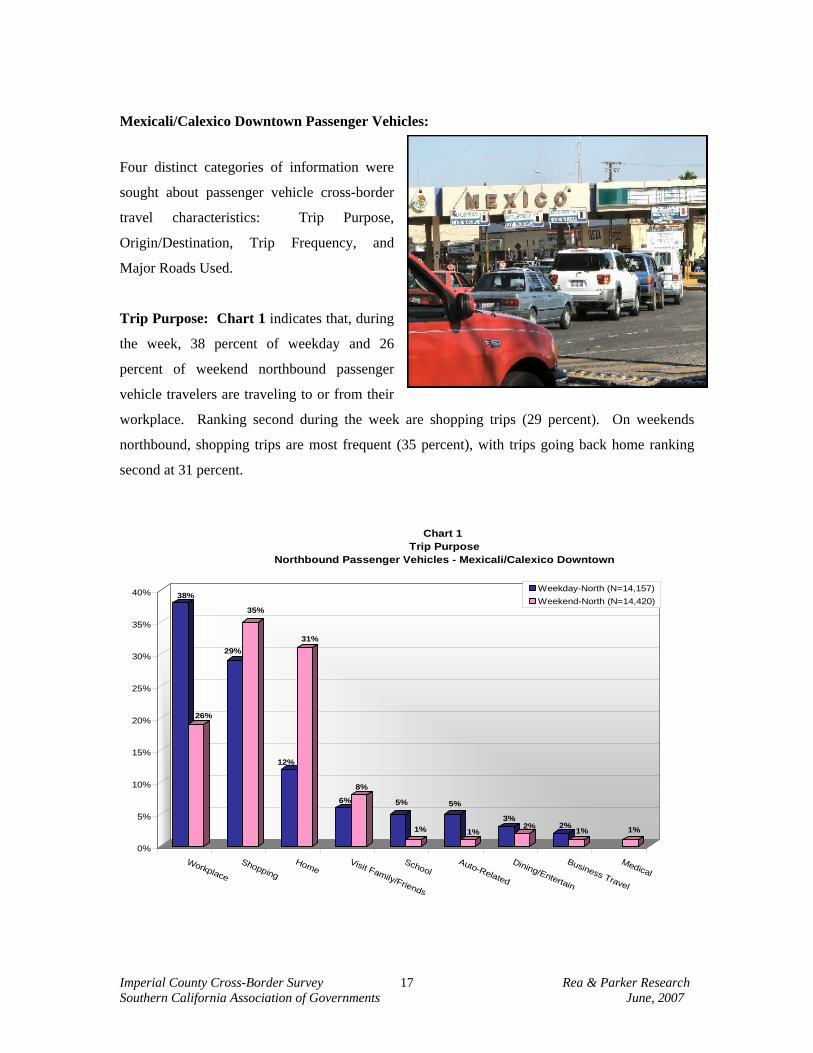
Mexicali/Calexico Downtown Passenger Vehicles: Four distinct categories of information were
sought about passenger vehicle cross-border
travel characteristics: Trip Purpose,
Origin/Destination, Trip Frequency, and
Major Roads Used.
Trip Purpose: Chart 1 indicates that, during
the week, 38 percent of weekday and 26
percent of weekend northbound passenger
vehicle travelers are traveling to or from their
workplace. Ranking second during the week are shopping trips (29 percent). On weekends
northbound, shopping trips are most frequent (35 percent), with trips going back home ranking
second at 31 percent.
38%
26%
29%
35%
12%
31%
6%
8%
5%
1%
5%
1%
3%2% 2%
1% 1%
0%
5%
10%
15%
20%
25%
30%
35%
40%
Workplace
ShoppingHome
Visit Family/Friends
SchoolAuto-Related
Dining/Entertain
Business Travel
Medical
Chart 1 Trip Purpose
Northbound Passenger Vehicles - Mexicali/Calexico Downtown
Weekday-North (N=14,157)Weekend-North (N=14,420)
Imperial County Cross-Border Survey Rea & Parker Research Southern California Association of Governments June, 2007
18
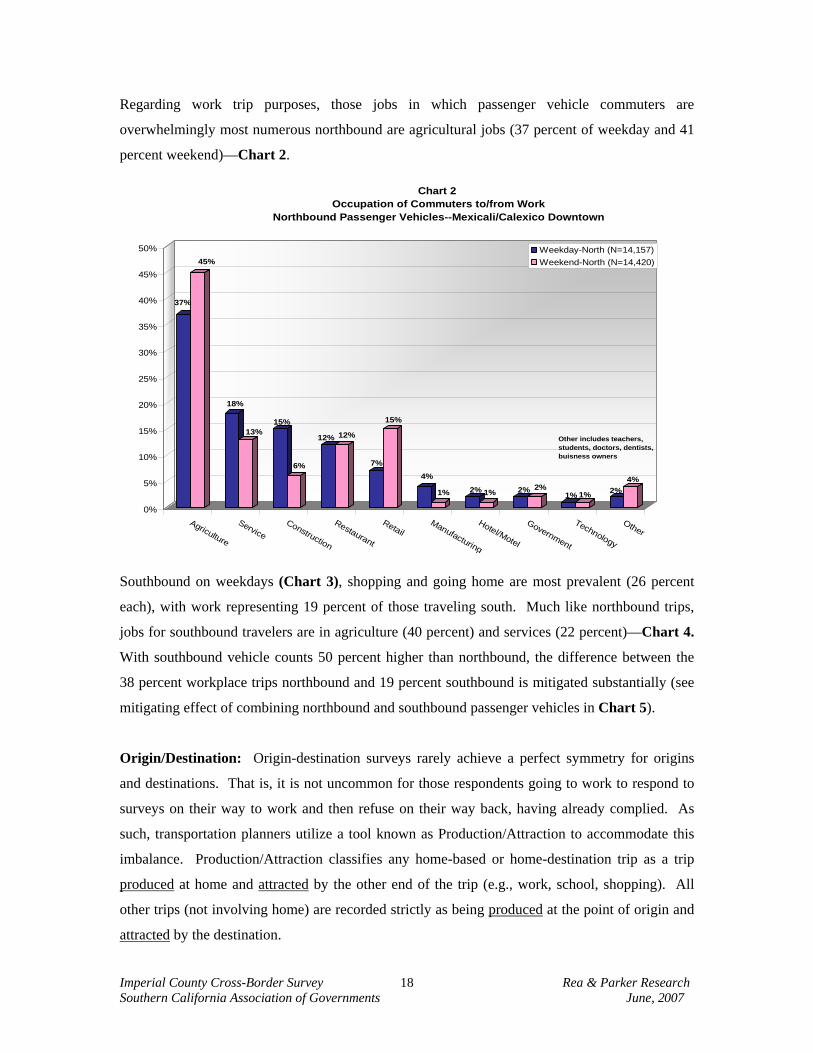
Regarding work trip purposes, those jobs in which passenger vehicle commuters are
overwhelmingly most numerous northbound are agricultural jobs (37 percent of weekday and 41
percent weekend)—Chart 2.
37%
45%
18%
13%15%
6%
12% 12%
7%
15%
4%
1% 2% 1% 2% 2%1% 1% 2%
4%
0%
5%
10%
15%
20%
25%
30%
35%
40%
45%
50%
Agriculture
ServiceConstruction
Restaurant
RetailManufacturing
Hotel/Motel
Government
Technology
Other
Chart 2 Occupation of Commuters to/from Work
Northbound Passenger Vehicles--Mexicali/Calexico Downtown
Weekday-North (N=14,157)Weekend-North (N=14,420)
Other includes teachers, students, doctors, dentists, buisness owners
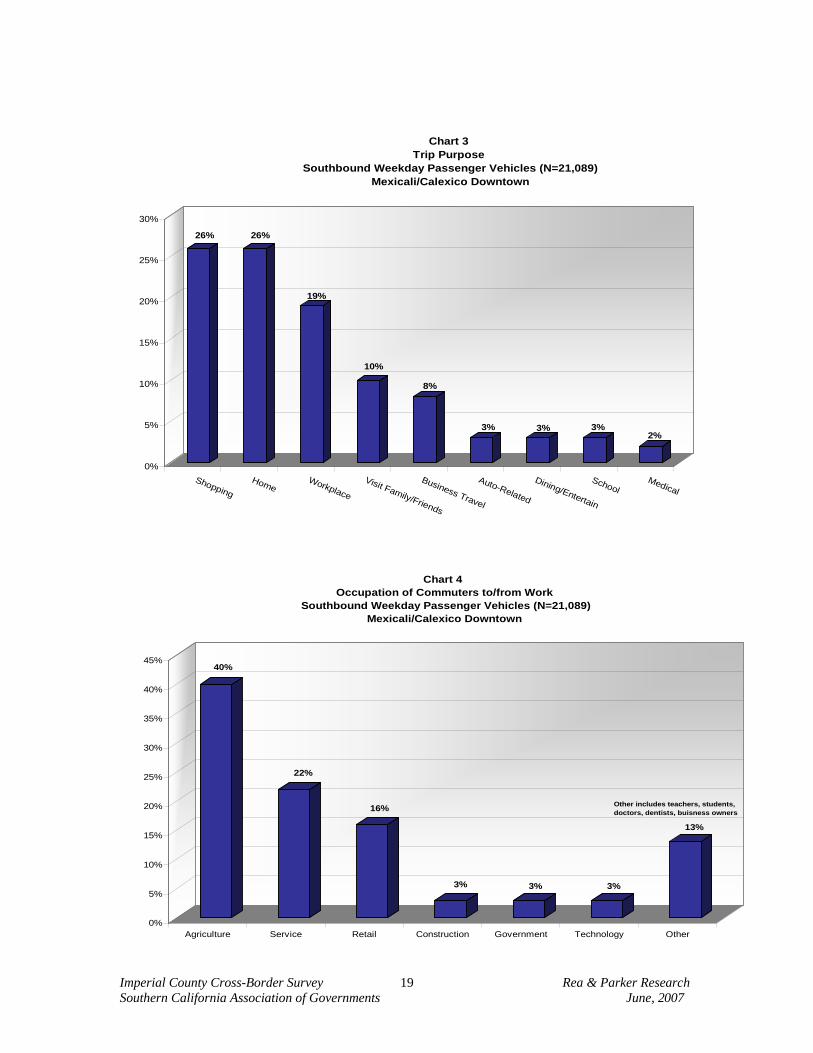
Southbound on weekdays (Chart 3), shopping and going home are most prevalent (26 percent
each), with work representing 19 percent of those traveling south. Much like northbound trips,
jobs for southbound travelers are in agriculture (40 percent) and services (22 percent)—Chart 4.
With southbound vehicle counts 50 percent higher than northbound, the difference between the
38 percent workplace trips northbound and 19 percent southbound is mitigated substantially (see
mitigating effect of combining northbound and southbound passenger vehicles in Chart 5).
Origin/Destination: Origin-destination surveys rarely achieve a perfect symmetry for origins
and destinations. That is, it is not uncommon for those respondents going to work to respond to
surveys on their way to work and then refuse on their way back, having already complied. As
such, transportation planners utilize a tool known as Production/Attraction to accommodate this
imbalance. Production/Attraction classifies any home-based or home-destination trip as a trip
produced at home and attracted by the other end of the trip (e.g., work, school, shopping). All
other trips (not involving home) are recorded strictly as being produced at the point of origin and
attracted by the destination.
Imperial County Cross-Border Survey Rea & Parker Research Southern California Association of Governments June, 2007
19
26% 26%
19%
10%
8%
3% 3% 3%2%
0%
5%
10%
15%
20%
25%
30%
ShoppingHome
Workplace
Visit Family/Friends
Business Travel
Auto-Related
Dining/Entertain
SchoolMedical
Chart 3 Trip Purpose
Southbound Weekday Passenger Vehicles (N=21,089) Mexicali/Calexico Downtown
40%
22%
16%
3% 3% 3%
13%
0%
5%
10%
15%
20%
25%
30%
35%
40%
45%
Agriculture Service Retail Construction Government Technology Other
Chart 4 Occupation of Commuters to/from Work
Southbound Weekday Passenger Vehicles (N=21,089) Mexicali/Calexico Downtown
Other includes teachers, students, doctors, dentists, buisness owners
Imperial County Cross-Border Survey Rea & Parker Research Southern California Association of Governments June, 2007
20
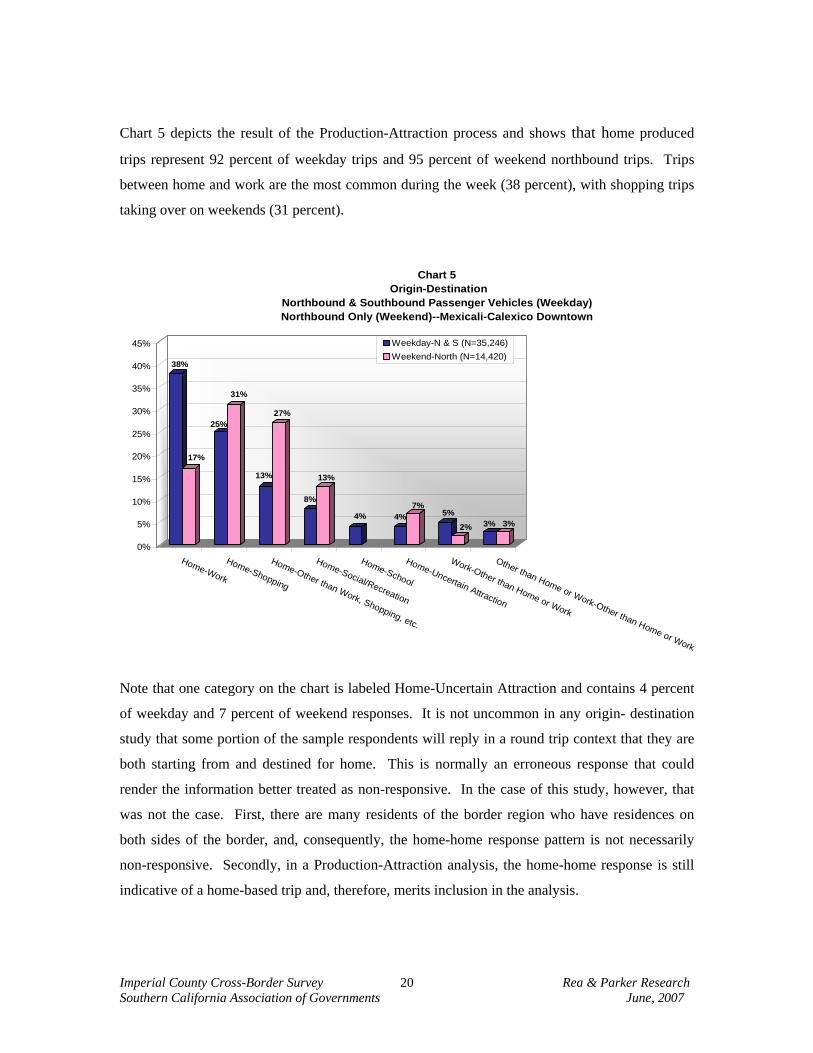
Chart 5 depicts the result of the Production-Attraction process and shows that home produced
trips represent 92 percent of weekday trips and 95 percent of weekend northbound trips. Trips
between home and work are the most common during the week (38 percent), with shopping trips
taking over on weekends (31 percent).
38%
17%
25%
31%
13%
27%
8%
13%
4% 4%7%
5%
2% 3% 3%
0%
5%
10%
15%
20%
25%
30%
35%
40%
45%
Home-Work
Home-Shopping
Home-Other than Work, Shopping, etc.
Home-Social/Recreation
Home-School
Home-Uncertain Attraction
Work-Other than Home or Work
Other than Home or Work-Other than Home or Work
Chart 5 Origin-Destination
Northbound & Southbound Passenger Vehicles (Weekday)Northbound Only (Weekend)--Mexicali-Calexico Downtown
Weekday-N & S (N=35,246)Weekend-North (N=14,420)
Note that one category on the chart is labeled Home-Uncertain Attraction and contains 4 percent
of weekday and 7 percent of weekend responses. It is not uncommon in any origin- destination
study that some portion of the sample respondents will reply in a round trip context that they are
both starting from and destined for home. This is normally an erroneous response that could
render the information better treated as non-responsive. In the case of this study, however, that
was not the case. First, there are many residents of the border region who have residences on
both sides of the border, and, consequently, the home-home response pattern is not necessarily
non-responsive. Secondly, in a Production-Attraction analysis, the home-home response is still
indicative of a home-based trip and, therefore, merits inclusion in the analysis.
Imperial County Cross-Border Survey Rea & Parker Research Southern California Association of Governments June, 2007
21
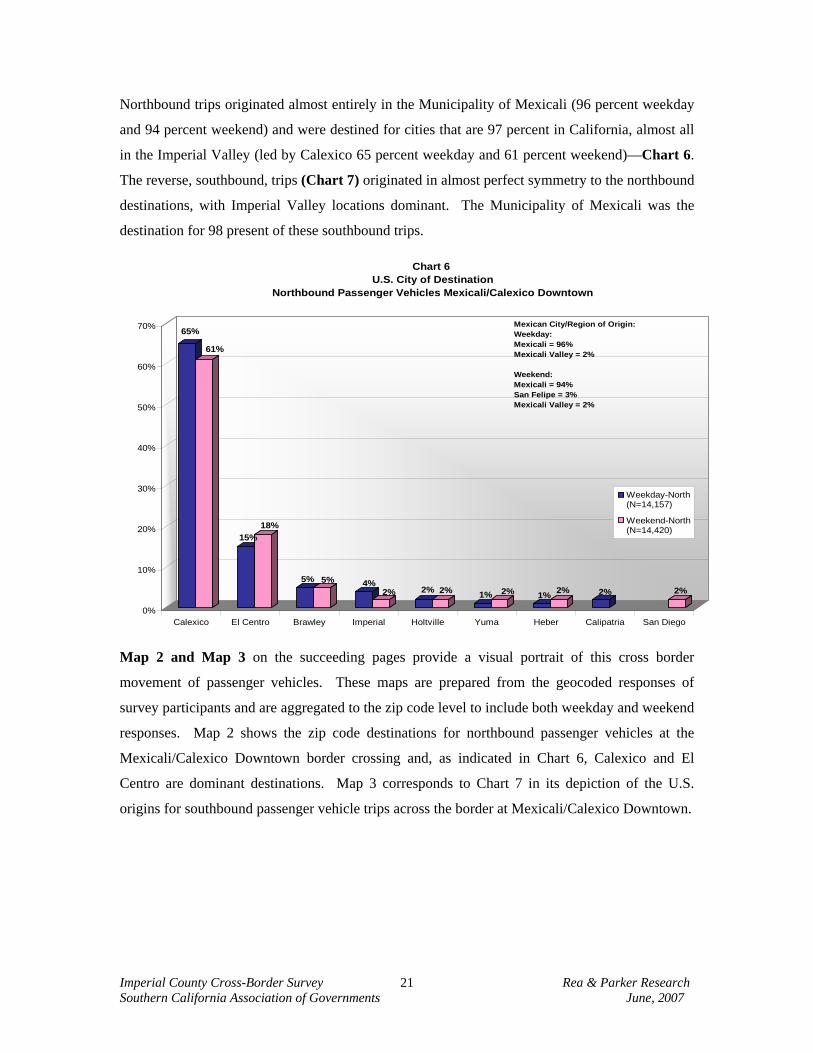
Northbound trips originated almost entirely in the Municipality of Mexicali (96 percent weekday
and 94 percent weekend) and were destined for cities that are 97 percent in California, almost all
in the Imperial Valley (led by Calexico 65 percent weekday and 61 percent weekend)—Chart 6.
The reverse, southbound, trips (Chart 7) originated in almost perfect symmetry to the northbound
destinations, with Imperial Valley locations dominant. The Municipality of Mexicali was the
destination for 98 present of these southbound trips.
65%
61%
15%18%
5% 5% 4%2% 2% 2% 1% 2% 1% 2% 2% 2%
0%
10%
20%
30%
40%
50%
60%
70%
Calexico El Centro Brawley Imperial Holtville Yuma Heber Calipatria San Diego
Chart 6 U.S. City of Destination
Northbound Passenger Vehicles Mexicali/Calexico Downtown
Weekday-North(N=14,157)
Weekend-North(N=14,420)
Mexican City/Region of Origin:Weekday: Mexicali = 96%Mexicali Valley = 2%
Weekend:Mexicali = 94%San Felipe = 3% Mexicali Valley = 2%
Map 2 and Map 3 on the succeeding pages provide a visual portrait of this cross border
movement of passenger vehicles. These maps are prepared from the geocoded responses of
survey participants and are aggregated to the zip code level to include both weekday and weekend
responses. Map 2 shows the zip code destinations for northbound passenger vehicles at the
Mexicali/Calexico Downtown border crossing and, as indicated in Chart 6, Calexico and El
Centro are dominant destinations. Map 3 corresponds to Chart 7 in its depiction of the U.S.
origins for southbound passenger vehicle trips across the border at Mexicali/Calexico Downtown.
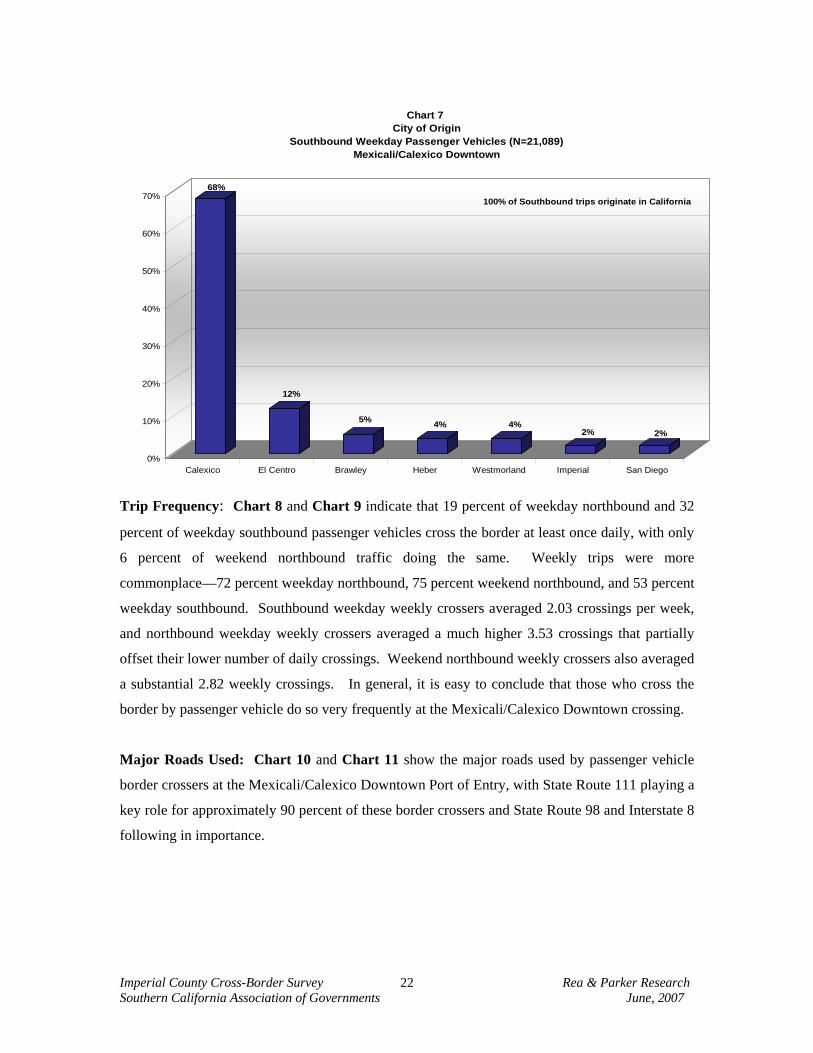
Imperial County Cross-Border Survey Rea & Parker Research Southern California Association of Governments June, 2007
22
68%
12%
5% 4% 4%2% 2%
0%
10%
20%
30%
40%
50%
60%
70%
Calexico El Centro Brawley Heber Westmorland Imperial San Diego
Chart 7 City of Origin
Southbound Weekday Passenger Vehicles (N=21,089) Mexicali/Calexico Downtown
100% of Southbound trips originate in California
Trip Frequency: Chart 8 and Chart 9 indicate that 19 percent of weekday northbound and 32
percent of weekday southbound passenger vehicles cross the border at least once daily, with only
6 percent of weekend northbound traffic doing the same. Weekly trips were more
commonplace—72 percent weekday northbound, 75 percent weekend northbound, and 53 percent
weekday southbound. Southbound weekday weekly crossers averaged 2.03 crossings per week,
and northbound weekday weekly crossers averaged a much higher 3.53 crossings that partially
offset their lower number of daily crossings. Weekend northbound weekly crossers also averaged
a substantial 2.82 weekly crossings. In general, it is easy to conclude that those who cross the
border by passenger vehicle do so very frequently at the Mexicali/Calexico Downtown crossing.
Major Roads Used: Chart 10 and Chart 11 show the major roads used by passenger vehicle
border crossers at the Mexicali/Calexico Downtown Port of Entry, with State Route 111 playing a
key role for approximately 90 percent of these border crossers and State Route 98 and Interstate 8
following in importance.
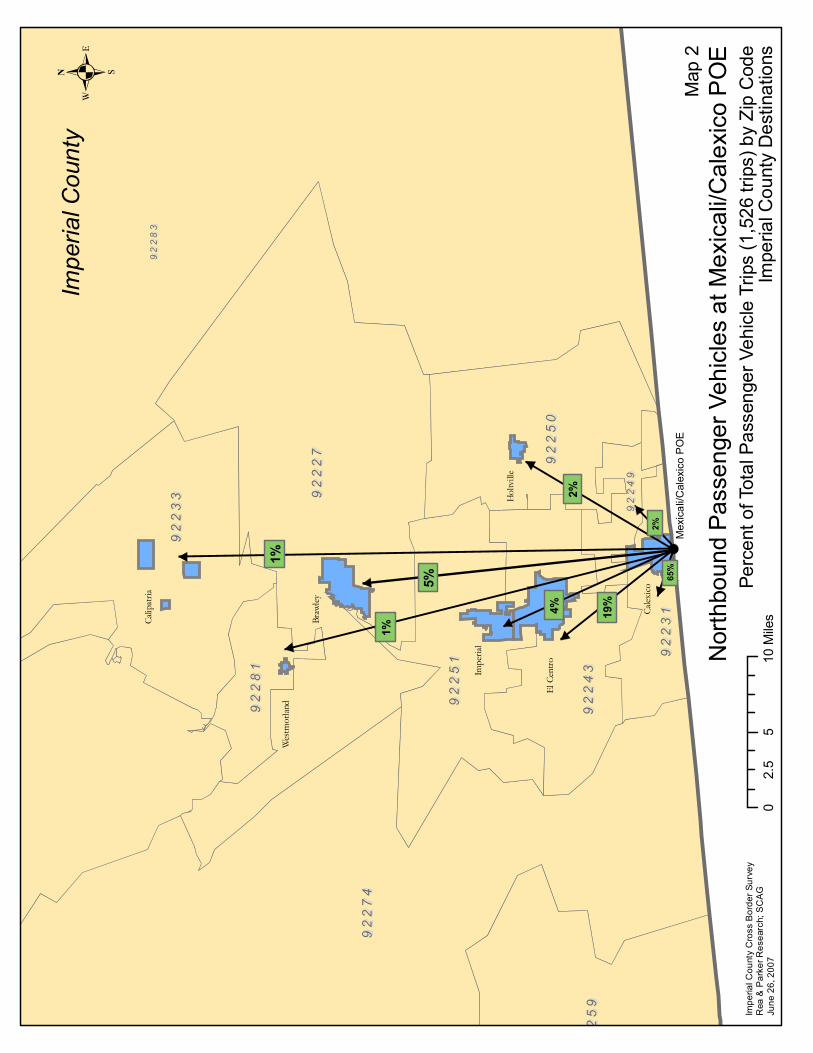
Mex
ical
i/Cal
exic
oP
OE
Calip
atria
Wes
tmor
land
Braw
ley
Impe
rial
ElCe
ntro
Calex
ico
Hol
tvill
e
92
28
39
22
83
92
27
49
22
74
92
22
79
22
27
92
25
99
22
59
92
25
19
22
51
92
24
39
22
43
92
25
09
22
50
92
23
19
22
31
92
28
19
22
81
92
24
99
22
49
92
23
39
22
33
65%
5%
1%
19%
2%
2%
4%
1%
.
Impe
rialC
ount
yC
ross
Bor
derS
urve
yR
ea&
Par
kerR
esea
rch;
SC
AG
June
26,2
007
05
102.
5M
iles
Impe
rialC
ount
y
Nor
thbo
und
Pass
enge
rVeh
icle
sat
Mex
ical
i/Cal
exic
oP
OE
Perc
ento
fTot
alP
asse
nger
Vehi
cle
Trip
s(1
,526
trips
)by
Zip
Cod
eIm
peria
lCou
nty
Des
tinat
ions
Map
2
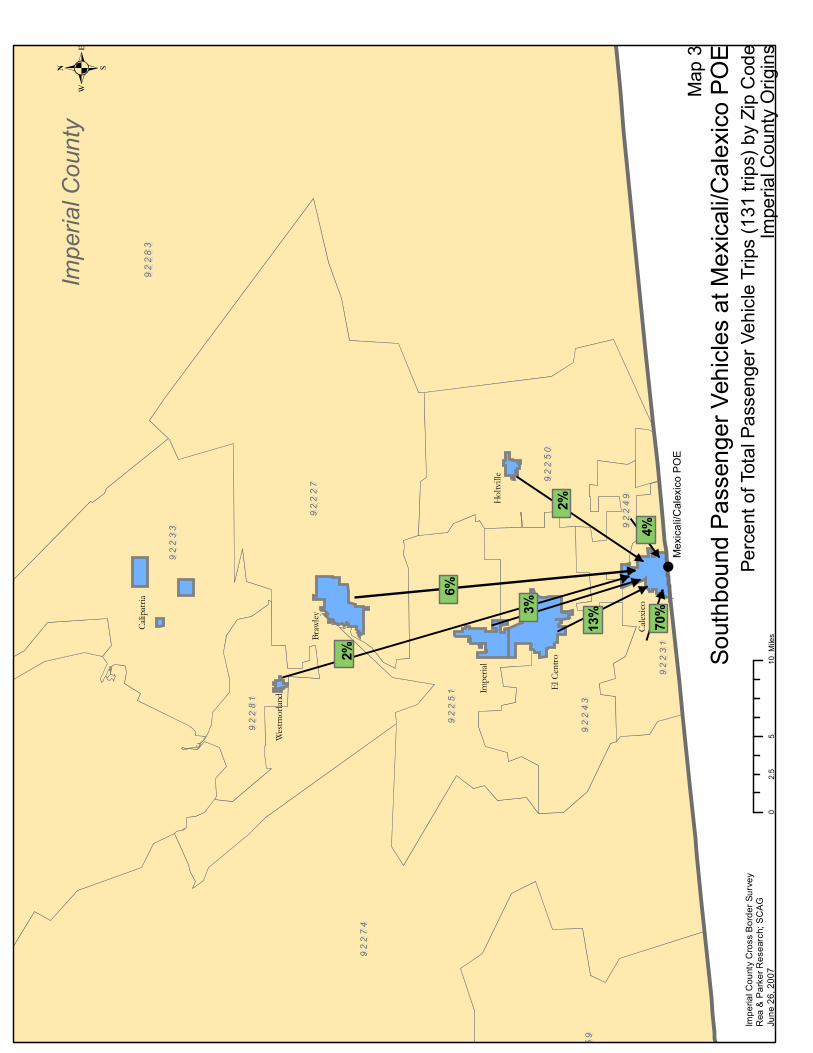
Mex
ical
i/Cal
exic
oP
OE
Calip
atria
Wes
tmor
land
Braw
ley
Impe
rial
ElCe
ntro
Calex
ico
Hol
tvill
e
92
28
39
22
83
2%
6%
3%
2%
4%
13%
70%
92
27
49
22
74
92
22
79
22
27
22
59
22
59
92
25
19
22
51
92
24
39
22
43
92
25
09
22
50
92
23
19
22
31
92
28
19
22
81
92
24
99
22
49
92
23
39
22
33
.
Impe
rialC
ount
yC
ross
Bor
derS
urve
yR
ea&
Par
kerR
esea
rch;
SC
AG
June
26,2
007
05
102.
5M
iles
Impe
rialC
ount
y
Sout
hbou
ndPa
ssen
gerV
ehic
les
atM
exic
ali/C
alex
ico
POE
Perc
ento
fTot
alP
asse
nger
Vehi
cle
Trip
s(1
31tri
ps)b
yZi
pC
ode
Impe
rialC
ount
yO
rigin
s
Map
3
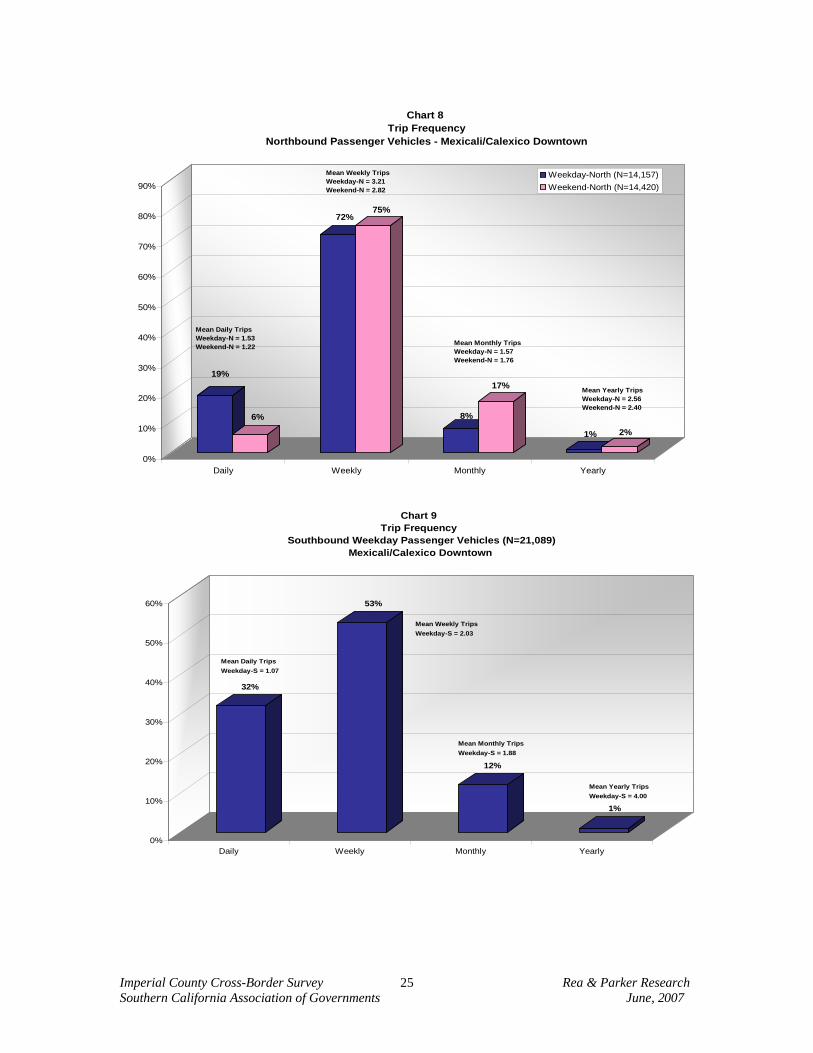
Imperial County Cross-Border Survey Rea & Parker Research Southern California Association of Governments June, 2007
25
19%
6%
72%75%
8%
17%
1% 2%
0%
10%
20%
30%
40%
50%
60%
70%
80%
90%
Daily Weekly Monthly Yearly
Chart 8 Trip Frequency
Northbound Passenger Vehicles - Mexicali/Calexico Downtown
Weekday-North (N=14,157)Weekend-North (N=14,420)
Mean Daily TripsWeekday-N = 1.53Weekend-N = 1.22
Mean Weekly TripsWeekday-N = 3.21Weekend-N = 2.82
Mean Monthly TripsWeekday-N = 1.57Weekend-N = 1.76
Mean Yearly TripsWeekday-N = 2.56Weekend-N = 2.40
32%
53%
12%
1%
0%
10%
20%
30%
40%
50%
60%
Daily Weekly Monthly Yearly
Chart 9 Trip Frequency
Southbound Weekday Passenger Vehicles (N=21,089) Mexicali/Calexico Downtown
Mean Daily TripsWeekday-S = 1.07
Mean Weekly TripsWeekday-S = 2.03
Mean Monthly TripsWeekday-S = 1.88
Mean Yearly TripsWeekday-S = 4.00
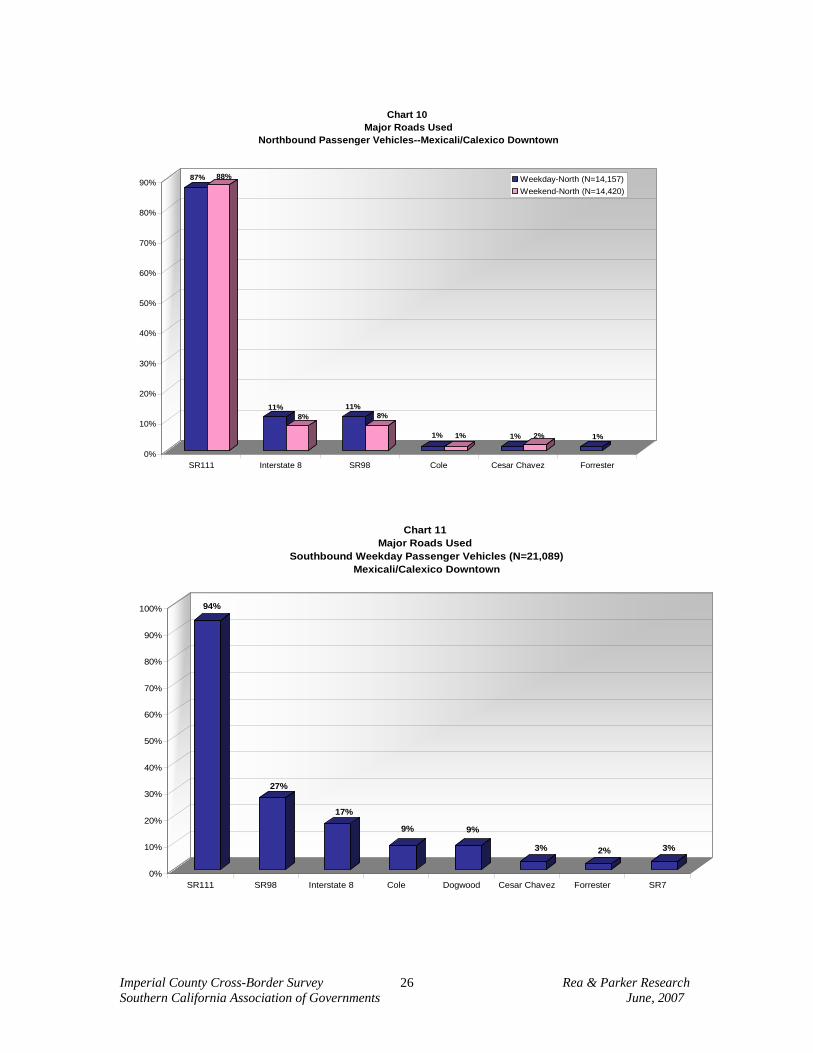
Imperial County Cross-Border Survey Rea & Parker Research Southern California Association of Governments June, 2007
26
87% 88%
11%8%
11%8%
1% 1% 1% 2% 1%
0%
10%
20%
30%
40%
50%
60%
70%
80%
90%
SR111 Interstate 8 SR98 Cole Cesar Chavez Forrester
Chart 10 Major Roads Used
Northbound Passenger Vehicles--Mexicali/Calexico Downtown
Weekday-North (N=14,157)Weekend-North (N=14,420)
94%
27%
17%
9% 9%
3% 2% 3%
0%
10%
20%
30%
40%
50%
60%
70%
80%
90%
100%
SR111 SR98 Interstate 8 Cole Dogwood Cesar Chavez Forrester SR7
Chart 11 Major Roads Used
Southbound Weekday Passenger Vehicles (N=21,089) Mexicali/Calexico Downtown
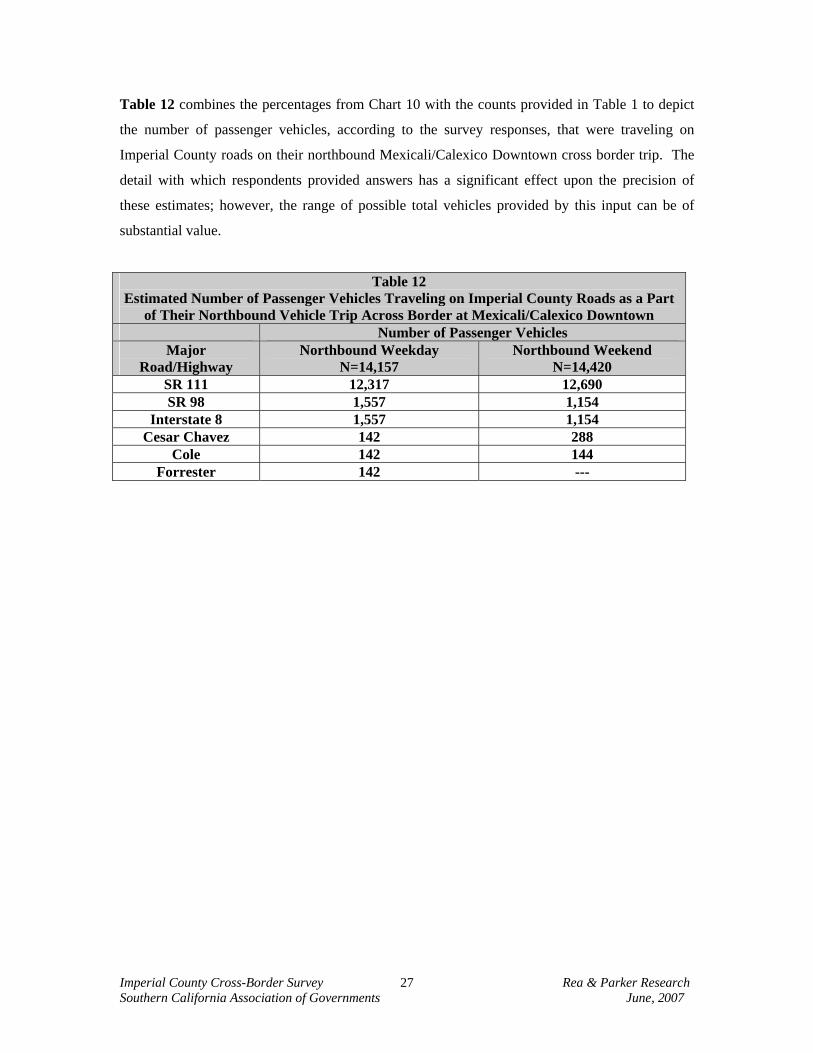
Imperial County Cross-Border Survey Rea & Parker Research Southern California Association of Governments June, 2007
27
Table 12 combines the percentages from Chart 10 with the counts provided in Table 1 to depict
the number of passenger vehicles, according to the survey responses, that were traveling on
Imperial County roads on their northbound Mexicali/Calexico Downtown cross border trip. The
detail with which respondents provided answers has a significant effect upon the precision of
these estimates; however, the range of possible total vehicles provided by this input can be of
substantial value.
Table 12 Estimated Number of Passenger Vehicles Traveling on Imperial County Roads as a Part
of Their Northbound Vehicle Trip Across Border at Mexicali/Calexico Downtown Number of Passenger Vehicles
Major Road/Highway
Northbound Weekday N=14,157
Northbound Weekend N=14,420
SR 111 12,317 12,690 SR 98 1,557 1,154
Interstate 8 1,557 1,154 Cesar Chavez 142 288
Cole 142 144 Forrester 142 ---
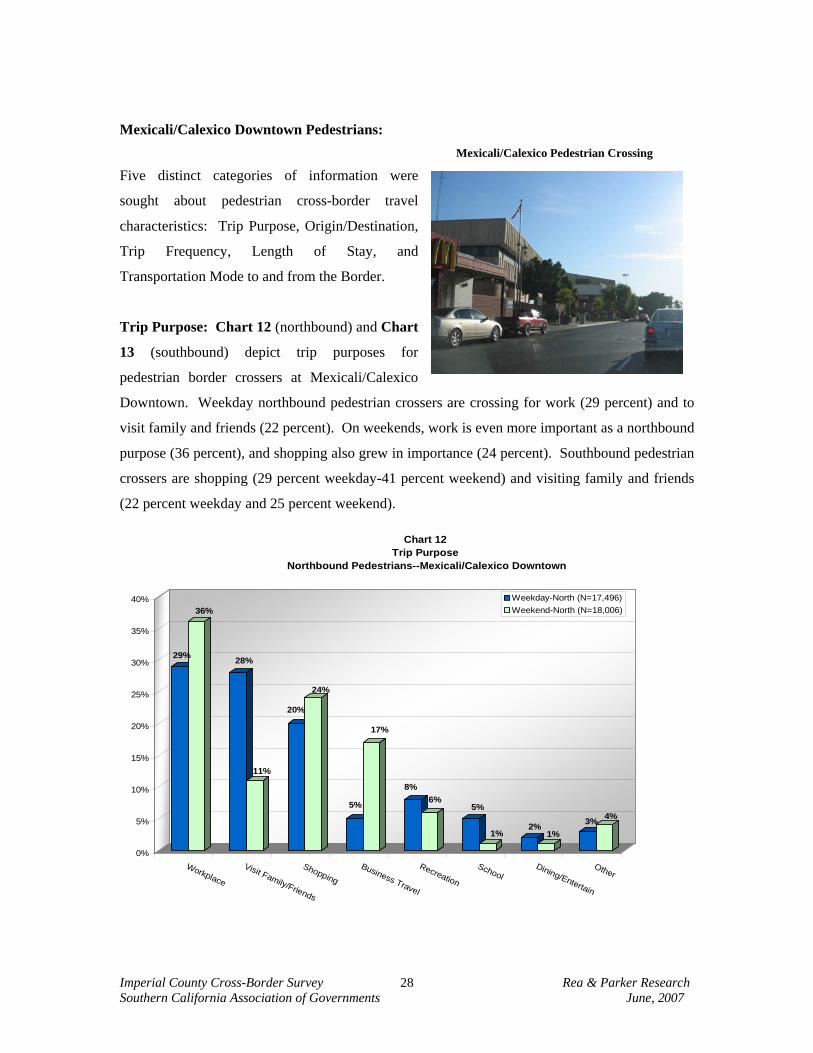
Imperial County Cross-Border Survey Rea & Parker Research Southern California Association of Governments June, 2007
28
Mexicali/Calexico Downtown Pedestrians: Mexicali/Calexico Pedestrian Crossing
Five distinct categories of information were
sought about pedestrian cross-border travel
characteristics: Trip Purpose, Origin/Destination,
Trip Frequency, Length of Stay, and
Transportation Mode to and from the Border.
Trip Purpose: Chart 12 (northbound) and Chart
13 (southbound) depict trip purposes for
pedestrian border crossers at Mexicali/Calexico
Downtown. Weekday northbound pedestrian crossers are crossing for work (29 percent) and to
visit family and friends (22 percent). On weekends, work is even more important as a northbound
purpose (36 percent), and shopping also grew in importance (24 percent). Southbound pedestrian
crossers are shopping (29 percent weekday-41 percent weekend) and visiting family and friends
(22 percent weekday and 25 percent weekend).
29%
36%
28%
11%
20%
24%
5%
17%
8%6%
5%
1%2%
1%3% 4%
0%
5%
10%
15%
20%
25%
30%
35%
40%
Workplace
Visit Family/Friends
ShoppingBusiness Travel
Recreation
SchoolDining/Entertain
Other
Chart 12Trip Purpose
Northbound Pedestrians--Mexicali/Calexico Downtown
Weekday-North (N=17,496)Weekend-North (N=18,006)
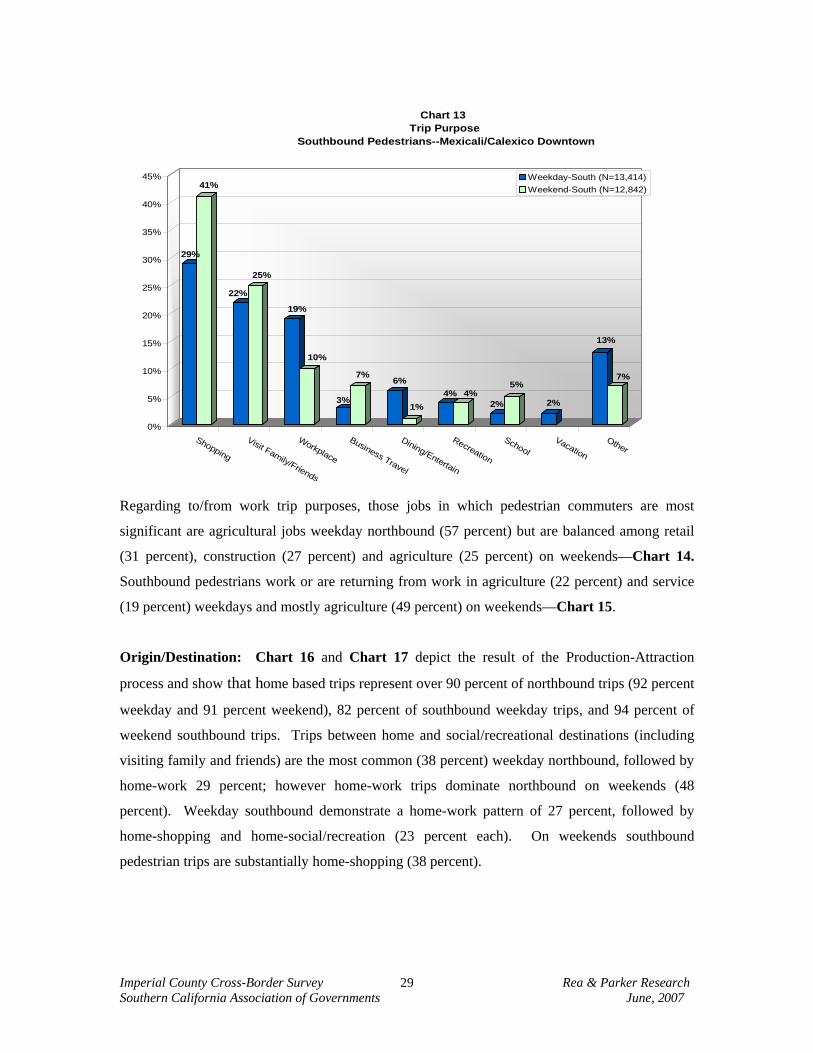
Imperial County Cross-Border Survey Rea & Parker Research Southern California Association of Governments June, 2007
29
29%
41%
22%
25%
19%
10%
3%
7%6%
1%4% 4%
2%
5%
2%
13%
7%
0%
5%
10%
15%
20%
25%
30%
35%
40%
45%
Shopping
Visit Family/Friends
Workplace
Business Travel
Dining/Entertain
Recreation
SchoolVacation
Other
Chart 13 Trip Purpose
Southbound Pedestrians--Mexicali/Calexico Downtown
Weekday-South (N=13,414)Weekend-South (N=12,842)
Regarding to/from work trip purposes, those jobs in which pedestrian commuters are most
significant are agricultural jobs weekday northbound (57 percent) but are balanced among retail
(31 percent), construction (27 percent) and agriculture (25 percent) on weekends—Chart 14.
Southbound pedestrians work or are returning from work in agriculture (22 percent) and service
(19 percent) weekdays and mostly agriculture (49 percent) on weekends—Chart 15.
Origin/Destination: Chart 16 and Chart 17 depict the result of the Production-Attraction
process and show that home based trips represent over 90 percent of northbound trips (92 percent
weekday and 91 percent weekend), 82 percent of southbound weekday trips, and 94 percent of
weekend southbound trips. Trips between home and social/recreational destinations (including
visiting family and friends) are the most common (38 percent) weekday northbound, followed by
home-work 29 percent; however home-work trips dominate northbound on weekends (48
percent). Weekday southbound demonstrate a home-work pattern of 27 percent, followed by
home-shopping and home-social/recreation (23 percent each). On weekends southbound
pedestrian trips are substantially home-shopping (38 percent).
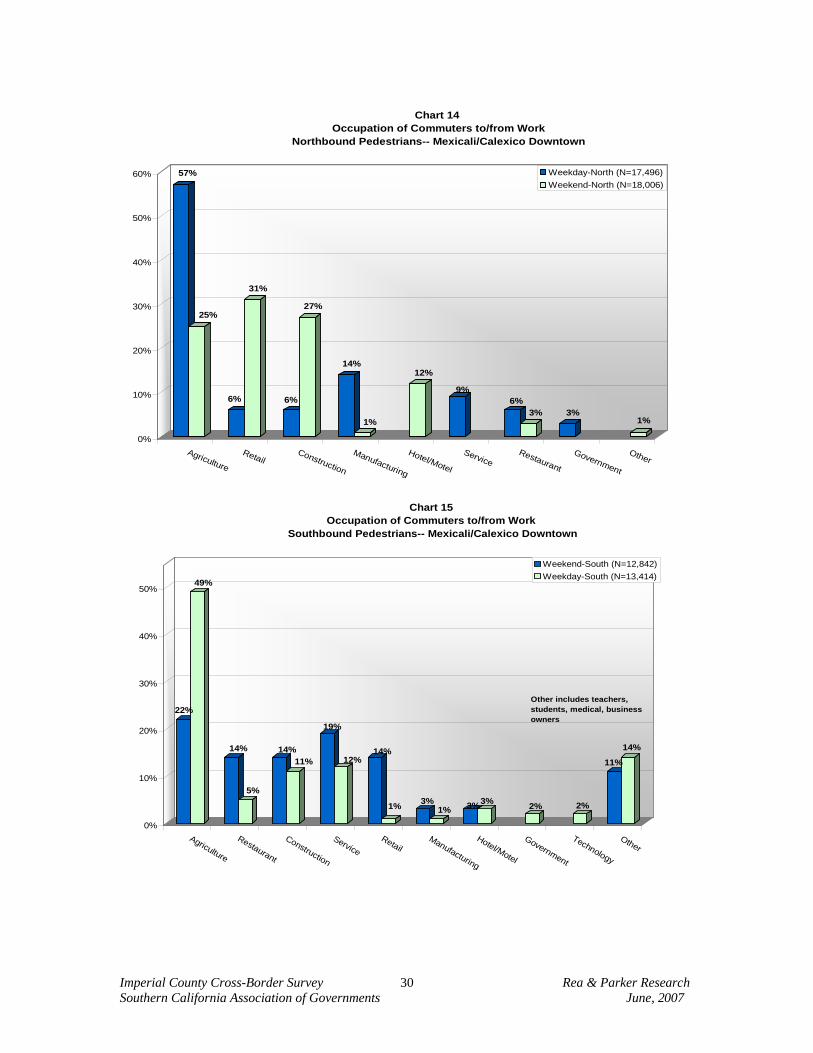
Imperial County Cross-Border Survey Rea & Parker Research Southern California Association of Governments June, 2007
30
57%
25%
6%
31%
6%
27%
14%
1%
12%
9%6%
3% 3%1%
0%
10%
20%
30%
40%
50%
60%
Agriculture
RetailConstruction
Manufacturing
Hotel/Motel
ServiceRestaurant
Government
Other
Chart 14 Occupation of Commuters to/from Work
Northbound Pedestrians-- Mexicali/Calexico Downtown
Weekday-North (N=17,496)Weekend-North (N=18,006)
22%
49%
14%
5%
14%11%
19%
12%14%
1% 3%1% 3%3% 2% 2%
11%
14%
0%
10%
20%
30%
40%
50%
Agriculture
Restaurant
Construction
ServiceRetail
Manufacturing
Hotel/Motel
Government
Technology
Other
Chart 15Occupation of Commuters to/from Work
Southbound Pedestrians-- Mexicali/Calexico Downtown
Weekend-South (N=12,842)Weekday-South (N=13,414)
Other includes teachers, students, medical, business owners
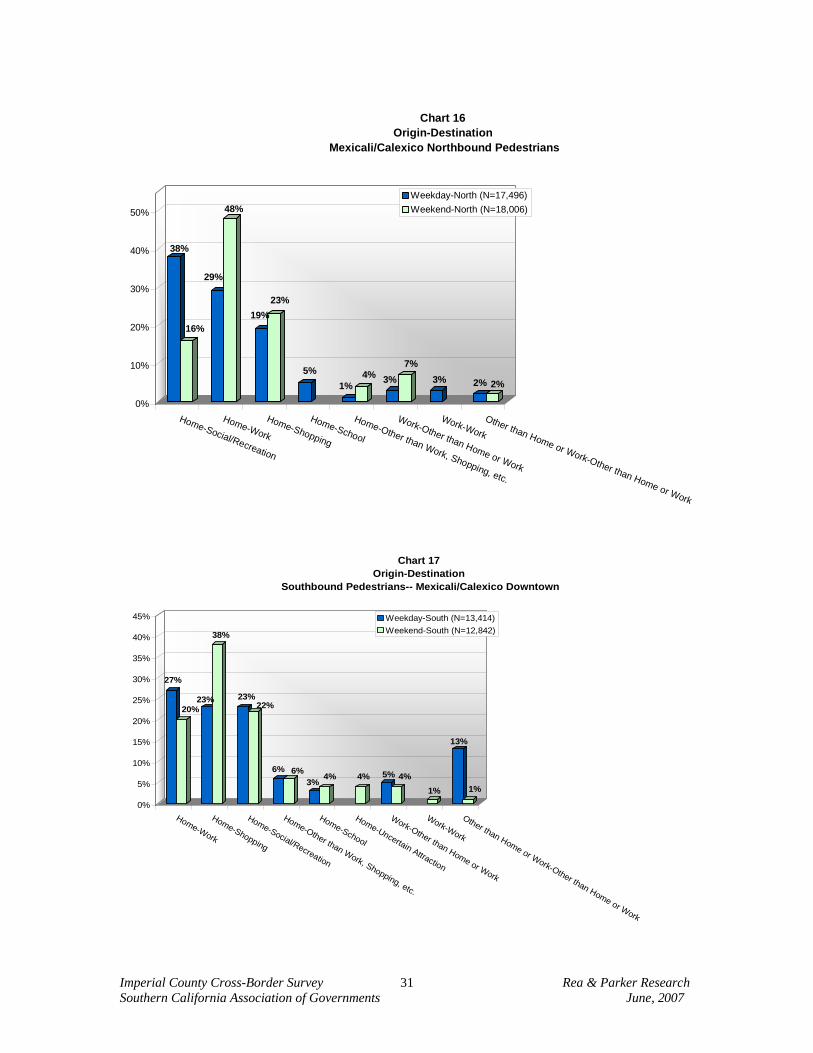
Imperial County Cross-Border Survey Rea & Parker Research Southern California Association of Governments June, 2007
31
38%
16%
29%
48%
19%23%
5%1%
4% 3%7%
3% 2% 2%
0%
10%
20%
30%
40%
50%
Home-Social/Recreation
Home-Work
Home-Shopping
Home-School
Home-Other than Work, Shopping, etc.
Work-Other than Home or Work
Work-Work
Other than Home or Work-Other than Home or Work
Chart 16 Origin-Destination
Mexicali/Calexico Northbound Pedestrians
Weekday-North (N=17,496)Weekend-North (N=18,006)
27%
20%23%
38%
23%22%
6% 6%3% 4% 4% 5% 4%
1%
13%
1%
0%
5%
10%
15%
20%
25%
30%
35%
40%
45%
Home-Work
Home-Shopping
Home-Social/Recreation
Home-Other than Work, Shopping, etc.
Home-School
Home-Uncertain Attraction
Work-Other than Home or Work
Work-Work
Other than Home or Work-Other than Home or Work
Chart 17Origin-Destination
Southbound Pedestrians-- Mexicali/Calexico Downtown
Weekday-South (N=13,414)Weekend-South (N=12,842)
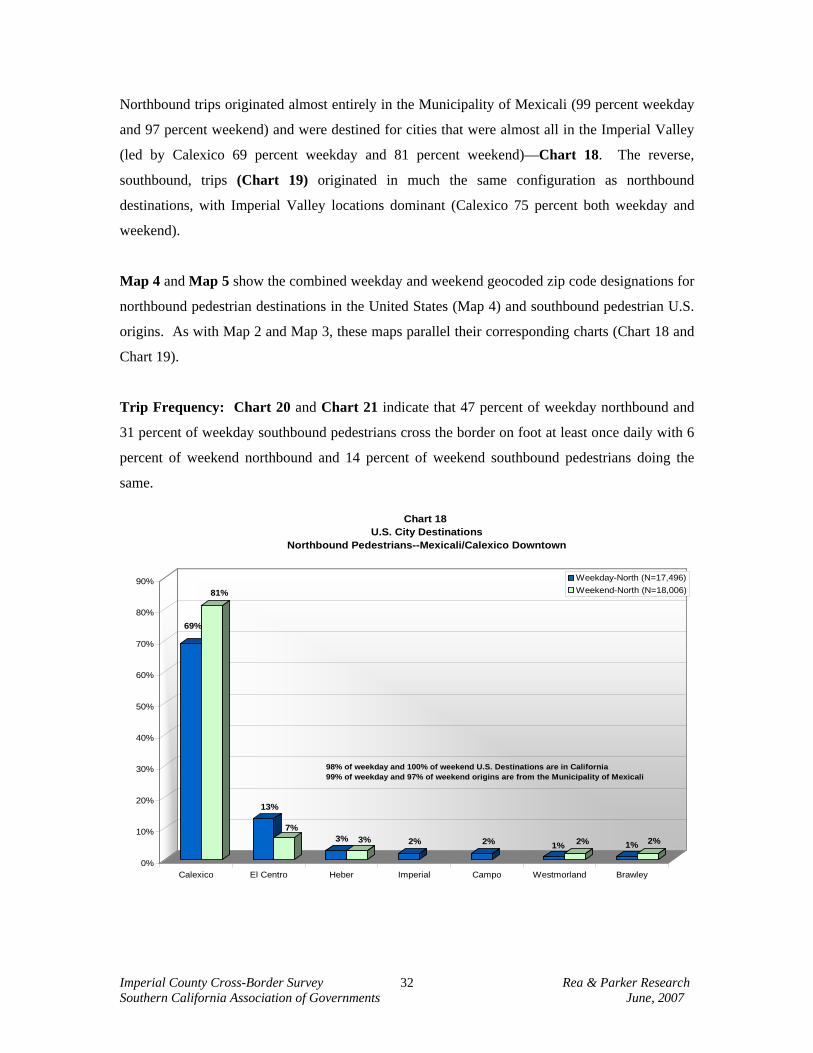
Imperial County Cross-Border Survey Rea & Parker Research Southern California Association of Governments June, 2007
32
Northbound trips originated almost entirely in the Municipality of Mexicali (99 percent weekday
and 97 percent weekend) and were destined for cities that were almost all in the Imperial Valley
(led by Calexico 69 percent weekday and 81 percent weekend)—Chart 18. The reverse,
southbound, trips (Chart 19) originated in much the same configuration as northbound
destinations, with Imperial Valley locations dominant (Calexico 75 percent both weekday and
weekend).
Map 4 and Map 5 show the combined weekday and weekend geocoded zip code designations for
northbound pedestrian destinations in the United States (Map 4) and southbound pedestrian U.S.
origins. As with Map 2 and Map 3, these maps parallel their corresponding charts (Chart 18 and
Chart 19).
Trip Frequency: Chart 20 and Chart 21 indicate that 47 percent of weekday northbound and
31 percent of weekday southbound pedestrians cross the border on foot at least once daily with 6
percent of weekend northbound and 14 percent of weekend southbound pedestrians doing the
same.
69%
81%
13%
7%3% 3% 2% 2% 1% 2% 1% 2%
0%
10%
20%
30%
40%
50%
60%
70%
80%
90%
Calexico El Centro Heber Imperial Campo Westmorland Brawley
Chart 18 U.S. City Destinations
Northbound Pedestrians--Mexicali/Calexico Downtown
Weekday-North (N=17,496)Weekend-North (N=18,006)
98% of weekday and 100% of weekend U.S. Destinations are in California99% of weekday and 97% of weekend origins are from the Municipality of Mexicali
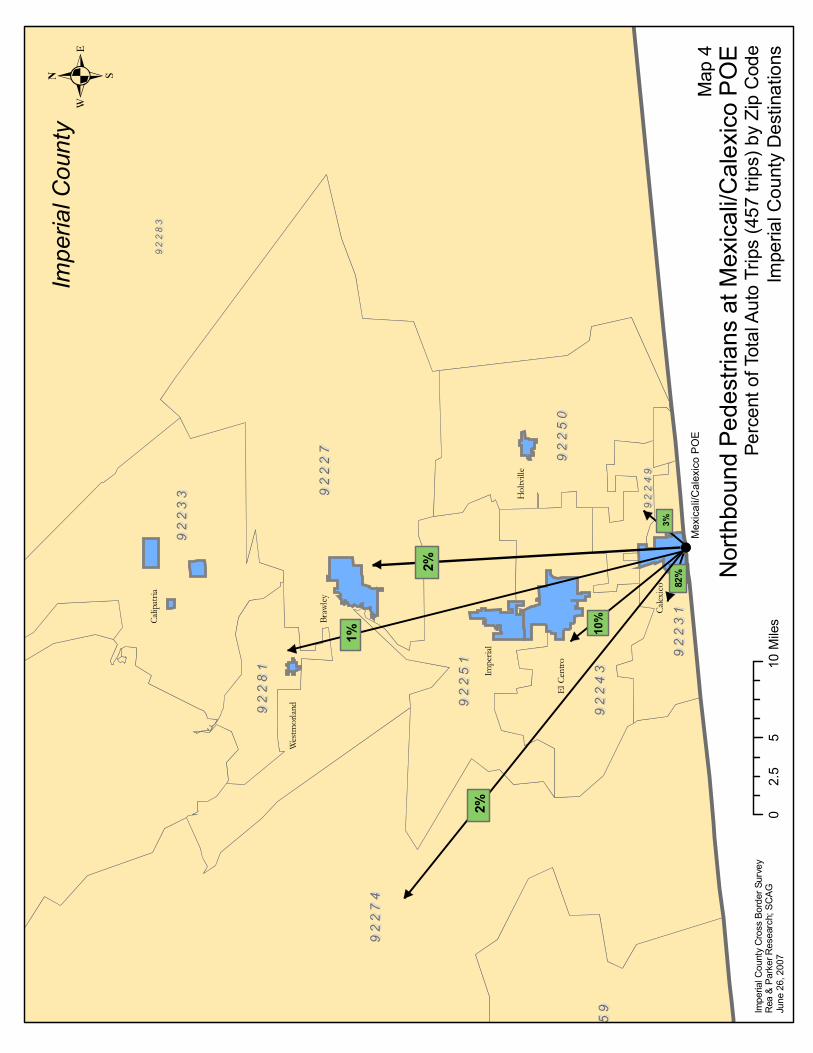
Mex
ical
i/Cal
exic
oP
OE
Calip
atria
Wes
tmor
land
Braw
ley
Impe
rial
ElCe
ntro
Calex
ico
Hol
tvill
e
92
28
39
22
83
92
27
49
22
74
92
22
79
22
27
92
25
99
22
59
92
25
19
22
51
92
24
39
22
43
92
25
09
22
50
92
23
19
22
31
92
28
19
22
81
92
24
99
22
49
92
23
39
22
33
82%
3%
2%
1% 10%
2%
.
Nor
thbo
und
Pede
stria
nsat
Mex
ical
i/Cal
exic
oP
OE
Perc
ento
fTot
alA
uto
Trip
s(4
57tri
ps)b
yZi
pC
ode
Impe
rialC
ount
yD
estin
atio
nsIm
peria
lCou
nty
Cro
ssBo
rder
Surv
eyR
ea&
Park
erR
esea
rch;
SCAG
June
26,2
007
05
102.
5M
iles
Impe
rialC
ount
y
Map
4
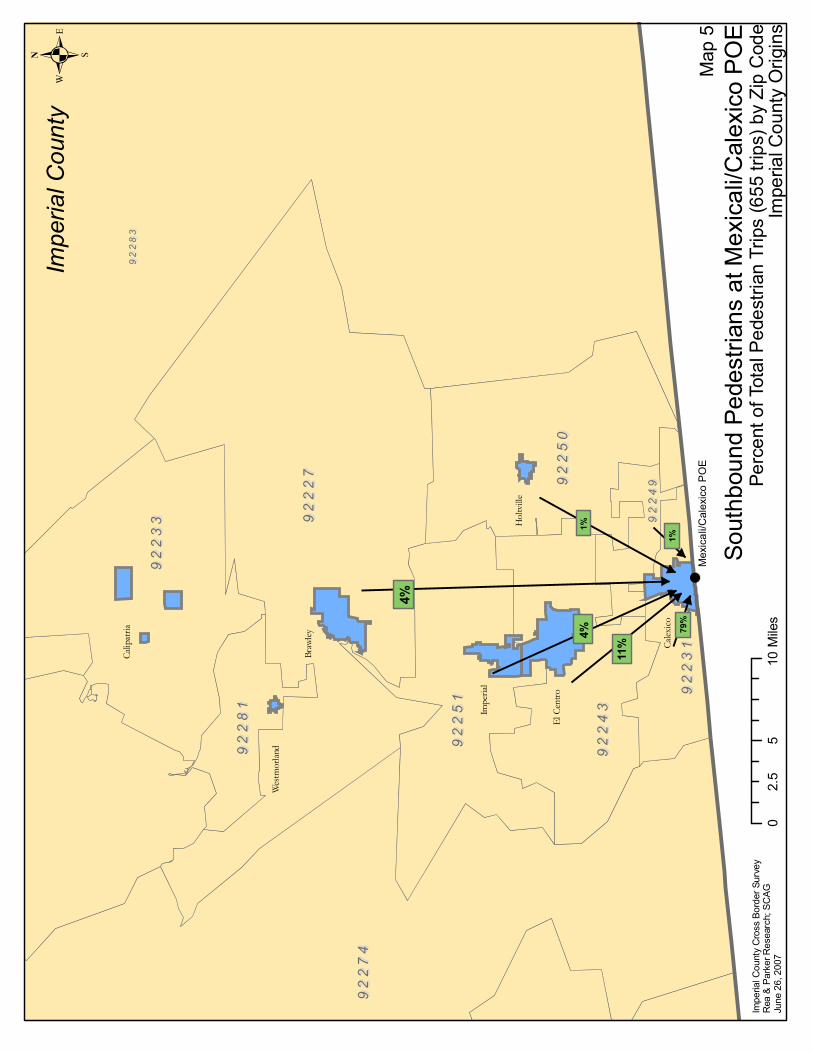
Mex
ical
i/Cal
exic
oP
OE
Calip
atria
Wes
tmor
land
Braw
ley
Impe
rial
ElCe
ntro
Calex
ico
Hol
tvill
e
92
28
39
22
83
92
27
49
22
74
92
22
79
22
27
92
25
19
22
51
92
24
39
22
43
92
25
09
22
50
92
23
19
22
31
92
28
19
22
81
92
24
99
22
49
92
23
39
22
33
79%
11%
4%
4%
1%
1%
.
Sout
hbou
ndPe
dest
rians
atM
exic
ali/C
alex
ico
POE
Perc
ento
fTot
alP
edes
trian
Trip
s(6
55tri
ps)b
yZi
pC
ode
Impe
rialC
ount
yO
rigin
sIm
peria
lCou
nty
Cro
ssBo
rder
Surv
eyR
ea&
Park
erR
esea
rch;
SCAG
June
26,2
007
05
102.
5M
iles
Impe
rialC
ount
y
Map
5
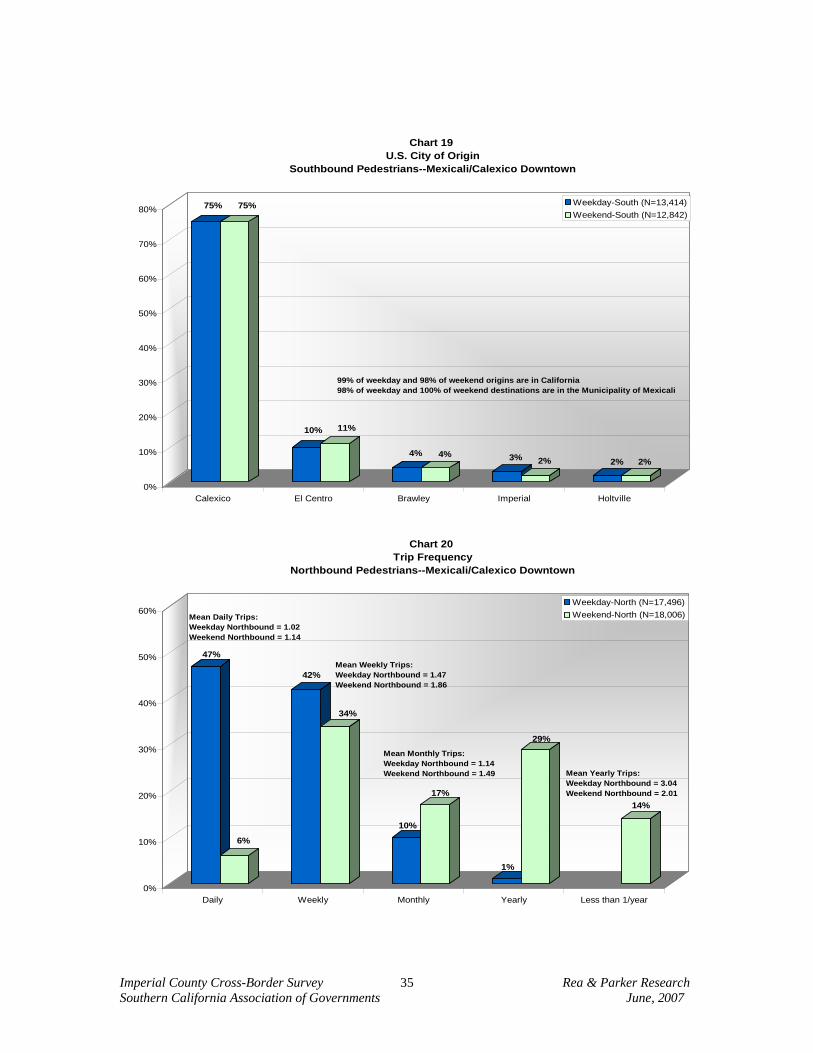
Imperial County Cross-Border Survey Rea & Parker Research Southern California Association of Governments June, 2007
35
75% 75%
10% 11%
4% 4% 3% 2% 2% 2%
0%
10%
20%
30%
40%
50%
60%
70%
80%
Calexico El Centro Brawley Imperial Holtville
Chart 19 U.S. City of Origin
Southbound Pedestrians--Mexicali/Calexico Downtown
Weekday-South (N=13,414)Weekend-South (N=12,842)
99% of weekday and 98% of weekend origins are in California 98% of weekday and 100% of weekend destinations are in the Municipality of Mexicali
47%
6%
42%
34%
10%
17%
1%
29%
14%
0%
10%
20%
30%
40%
50%
60%
Daily Weekly Monthly Yearly Less than 1/year
Chart 20 Trip Frequency
Northbound Pedestrians--Mexicali/Calexico Downtown
Weekday-North (N=17,496)Weekend-North (N=18,006)Mean Daily Trips:
Weekday Northbound = 1.02Weekend Northbound = 1.14
Mean Weekly Trips:Weekday Northbound = 1.47Weekend Northbound = 1.86
Mean Monthly Trips:Weekday Northbound = 1.14Weekend Northbound = 1.49 Mean Yearly Trips:
Weekday Northbound = 3.04Weekend Northbound = 2.01
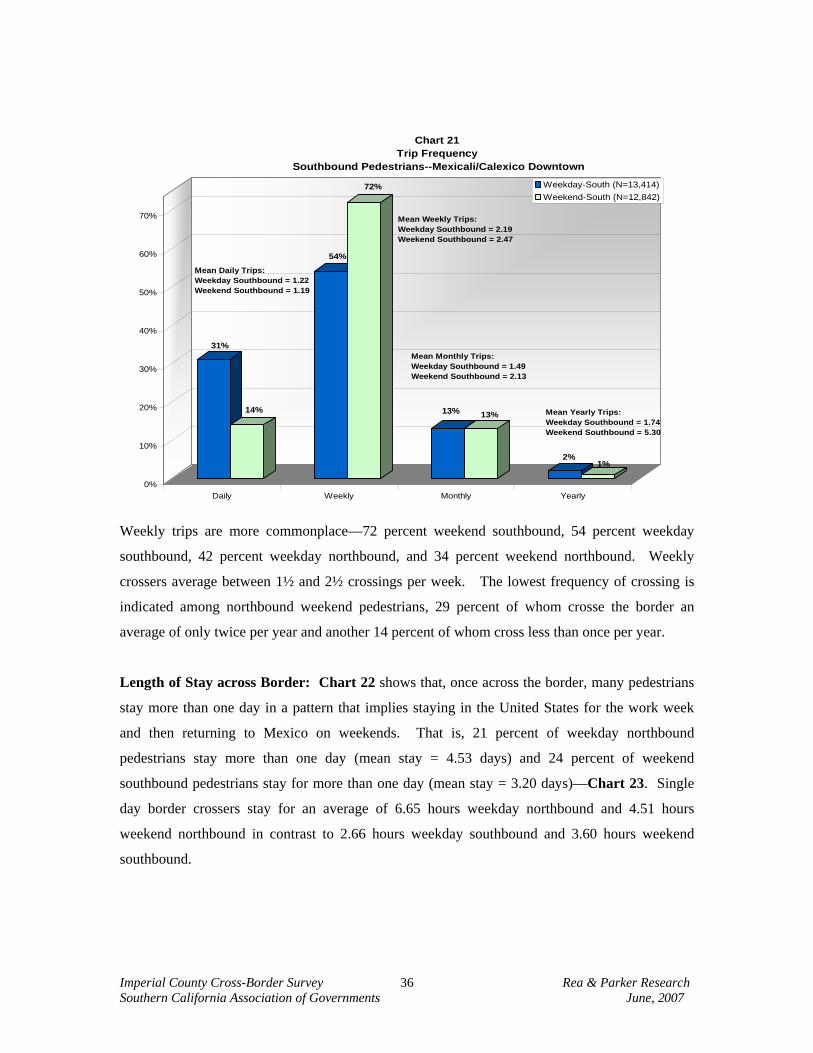
Imperial County Cross-Border Survey Rea & Parker Research Southern California Association of Governments June, 2007
36
31%
14%
54%
72%
13% 13%
2%1%
0%
10%
20%
30%
40%
50%
60%
70%
Daily Weekly Monthly Yearly
Chart 21 Trip Frequency
Southbound Pedestrians--Mexicali/Calexico Downtown
Weekday-South (N=13,414)Weekend-South (N=12,842)
Mean Daily Trips:Weekday Southbound = 1.22Weekend Southbound = 1.19
Mean Weekly Trips:Weekday Southbound = 2.19Weekend Southbound = 2.47
Mean Monthly Trips:Weekday Southbound = 1.49Weekend Southbound = 2.13
Mean Yearly Trips:Weekday Southbound = 1.74Weekend Southbound = 5.30
Weekly trips are more commonplace—72 percent weekend southbound, 54 percent weekday
southbound, 42 percent weekday northbound, and 34 percent weekend northbound. Weekly
crossers average between 1½ and 2½ crossings per week. The lowest frequency of crossing is
indicated among northbound weekend pedestrians, 29 percent of whom crosse the border an
average of only twice per year and another 14 percent of whom cross less than once per year.
Length of Stay across Border: Chart 22 shows that, once across the border, many pedestrians
stay more than one day in a pattern that implies staying in the United States for the work week
and then returning to Mexico on weekends. That is, 21 percent of weekday northbound
pedestrians stay more than one day (mean stay = 4.53 days) and 24 percent of weekend
southbound pedestrians stay for more than one day (mean stay = 3.20 days)—Chart 23. Single
day border crossers stay for an average of 6.65 hours weekday northbound and 4.51 hours
weekend northbound in contrast to 2.66 hours weekday southbound and 3.60 hours weekend
southbound.
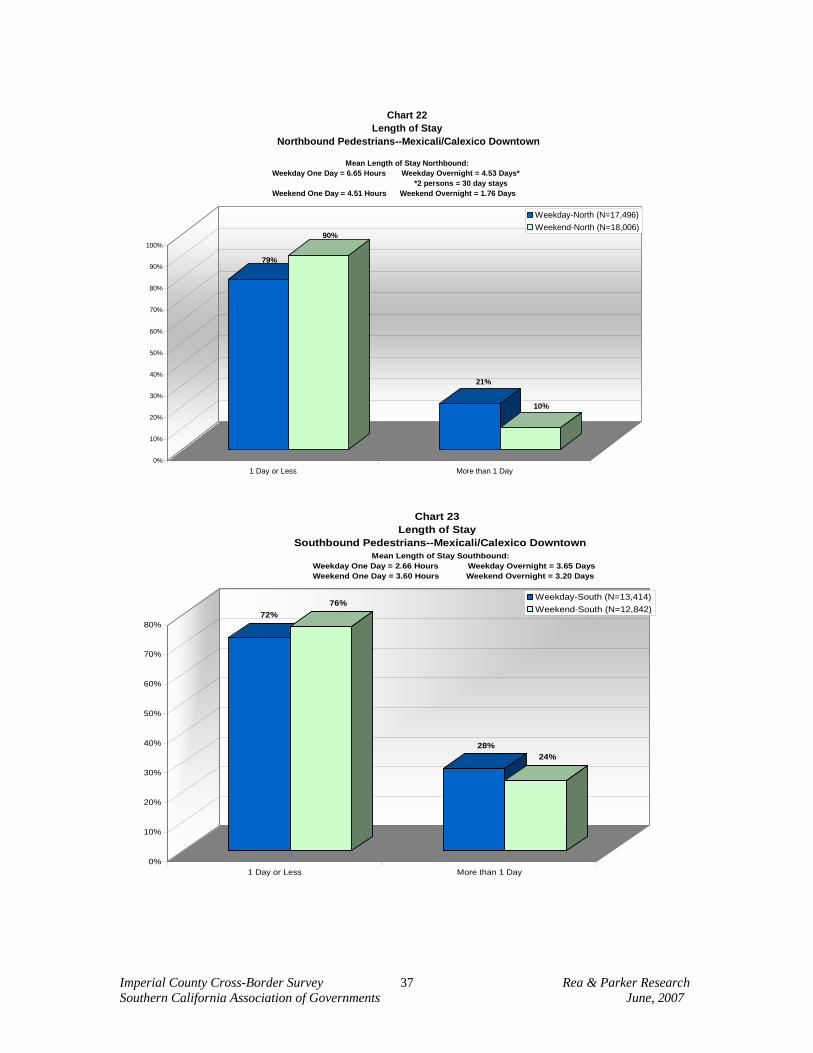
Imperial County Cross-Border Survey Rea & Parker Research Southern California Association of Governments June, 2007
37
79%
90%
21%
10%
0%
10%
20%
30%
40%
50%
60%
70%
80%
90%
100%
1 Day or Less More than 1 Day
Chart 22 Length of Stay
Northbound Pedestrians--Mexicali/Calexico Downtown
Weekday-North (N=17,496)Weekend-North (N=18,006)
Mean Length of Stay Northbound:Weekday One Day = 6.65 Hours Weekday Overnight = 4.53 Days* *2 persons = 30 day staysWeekend One Day = 4.51 Hours Weekend Overnight = 1.76 Days
72%76%
28%24%
0%
10%
20%
30%
40%
50%
60%
70%
80%
1 Day or Less More than 1 Day
Chart 23 Length of Stay
Southbound Pedestrians--Mexicali/Calexico Downtown
Weekday-South (N=13,414)Weekend-South (N=12,842)
Mean Length of Stay Southbound:Weekday One Day = 2.66 Hours Weekday Overnight = 3.65 DaysWeekend One Day = 3.60 Hours Weekend Overnight = 3.20 Days
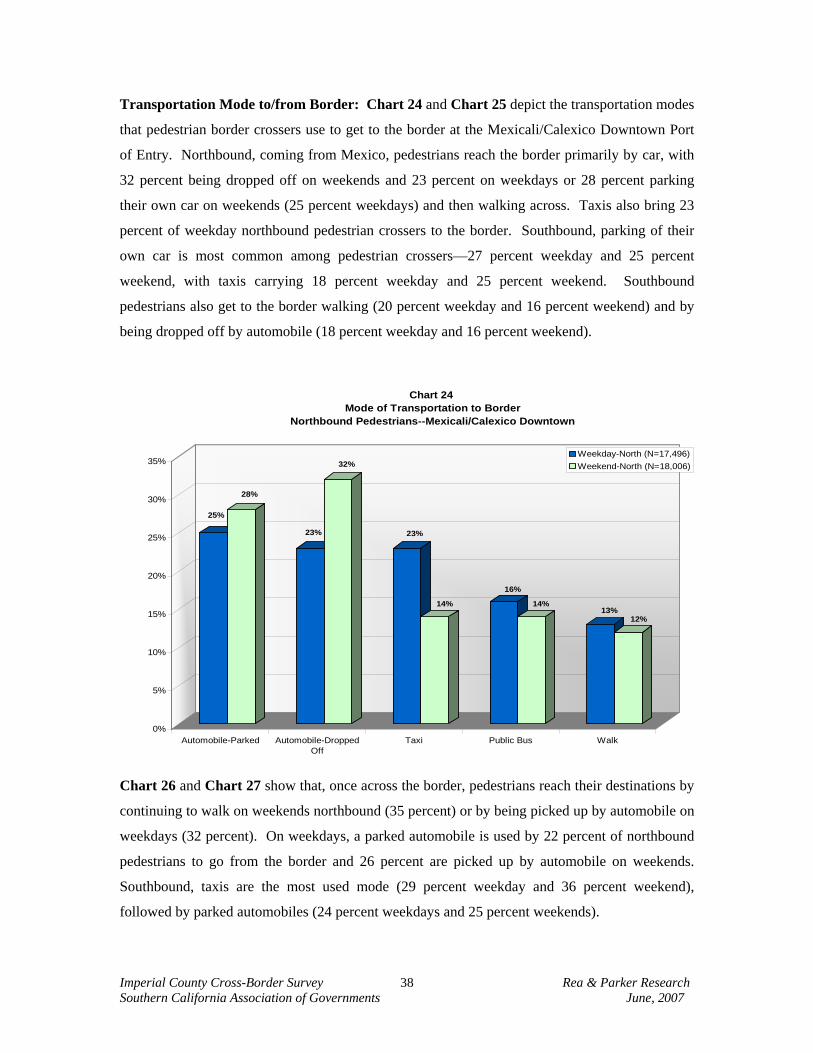
Imperial County Cross-Border Survey Rea & Parker Research Southern California Association of Governments June, 2007
38
Transportation Mode to/from Border: Chart 24 and Chart 25 depict the transportation modes
that pedestrian border crossers use to get to the border at the Mexicali/Calexico Downtown Port
of Entry. Northbound, coming from Mexico, pedestrians reach the border primarily by car, with
32 percent being dropped off on weekends and 23 percent on weekdays or 28 percent parking
their own car on weekends (25 percent weekdays) and then walking across. Taxis also bring 23
percent of weekday northbound pedestrian crossers to the border. Southbound, parking of their
own car is most common among pedestrian crossers—27 percent weekday and 25 percent
weekend, with taxis carrying 18 percent weekday and 25 percent weekend. Southbound
pedestrians also get to the border walking (20 percent weekday and 16 percent weekend) and by
being dropped off by automobile (18 percent weekday and 16 percent weekend).
25%
28%
23%
32%
23%
14%
16%
14%13%
12%
0%
5%
10%
15%
20%
25%
30%
35%
Automobile-Parked Automobile-DroppedOff
Taxi Public Bus Walk
Chart 24 Mode of Transportation to Border
Northbound Pedestrians--Mexicali/Calexico Downtown
Weekday-North (N=17,496)Weekend-North (N=18,006)
Chart 26 and Chart 27 show that, once across the border, pedestrians reach their destinations by
continuing to walk on weekends northbound (35 percent) or by being picked up by automobile on
weekdays (32 percent). On weekdays, a parked automobile is used by 22 percent of northbound
pedestrians to go from the border and 26 percent are picked up by automobile on weekends.
Southbound, taxis are the most used mode (29 percent weekday and 36 percent weekend),
followed by parked automobiles (24 percent weekdays and 25 percent weekends).
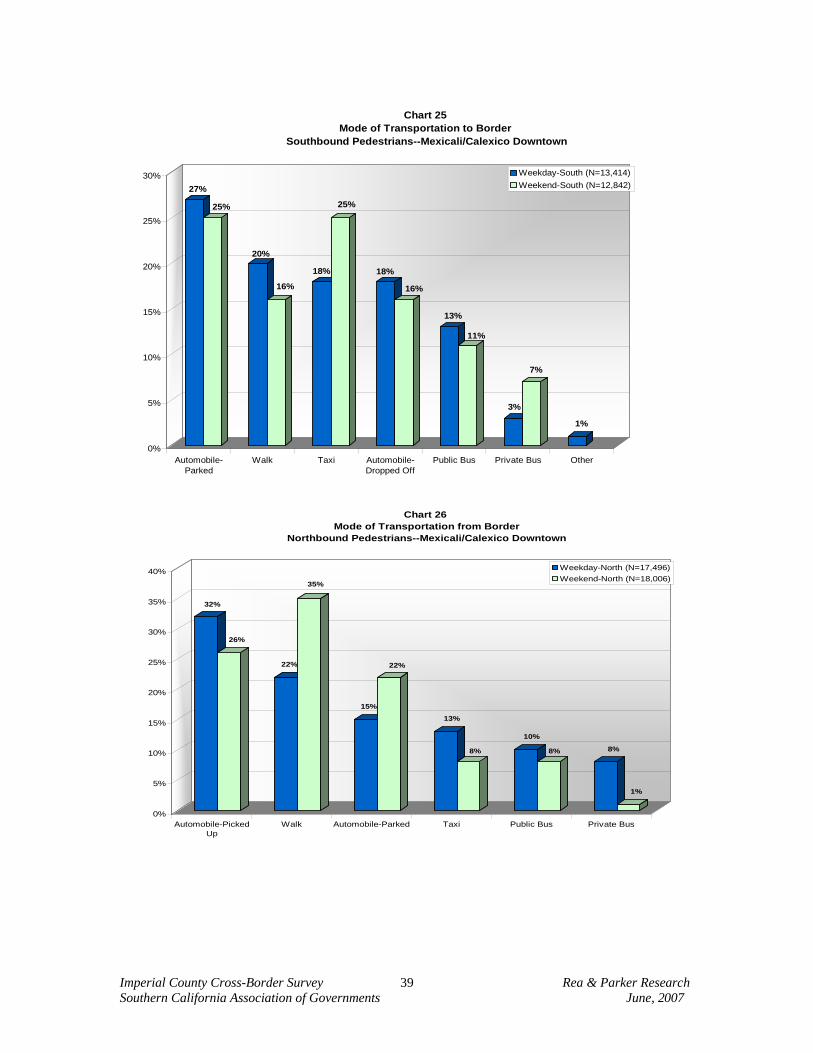
Imperial County Cross-Border Survey Rea & Parker Research Southern California Association of Governments June, 2007
39
27%
25%
20%
16%
18%
25%
18%
16%
13%
11%
3%
7%
1%
0%
5%
10%
15%
20%
25%
30%
Automobile-Parked
Walk Taxi Automobile-Dropped Off
Public Bus Private Bus Other
Chart 25 Mode of Transportation to Border
Southbound Pedestrians--Mexicali/Calexico Downtown
Weekday-South (N=13,414)Weekend-South (N=12,842)
32%
26%
22%
35%
15%
22%
13%
8%
10%
8% 8%
1%
0%
5%
10%
15%
20%
25%
30%
35%
40%
Automobile-PickedUp
Walk Automobile-Parked Taxi Public Bus Private Bus
Chart 26 Mode of Transportation from Border
Northbound Pedestrians--Mexicali/Calexico Downtown
Weekday-North (N=17,496)Weekend-North (N=18,006)
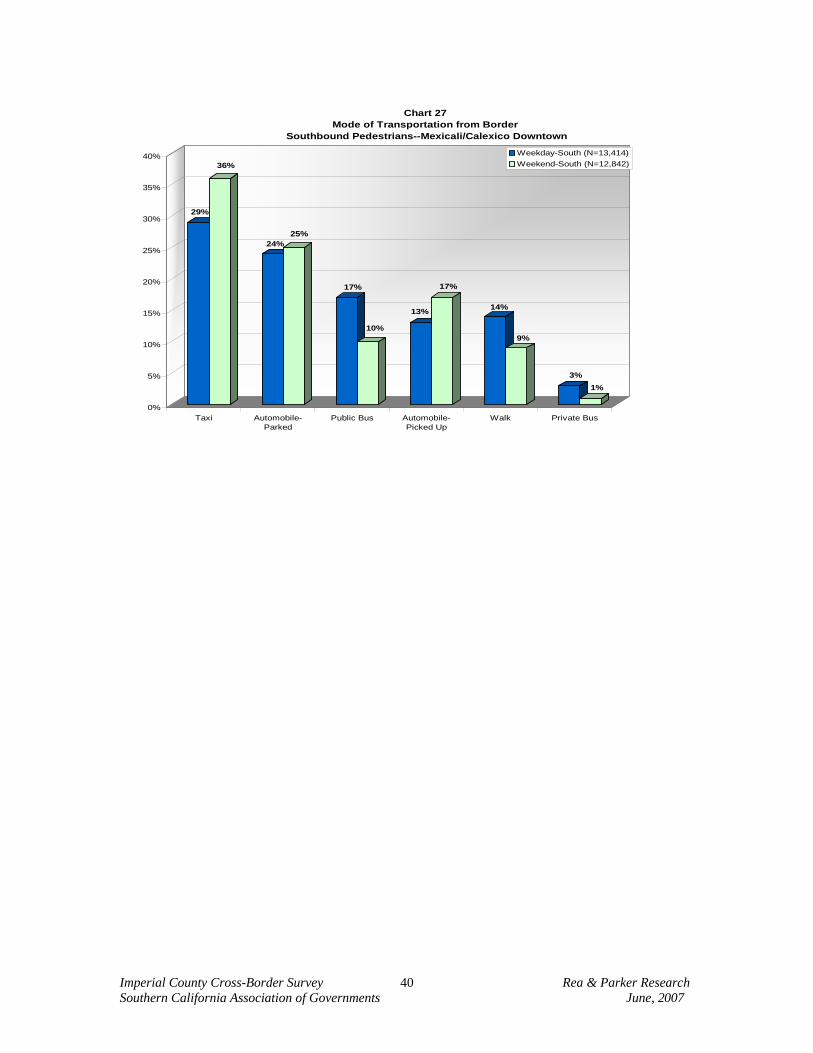
Imperial County Cross-Border Survey Rea & Parker Research Southern California Association of Governments June, 2007
40
29%
36%
24%25%
17%
10%
13%
17%
14%
9%
3%1%
0%
5%
10%
15%
20%
25%
30%
35%
40%
Taxi Automobile-Parked
Public Bus Automobile-Picked Up
Walk Private Bus
Chart 27 Mode of Transportation from Border
Southbound Pedestrians--Mexicali/Calexico Downtown
Weekday-South (N=13,414)Weekend-South (N=12,842)
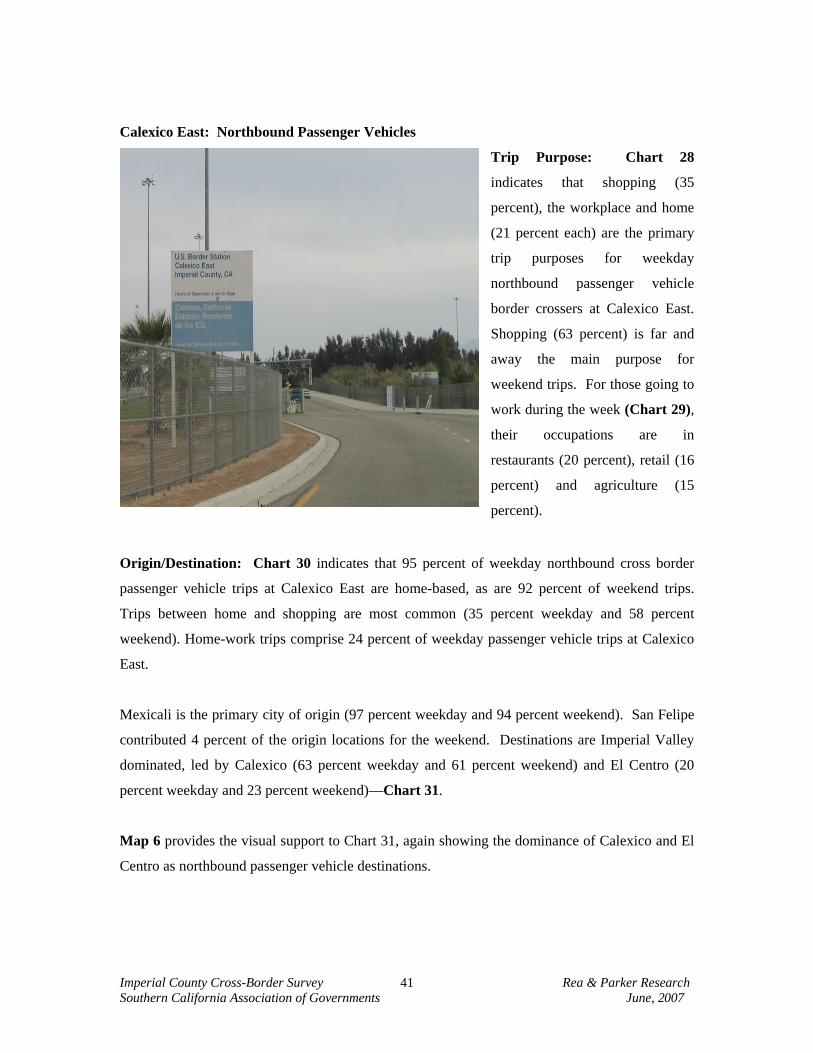
Imperial County Cross-Border Survey Rea & Parker Research Southern California Association of Governments June, 2007
41
Calexico East: Northbound Passenger Vehicles
Trip Purpose: Chart 28
indicates that shopping (35
percent), the workplace and home
(21 percent each) are the primary
trip purposes for weekday
northbound passenger vehicle
border crossers at Calexico East.
Shopping (63 percent) is far and
away the main purpose for
weekend trips. For those going to
work during the week (Chart 29),
their occupations are in
restaurants (20 percent), retail (16
percent) and agriculture (15
percent).
Origin/Destination: Chart 30 indicates that 95 percent of weekday northbound cross border
passenger vehicle trips at Calexico East are home-based, as are 92 percent of weekend trips.
Trips between home and shopping are most common (35 percent weekday and 58 percent
weekend). Home-work trips comprise 24 percent of weekday passenger vehicle trips at Calexico
East.
Mexicali is the primary city of origin (97 percent weekday and 94 percent weekend). San Felipe
contributed 4 percent of the origin locations for the weekend. Destinations are Imperial Valley
dominated, led by Calexico (63 percent weekday and 61 percent weekend) and El Centro (20
percent weekday and 23 percent weekend)—Chart 31.
Map 6 provides the visual support to Chart 31, again showing the dominance of Calexico and El
Centro as northbound passenger vehicle destinations.
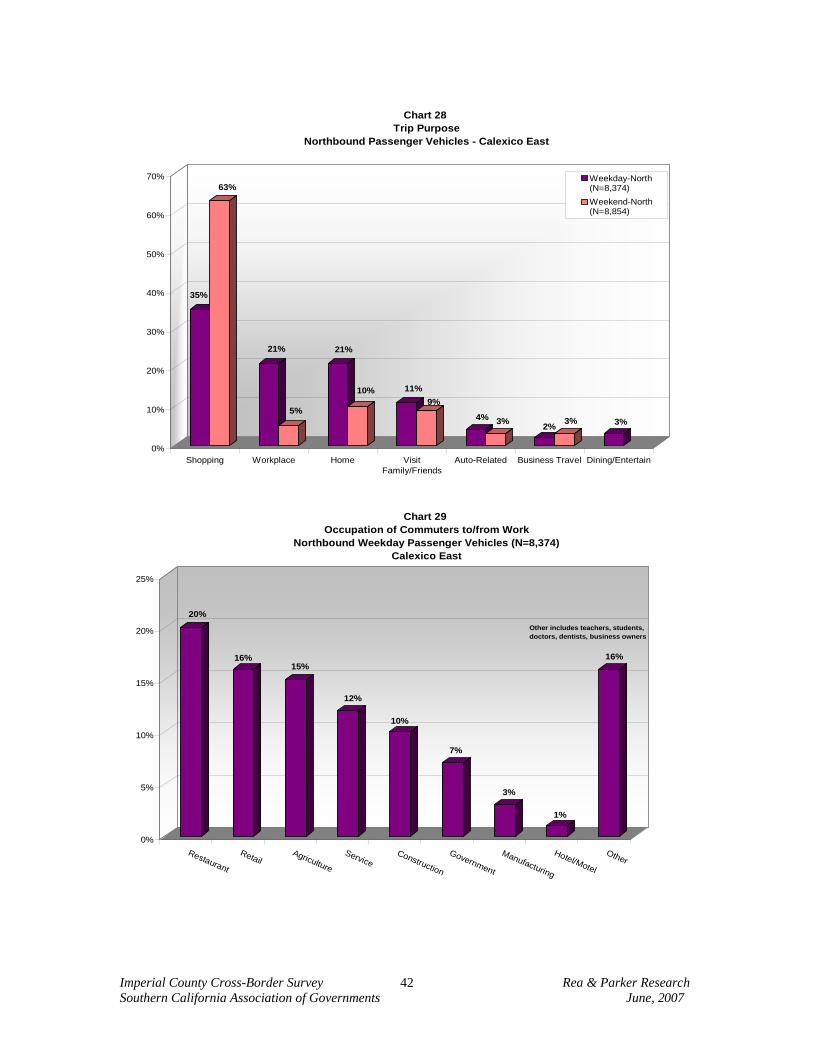
Imperial County Cross-Border Survey Rea & Parker Research Southern California Association of Governments June, 2007
42
35%
63%
21%
5%
21%
10% 11%9%
4% 3% 2% 3% 3%
0%
10%
20%
30%
40%
50%
60%
70%
Shopping Workplace Home VisitFamily/Friends
Auto-Related Business Travel Dining/Entertain
Chart 28 Trip Purpose
Northbound Passenger Vehicles - Calexico East
Weekday-North(N=8,374)Weekend-North(N=8,854)
20%
16%15%
12%
10%
7%
3%
1%
16%
0%
5%
10%
15%
20%
25%
Restaurant
RetailAgriculture
ServiceConstruction
Government
Manufacturing
Hotel/Motel
Other
Chart 29 Occupation of Commuters to/from Work
Northbound Weekday Passenger Vehicles (N=8,374) Calexico East
Other includes teachers, students,doctors, dentists, business owners
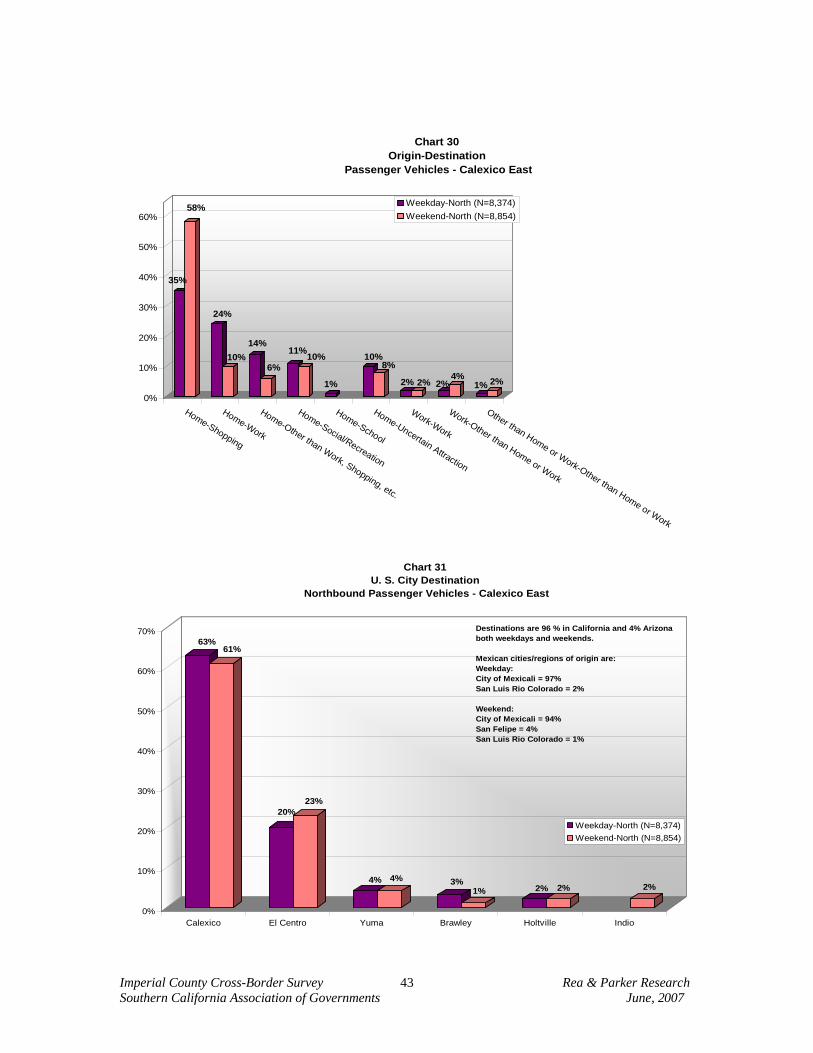
Imperial County Cross-Border Survey Rea & Parker Research Southern California Association of Governments June, 2007
43
35%
58%
24%
10%14%
6%
11%10%
1%
10%8%
2% 2% 2%4%
1% 2%
0%
10%
20%
30%
40%
50%
60%
Home-Shopping
Home-Work
Home-Other than Work, Shopping, etc.
Home-Social/Recreation
Home-School
Home-Uncertain Attraction
Work-Work
Work-Other than Home or Work
Other than Home or Work-Other than Home or Work
Chart 30Origin-Destination
Passenger Vehicles - Calexico East
Weekday-North (N=8,374)Weekend-North (N=8,854)
63%61%
20%23%
4% 4% 3%1% 2% 2% 2%
0%
10%
20%
30%
40%
50%
60%
70%
Calexico El Centro Yuma Brawley Holtville Indio
Chart 31U. S. City Destination
Northbound Passenger Vehicles - Calexico East
Weekday-North (N=8,374)Weekend-North (N=8,854)
Destinations are 96 % in California and 4% Arizona both weekdays and weekends.
Mexican cities/regions of origin are:Weekday:City of Mexicali = 97%San Luis Rio Colorado = 2%
Weekend:City of Mexicali = 94%San Felipe = 4%San Luis Rio Colorado = 1%
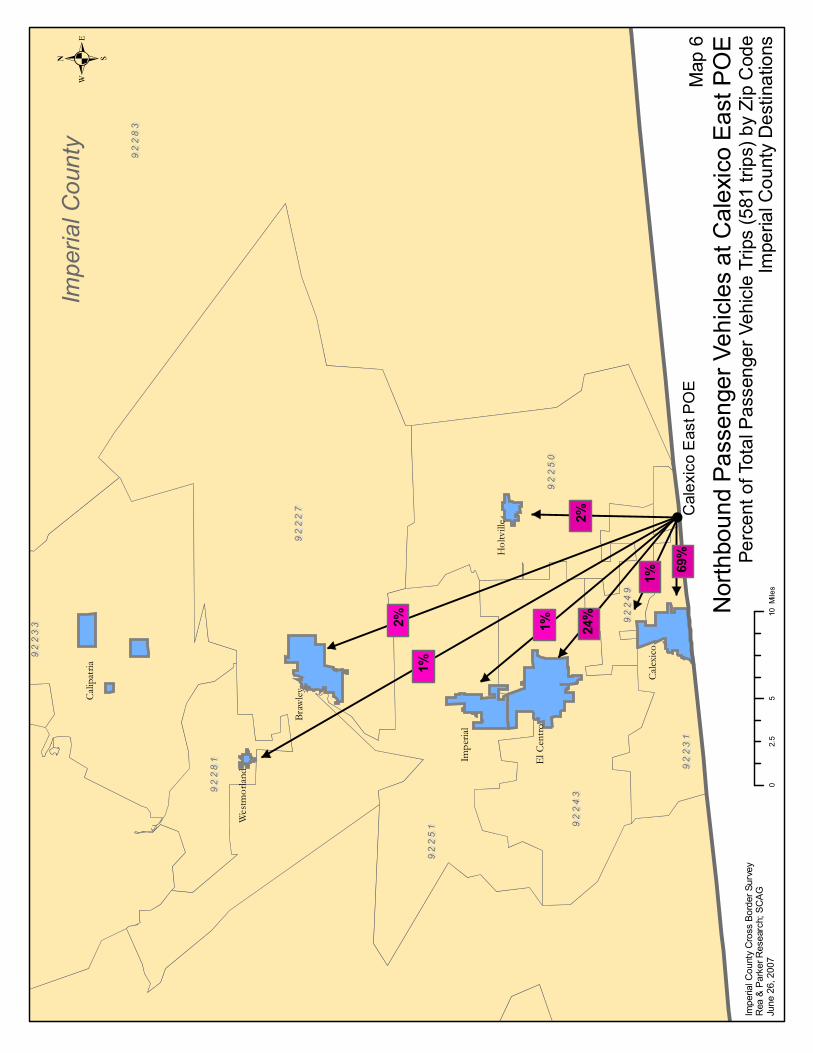
92
24
99
22
49
92
23
19
22
31
92
28
19
22
81
92
24
39
22
43
92
25
19
22
51
92
25
09
22
50
92
23
39
22
33
92
22
79
22
27
92
28
39
22
83
Cal
exic
oE
astP
OE
Cal
ipat
ria
Wes
tmor
land
Braw
ley
Impe
rial
ElC
entr
o
Cal
exic
o
Hol
tvill
e
2%
69%
24%
1%
2%
1%
1%
.
Impe
rialC
ount
yC
ross
Bord
erSu
rvey
Rea
&Pa
rker
Res
earc
h;SC
AGJu
ne26
,200
70
510
2.5
Mile
s
Impe
rialC
ount
y
Map
6N
orth
boun
dPa
ssen
gerV
ehic
les
atC
alex
ico
East
POE
Perc
ento
fTot
alP
asse
nger
Vehi
cle
Trip
s(5
81tri
ps)b
yZi
pC
ode
Impe
rialC
ount
yD
estin
atio
ns
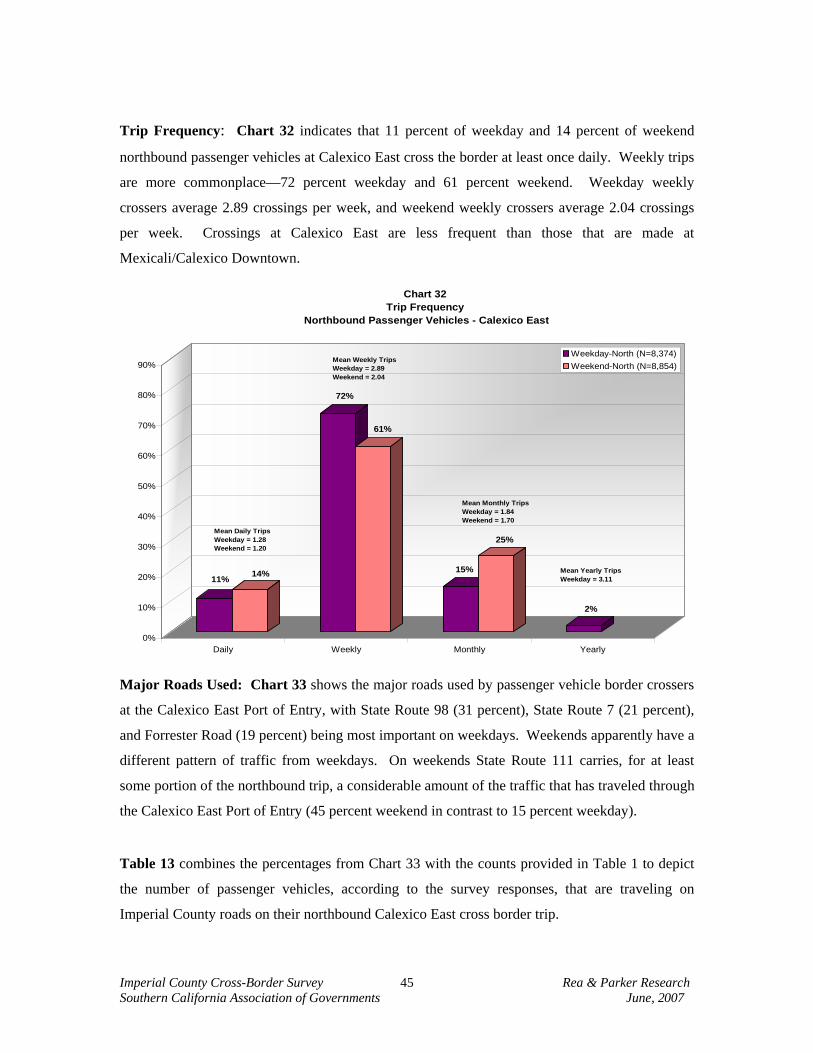
Imperial County Cross-Border Survey Rea & Parker Research Southern California Association of Governments June, 2007
45
Trip Frequency: Chart 32 indicates that 11 percent of weekday and 14 percent of weekend
northbound passenger vehicles at Calexico East cross the border at least once daily. Weekly trips
are more commonplace—72 percent weekday and 61 percent weekend. Weekday weekly
crossers average 2.89 crossings per week, and weekend weekly crossers average 2.04 crossings
per week. Crossings at Calexico East are less frequent than those that are made at
Mexicali/Calexico Downtown.
11% 14%
72%
61%
15%
25%
2%
0%
10%
20%
30%
40%
50%
60%
70%
80%
90%
Daily Weekly Monthly Yearly
Chart 32 Trip Frequency
Northbound Passenger Vehicles - Calexico East
Weekday-North (N=8,374)Weekend-North (N=8,854)
Mean Daily TripsWeekday = 1.28Weekend = 1.20
Mean Weekly TripsWeekday = 2.89Weekend = 2.04
Mean Monthly TripsWeekday = 1.84Weekend = 1.70
Mean Yearly TripsWeekday = 3.11
Major Roads Used: Chart 33 shows the major roads used by passenger vehicle border crossers
at the Calexico East Port of Entry, with State Route 98 (31 percent), State Route 7 (21 percent),
and Forrester Road (19 percent) being most important on weekdays. Weekends apparently have a
different pattern of traffic from weekdays. On weekends State Route 111 carries, for at least
some portion of the northbound trip, a considerable amount of the traffic that has traveled through
the Calexico East Port of Entry (45 percent weekend in contrast to 15 percent weekday).
Table 13 combines the percentages from Chart 33 with the counts provided in Table 1 to depict
the number of passenger vehicles, according to the survey responses, that are traveling on
Imperial County roads on their northbound Calexico East cross border trip.
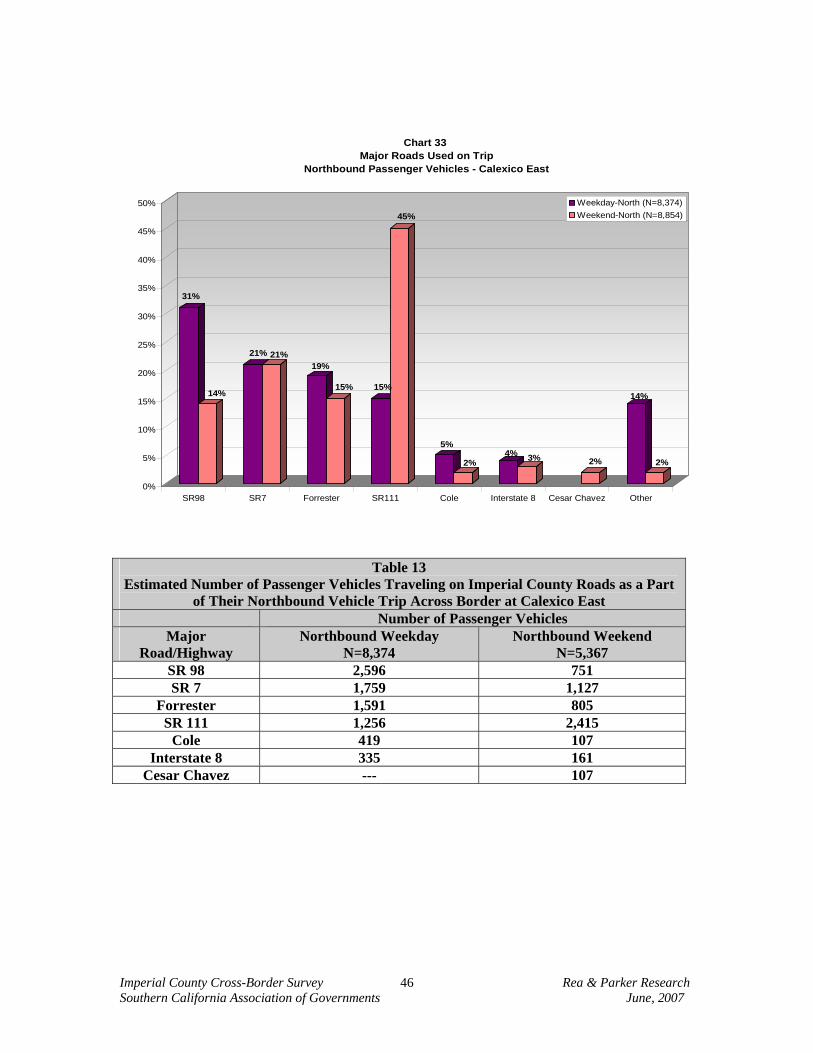
Imperial County Cross-Border Survey Rea & Parker Research Southern California Association of Governments June, 2007
46
31%
14%
21% 21%19%
15% 15%
45%
5%
2%4% 3% 2%
14%
2%
0%
5%
10%
15%
20%
25%
30%
35%
40%
45%
50%
SR98 SR7 Forrester SR111 Cole Interstate 8 Cesar Chavez Other
Chart 33 Major Roads Used on Trip
Northbound Passenger Vehicles - Calexico East
Weekday-North (N=8,374)Weekend-North (N=8,854)
Table 13 Estimated Number of Passenger Vehicles Traveling on Imperial County Roads as a Part
of Their Northbound Vehicle Trip Across Border at Calexico East Number of Passenger Vehicles
Major Road/Highway
Northbound Weekday N=8,374
Northbound Weekend N=5,367
SR 98 2,596 751 SR 7 1,759 1,127
Forrester 1,591 805 SR 111 1,256 2,415
Cole 419 107 Interstate 8 335 161
Cesar Chavez --- 107
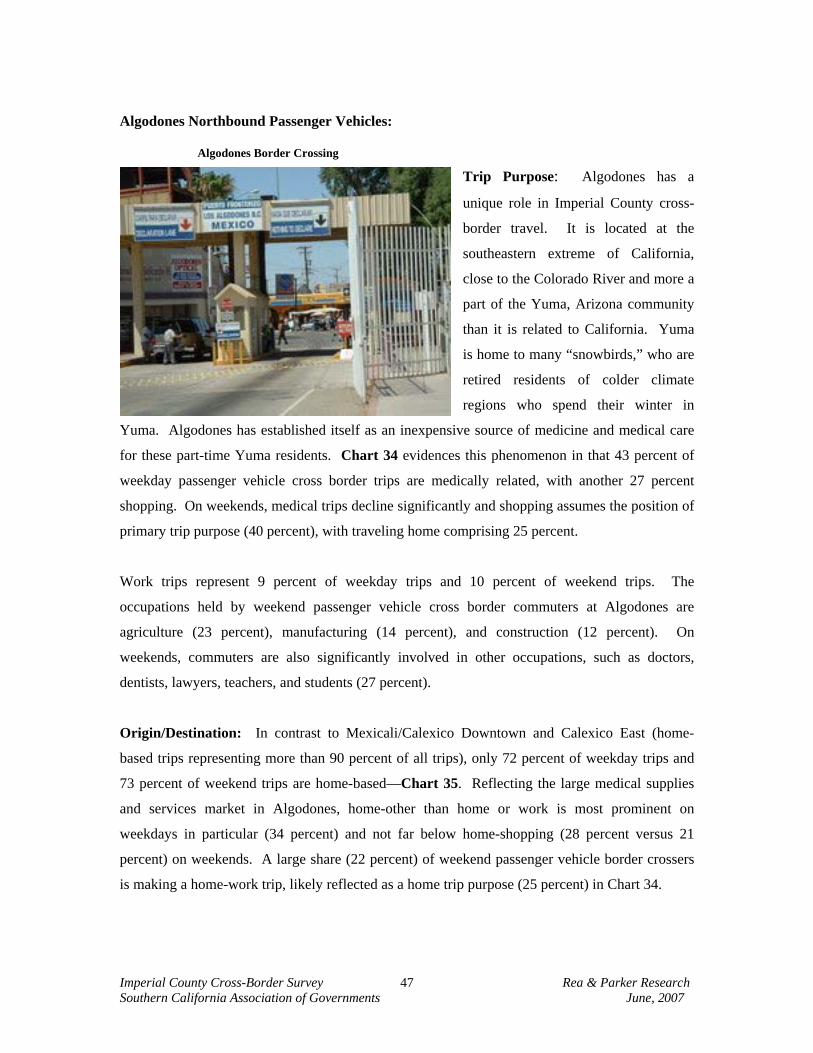
Imperial County Cross-Border Survey Rea & Parker Research Southern California Association of Governments June, 2007
47
Algodones Northbound Passenger Vehicles: Algodones Border Crossing
Trip Purpose: Algodones has a
unique role in Imperial County cross-
border travel. It is located at the
southeastern extreme of California,
close to the Colorado River and more a
part of the Yuma, Arizona community
than it is related to California. Yuma
is home to many “snowbirds,” who are
retired residents of colder climate
regions who spend their winter in
Yuma. Algodones has established itself as an inexpensive source of medicine and medical care
for these part-time Yuma residents. Chart 34 evidences this phenomenon in that 43 percent of
weekday passenger vehicle cross border trips are medically related, with another 27 percent
shopping. On weekends, medical trips decline significantly and shopping assumes the position of
primary trip purpose (40 percent), with traveling home comprising 25 percent.
Work trips represent 9 percent of weekday trips and 10 percent of weekend trips. The
occupations held by weekend passenger vehicle cross border commuters at Algodones are
agriculture (23 percent), manufacturing (14 percent), and construction (12 percent). On
weekends, commuters are also significantly involved in other occupations, such as doctors,
dentists, lawyers, teachers, and students (27 percent).
Origin/Destination: In contrast to Mexicali/Calexico Downtown and Calexico East (home-
based trips representing more than 90 percent of all trips), only 72 percent of weekday trips and
73 percent of weekend trips are home-based—Chart 35. Reflecting the large medical supplies
and services market in Algodones, home-other than home or work is most prominent on
weekdays in particular (34 percent) and not far below home-shopping (28 percent versus 21
percent) on weekends. A large share (22 percent) of weekend passenger vehicle border crossers
is making a home-work trip, likely reflected as a home trip purpose (25 percent) in Chart 34.
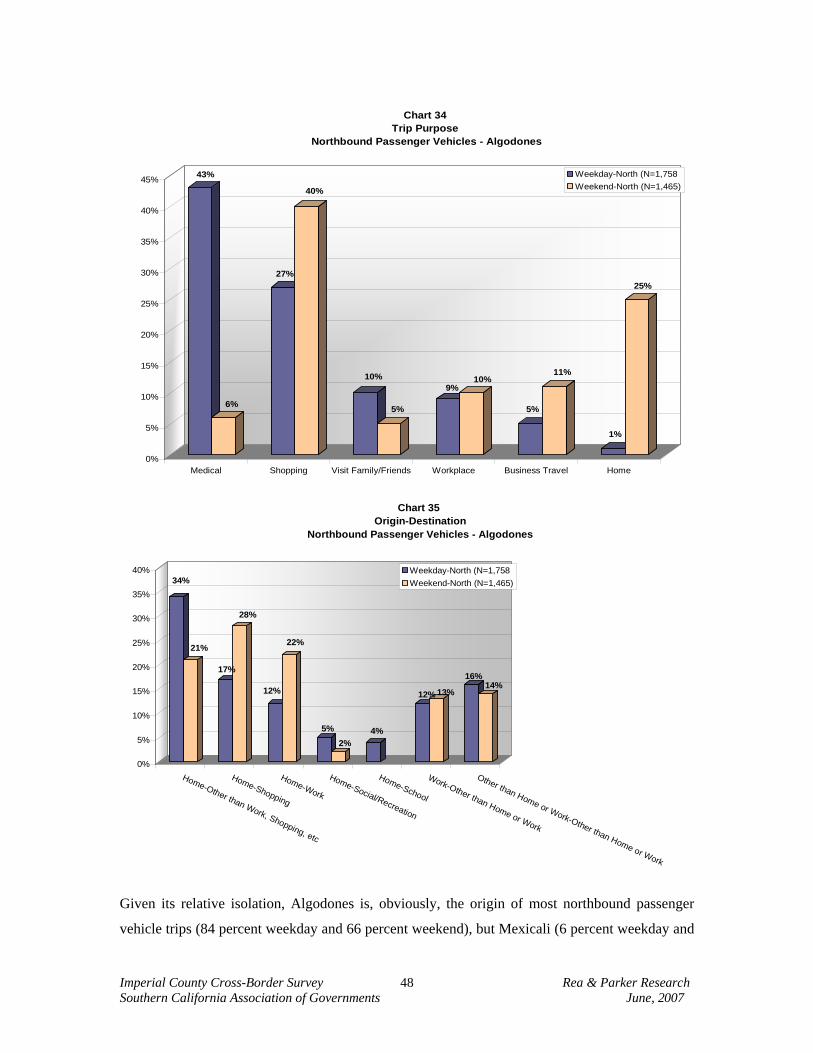
Imperial County Cross-Border Survey Rea & Parker Research Southern California Association of Governments June, 2007
48
43%
6%
27%
40%
10%
5%
9%10%
5%
11%
1%
25%
0%
5%
10%
15%
20%
25%
30%
35%
40%
45%
Medical Shopping Visit Family/Friends Workplace Business Travel Home
Chart 34Trip Purpose
Northbound Passenger Vehicles - Algodones
Weekday-North (N=1,758Weekend-North (N=1,465)
34%
21%
17%
28%
12%
22%
5%2%
4%
12% 13%
16%14%
0%
5%
10%
15%
20%
25%
30%
35%
40%
Home-Other than Work, Shopping, etc
Home-Shopping
Home-Work
Home-Social/Recreation
Home-School
Work-Other than Home or Work
Other than Home or Work-Other than Home or Work
Chart 35 Origin-Destination
Northbound Passenger Vehicles - Algodones
Weekday-North (N=1,758Weekend-North (N=1,465)
Given its relative isolation, Algodones is, obviously, the origin of most northbound passenger
vehicle trips (84 percent weekday and 66 percent weekend), but Mexicali (6 percent weekday and
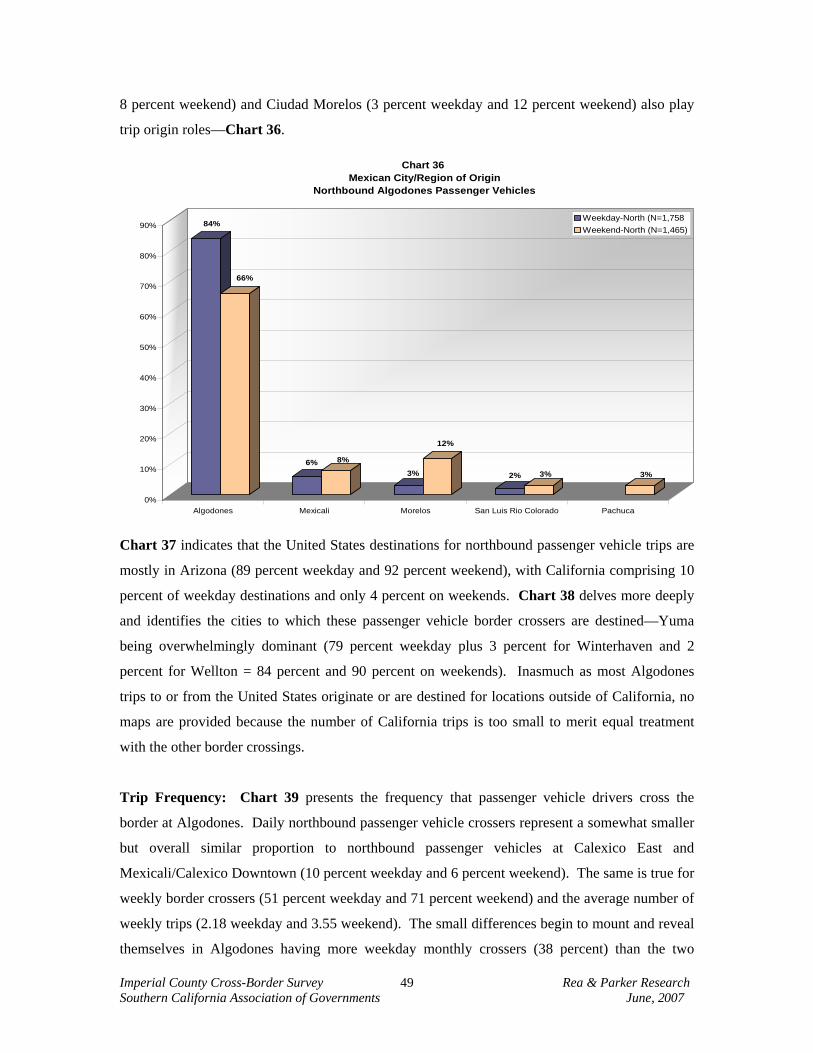
Imperial County Cross-Border Survey Rea & Parker Research Southern California Association of Governments June, 2007
49
8 percent weekend) and Ciudad Morelos (3 percent weekday and 12 percent weekend) also play
trip origin roles—Chart 36.
84%
66%
6% 8%
3%
12%
2% 3% 3%
0%
10%
20%
30%
40%
50%
60%
70%
80%
90%
Algodones Mexicali Morelos San Luis Rio Colorado Pachuca
Chart 36 Mexican City/Region of Origin
Northbound Algodones Passenger Vehicles
Weekday-North (N=1,758Weekend-North (N=1,465)
Chart 37 indicates that the United States destinations for northbound passenger vehicle trips are
mostly in Arizona (89 percent weekday and 92 percent weekend), with California comprising 10
percent of weekday destinations and only 4 percent on weekends. Chart 38 delves more deeply
and identifies the cities to which these passenger vehicle border crossers are destined—Yuma
being overwhelmingly dominant (79 percent weekday plus 3 percent for Winterhaven and 2
percent for Wellton = 84 percent and 90 percent on weekends). Inasmuch as most Algodones
trips to or from the United States originate or are destined for locations outside of California, no
maps are provided because the number of California trips is too small to merit equal treatment
with the other border crossings.
Trip Frequency: Chart 39 presents the frequency that passenger vehicle drivers cross the
border at Algodones. Daily northbound passenger vehicle crossers represent a somewhat smaller
but overall similar proportion to northbound passenger vehicles at Calexico East and
Mexicali/Calexico Downtown (10 percent weekday and 6 percent weekend). The same is true for
weekly border crossers (51 percent weekday and 71 percent weekend) and the average number of
weekly trips (2.18 weekday and 3.55 weekend). The small differences begin to mount and reveal
themselves in Algodones having more weekday monthly crossers (38 percent) than the two
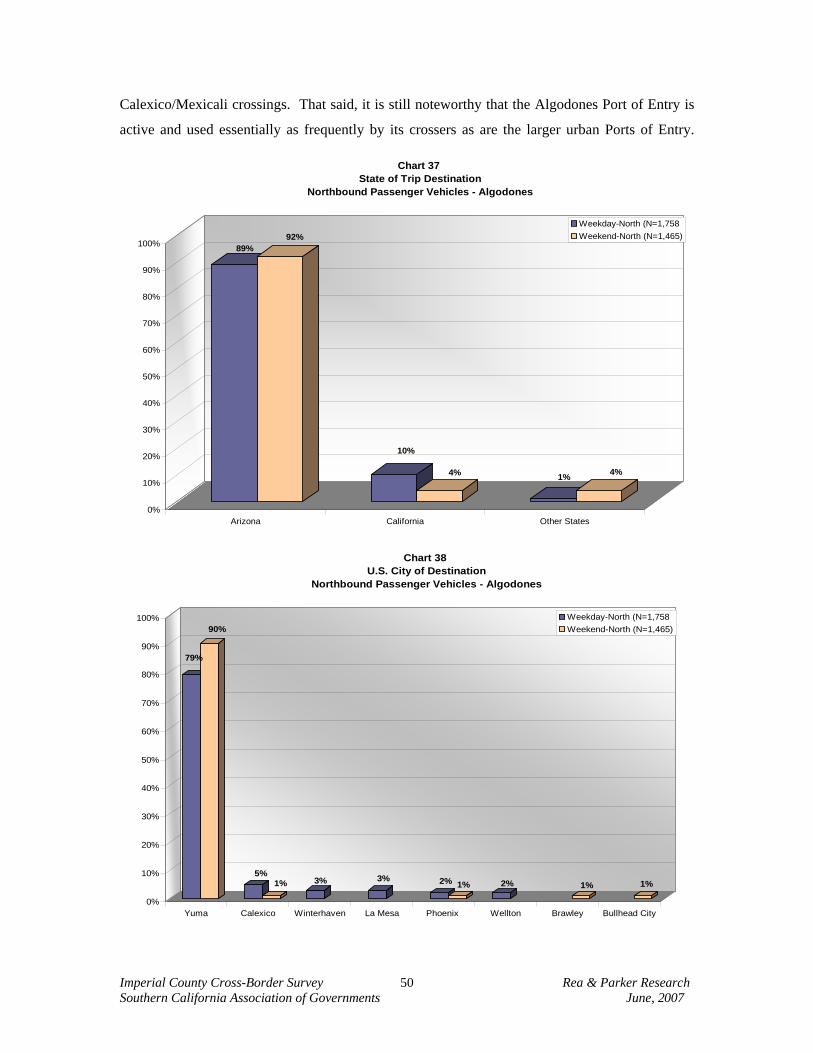
Imperial County Cross-Border Survey Rea & Parker Research Southern California Association of Governments June, 2007
50
Calexico/Mexicali crossings. That said, it is still noteworthy that the Algodones Port of Entry is
active and used essentially as frequently by its crossers as are the larger urban Ports of Entry.
89%92%
10%
4% 1% 4%
0%
10%
20%
30%
40%
50%
60%
70%
80%
90%
100%
Arizona California Other States
Chart 37 State of Trip Destination
Northbound Passenger Vehicles - Algodones
Weekday-North (N=1,758Weekend-North (N=1,465)
79%
90%
5%1% 3% 3% 2% 1% 2% 1% 1%
0%
10%
20%
30%
40%
50%
60%
70%
80%
90%
100%
Yuma Calexico Winterhaven La Mesa Phoenix Wellton Brawley Bullhead City
Chart 38 U.S. City of Destination
Northbound Passenger Vehicles - Algodones
Weekday-North (N=1,758Weekend-North (N=1,465)
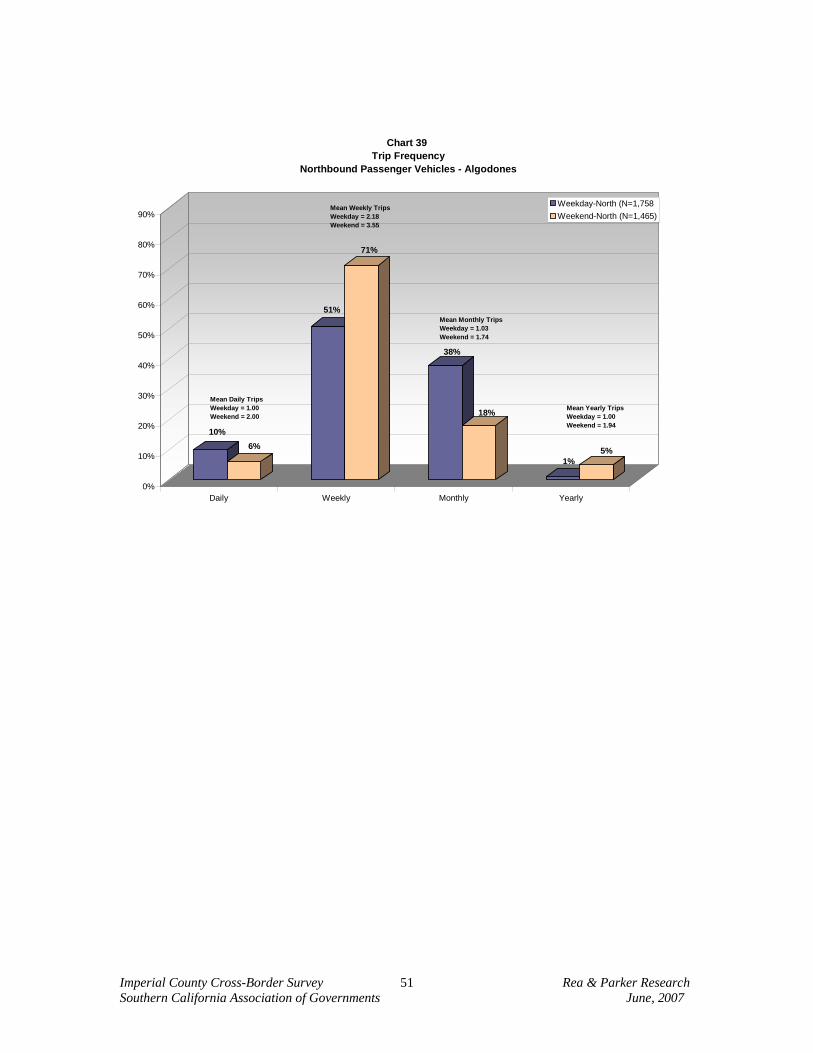
Imperial County Cross-Border Survey Rea & Parker Research Southern California Association of Governments June, 2007
51
10%6%
51%
71%
38%
18%
1%5%
0%
10%
20%
30%
40%
50%
60%
70%
80%
90%
Daily Weekly Monthly Yearly
Chart 39 Trip Frequency
Northbound Passenger Vehicles - Algodones
Weekday-North (N=1,758Weekend-North (N=1,465)
Mean Daily TripsWeekday = 1.00Weekend = 2.00
Mean Weekly TripsWeekday = 2.18Weekend = 3.55
Mean Monthly TripsWeekday = 1.03Weekend = 1.74
Mean Yearly TripsWeekday = 1.00Weekend = 1.94
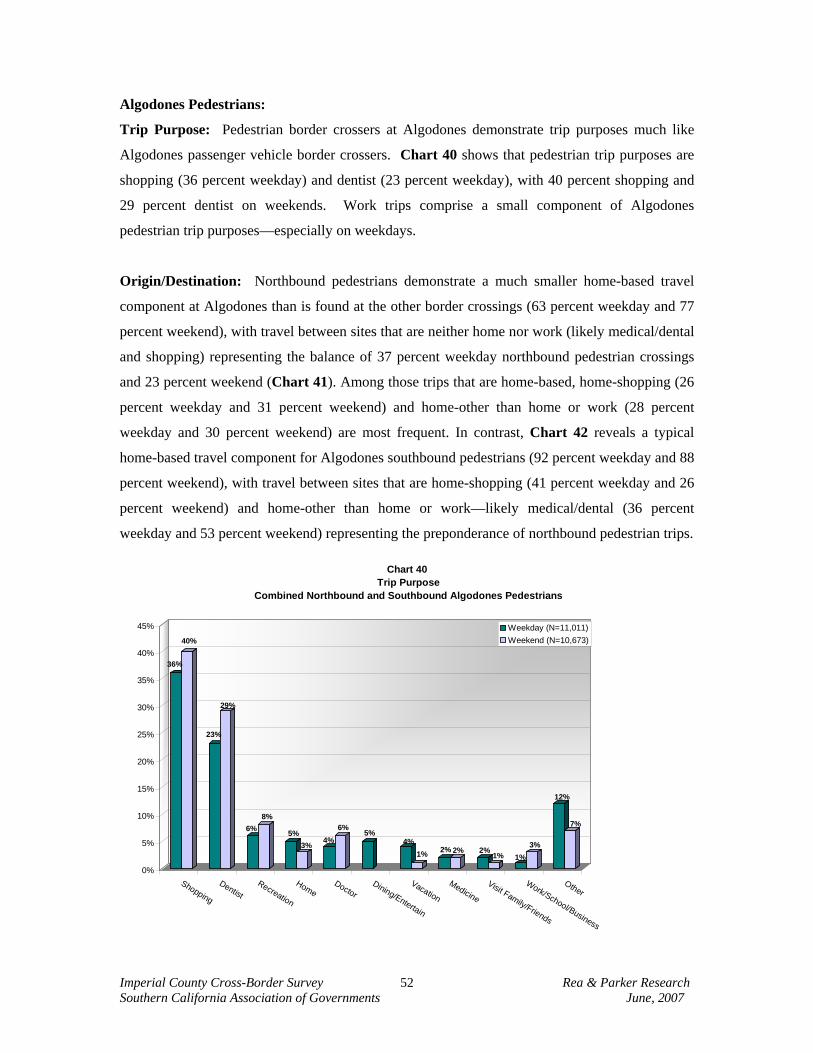
Imperial County Cross-Border Survey Rea & Parker Research Southern California Association of Governments June, 2007
52
Algodones Pedestrians:
Trip Purpose: Pedestrian border crossers at Algodones demonstrate trip purposes much like
Algodones passenger vehicle border crossers. Chart 40 shows that pedestrian trip purposes are
shopping (36 percent weekday) and dentist (23 percent weekday), with 40 percent shopping and
29 percent dentist on weekends. Work trips comprise a small component of Algodones
pedestrian trip purposes—especially on weekdays.
Origin/Destination: Northbound pedestrians demonstrate a much smaller home-based travel
component at Algodones than is found at the other border crossings (63 percent weekday and 77
percent weekend), with travel between sites that are neither home nor work (likely medical/dental
and shopping) representing the balance of 37 percent weekday northbound pedestrian crossings
and 23 percent weekend (Chart 41). Among those trips that are home-based, home-shopping (26
percent weekday and 31 percent weekend) and home-other than home or work (28 percent
weekday and 30 percent weekend) are most frequent. In contrast, Chart 42 reveals a typical
home-based travel component for Algodones southbound pedestrians (92 percent weekday and 88
percent weekend), with travel between sites that are home-shopping (41 percent weekday and 26
percent weekend) and home-other than home or work—likely medical/dental (36 percent
weekday and 53 percent weekend) representing the preponderance of northbound pedestrian trips.
36%
40%
23%
29%
6%8%
5%3% 4%
6%5%
4%1% 2% 2% 2%
1% 1%3%
12%
7%
0%
5%
10%
15%
20%
25%
30%
35%
40%
45%
Shopping
DentistRecreation
HomeDoctor
Dining/Entertain
Vacation
Medicine
Visit Family/Friends
Work/School/Business
Other
Chart 40 Trip Purpose
Combined Northbound and Southbound Algodones Pedestrians
Weekday (N=11,011)Weekend (N=10,673)
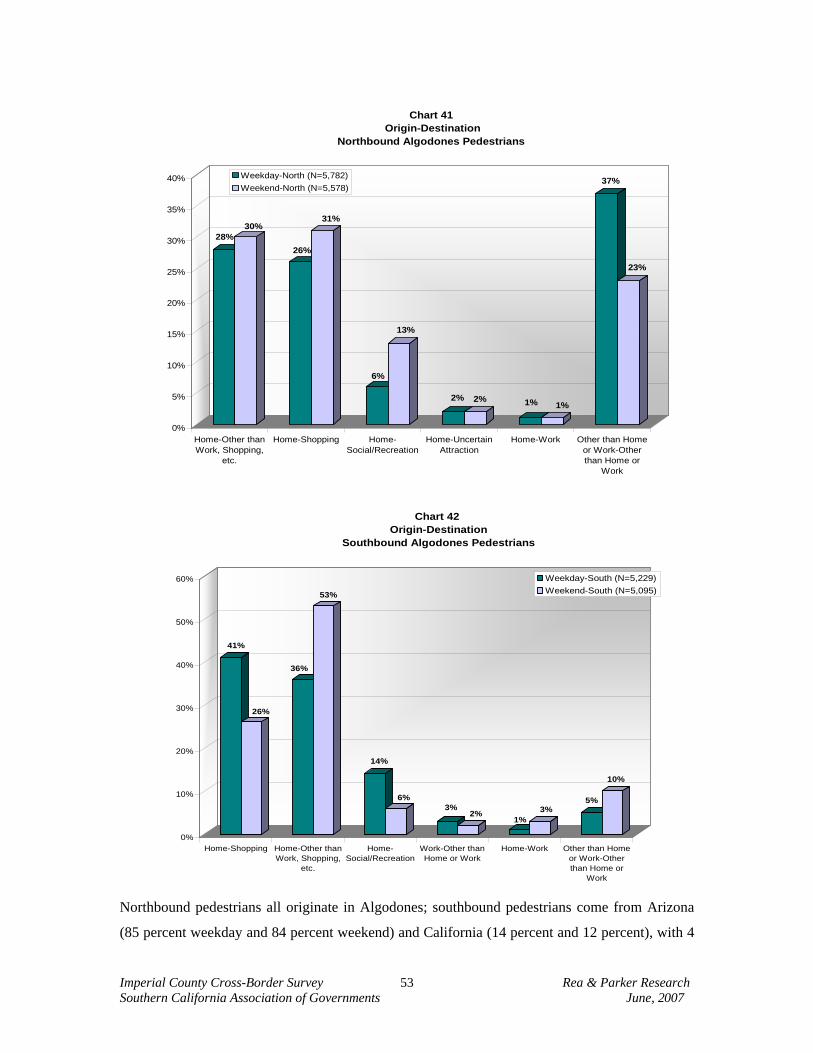
Imperial County Cross-Border Survey Rea & Parker Research Southern California Association of Governments June, 2007
53
28%30%
26%
31%
6%
13%
2% 2% 1% 1%
37%
23%
0%
5%
10%
15%
20%
25%
30%
35%
40%
Home-Other thanWork, Shopping,
etc.
Home-Shopping Home-Social/Recreation
Home-UncertainAttraction
Home-Work Other than Homeor Work-Otherthan Home or
Work
Chart 41 Origin-Destination
Northbound Algodones Pedestrians
Weekday-North (N=5,782)Weekend-North (N=5,578)
41%
26%
36%
53%
14%
6%3%
2%1%
3%5%
10%
0%
10%
20%
30%
40%
50%
60%
Home-Shopping Home-Other thanWork, Shopping,
etc.
Home-Social/Recreation
Work-Other thanHome or Work
Home-Work Other than Homeor Work-Otherthan Home or
Work
Chart 42 Origin-Destination
Southbound Algodones Pedestrians
Weekday-South (N=5,229)Weekend-South (N=5,095)
Northbound pedestrians all originate in Algodones; southbound pedestrians come from Arizona
(85 percent weekday and 84 percent weekend) and California (14 percent and 12 percent), with 4
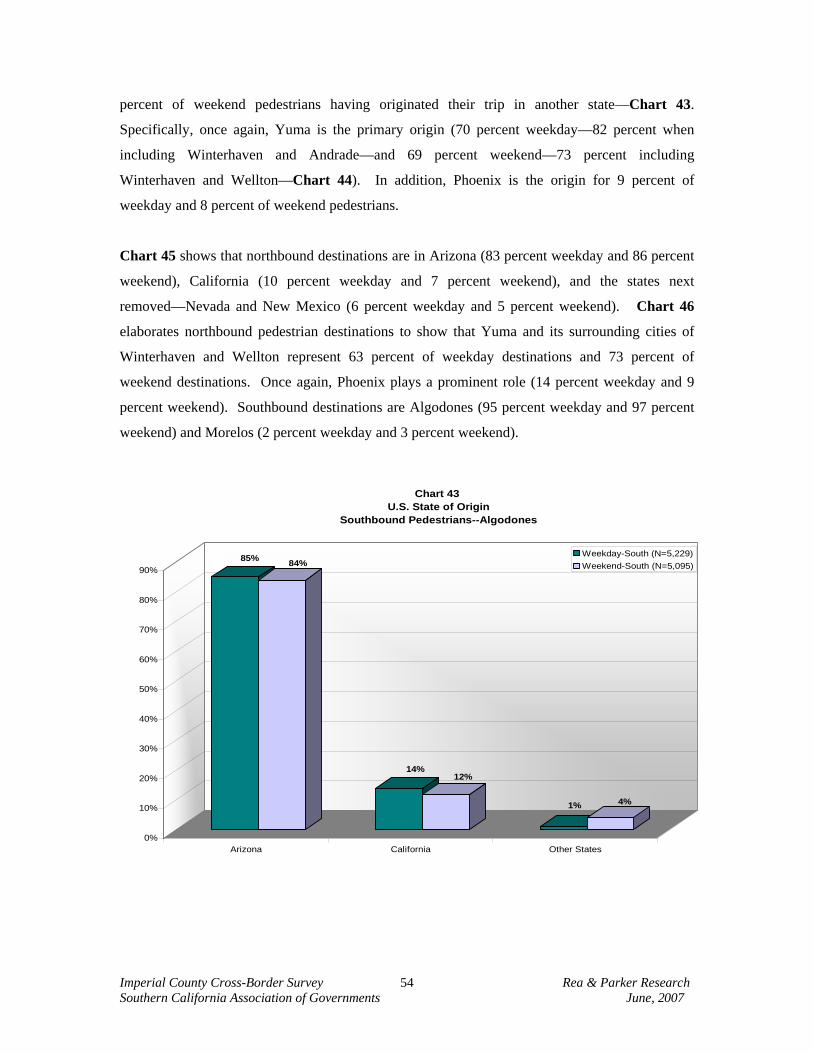
Imperial County Cross-Border Survey Rea & Parker Research Southern California Association of Governments June, 2007
54
percent of weekend pedestrians having originated their trip in another state—Chart 43.
Specifically, once again, Yuma is the primary origin (70 percent weekday—82 percent when
including Winterhaven and Andrade—and 69 percent weekend—73 percent including
Winterhaven and Wellton—Chart 44). In addition, Phoenix is the origin for 9 percent of
weekday and 8 percent of weekend pedestrians.
Chart 45 shows that northbound destinations are in Arizona (83 percent weekday and 86 percent
weekend), California (10 percent weekday and 7 percent weekend), and the states next
removed—Nevada and New Mexico (6 percent weekday and 5 percent weekend). Chart 46
elaborates northbound pedestrian destinations to show that Yuma and its surrounding cities of
Winterhaven and Wellton represent 63 percent of weekday destinations and 73 percent of
weekend destinations. Once again, Phoenix plays a prominent role (14 percent weekday and 9
percent weekend). Southbound destinations are Algodones (95 percent weekday and 97 percent
weekend) and Morelos (2 percent weekday and 3 percent weekend).
85% 84%
14%12%
1% 4%
0%
10%
20%
30%
40%
50%
60%
70%
80%
90%
Arizona California Other States
Chart 43 U.S. State of Origin
Southbound Pedestrians--Algodones
Weekday-South (N=5,229)Weekend-South (N=5,095)
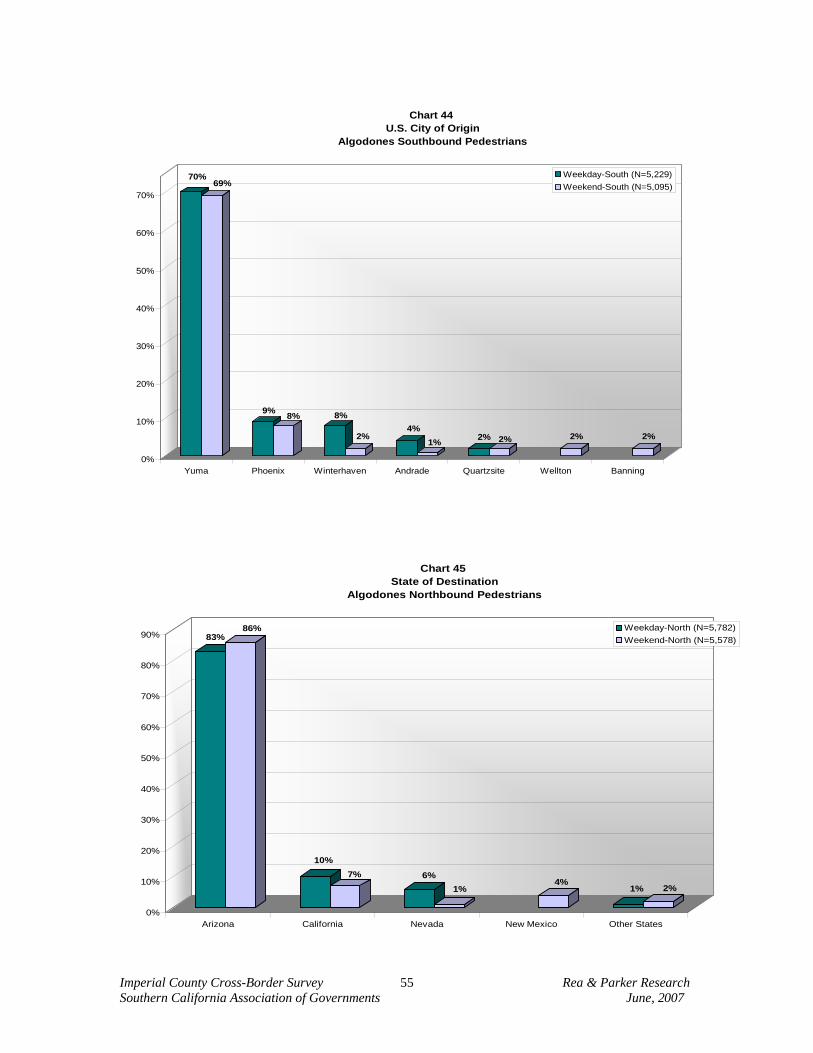
Imperial County Cross-Border Survey Rea & Parker Research Southern California Association of Governments June, 2007
55
70%69%
9% 8% 8%
2%4%
1% 2% 2% 2% 2%
0%
10%
20%
30%
40%
50%
60%
70%
Yuma Phoenix Winterhaven Andrade Quartzsite Wellton Banning
Chart 44 U.S. City of Origin
Algodones Southbound Pedestrians
Weekday-South (N=5,229)Weekend-South (N=5,095)
83%86%
10%7% 6%
1%4%
1% 2%
0%
10%
20%
30%
40%
50%
60%
70%
80%
90%
Arizona California Nevada New Mexico Other States
Chart 45 State of Destination
Algodones Northbound Pedestrians
Weekday-North (N=5,782)Weekend-North (N=5,578)
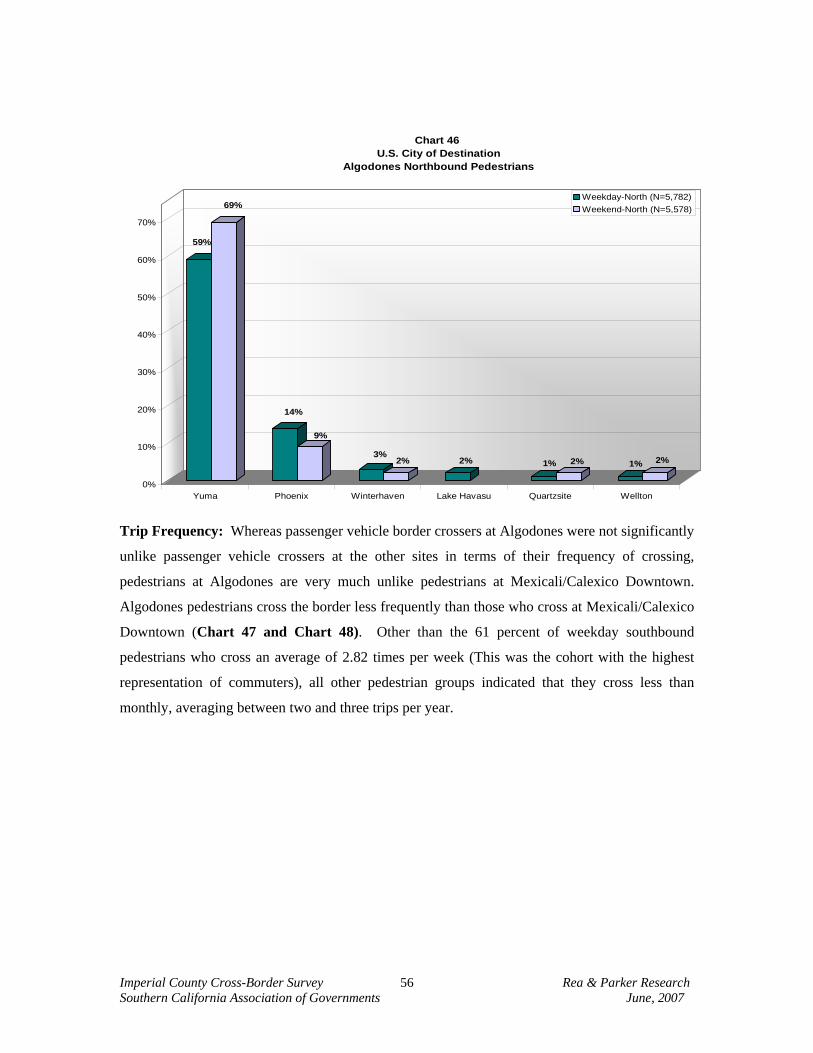
Imperial County Cross-Border Survey Rea & Parker Research Southern California Association of Governments June, 2007
56
59%
69%
14%
9%
3%2% 2% 1% 2% 1% 2%
0%
10%
20%
30%
40%
50%
60%
70%
Yuma Phoenix Winterhaven Lake Havasu Quartzsite Wellton
Chart 46 U.S. City of Destination
Algodones Northbound Pedestrians
Weekday-North (N=5,782)Weekend-North (N=5,578)
Trip Frequency: Whereas passenger vehicle border crossers at Algodones were not significantly
unlike passenger vehicle crossers at the other sites in terms of their frequency of crossing,
pedestrians at Algodones are very much unlike pedestrians at Mexicali/Calexico Downtown.
Algodones pedestrians cross the border less frequently than those who cross at Mexicali/Calexico
Downtown (Chart 47 and Chart 48). Other than the 61 percent of weekday southbound
pedestrians who cross an average of 2.82 times per week (This was the cohort with the highest
representation of commuters), all other pedestrian groups indicated that they cross less than
monthly, averaging between two and three trips per year.
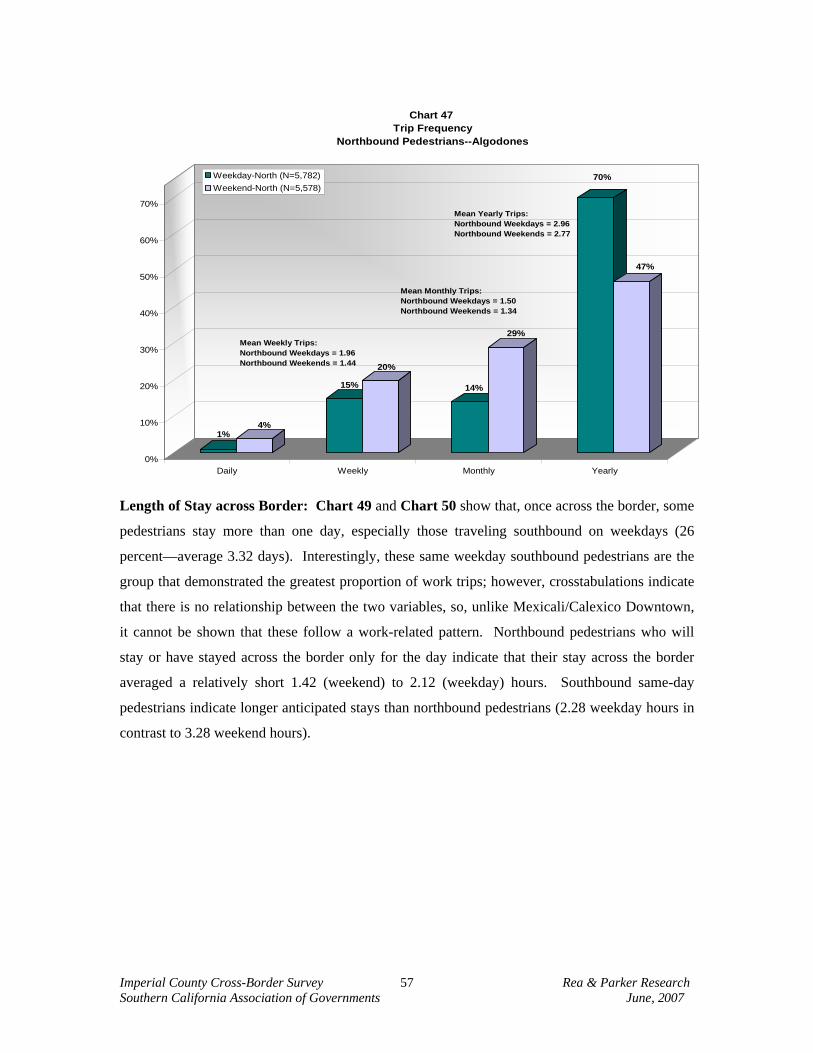
Imperial County Cross-Border Survey Rea & Parker Research Southern California Association of Governments June, 2007
57
1%4%
15%
20%
14%
29%
70%
47%
0%
10%
20%
30%
40%
50%
60%
70%
Daily Weekly Monthly Yearly
Chart 47 Trip Frequency
Northbound Pedestrians--Algodones
Weekday-North (N=5,782)Weekend-North (N=5,578)
Mean Weekly Trips:Northbound Weekdays = 1.96Northbound Weekends = 1.44
Mean Monthly Trips:Northbound Weekdays = 1.50Northbound Weekends = 1.34
Mean Yearly Trips:Northbound Weekdays = 2.96Northbound Weekends = 2.77
Length of Stay across Border: Chart 49 and Chart 50 show that, once across the border, some
pedestrians stay more than one day, especially those traveling southbound on weekdays (26
percent—average 3.32 days). Interestingly, these same weekday southbound pedestrians are the
group that demonstrated the greatest proportion of work trips; however, crosstabulations indicate
that there is no relationship between the two variables, so, unlike Mexicali/Calexico Downtown,
it cannot be shown that these follow a work-related pattern. Northbound pedestrians who will
stay or have stayed across the border only for the day indicate that their stay across the border
averaged a relatively short 1.42 (weekend) to 2.12 (weekday) hours. Southbound same-day
pedestrians indicate longer anticipated stays than northbound pedestrians (2.28 weekday hours in
contrast to 3.28 weekend hours).
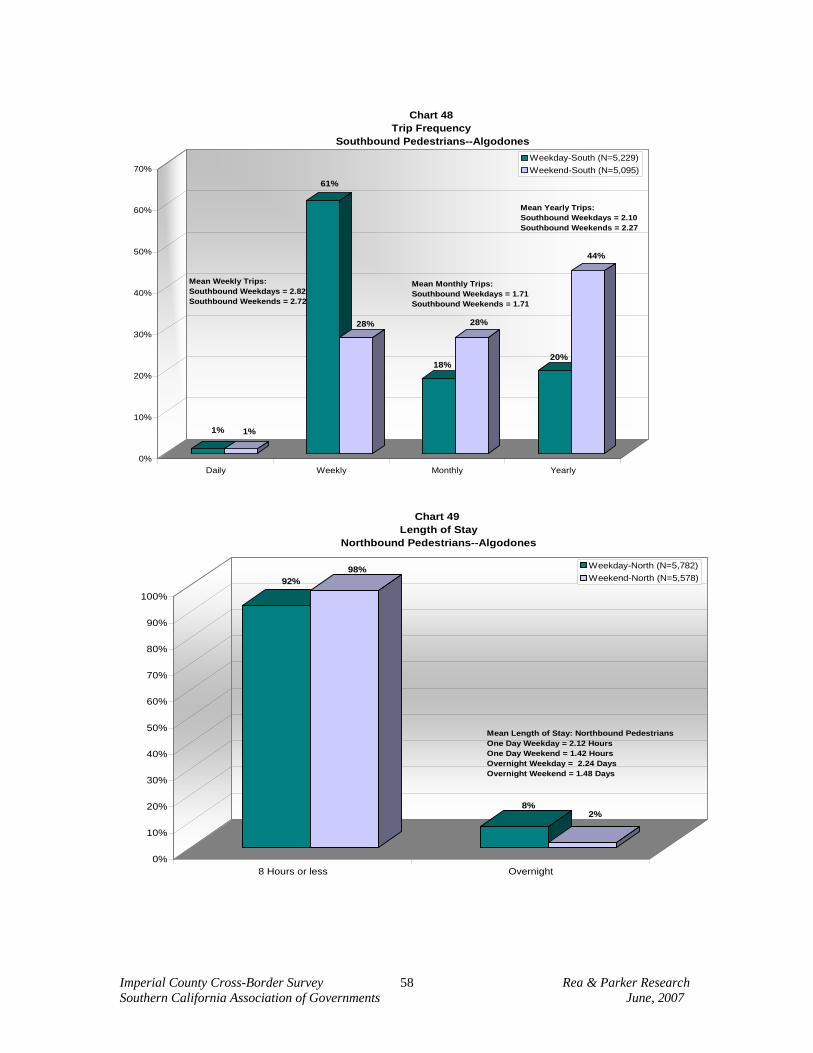
Imperial County Cross-Border Survey Rea & Parker Research Southern California Association of Governments June, 2007
58
1% 1%
61%
28%
18%
28%
20%
44%
0%
10%
20%
30%
40%
50%
60%
70%
Daily Weekly Monthly Yearly
Chart 48 Trip Frequency
Southbound Pedestrians--AlgodonesWeekday-South (N=5,229)Weekend-South (N=5,095)
Mean Weekly Trips:Southbound Weekdays = 2.82Southbound Weekends = 2.72
Mean Monthly Trips:Southbound Weekdays = 1.71Southbound Weekends = 1.71
Mean Yearly Trips:Southbound Weekdays = 2.10Southbound Weekends = 2.27
92%98%
8%2%
0%
10%
20%
30%
40%
50%
60%
70%
80%
90%
100%
8 Hours or less Overnight
Chart 49 Length of Stay
Northbound Pedestrians--Algodones
Weekday-North (N=5,782)Weekend-North (N=5,578)
Mean Length of Stay: Northbound PedestriansOne Day Weekday = 2.12 HoursOne Day Weekend = 1.42 HoursOvernight Weekday = 2.24 DaysOvernight Weekend = 1.48 Days
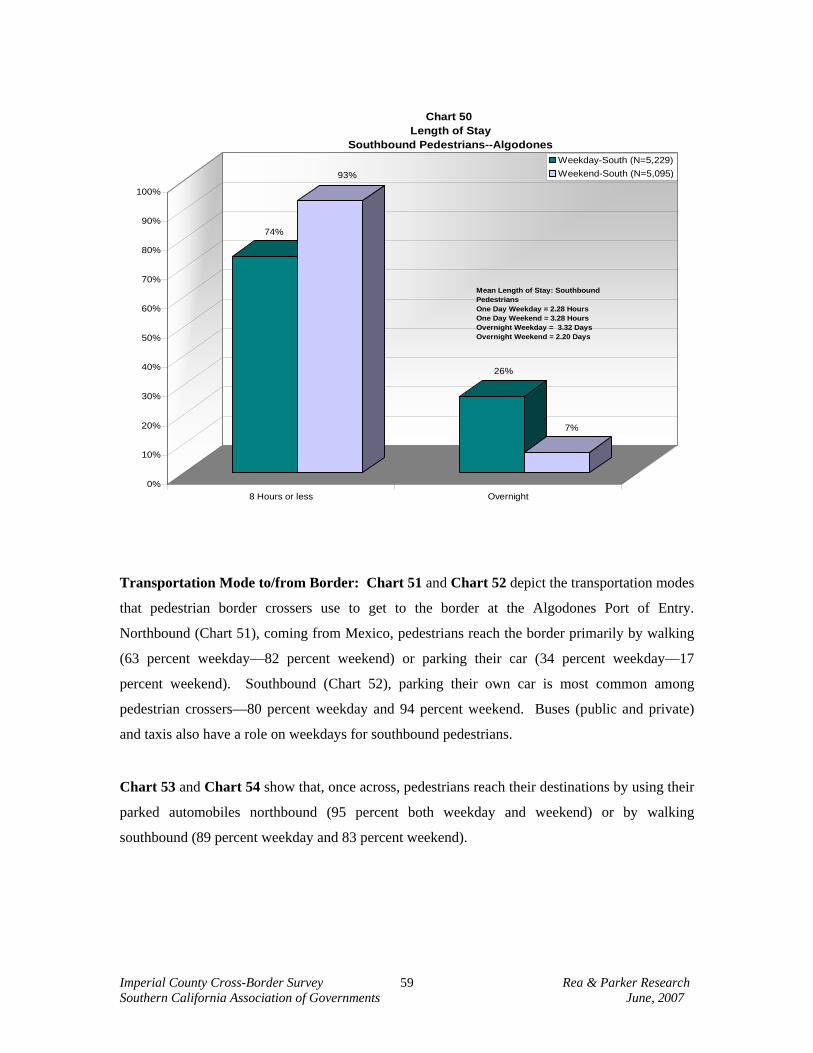
Imperial County Cross-Border Survey Rea & Parker Research Southern California Association of Governments June, 2007
59
74%
93%
26%
7%
0%
10%
20%
30%
40%
50%
60%
70%
80%
90%
100%
8 Hours or less Overnight
Chart 50 Length of Stay
Southbound Pedestrians--AlgodonesWeekday-South (N=5,229)Weekend-South (N=5,095)
Mean Length of Stay: Southbound PedestriansOne Day Weekday = 2.28 HoursOne Day Weekend = 3.28 HoursOvernight Weekday = 3.32 DaysOvernight Weekend = 2.20 Days
Transportation Mode to/from Border: Chart 51 and Chart 52 depict the transportation modes
that pedestrian border crossers use to get to the border at the Algodones Port of Entry.
Northbound (Chart 51), coming from Mexico, pedestrians reach the border primarily by walking
(63 percent weekday—82 percent weekend) or parking their car (34 percent weekday—17
percent weekend). Southbound (Chart 52), parking their own car is most common among
pedestrian crossers—80 percent weekday and 94 percent weekend. Buses (public and private)
and taxis also have a role on weekdays for southbound pedestrians.
Chart 53 and Chart 54 show that, once across, pedestrians reach their destinations by using their
parked automobiles northbound (95 percent both weekday and weekend) or by walking
southbound (89 percent weekday and 83 percent weekend).
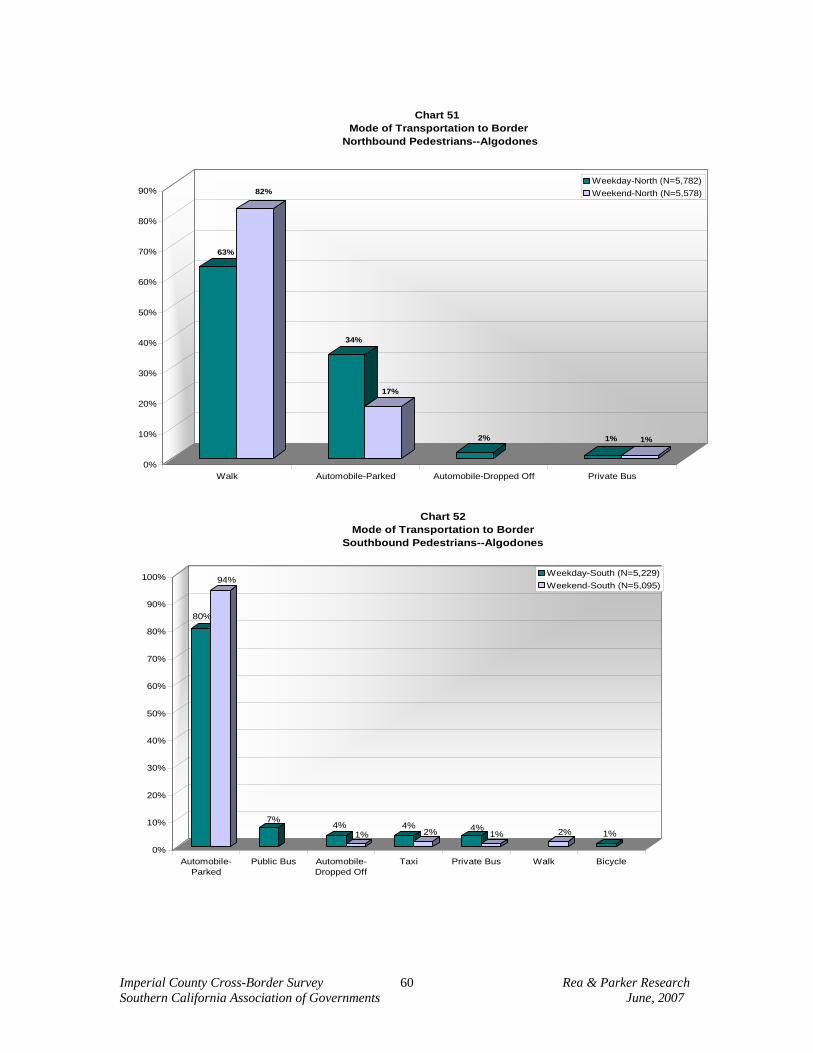
Imperial County Cross-Border Survey Rea & Parker Research Southern California Association of Governments June, 2007
60
63%
82%
34%
17%
2% 1% 1%
0%
10%
20%
30%
40%
50%
60%
70%
80%
90%
Walk Automobile-Parked Automobile-Dropped Off Private Bus
Chart 51 Mode of Transportation to Border
Northbound Pedestrians--Algodones
Weekday-North (N=5,782)Weekend-North (N=5,578)
80%
94%
7% 4%1%
4%2% 4%
1% 2% 1%
0%
10%
20%
30%
40%
50%
60%
70%
80%
90%
100%
Automobile-Parked
Public Bus Automobile-Dropped Off
Taxi Private Bus Walk Bicycle
Chart 52 Mode of Transportation to Border
Southbound Pedestrians--Algodones
Weekday-South (N=5,229)Weekend-South (N=5,095)
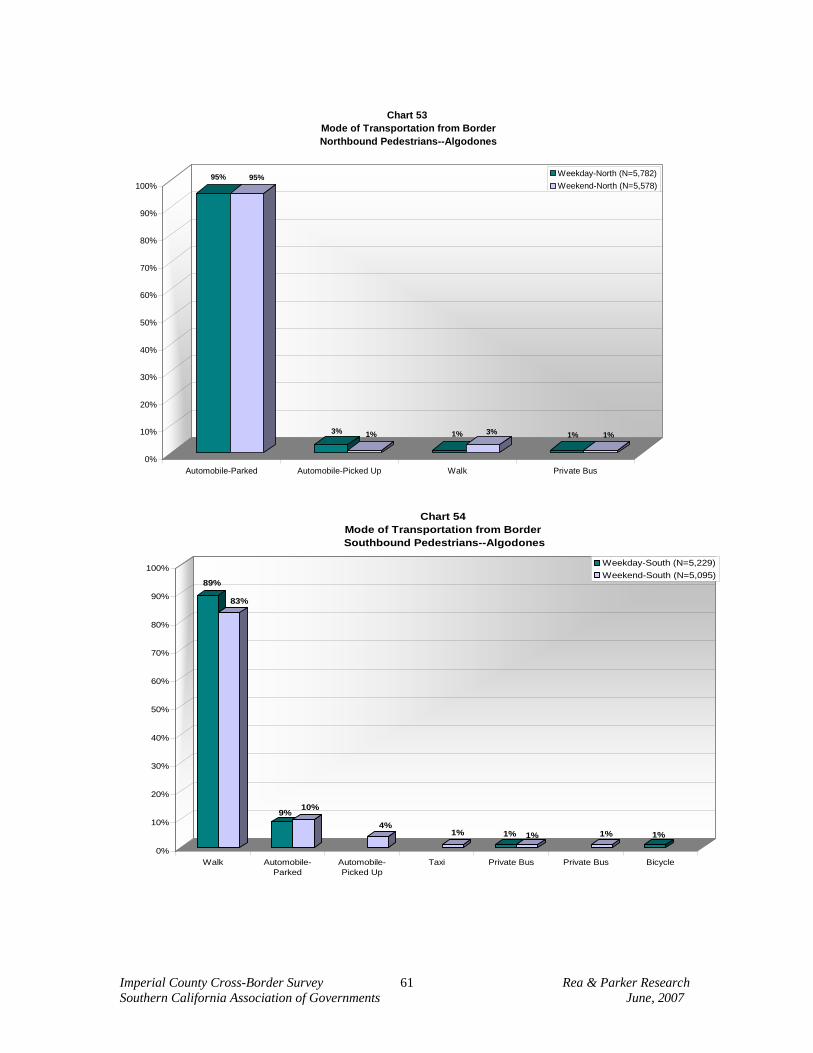
Imperial County Cross-Border Survey Rea & Parker Research Southern California Association of Governments June, 2007
61
95% 95%
3% 1% 1% 3% 1% 1%
0%
10%
20%
30%
40%
50%
60%
70%
80%
90%
100%
Automobile-Parked Automobile-Picked Up Walk Private Bus
Chart 53 Mode of Transportation from Border Northbound Pedestrians--Algodones
Weekday-North (N=5,782)Weekend-North (N=5,578)
89%
83%
9% 10%
4%1% 1% 1% 1% 1%
0%
10%
20%
30%
40%
50%
60%
70%
80%
90%
100%
Walk Automobile-Parked
Automobile-Picked Up
Taxi Private Bus Private Bus Bicycle
Chart 54 Mode of Transportation from Border
Southbound Pedestrians--Algodones
Weekday-South (N=5,229)Weekend-South (N=5,095)
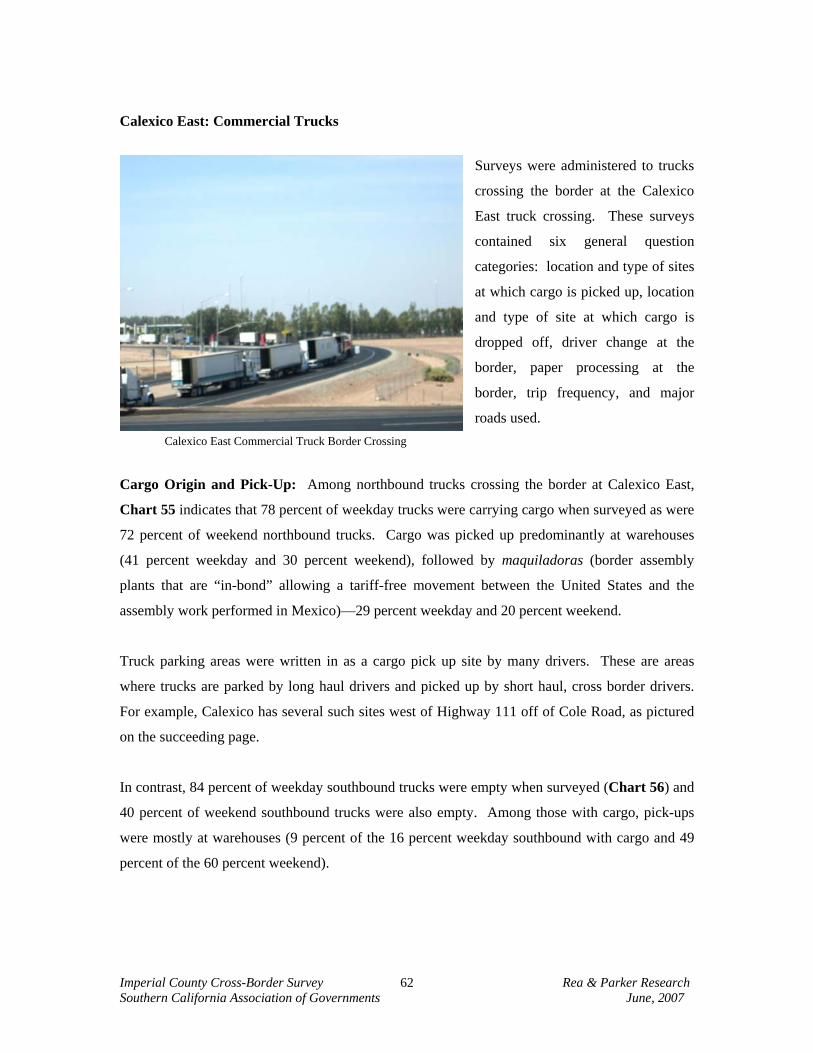
Imperial County Cross-Border Survey Rea & Parker Research Southern California Association of Governments June, 2007
62
Calexico East: Commercial Trucks
Surveys were administered to trucks
crossing the border at the Calexico
East truck crossing. These surveys
contained six general question
categories: location and type of sites
at which cargo is picked up, location
and type of site at which cargo is
dropped off, driver change at the
border, paper processing at the
border, trip frequency, and major
roads used. Calexico East Commercial Truck Border Crossing
Cargo Origin and Pick-Up: Among northbound trucks crossing the border at Calexico East,
Chart 55 indicates that 78 percent of weekday trucks were carrying cargo when surveyed as were
72 percent of weekend northbound trucks. Cargo was picked up predominantly at warehouses
(41 percent weekday and 30 percent weekend), followed by maquiladoras (border assembly
plants that are “in-bond” allowing a tariff-free movement between the United States and the
assembly work performed in Mexico)—29 percent weekday and 20 percent weekend.
Truck parking areas were written in as a cargo pick up site by many drivers. These are areas
where trucks are parked by long haul drivers and picked up by short haul, cross border drivers.
For example, Calexico has several such sites west of Highway 111 off of Cole Road, as pictured
on the succeeding page.
In contrast, 84 percent of weekday southbound trucks were empty when surveyed (Chart 56) and
40 percent of weekend southbound trucks were also empty. Among those with cargo, pick-ups
were mostly at warehouses (9 percent of the 16 percent weekday southbound with cargo and 49
percent of the 60 percent weekend).
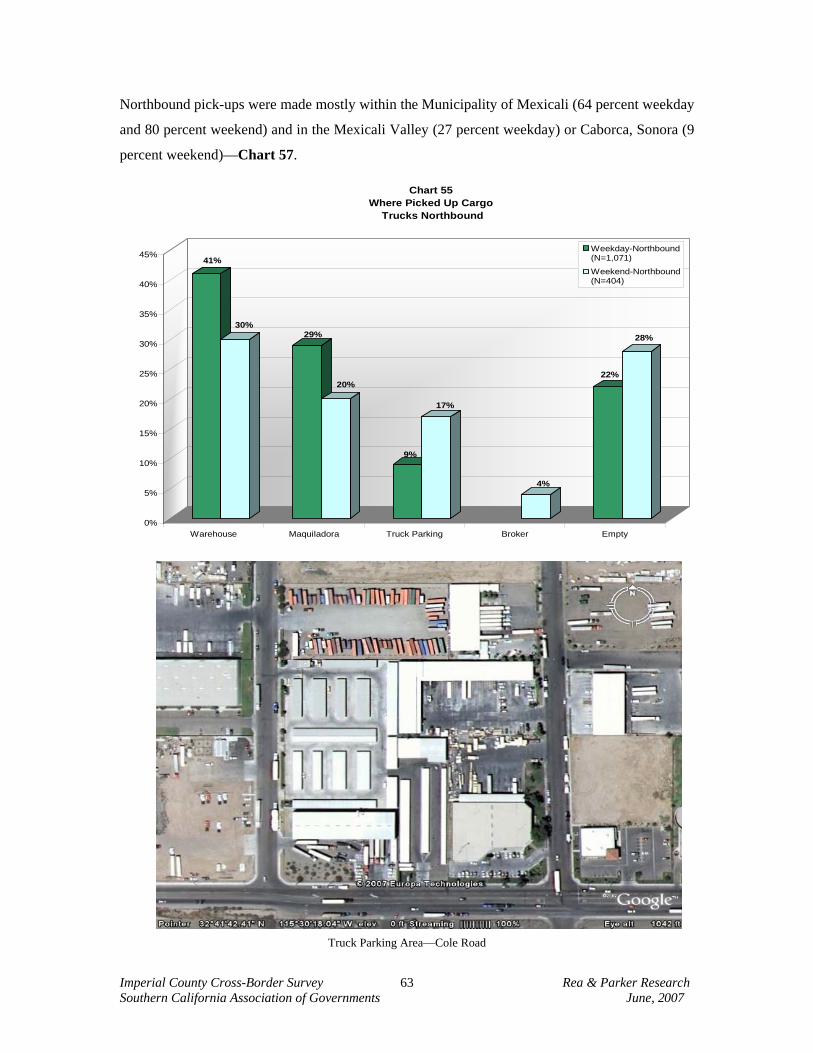
Imperial County Cross-Border Survey Rea & Parker Research Southern California Association of Governments June, 2007
63
Northbound pick-ups were made mostly within the Municipality of Mexicali (64 percent weekday
and 80 percent weekend) and in the Mexicali Valley (27 percent weekday) or Caborca, Sonora (9
percent weekend)—Chart 57.
41%
30%29%
20%
9%
17%
4%
22%
28%
0%
5%
10%
15%
20%
25%
30%
35%
40%
45%
Warehouse Maquiladora Truck Parking Broker Empty
Chart 55 Where Picked Up Cargo
Trucks Northbound
Weekday-Northbound(N=1,071)
Weekend-Northbound(N=404)
Truck Parking Area—Cole Road
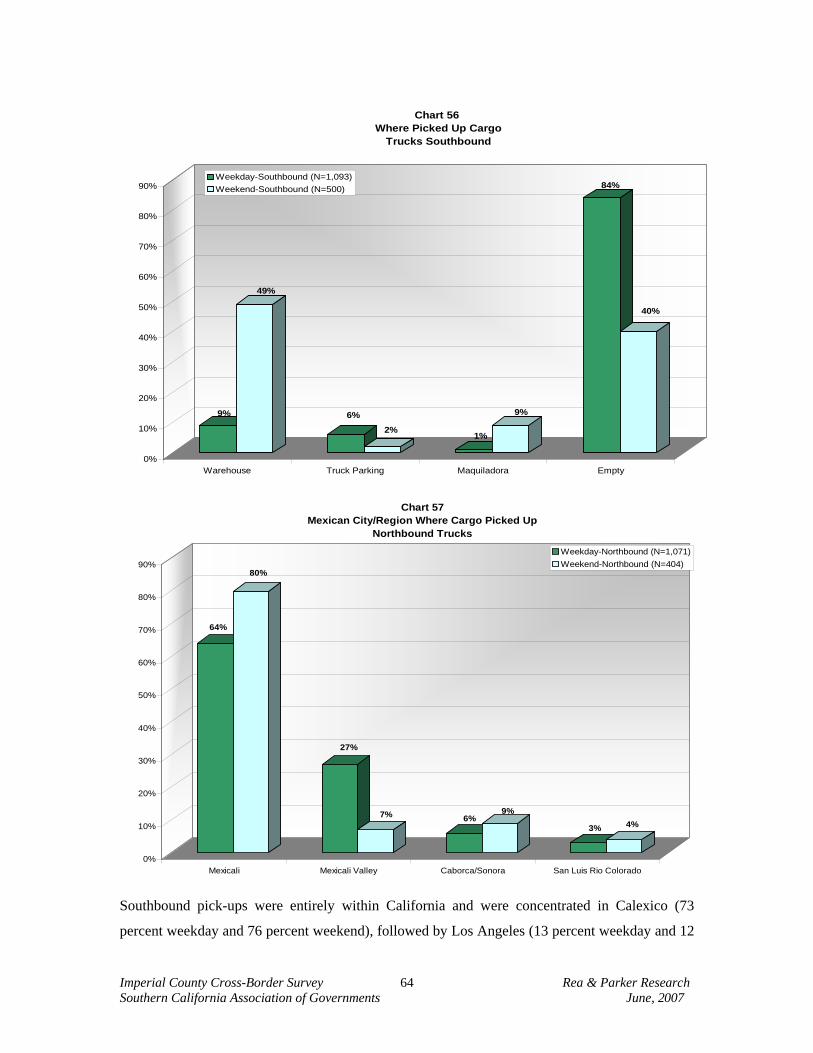
Imperial County Cross-Border Survey Rea & Parker Research Southern California Association of Governments June, 2007
64
9%
49%
6%
2%1%
9%
84%
40%
0%
10%
20%
30%
40%
50%
60%
70%
80%
90%
Warehouse Truck Parking Maquiladora Empty
Chart 56 Where Picked Up Cargo
Trucks Southbound
Weekday-Southbound (N=1,093)Weekend-Southbound (N=500)
64%
80%
27%
7% 6%9%
3% 4%
0%
10%
20%
30%
40%
50%
60%
70%
80%
90%
Mexicali Mexicali Valley Caborca/Sonora San Luis Rio Colorado
Chart 57 Mexican City/Region Where Cargo Picked Up
Northbound Trucks
Weekday-Northbound (N=1,071)Weekend-Northbound (N=404)
Southbound pick-ups were entirely within California and were concentrated in Calexico (73
percent weekday and 76 percent weekend), followed by Los Angeles (13 percent weekday and 12
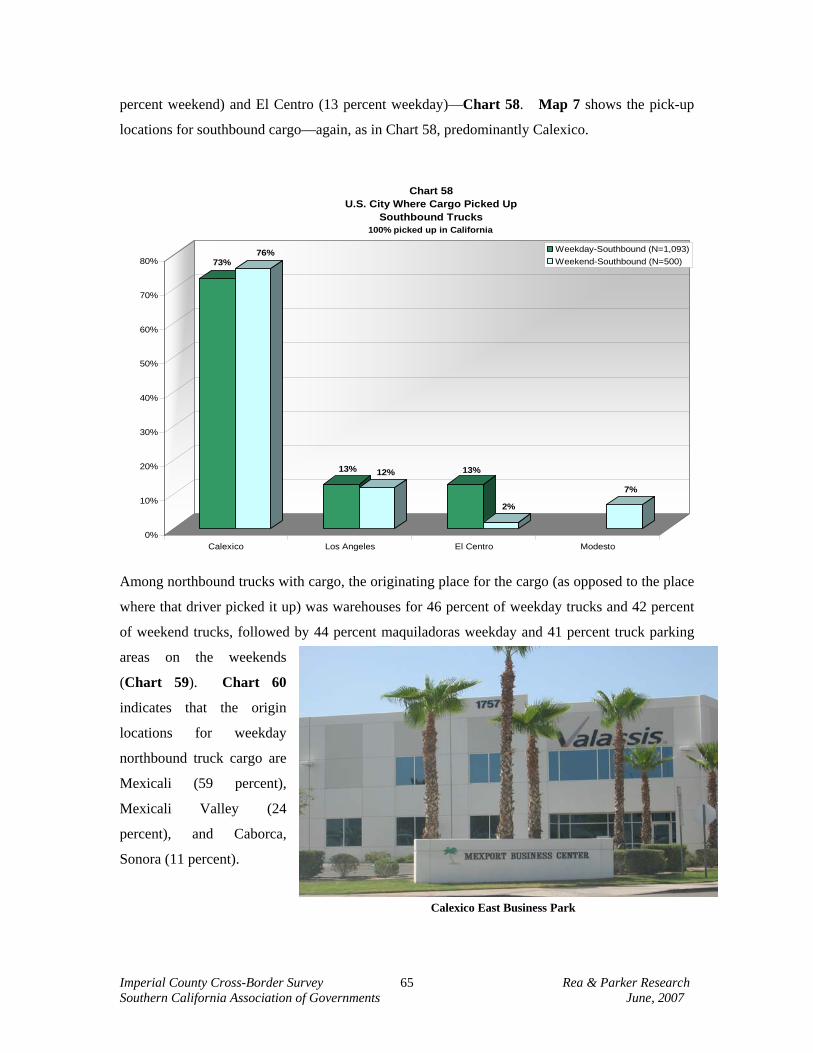
Imperial County Cross-Border Survey Rea & Parker Research Southern California Association of Governments June, 2007
65
percent weekend) and El Centro (13 percent weekday)—Chart 58. Map 7 shows the pick-up
locations for southbound cargo—again, as in Chart 58, predominantly Calexico.
73%76%
13% 12% 13%
2%
7%
0%
10%
20%
30%
40%
50%
60%
70%
80%
Calexico Los Angeles El Centro Modesto
Chart 58U.S. City Where Cargo Picked Up
Southbound Trucks
Weekday-Southbound (N=1,093)Weekend-Southbound (N=500)
100% picked up in California
Among northbound trucks with cargo, the originating place for the cargo (as opposed to the place
where that driver picked it up) was warehouses for 46 percent of weekday trucks and 42 percent
of weekend trucks, followed by 44 percent maquiladoras weekday and 41 percent truck parking
areas on the weekends
(Chart 59). Chart 60
indicates that the origin
locations for weekday
northbound truck cargo are
Mexicali (59 percent),
Mexicali Valley (24
percent), and Caborca,
Sonora (11 percent).
Calexico East Business Park
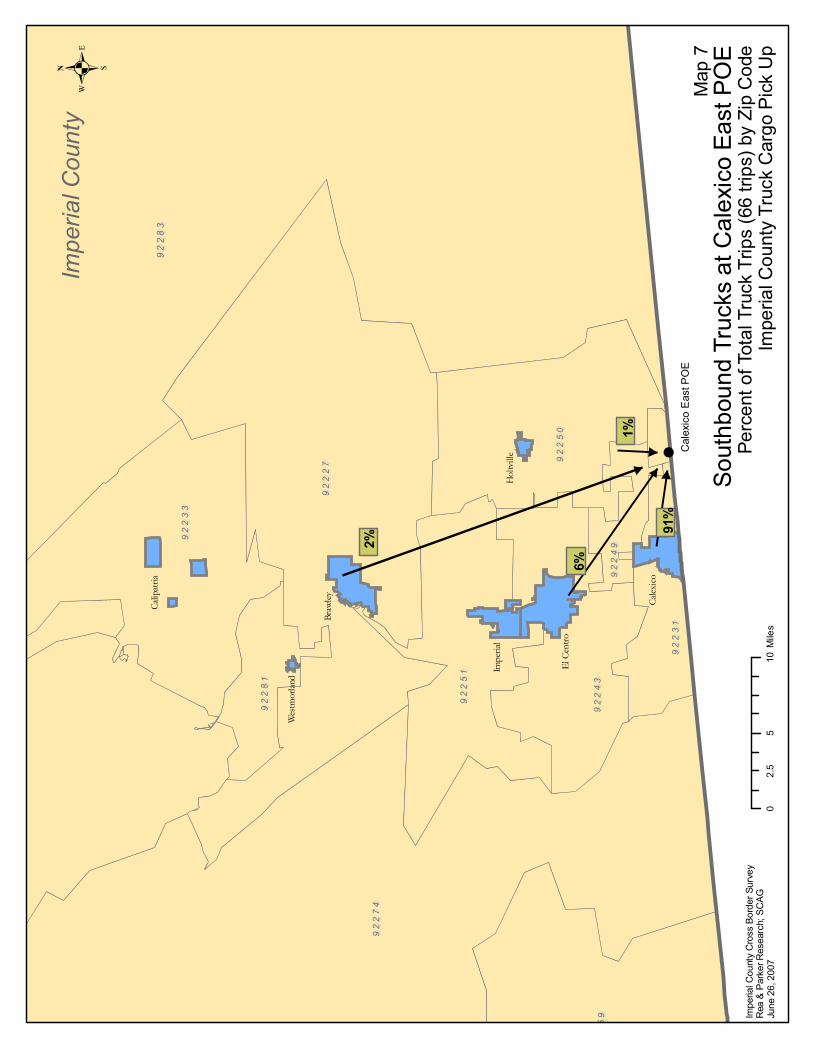
Cal
exic
oE
astP
OE
Calip
atria
Wes
tmor
land
Braw
ley
Impe
rial
ElCe
ntro
Calex
ico
Hol
tvill
e
92
28
39
22
83
1%
2%
91%
6%
92
27
49
22
74
92
22
79
22
27
92
25
99
22
59
92
25
19
22
51
92
24
39
22
43
92
25
09
22
50
92
23
19
22
31
92
28
19
22
81
92
24
99
22
49
92
23
39
22
33
.
Impe
rialC
ount
yC
ross
Bord
erSu
rvey
Rea
&Pa
rker
Res
earc
h;SC
AGJu
ne26
,200
7
Impe
rialC
ount
y
05
102.
5M
iles
Sout
hbou
ndTr
ucks
atC
alex
ico
East
POE
Perc
ento
fTot
alTr
uck
Trip
s(6
6tri
ps)b
yZi
pC
ode
Impe
rialC
ount
yTr
uck
Car
goP
ick
Up
Map
7
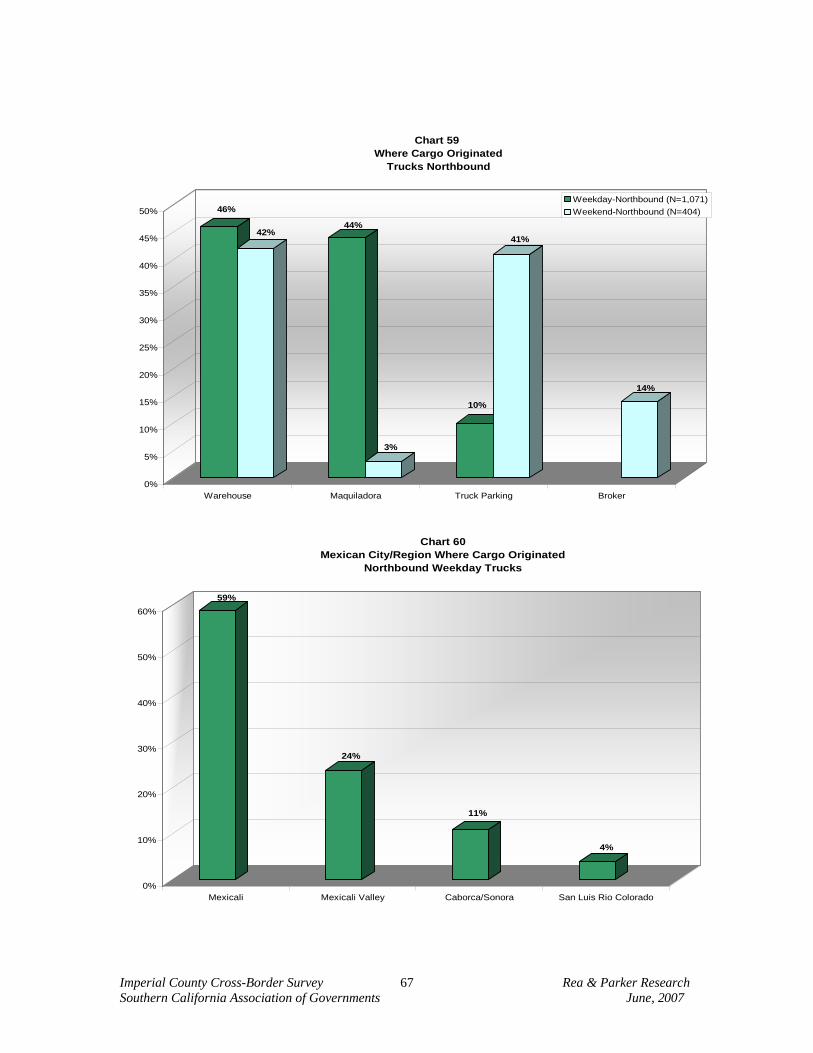
Imperial County Cross-Border Survey Rea & Parker Research Southern California Association of Governments June, 2007
67
46%
42%44%
3%
10%
41%
14%
0%
5%
10%
15%
20%
25%
30%
35%
40%
45%
50%
Warehouse Maquiladora Truck Parking Broker
Chart 59 Where Cargo Originated
Trucks Northbound
Weekday-Northbound (N=1,071)Weekend-Northbound (N=404)
59%
24%
11%
4%
0%
10%
20%
30%
40%
50%
60%
Mexicali Mexicali Valley Caborca/Sonora San Luis Rio Colorado
Chart 60 Mexican City/Region Where Cargo Originated
Northbound Weekday Trucks
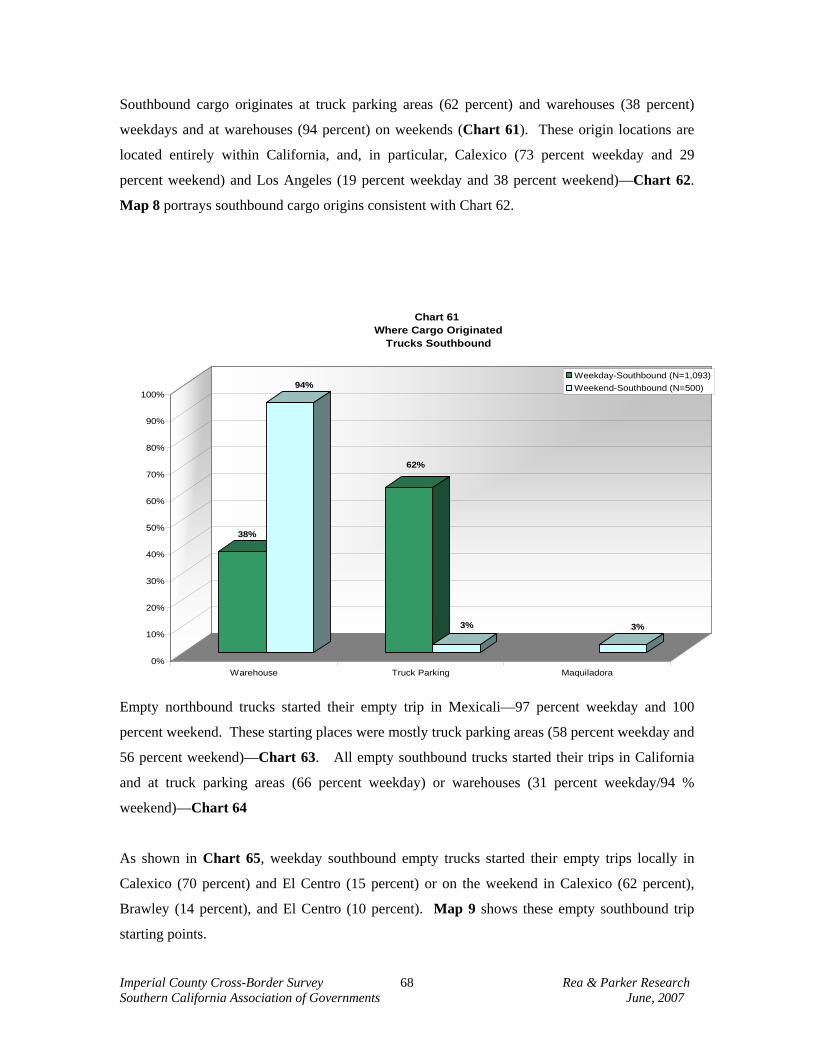
Imperial County Cross-Border Survey Rea & Parker Research Southern California Association of Governments June, 2007
68
Southbound cargo originates at truck parking areas (62 percent) and warehouses (38 percent)
weekdays and at warehouses (94 percent) on weekends (Chart 61). These origin locations are
located entirely within California, and, in particular, Calexico (73 percent weekday and 29
percent weekend) and Los Angeles (19 percent weekday and 38 percent weekend)—Chart 62.
Map 8 portrays southbound cargo origins consistent with Chart 62.
38%
94%
62%
3% 3%
0%
10%
20%
30%
40%
50%
60%
70%
80%
90%
100%
Warehouse Truck Parking Maquiladora
Chart 61 Where Cargo Originated
Trucks Southbound
Weekday-Southbound (N=1,093)Weekend-Southbound (N=500)
Empty northbound trucks started their empty trip in Mexicali—97 percent weekday and 100
percent weekend. These starting places were mostly truck parking areas (58 percent weekday and
56 percent weekend)—Chart 63. All empty southbound trucks started their trips in California
and at truck parking areas (66 percent weekday) or warehouses (31 percent weekday/94 %
weekend)—Chart 64
As shown in Chart 65, weekday southbound empty trucks started their empty trips locally in
Calexico (70 percent) and El Centro (15 percent) or on the weekend in Calexico (62 percent),
Brawley (14 percent), and El Centro (10 percent). Map 9 shows these empty southbound trip
starting points.
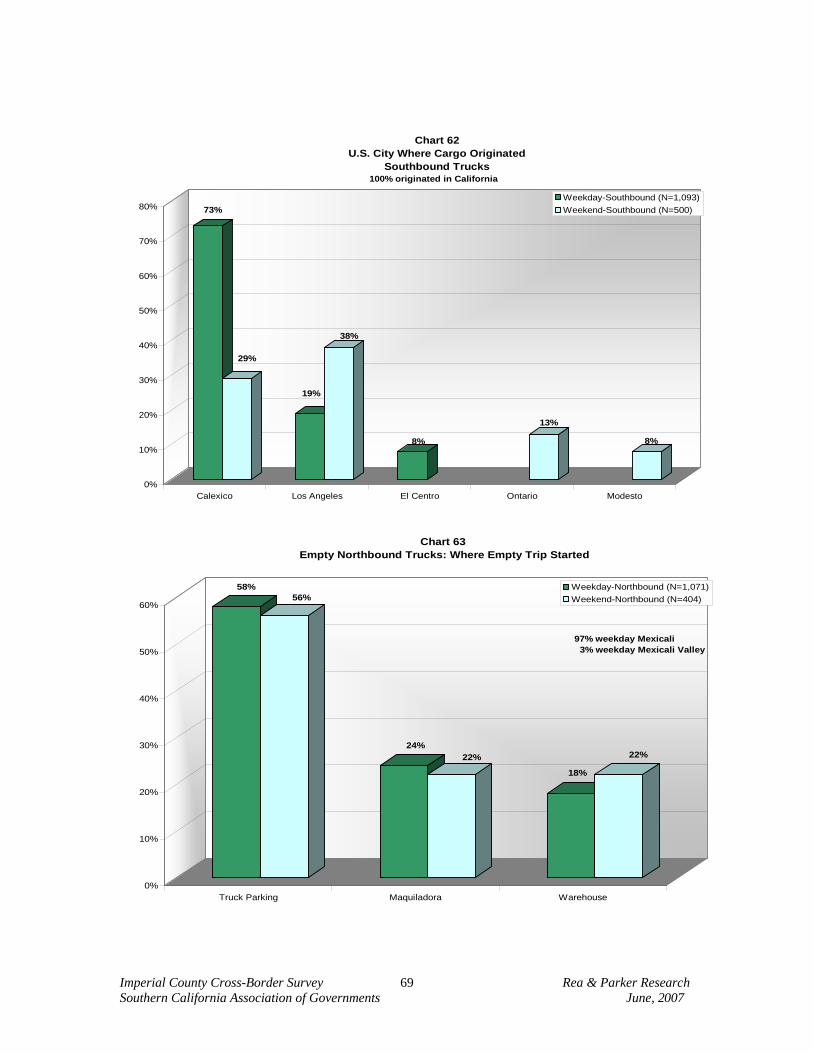
Imperial County Cross-Border Survey Rea & Parker Research Southern California Association of Governments June, 2007
69
73%
29%
19%
38%
8%
13%
8%
0%
10%
20%
30%
40%
50%
60%
70%
80%
Calexico Los Angeles El Centro Ontario Modesto
Chart 62U.S. City Where Cargo Originated
Southbound Trucks
Weekday-Southbound (N=1,093)Weekend-Southbound (N=500)
100% originated in California
58%56%
24%22%
18%
22%
0%
10%
20%
30%
40%
50%
60%
WarehouseMaquiladoraTruck Parking
Chart 63 Empty Northbound Trucks: Where Empty Trip Started
Weekday-Northbound (N=1,071)Weekend-Northbound (N=404)
97% weekday Mexicali 3% weekday Mexicali Valley
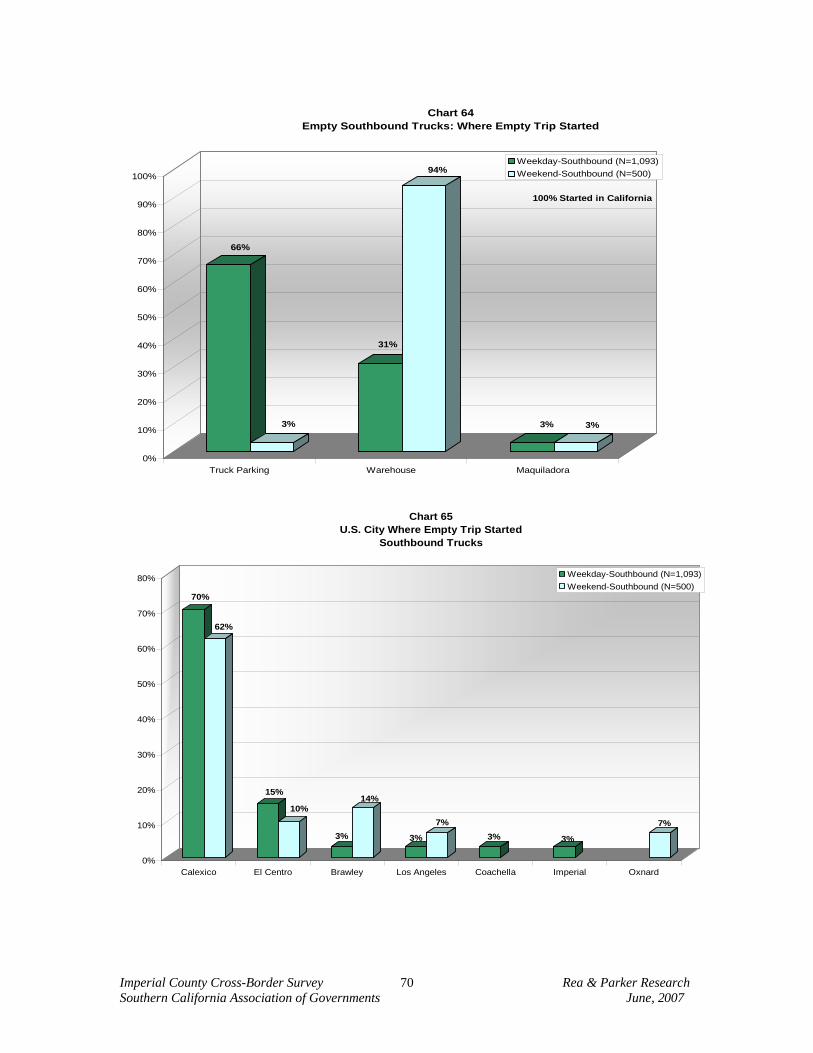
Imperial County Cross-Border Survey Rea & Parker Research Southern California Association of Governments June, 2007
70
66%
3%
31%
94%
3% 3%
0%
10%
20%
30%
40%
50%
60%
70%
80%
90%
100%
Truck Parking Warehouse Maquiladora
Chart 64 Empty Southbound Trucks: Where Empty Trip Started
Weekday-Southbound (N=1,093)Weekend-Southbound (N=500)
100% Started in California
70%
62%
15%
10%
3%
14%
3%
7%3% 3%
7%
0%
10%
20%
30%
40%
50%
60%
70%
80%
Calexico El Centro Brawley Los Angeles Coachella Imperial Oxnard
Chart 65 U.S. City Where Empty Trip Started
Southbound Trucks
Weekday-Southbound (N=1,093)Weekend-Southbound (N=500)
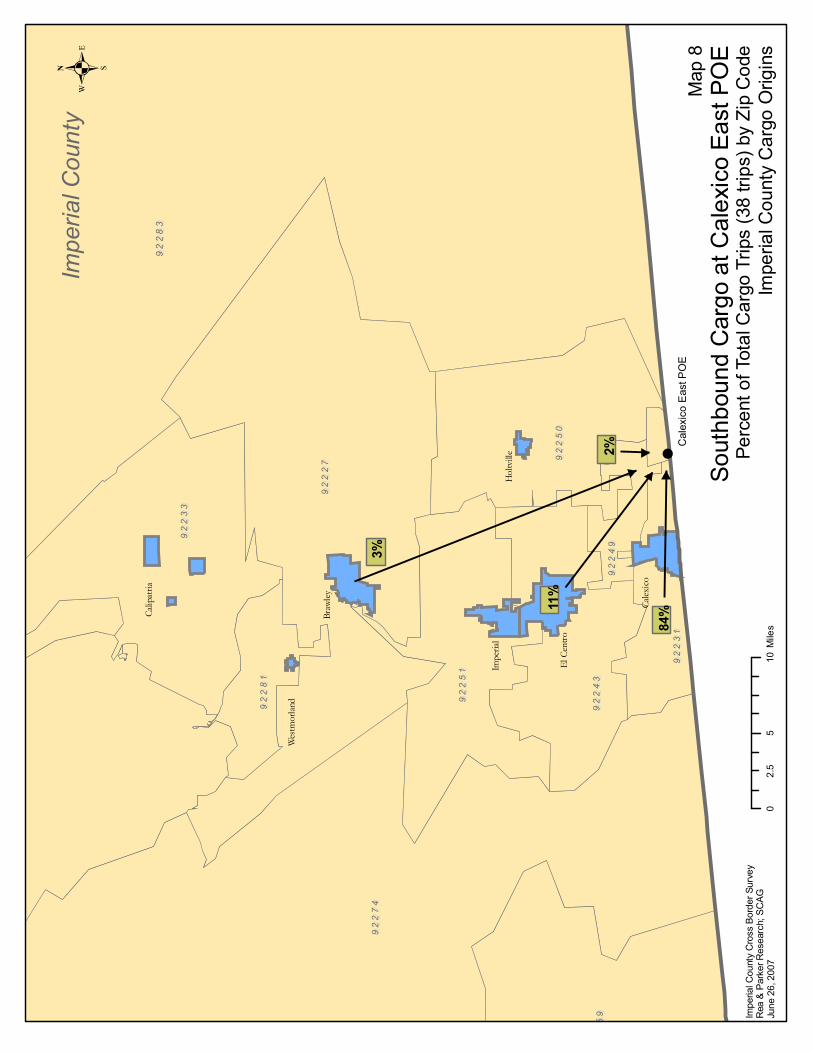
Cal
exic
oE
astP
OE
Calip
atria
Wes
tmor
land
Braw
ley
Impe
rial
ElCe
ntro
Calex
ico
Hol
tvill
e
92
28
39
22
83
2%
3%
11%
84%
92
27
49
22
74
92
22
79
22
27
92
25
99
22
59
92
25
19
22
51
92
24
39
22
43
92
25
09
22
50
92
23
19
22
31
92
28
19
22
81
92
24
99
22
49
92
23
39
22
33
.
Impe
rialC
ount
yC
ross
Bord
erSu
rvey
Rea
&Pa
rker
Res
earc
h;SC
AGJu
ne26
,200
7
Impe
rialC
ount
y
05
102.
5M
iles
Sout
hbou
ndC
argo
atC
alex
ico
East
POE
Perc
ento
fTot
alC
argo
Trip
s(3
8tri
ps)b
yZi
pC
ode
Impe
rialC
ount
yC
argo
Orig
ins
Map
8

Cal
exic
oE
astP
OE
Calip
atria
Wes
tmor
land
Braw
ley
Impe
rial
ElCe
ntro
Calex
ico
Hol
tvill
e
92
28
39
22
83
3%
2%
1% 12%
82%
92
27
49
22
74
92
22
79
22
27
92
25
99
22
59
92
25
19
22
51
92
24
39
22
43
92
25
09
22
50
92
23
19
22
31
92
28
19
22
81
92
24
99
22
49
92
23
39
22
33
.
Impe
rialC
ount
yC
ross
Bord
erSu
rvey
Rea
&Pa
rker
Res
earc
h;SC
AGJu
ne26
,200
7
Impe
rialC
ount
y
05
102.
5M
iles
Sout
hbou
ndTr
ucks
atC
alex
ico
East
POE
Perc
ento
fTot
alTr
uck
Trip
s(6
8tri
ps)b
yZi
pC
ode
Impe
rialC
ount
yE
mpt
yTr
uck
Trip
Orig
ins
Map
9
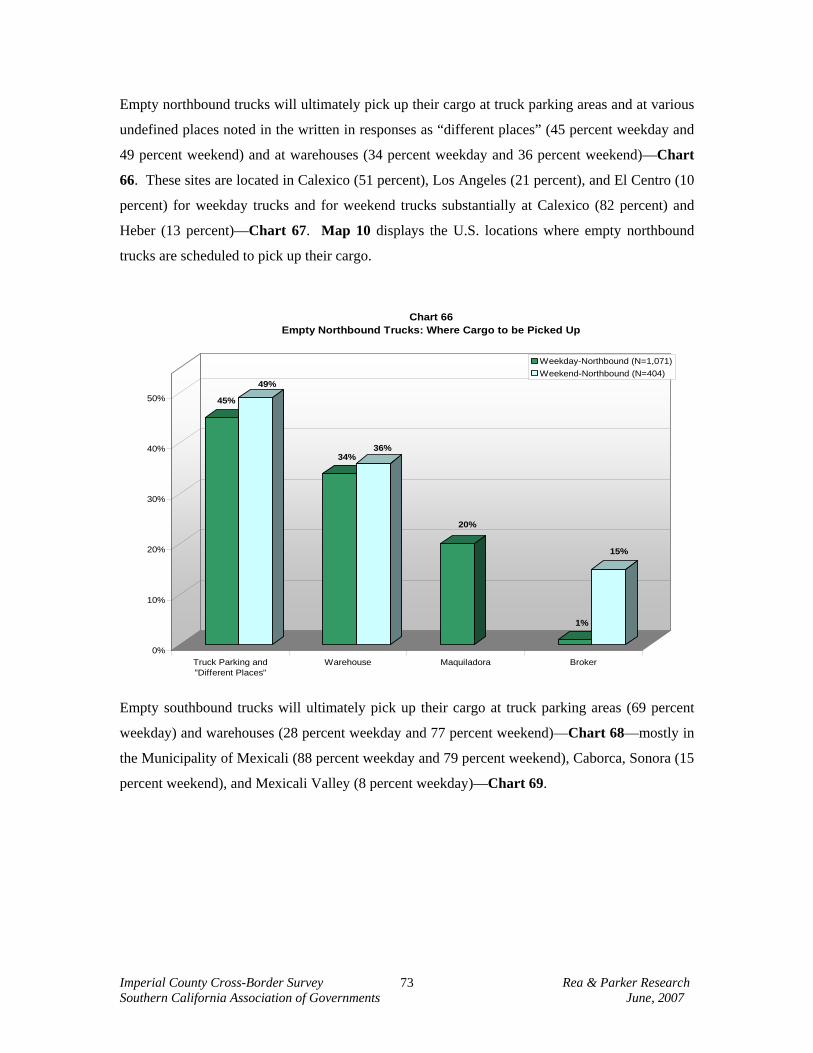
Imperial County Cross-Border Survey Rea & Parker Research Southern California Association of Governments June, 2007
73
Empty northbound trucks will ultimately pick up their cargo at truck parking areas and at various
undefined places noted in the written in responses as “different places” (45 percent weekday and
49 percent weekend) and at warehouses (34 percent weekday and 36 percent weekend)—Chart
66. These sites are located in Calexico (51 percent), Los Angeles (21 percent), and El Centro (10
percent) for weekday trucks and for weekend trucks substantially at Calexico (82 percent) and
Heber (13 percent)—Chart 67. Map 10 displays the U.S. locations where empty northbound
trucks are scheduled to pick up their cargo.
45%
49%
34%36%
20%
1%
15%
0%
10%
20%
30%
40%
50%
Truck Parking and"Different Places"
Warehouse Maquiladora Broker
Chart 66 Empty Northbound Trucks: Where Cargo to be Picked Up
Weekday-Northbound (N=1,071)Weekend-Northbound (N=404)
Empty southbound trucks will ultimately pick up their cargo at truck parking areas (69 percent
weekday) and warehouses (28 percent weekday and 77 percent weekend)—Chart 68—mostly in
the Municipality of Mexicali (88 percent weekday and 79 percent weekend), Caborca, Sonora (15
percent weekend), and Mexicali Valley (8 percent weekday)—Chart 69.
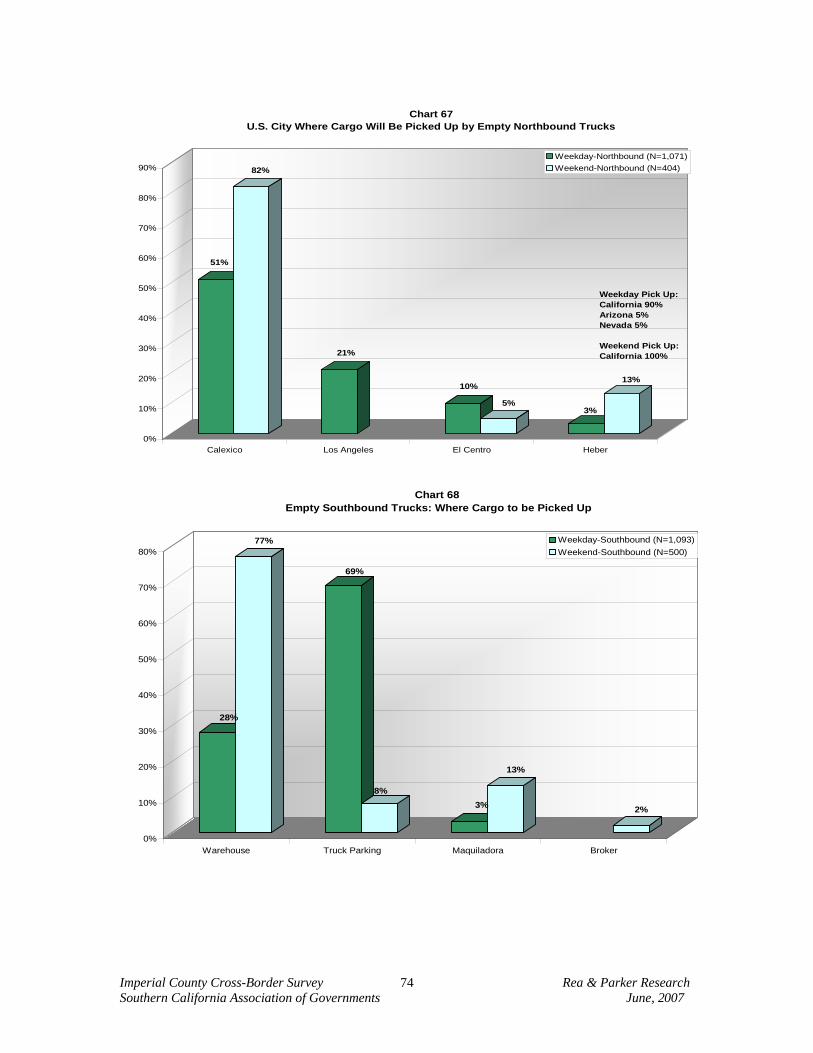
Imperial County Cross-Border Survey Rea & Parker Research Southern California Association of Governments June, 2007
74
51%
82%
21%
10%
5%3%
13%
0%
10%
20%
30%
40%
50%
60%
70%
80%
90%
Calexico Los Angeles El Centro Heber
Chart 67 U.S. City Where Cargo Will Be Picked Up by Empty Northbound Trucks
Weekday-Northbound (N=1,071)Weekend-Northbound (N=404)
Weekday Pick Up:California 90%Arizona 5%Nevada 5%
Weekend Pick Up:California 100%
28%
77%
69%
8%3%
13%
2%
0%
10%
20%
30%
40%
50%
60%
70%
80%
Warehouse Truck Parking Maquiladora Broker
Chart 68 Empty Southbound Trucks: Where Cargo to be Picked Up
Weekday-Southbound (N=1,093)Weekend-Southbound (N=500)
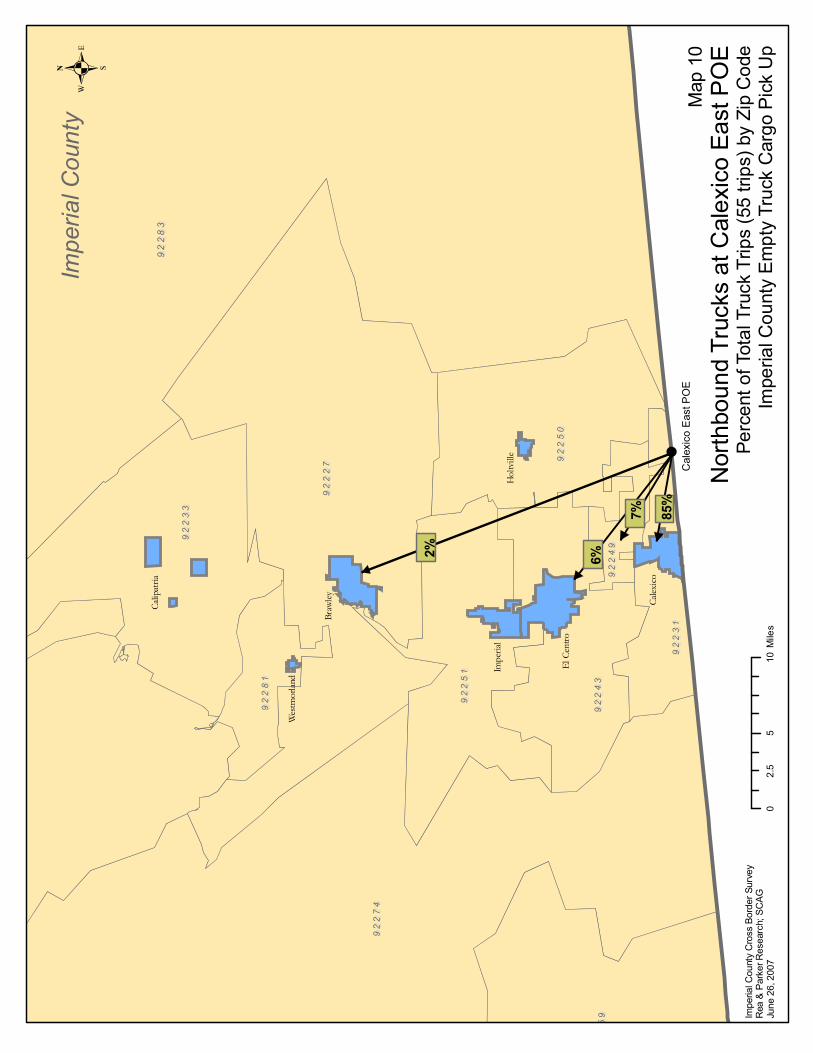
Cal
exic
oE
astP
OE
Calip
atria
Wes
tmor
land
Braw
ley
Impe
rial
ElCe
ntro
Calex
ico
Hol
tvill
e
92
28
39
22
83
2%
7%
6%
85%
92
27
49
22
74
92
22
79
22
27
92
25
99
22
59
92
25
19
22
51
92
24
39
22
43
92
25
09
22
50
92
23
19
22
31
92
28
19
22
81
92
24
99
22
49
92
23
39
22
33
.
Impe
rialC
ount
yC
ross
Bord
erSu
rvey
Rea
&Pa
rker
Res
earc
h;SC
AGJu
ne26
,200
7
Impe
rialC
ount
y
05
102.
5M
iles
Nor
thbo
und
Truc
ksat
Cal
exic
oEa
stP
OE
Perc
ento
fTot
alTr
uck
Trip
s(5
5tri
ps)b
yZi
pC
ode
Impe
rialC
ount
yE
mpt
yTr
uck
Car
goP
ick
Up
Map
10
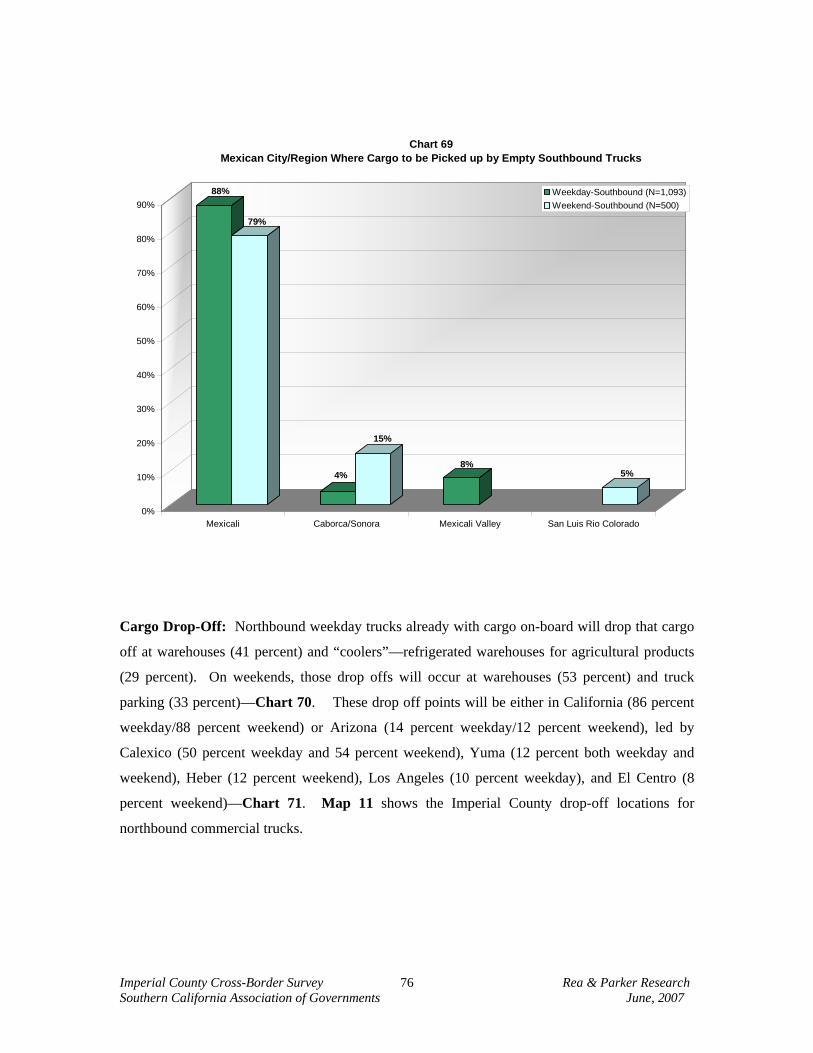
Imperial County Cross-Border Survey Rea & Parker Research Southern California Association of Governments June, 2007
76
88%
79%
4%
15%
8%5%
0%
10%
20%
30%
40%
50%
60%
70%
80%
90%
Mexicali Caborca/Sonora Mexicali Valley San Luis Rio Colorado
Chart 69Mexican City/Region Where Cargo to be Picked up by Empty Southbound Trucks
Weekday-Southbound (N=1,093)Weekend-Southbound (N=500)
Cargo Drop-Off: Northbound weekday trucks already with cargo on-board will drop that cargo
off at warehouses (41 percent) and “coolers”—refrigerated warehouses for agricultural products
(29 percent). On weekends, those drop offs will occur at warehouses (53 percent) and truck
parking (33 percent)—Chart 70. These drop off points will be either in California (86 percent
weekday/88 percent weekend) or Arizona (14 percent weekday/12 percent weekend), led by
Calexico (50 percent weekday and 54 percent weekend), Yuma (12 percent both weekday and
weekend), Heber (12 percent weekend), Los Angeles (10 percent weekday), and El Centro (8
percent weekend)—Chart 71. Map 11 shows the Imperial County drop-off locations for
northbound commercial trucks.
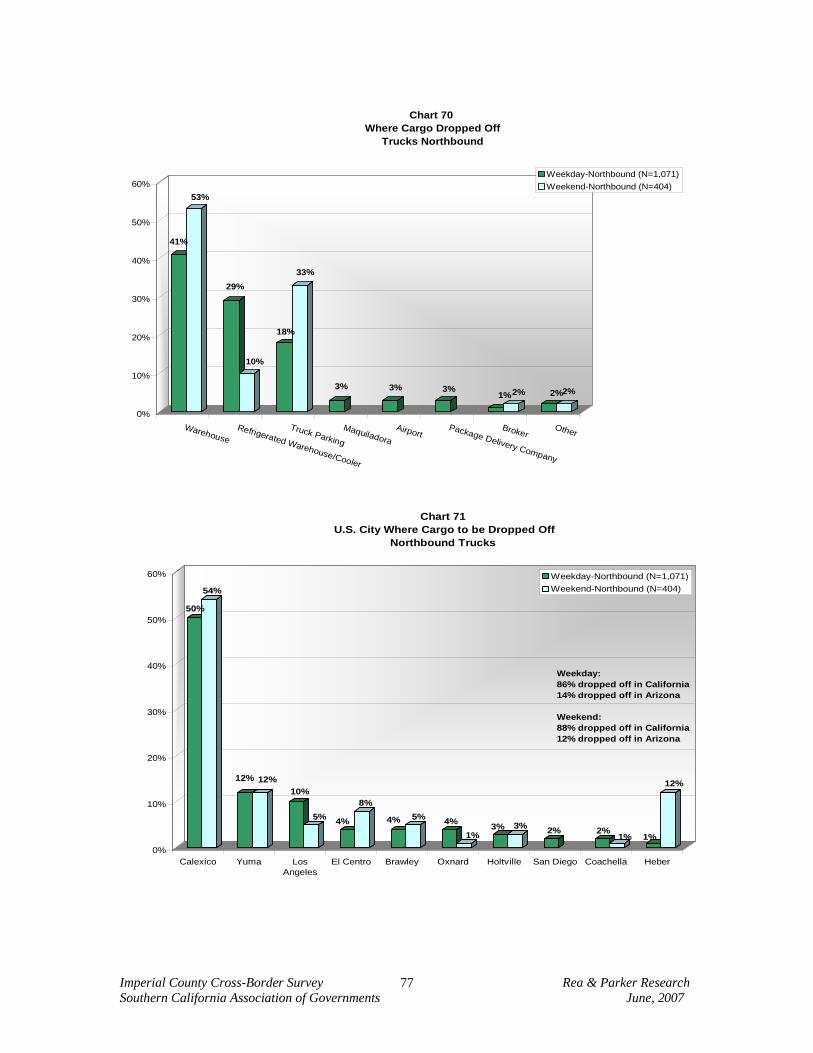
Imperial County Cross-Border Survey Rea & Parker Research Southern California Association of Governments June, 2007
77
41%
53%
29%
10%
18%
33%
3% 3% 3%1%2% 2%2%
0%
10%
20%
30%
40%
50%
60%
WarehouseRefrigerated Warehouse/Cooler
Truck Parking
MaquiladoraAirport
Package Delivery Company
BrokerOther
Chart 70 Where Cargo Dropped Off
Trucks Northbound
Weekday-Northbound (N=1,071)Weekend-Northbound (N=404)
50%
54%
12% 12%10%
5% 4%
8%
4% 5% 4%1%
3% 3% 2% 2%1% 1%
12%
0%
10%
20%
30%
40%
50%
60%
Calexico Yuma LosAngeles
El Centro Brawley Oxnard Holtville San Diego Coachella Heber
Chart 71 U.S. City Where Cargo to be Dropped Off
Northbound Trucks
Weekday-Northbound (N=1,071)Weekend-Northbound (N=404)
Weekday:86% dropped off in California14% dropped off in Arizona
Weekend:88% dropped off in California12% dropped off in Arizona
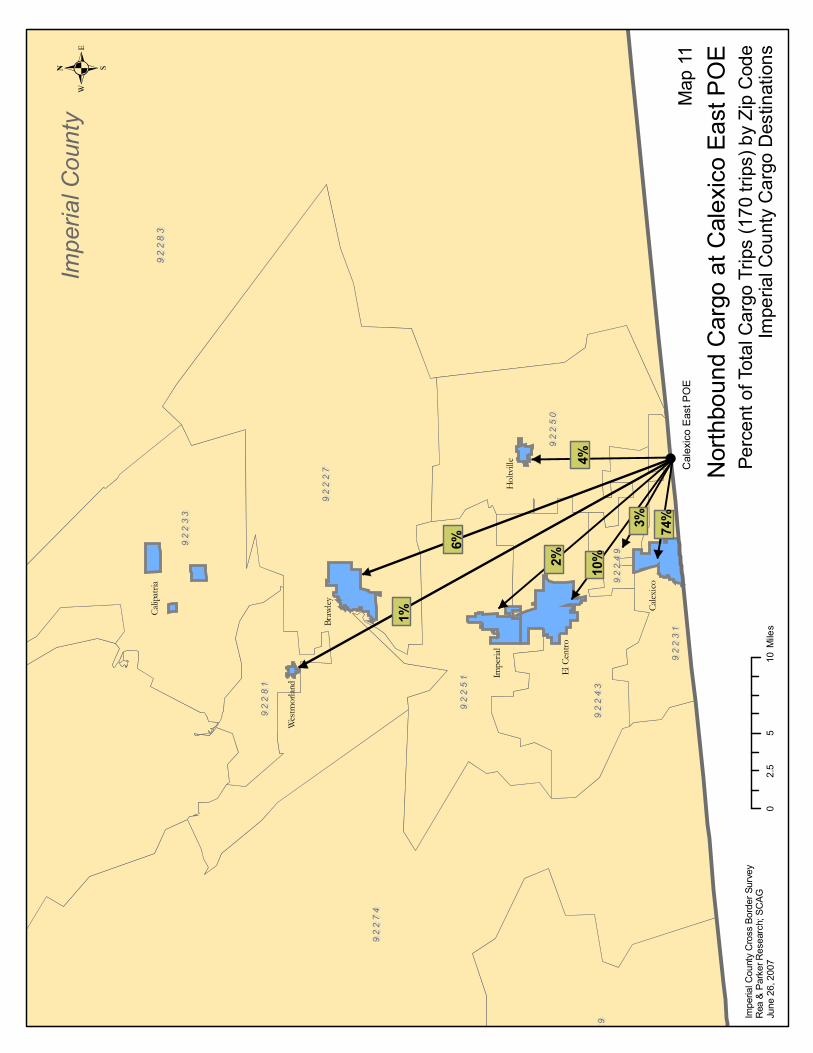
Cal
exic
oE
astP
OE
Calip
atria
Wes
tmor
land
Braw
ley
Impe
rial
ElCe
ntro
Calex
ico
Hol
tvill
e
92
28
39
22
83
2%
6%
74%
4%10
%
1%
3%
92
27
49
22
74
92
22
79
22
27
92
25
92
25
9
92
25
19
22
51
92
24
39
22
43
92
25
09
22
50
92
23
19
22
31
92
28
19
22
81
92
24
99
22
49
92
23
39
22
33
.
Impe
rialC
ount
yC
ross
Bord
erSu
rvey
Rea
&Pa
rker
Res
earc
h;SC
AGJu
ne26
,200
7
Impe
rialC
ount
y
05
102.
5M
iles
Nor
thbo
und
Car
goat
Cal
exic
oEa
stP
OE
Perc
ento
fTot
alC
argo
Trip
s(1
70tri
ps)b
yZi
pC
ode
Impe
rialC
ount
yC
argo
Des
tinat
ions
Map
11
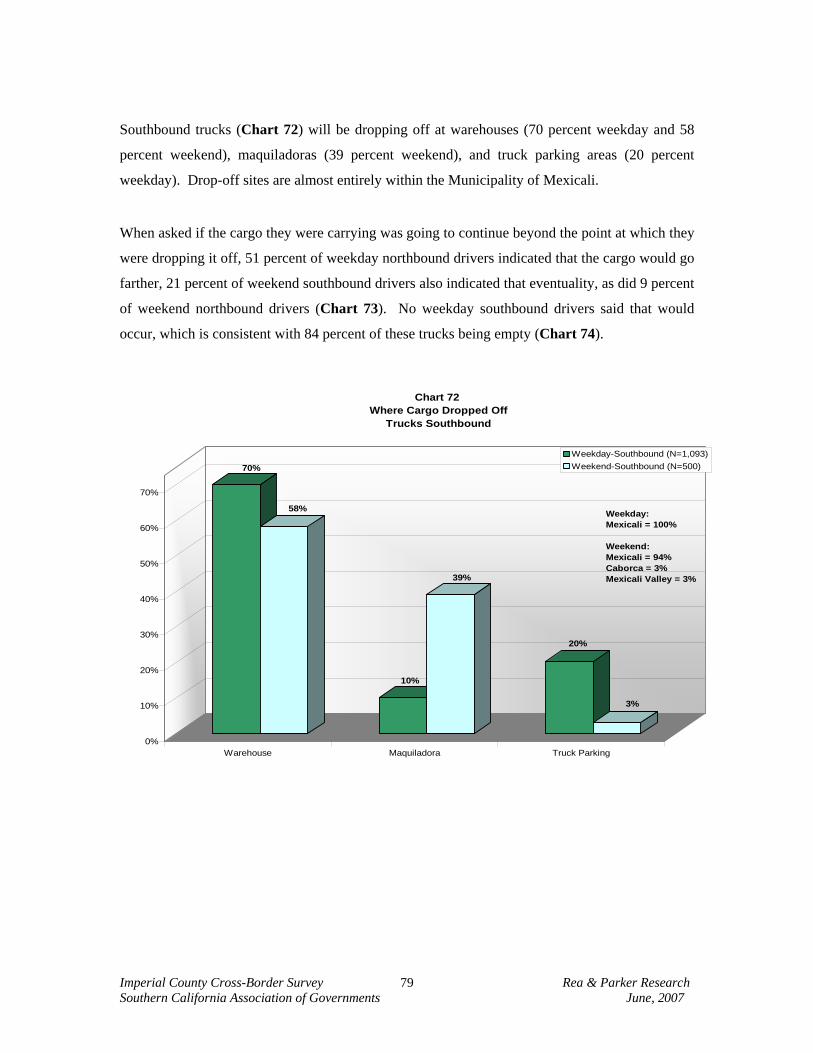
Imperial County Cross-Border Survey Rea & Parker Research Southern California Association of Governments June, 2007
79
Southbound trucks (Chart 72) will be dropping off at warehouses (70 percent weekday and 58
percent weekend), maquiladoras (39 percent weekend), and truck parking areas (20 percent
weekday). Drop-off sites are almost entirely within the Municipality of Mexicali.
When asked if the cargo they were carrying was going to continue beyond the point at which they
were dropping it off, 51 percent of weekday northbound drivers indicated that the cargo would go
farther, 21 percent of weekend southbound drivers also indicated that eventuality, as did 9 percent
of weekend northbound drivers (Chart 73). No weekday southbound drivers said that would
occur, which is consistent with 84 percent of these trucks being empty (Chart 74).
70%
58%
10%
39%
20%
3%
0%
10%
20%
30%
40%
50%
60%
70%
Warehouse Maquiladora Truck Parking
Chart 72 Where Cargo Dropped Off
Trucks Southbound
Weekday-Southbound (N=1,093)Weekend-Southbound (N=500)
Weekday:Mexicali = 100%
Weekend:Mexicali = 94%Caborca = 3%Mexicali Valley = 3%
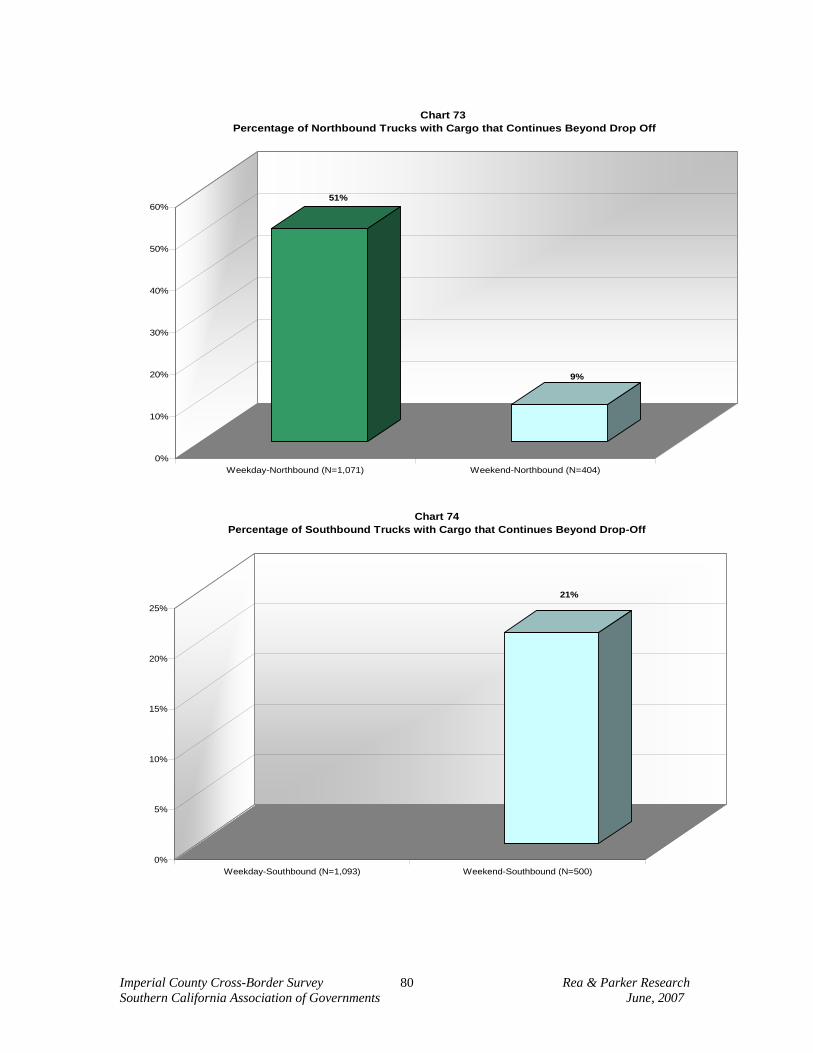
Imperial County Cross-Border Survey Rea & Parker Research Southern California Association of Governments June, 2007
80
51%
9%
0%
10%
20%
30%
40%
50%
60%
Weekday-Northbound (N=1,071) Weekend-Northbound (N=404)
Chart 73 Percentage of Northbound Trucks with Cargo that Continues Beyond Drop Off
21%
0%
5%
10%
15%
20%
25%
Weekday-Southbound (N=1,093) Weekend-Southbound (N=500)
Chart 74 Percentage of Southbound Trucks with Cargo that Continues Beyond Drop-Off
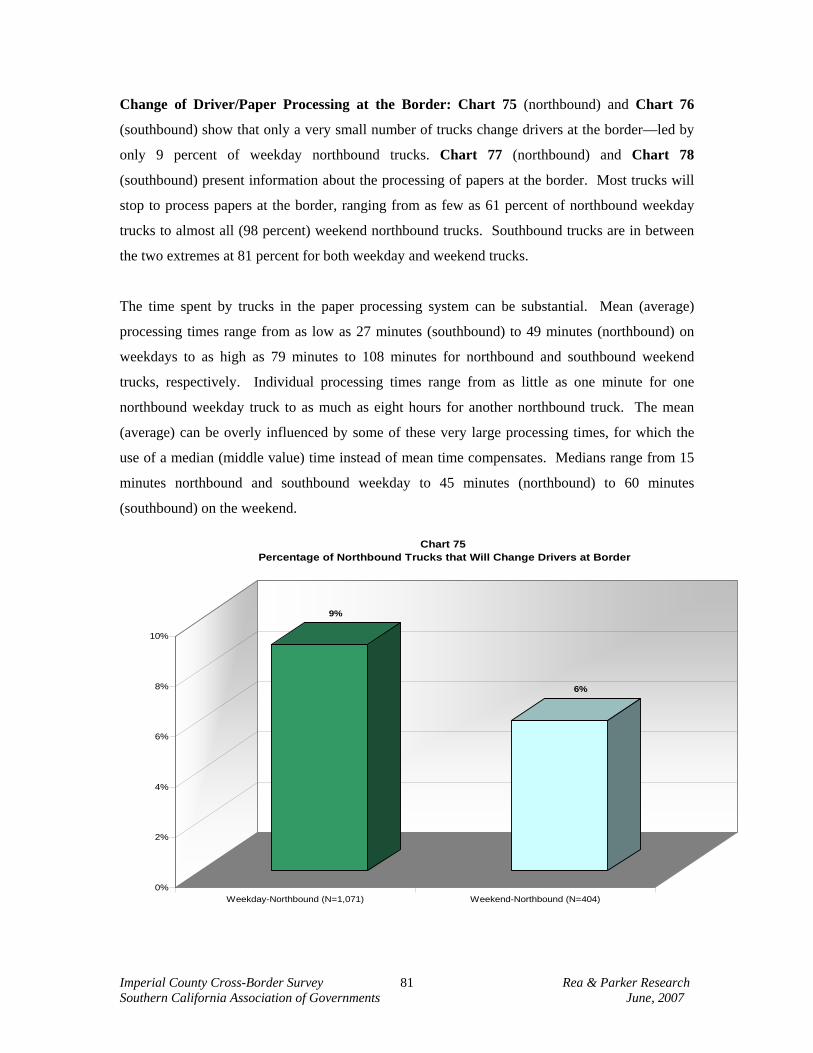
Imperial County Cross-Border Survey Rea & Parker Research Southern California Association of Governments June, 2007
81
Change of Driver/Paper Processing at the Border: Chart 75 (northbound) and Chart 76
(southbound) show that only a very small number of trucks change drivers at the border—led by
only 9 percent of weekday northbound trucks. Chart 77 (northbound) and Chart 78
(southbound) present information about the processing of papers at the border. Most trucks will
stop to process papers at the border, ranging from as few as 61 percent of northbound weekday
trucks to almost all (98 percent) weekend northbound trucks. Southbound trucks are in between
the two extremes at 81 percent for both weekday and weekend trucks.
The time spent by trucks in the paper processing system can be substantial. Mean (average)
processing times range from as low as 27 minutes (southbound) to 49 minutes (northbound) on
weekdays to as high as 79 minutes to 108 minutes for northbound and southbound weekend
trucks, respectively. Individual processing times range from as little as one minute for one
northbound weekday truck to as much as eight hours for another northbound truck. The mean
(average) can be overly influenced by some of these very large processing times, for which the
use of a median (middle value) time instead of mean time compensates. Medians range from 15
minutes northbound and southbound weekday to 45 minutes (northbound) to 60 minutes
(southbound) on the weekend.
9%
6%
0%
2%
4%
6%
8%
10%
Weekday-Northbound (N=1,071) Weekend-Northbound (N=404)
Chart 75 Percentage of Northbound Trucks that Will Change Drivers at Border
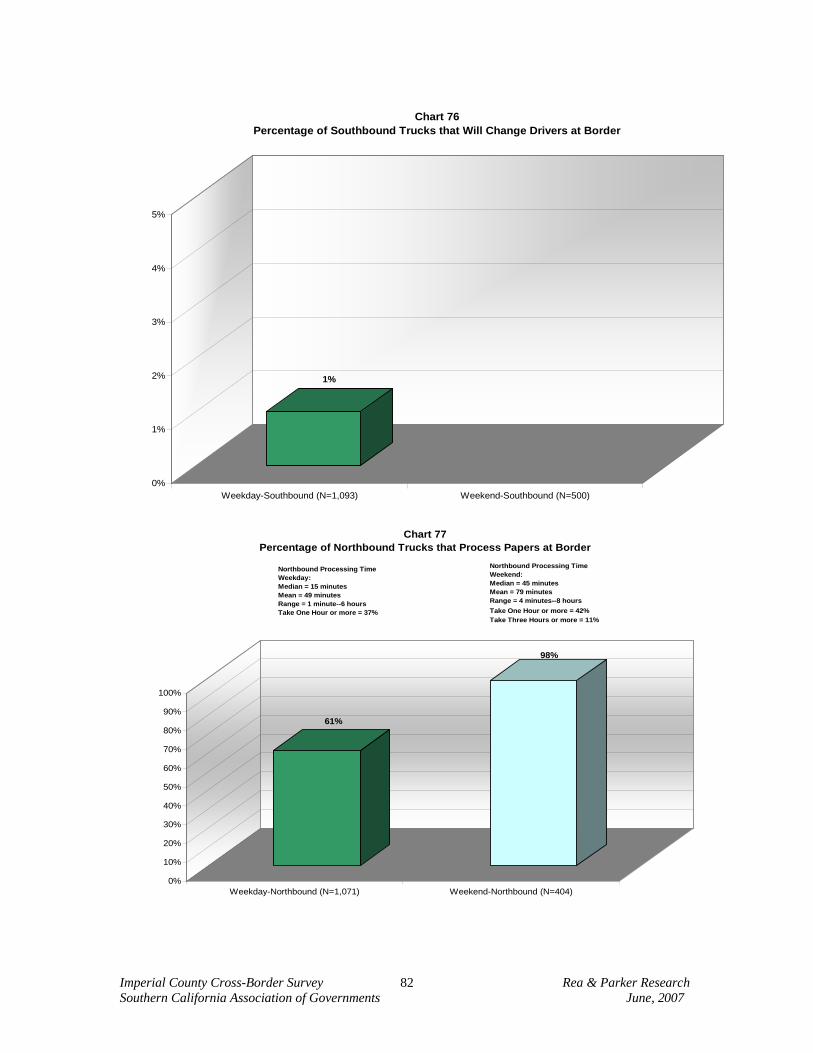
Imperial County Cross-Border Survey Rea & Parker Research Southern California Association of Governments June, 2007
82
1%
0%
1%
2%
3%
4%
5%
Weekday-Southbound (N=1,093) Weekend-Southbound (N=500)
Chart 76 Percentage of Southbound Trucks that Will Change Drivers at Border
61%
98%
0%
10%
20%
30%
40%
50%
60%
70%
80%
90%
100%
Weekday-Northbound (N=1,071) Weekend-Northbound (N=404)
Chart 77 Percentage of Northbound Trucks that Process Papers at Border
Northbound Processing TimeWeekday:Median = 15 minutesMean = 49 minutesRange = 1 minute--6 hoursTake One Hour or more = 37%
Northbound Processing TimeWeekend:Median = 45 minutesMean = 79 minutesRange = 4 minutes--8 hoursTake One Hour or more = 42%Take Three Hours or more = 11%
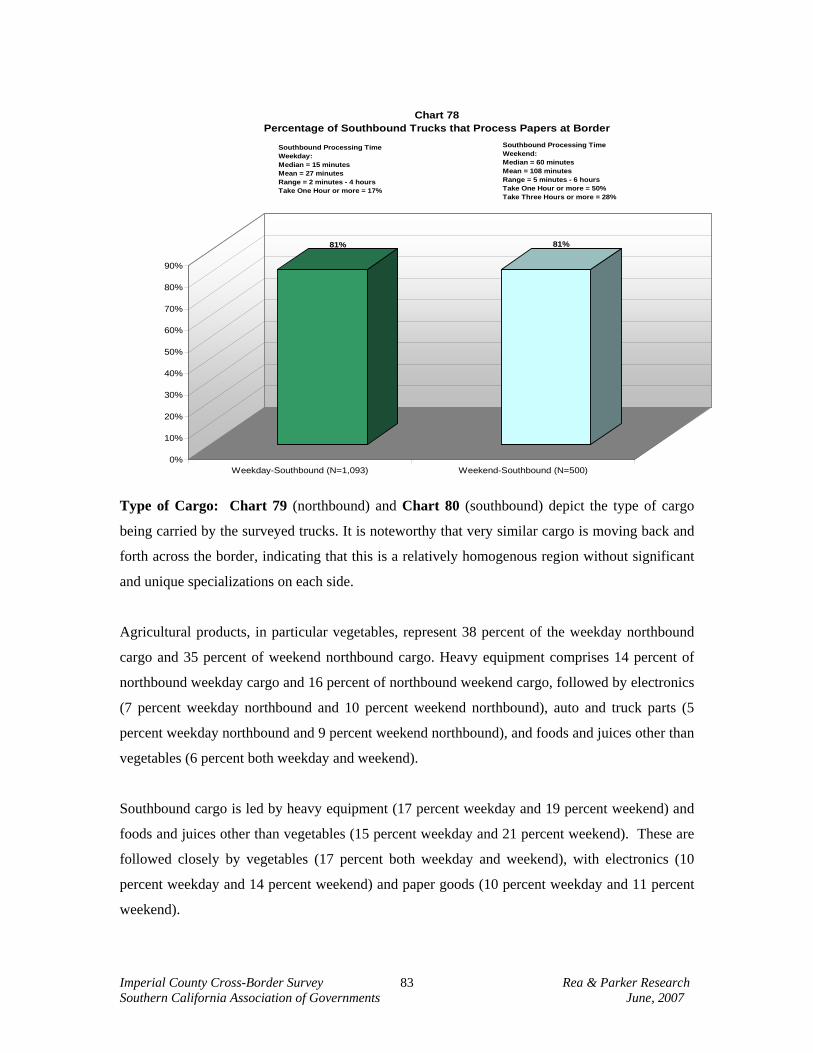
Imperial County Cross-Border Survey Rea & Parker Research Southern California Association of Governments June, 2007
83
81% 81%
0%
10%
20%
30%
40%
50%
60%
70%
80%
90%
Weekday-Southbound (N=1,093) Weekend-Southbound (N=500)
Chart 78 Percentage of Southbound Trucks that Process Papers at Border
Southbound Processing TimeWeekday:Median = 15 minutesMean = 27 minutesRange = 2 minutes - 4 hoursTake One Hour or more = 17%
Southbound Processing TimeWeekend:Median = 60 minutesMean = 108 minutesRange = 5 minutes - 6 hoursTake One Hour or more = 50%Take Three Hours or more = 28%
Type of Cargo: Chart 79 (northbound) and Chart 80 (southbound) depict the type of cargo
being carried by the surveyed trucks. It is noteworthy that very similar cargo is moving back and
forth across the border, indicating that this is a relatively homogenous region without significant
and unique specializations on each side.
Agricultural products, in particular vegetables, represent 38 percent of the weekday northbound
cargo and 35 percent of weekend northbound cargo. Heavy equipment comprises 14 percent of
northbound weekday cargo and 16 percent of northbound weekend cargo, followed by electronics
(7 percent weekday northbound and 10 percent weekend northbound), auto and truck parts (5
percent weekday northbound and 9 percent weekend northbound), and foods and juices other than
vegetables (6 percent both weekday and weekend).
Southbound cargo is led by heavy equipment (17 percent weekday and 19 percent weekend) and
foods and juices other than vegetables (15 percent weekday and 21 percent weekend). These are
followed closely by vegetables (17 percent both weekday and weekend), with electronics (10
percent weekday and 14 percent weekend) and paper goods (10 percent weekday and 11 percent
weekend).
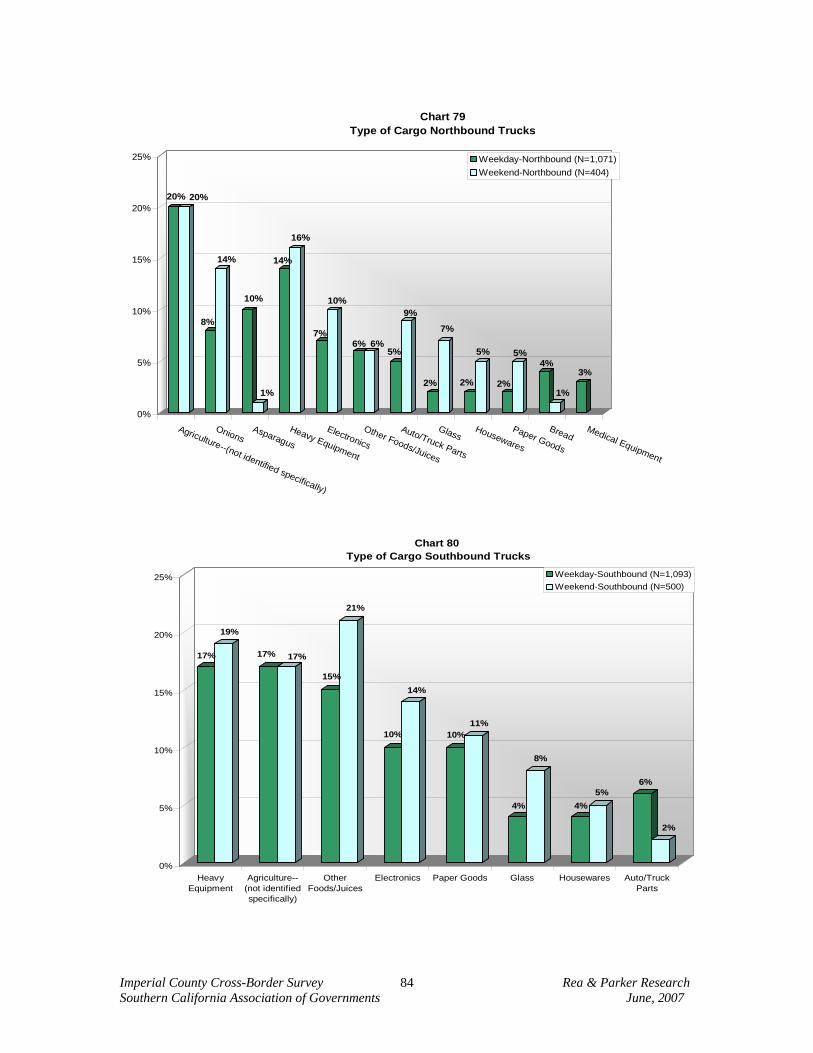
Imperial County Cross-Border Survey Rea & Parker Research Southern California Association of Governments June, 2007
84
20% 20%
8%
14%
10%
1%
14%
16%
7%
10%
6% 6%5%
9%
2%
7%
2%
5%
2%
5%4%
1%
3%
0%
5%
10%
15%
20%
25%
Agriculture--(not identified specifically)
OnionsAsparagus
Heavy Equipment
Electronics
Other Foods/Juices
Auto/Truck Parts
GlassHousewares
Paper Goods
BreadMedical Equipment
Chart 79Type of Cargo Northbound Trucks
Weekday-Northbound (N=1,071)Weekend-Northbound (N=404)
17%
19%
17% 17%
15%
21%
10%
14%
10%11%
4%
8%
4%5%
6%
2%
0%
5%
10%
15%
20%
25%
HeavyEquipment
Agriculture--(not identifiedspecifically)
OtherFoods/Juices
Electronics Paper Goods Glass Housewares Auto/TruckParts
Chart 80 Type of Cargo Southbound Trucks
Weekday-Southbound (N=1,093)Weekend-Southbound (N=500)
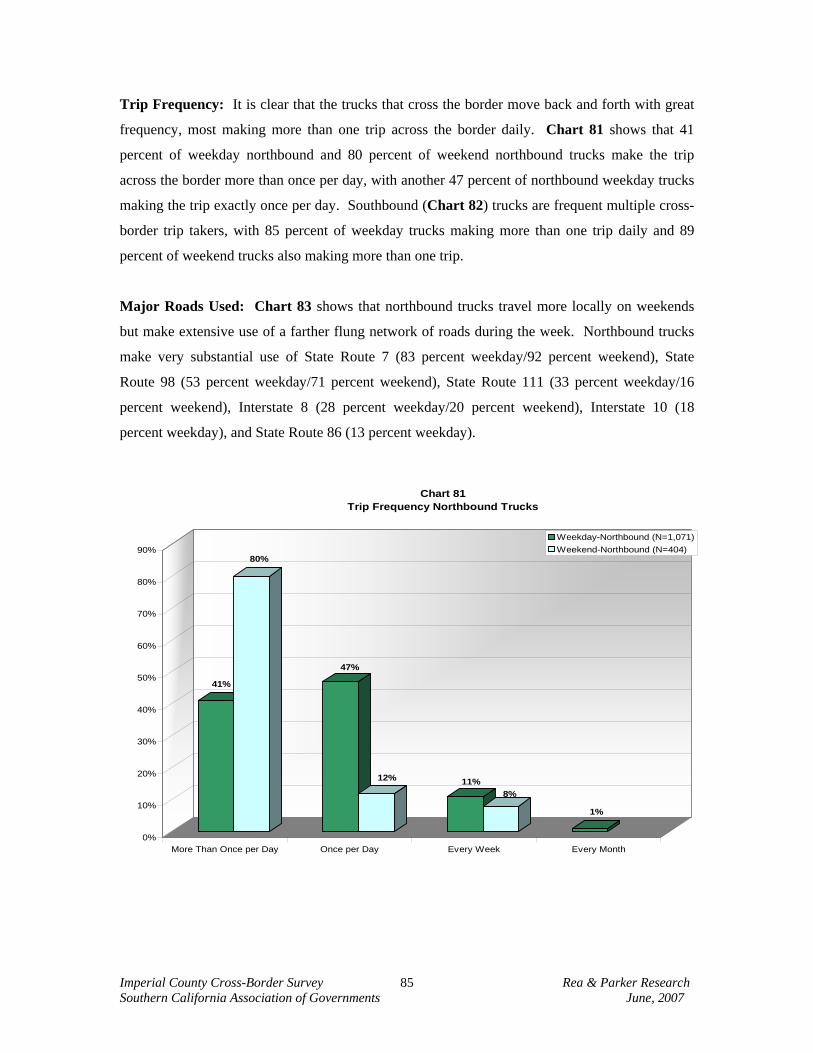
Imperial County Cross-Border Survey Rea & Parker Research Southern California Association of Governments June, 2007
85
Trip Frequency: It is clear that the trucks that cross the border move back and forth with great
frequency, most making more than one trip across the border daily. Chart 81 shows that 41
percent of weekday northbound and 80 percent of weekend northbound trucks make the trip
across the border more than once per day, with another 47 percent of northbound weekday trucks
making the trip exactly once per day. Southbound (Chart 82) trucks are frequent multiple cross-
border trip takers, with 85 percent of weekday trucks making more than one trip daily and 89
percent of weekend trucks also making more than one trip.
Major Roads Used: Chart 83 shows that northbound trucks travel more locally on weekends
but make extensive use of a farther flung network of roads during the week. Northbound trucks
make very substantial use of State Route 7 (83 percent weekday/92 percent weekend), State
Route 98 (53 percent weekday/71 percent weekend), State Route 111 (33 percent weekday/16
percent weekend), Interstate 8 (28 percent weekday/20 percent weekend), Interstate 10 (18
percent weekday), and State Route 86 (13 percent weekday).
41%
80%
47%
12% 11%8%
1%
0%
10%
20%
30%
40%
50%
60%
70%
80%
90%
More Than Once per Day Once per Day Every Week Every Month
Chart 81Trip Frequency Northbound Trucks
Weekday-Northbound (N=1,071)Weekend-Northbound (N=404)
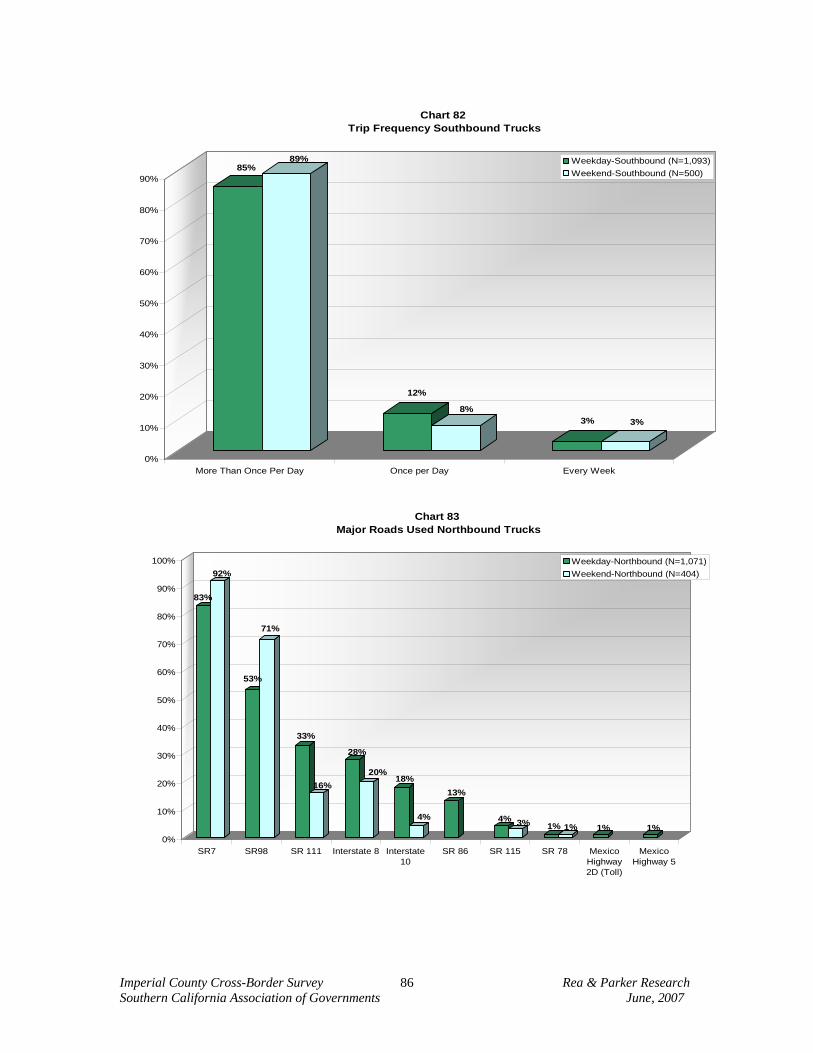
Imperial County Cross-Border Survey Rea & Parker Research Southern California Association of Governments June, 2007
86
85%89%
12%
8%3% 3%
0%
10%
20%
30%
40%
50%
60%
70%
80%
90%
More Than Once Per Day Once per Day Every Week
Chart 82 Trip Frequency Southbound Trucks
Weekday-Southbound (N=1,093)Weekend-Southbound (N=500)
83%
92%
53%
71%
33%
16%
28%
20%18%
4%
13%
4% 3% 1% 1% 1% 1%0%
10%
20%
30%
40%
50%
60%
70%
80%
90%
100%
SR7 SR98 SR 111 Interstate 8 Interstate10
SR 86 SR 115 SR 78 MexicoHighway2D (Toll)
MexicoHighway 5
Chart 83 Major Roads Used Northbound Trucks
Weekday-Northbound (N=1,071)Weekend-Northbound (N=404)
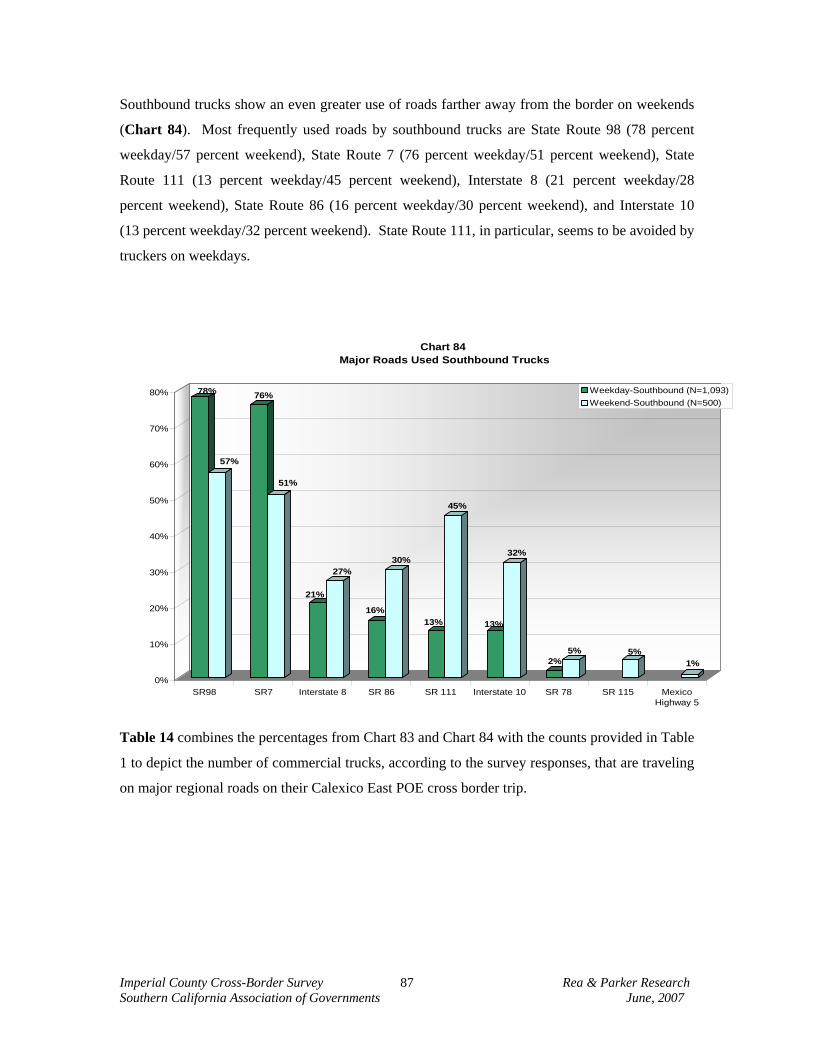
Imperial County Cross-Border Survey Rea & Parker Research Southern California Association of Governments June, 2007
87
Southbound trucks show an even greater use of roads farther away from the border on weekends
(Chart 84). Most frequently used roads by southbound trucks are State Route 98 (78 percent
weekday/57 percent weekend), State Route 7 (76 percent weekday/51 percent weekend), State
Route 111 (13 percent weekday/45 percent weekend), Interstate 8 (21 percent weekday/28
percent weekend), State Route 86 (16 percent weekday/30 percent weekend), and Interstate 10
(13 percent weekday/32 percent weekend). State Route 111, in particular, seems to be avoided by
truckers on weekdays.
78%
57%
76%
51%
21%
27%
16%
30%
13%
45%
13%
32%
2%5% 5%
1%
0%
10%
20%
30%
40%
50%
60%
70%
80%
SR98 SR7 Interstate 8 SR 86 SR 111 Interstate 10 SR 78 SR 115 MexicoHighway 5
Chart 84 Major Roads Used Southbound Trucks
Weekday-Southbound (N=1,093)Weekend-Southbound (N=500)
Table 14 combines the percentages from Chart 83 and Chart 84 with the counts provided in Table
1 to depict the number of commercial trucks, according to the survey responses, that are traveling
on major regional roads on their Calexico East POE cross border trip.
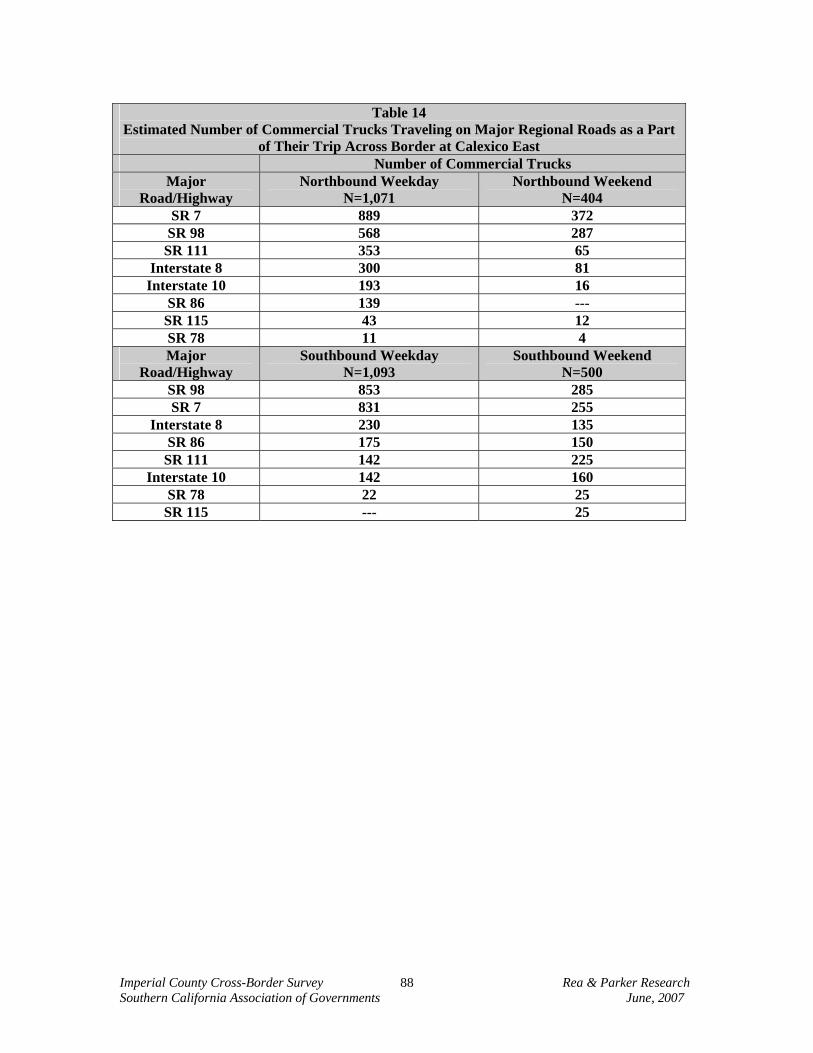
Imperial County Cross-Border Survey Rea & Parker Research Southern California Association of Governments June, 2007
88
Table 14 Estimated Number of Commercial Trucks Traveling on Major Regional Roads as a Part
of Their Trip Across Border at Calexico East Number of Commercial Trucks
Major Road/Highway
Northbound Weekday N=1,071
Northbound Weekend N=404
SR 7 889 372 SR 98 568 287
SR 111 353 65 Interstate 8 300 81
Interstate 10 193 16 SR 86 139 ---
SR 115 43 12 SR 78 11 4 Major
Road/Highway Southbound Weekday
N=1,093 Southbound Weekend
N=500 SR 98 853 285 SR 7 831 255
Interstate 8 230 135 SR 86 175 150
SR 111 142 225 Interstate 10 142 160
SR 78 22 25 SR 115 --- 25
Imperial County Cross-Border Survey Rea & Parker Research Southern California Association of Governments June, 2007
89
APPENDICES
Appendix 1: Survey and Count Positions
Appendix 2: Survey and Count Personnel Schedule
Appendix 3: Survey Instruments
Appendix 4: Cross-border Counts in Fifteen Minute Intervals
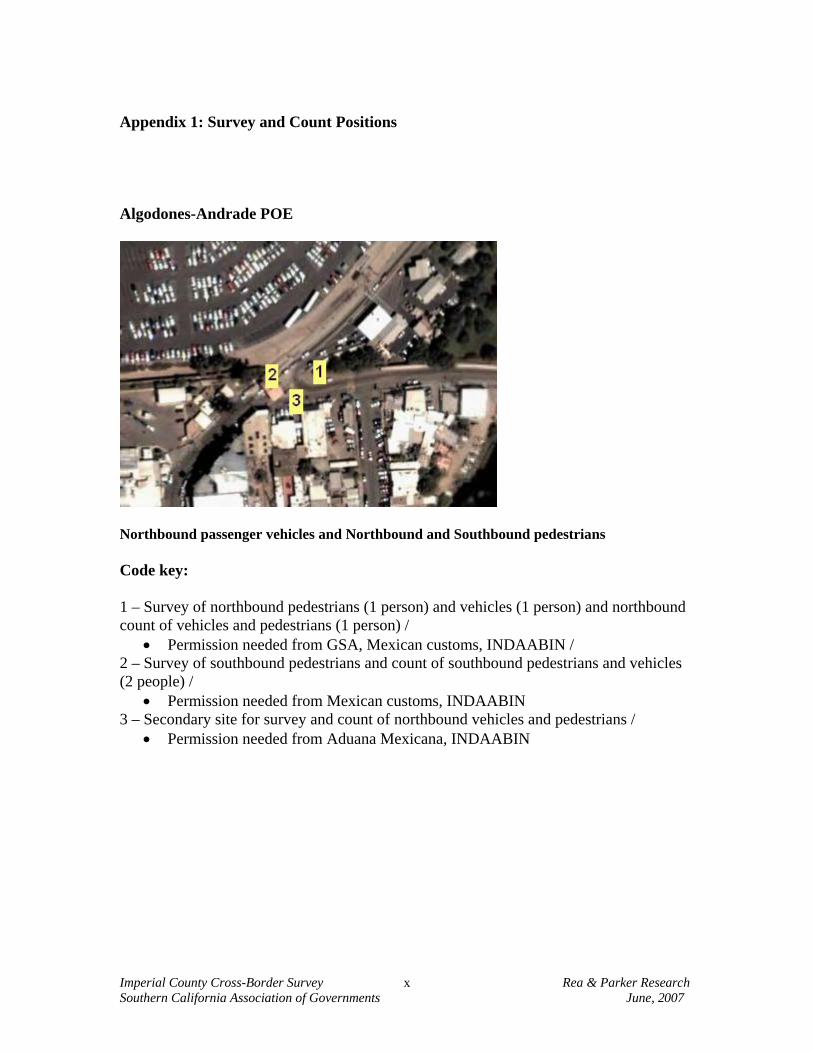
Imperial County Cross-Border Survey Rea & Parker Research Southern California Association of Governments June, 2007
x
Appendix 1: Survey and Count Positions Algodones-Andrade POE
Northbound passenger vehicles and Northbound and Southbound pedestrians Code key: 1 – Survey of northbound pedestrians (1 person) and vehicles (1 person) and northbound count of vehicles and pedestrians (1 person) /
• Permission needed from GSA, Mexican customs, INDAABIN / 2 – Survey of southbound pedestrians and count of southbound pedestrians and vehicles (2 people) /
• Permission needed from Mexican customs, INDAABIN 3 – Secondary site for survey and count of northbound vehicles and pedestrians /
• Permission needed from Aduana Mexicana, INDAABIN
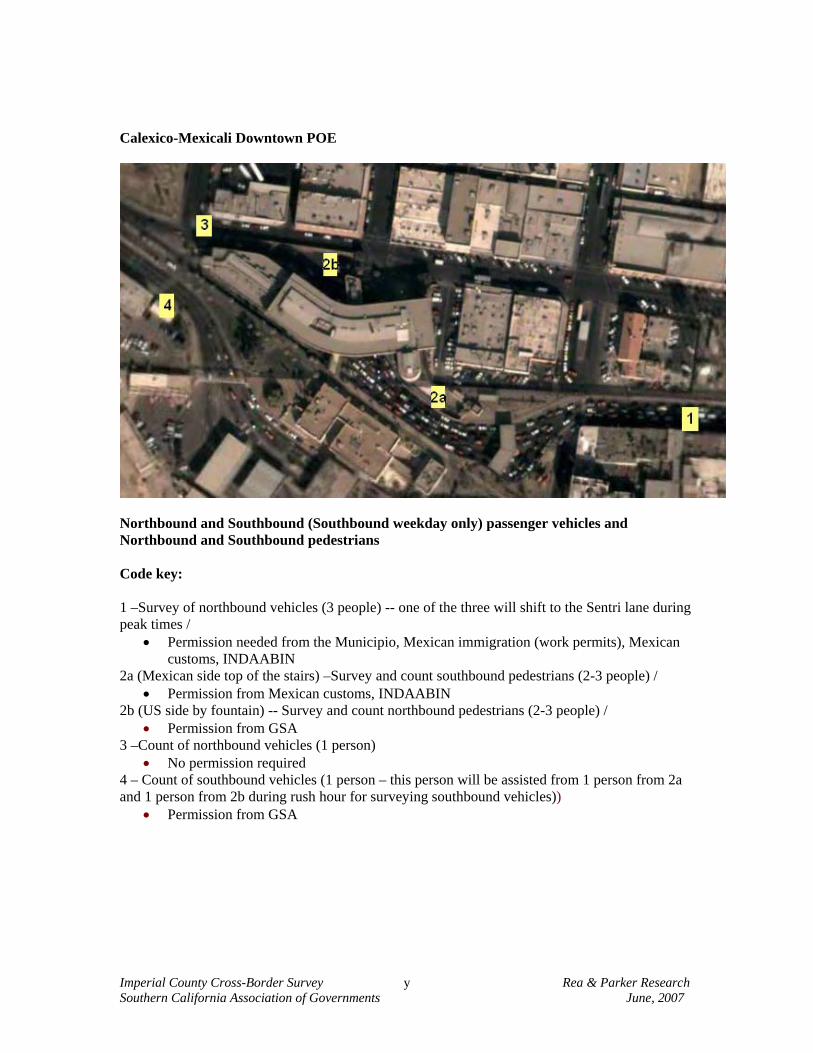
Imperial County Cross-Border Survey Rea & Parker Research Southern California Association of Governments June, 2007
y
Calexico-Mexicali Downtown POE
Northbound and Southbound (Southbound weekday only) passenger vehicles and Northbound and Southbound pedestrians Code key: 1 –Survey of northbound vehicles (3 people) -- one of the three will shift to the Sentri lane during peak times /
• Permission needed from the Municipio, Mexican immigration (work permits), Mexican customs, INDAABIN
2a (Mexican side top of the stairs) –Survey and count southbound pedestrians (2-3 people) / • Permission from Mexican customs, INDAABIN
2b (US side by fountain) -- Survey and count northbound pedestrians (2-3 people) / • Permission from GSA
3 –Count of northbound vehicles (1 person) • No permission required
4 – Count of southbound vehicles (1 person – this person will be assisted from 1 person from 2a and 1 person from 2b during rush hour for surveying southbound vehicles))
• Permission from GSA
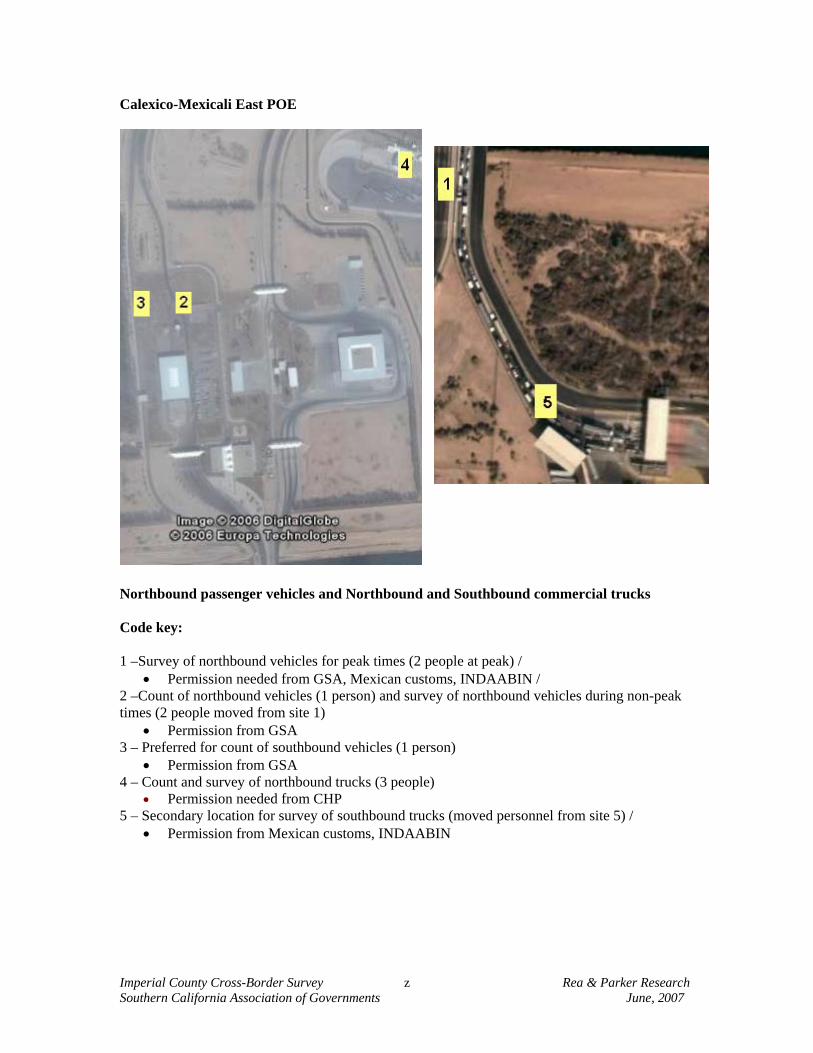
Imperial County Cross-Border Survey Rea & Parker Research Southern California Association of Governments June, 2007
z
Calexico-Mexicali East POE
Northbound passenger vehicles and Northbound and Southbound commercial trucks Code key: 1 –Survey of northbound vehicles for peak times (2 people at peak) /
• Permission needed from GSA, Mexican customs, INDAABIN / 2 –Count of northbound vehicles (1 person) and survey of northbound vehicles during non-peak times (2 people moved from site 1)
• Permission from GSA 3 – Preferred for count of southbound vehicles (1 person)
• Permission from GSA 4 – Count and survey of northbound trucks (3 people)
• Permission needed from CHP 5 – Secondary location for survey of southbound trucks (moved personnel from site 5) /
• Permission from Mexican customs, INDAABIN
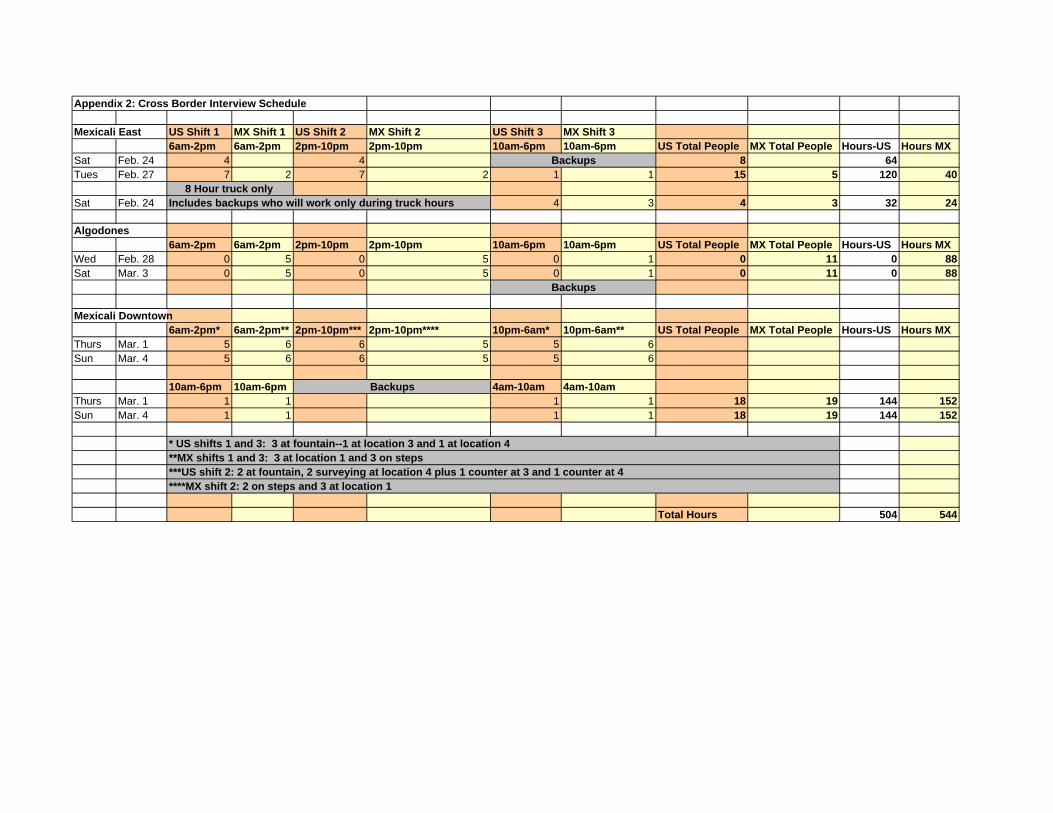
Appendix 2: Cross Border Interview Schedule
Mexicali East US Shift 1 MX Shift 1 US Shift 2 MX Shift 2 US Shift 3 MX Shift 36am-2pm 6am-2pm 2pm-10pm 2pm-10pm 10am-6pm 10am-6pm US Total People MX Total People Hours-US Hours MX
Sat Feb. 24 4 4 8 64Tues Feb. 27 7 2 7 2 1 1 15 5 120 40
Sat Feb. 24 4 3 4 3 32 24
Algodones6am-2pm 6am-2pm 2pm-10pm 2pm-10pm 10am-6pm 10am-6pm US Total People MX Total People Hours-US Hours MX
Wed Feb. 28 0 5 0 5 0 1 0 11 0 88Sat Mar. 3 0 5 0 5 0 1 0 11 0 88
Mexicali Downtown6am-2pm* 6am-2pm** 2pm-10pm*** 2pm-10pm**** 10pm-6am* 10pm-6am** US Total People MX Total People Hours-US Hours MX
Thurs Mar. 1 5 6 6 5 5 6Sun Mar. 4 5 6 6 5 5 6
10am-6pm 10am-6pm 4am-10am 4am-10amThurs Mar. 1 1 1 1 1 18 19 144 152Sun Mar. 4 1 1 1 1 18 19 144 152
Total Hours 504 544
Backups
8 Hour truck only
Backups
Includes backups who will work only during truck hours
**MX shifts 1 and 3: 3 at location 1 and 3 on steps ***US shift 2: 2 at fountain, 2 surveying at location 4 plus 1 counter at 3 and 1 counter at 4****MX shift 2: 2 on steps and 3 at location 1
Backups
* US shifts 1 and 3: 3 at fountain--1 at location 3 and 1 at location 4
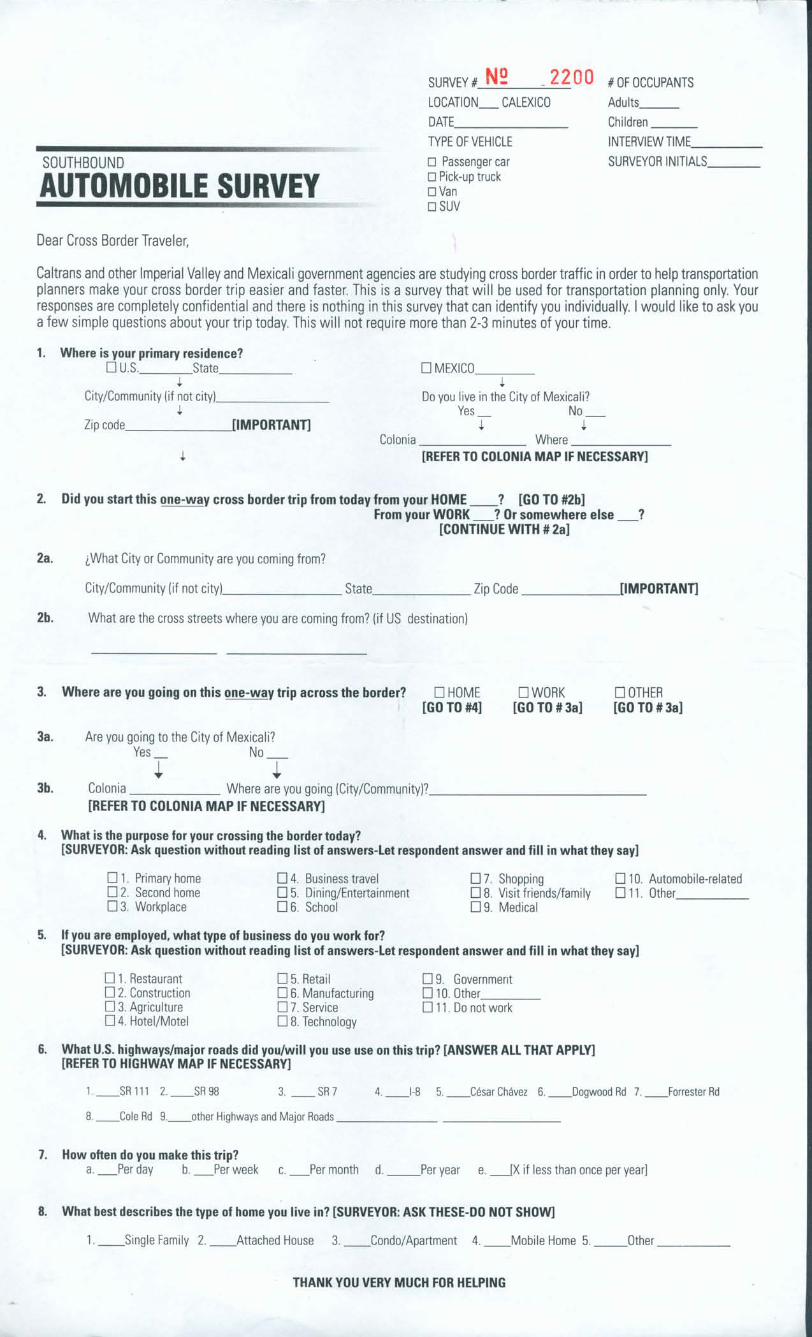
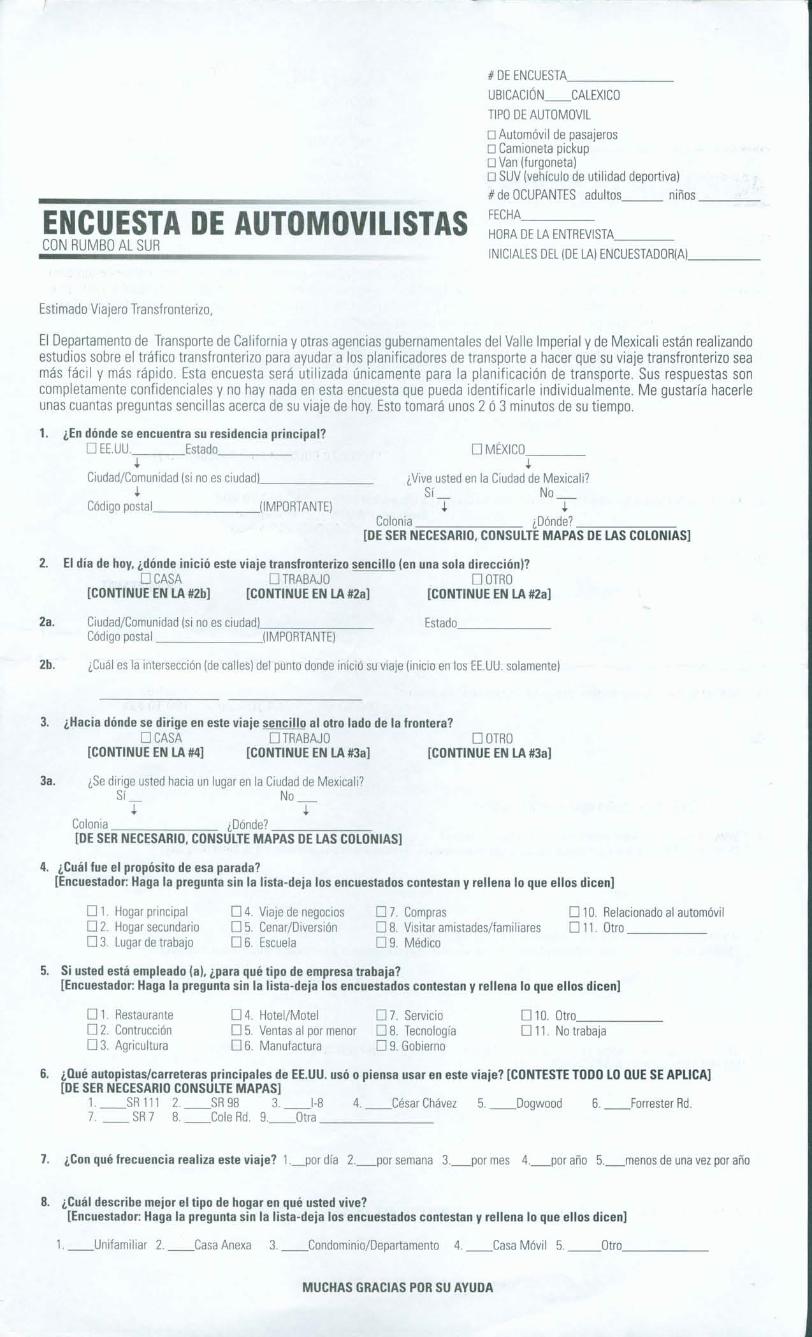
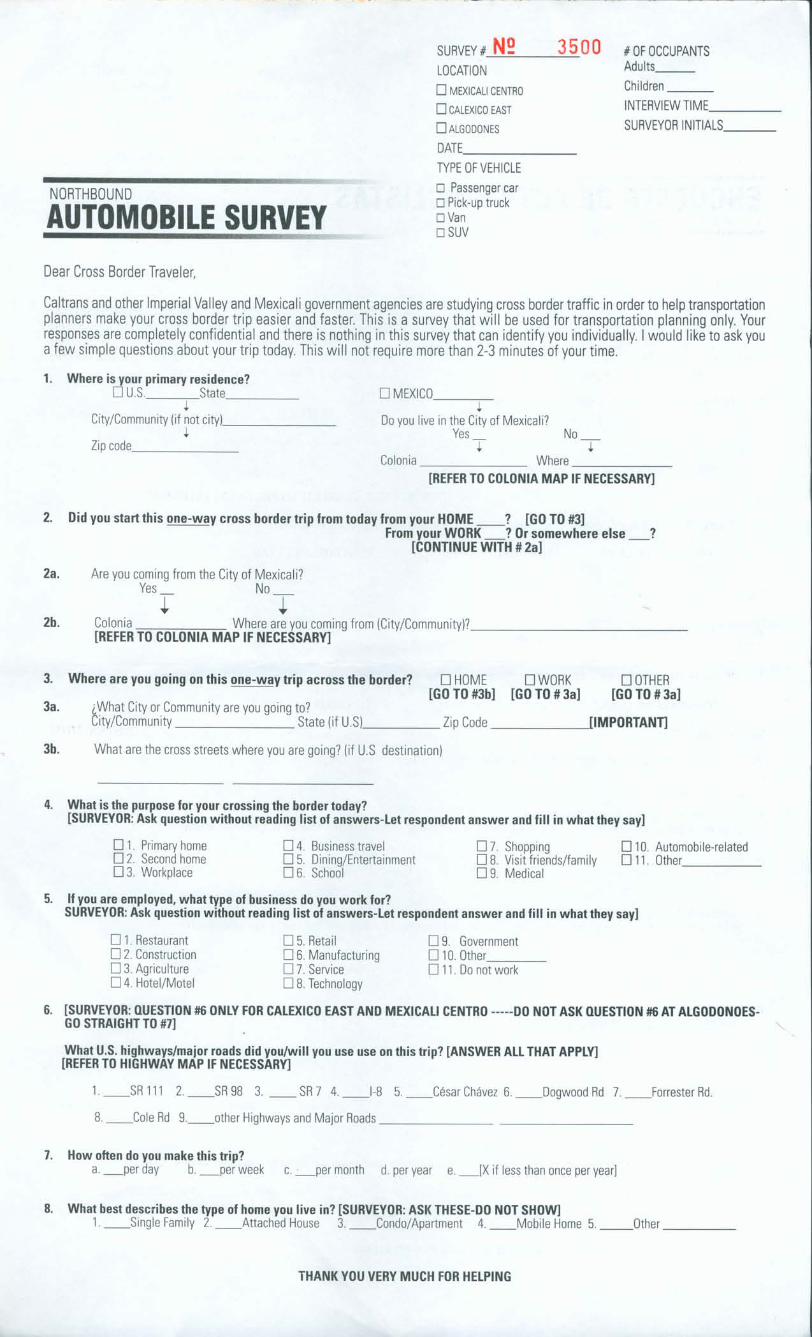
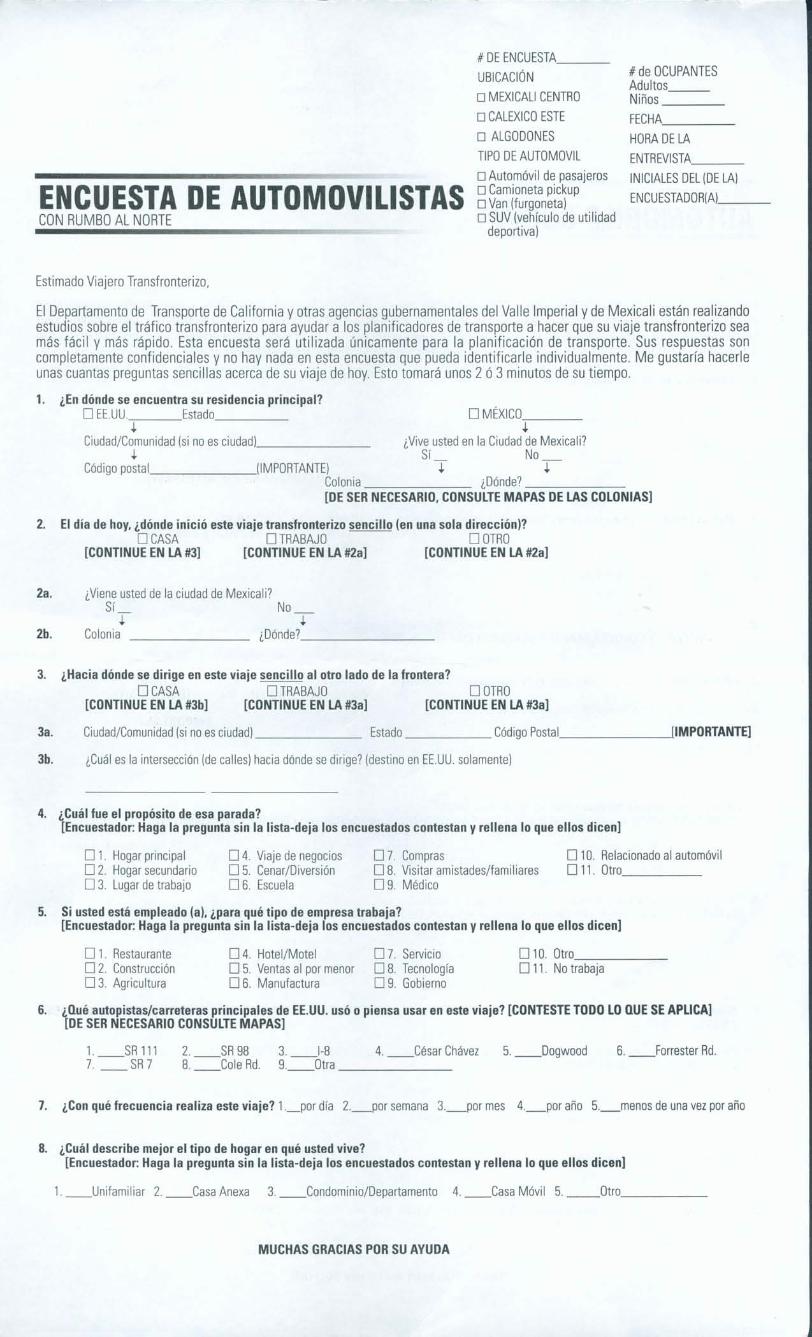
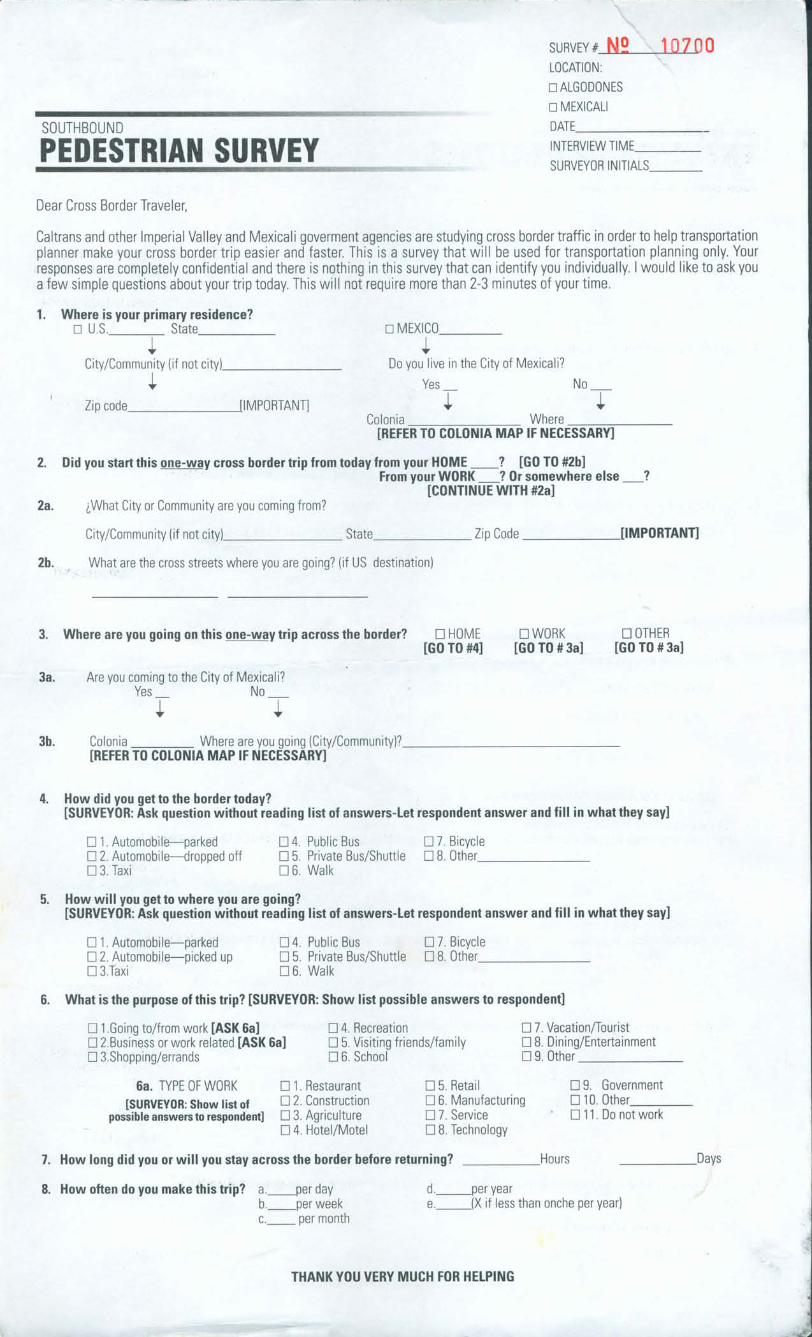
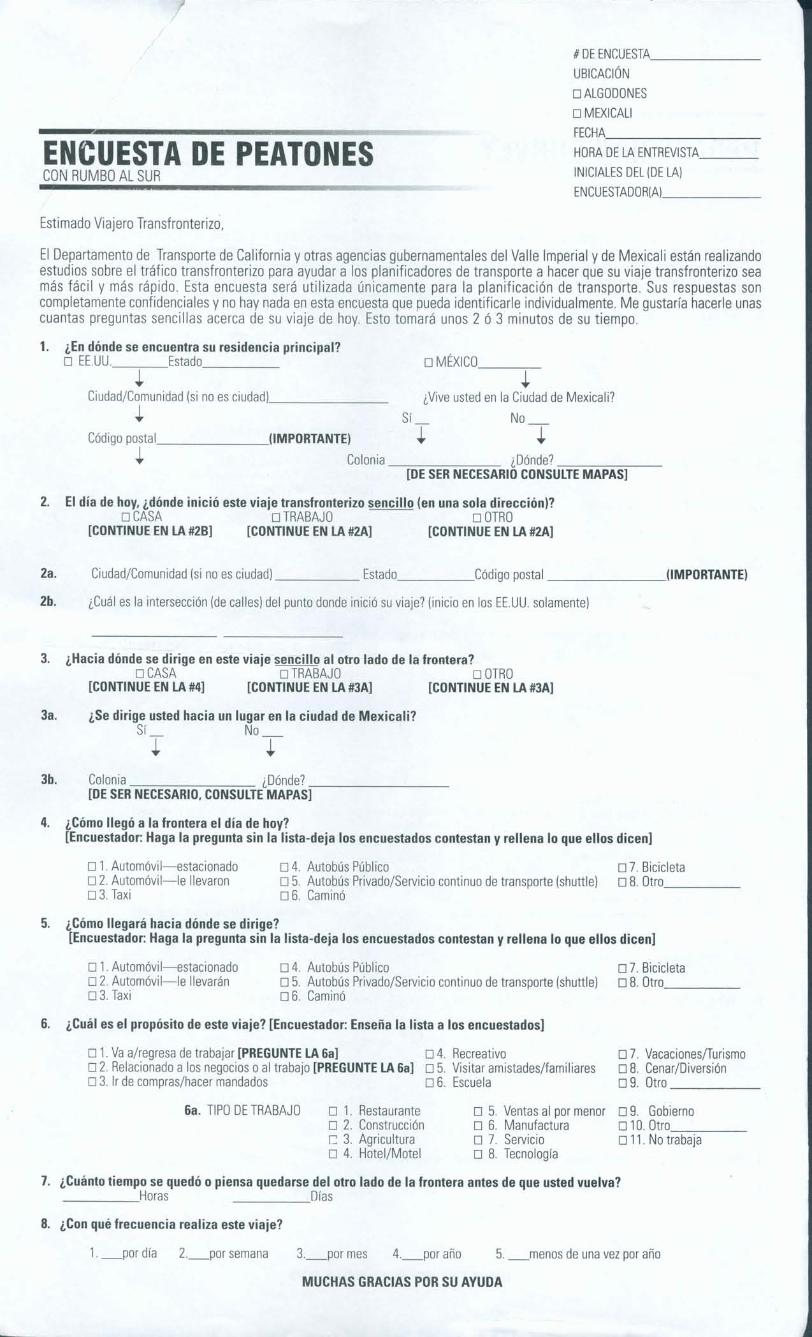
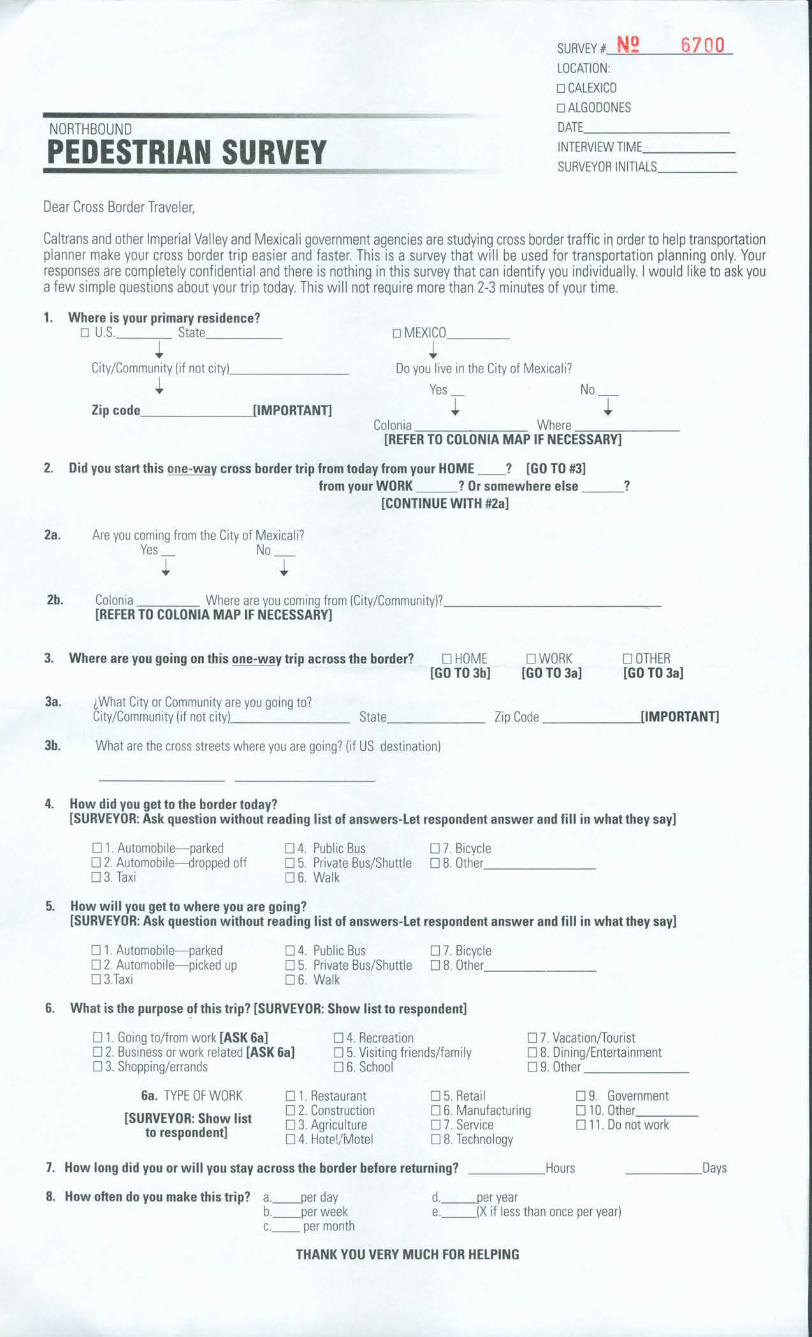
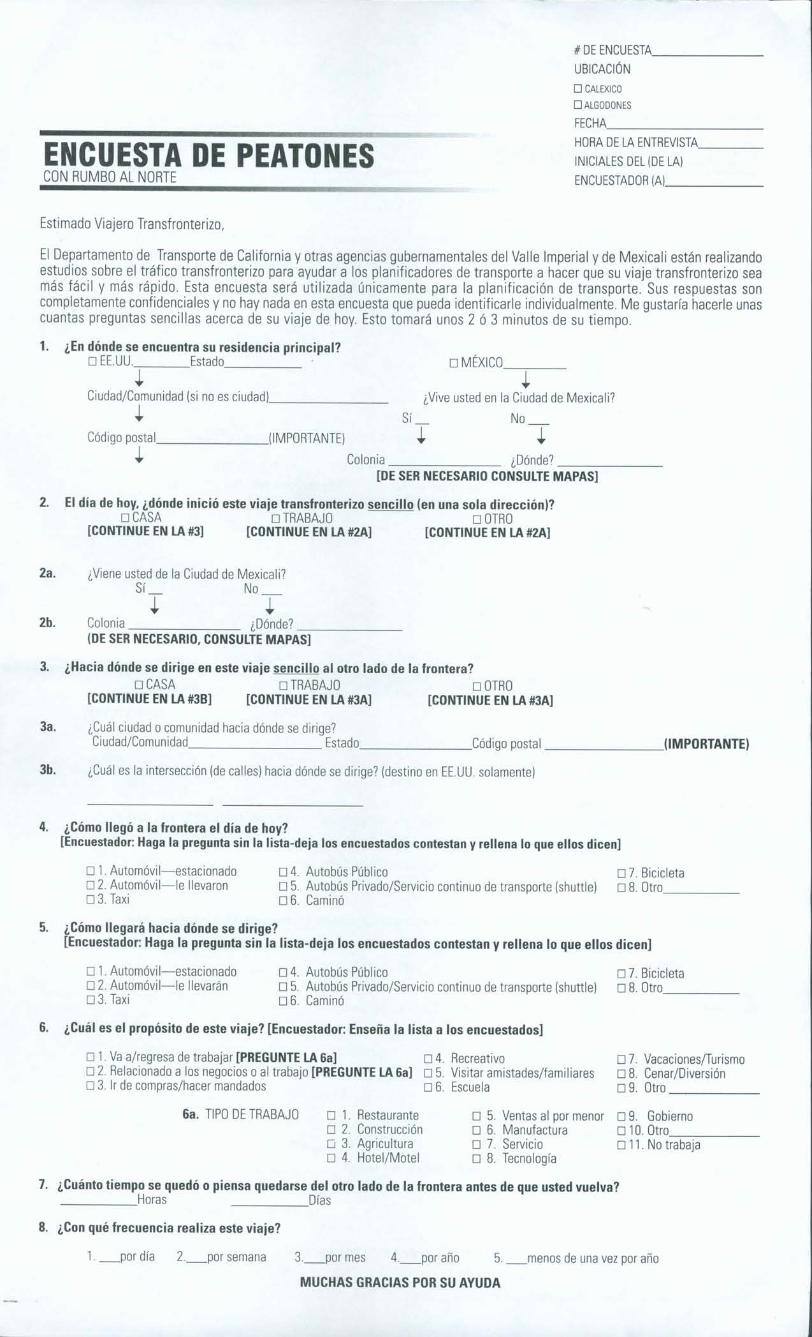
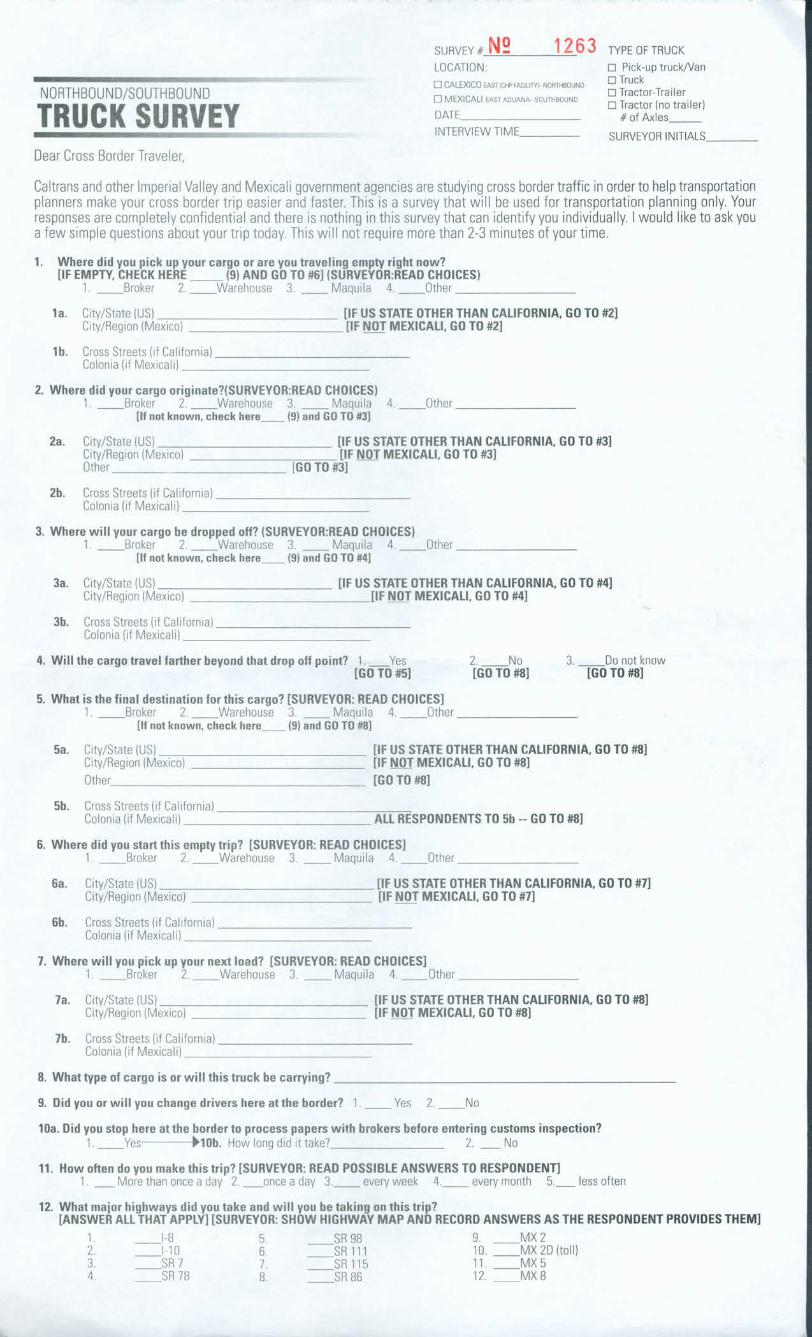
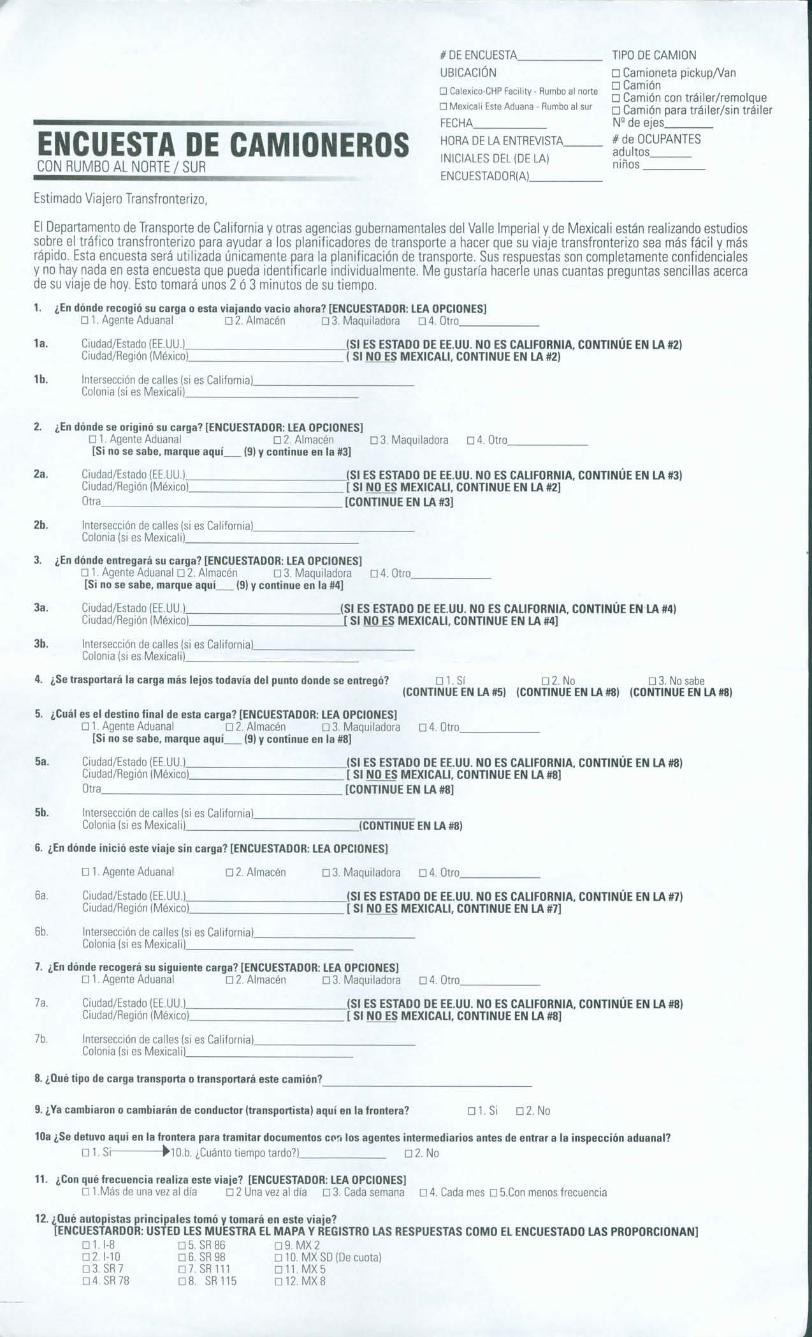
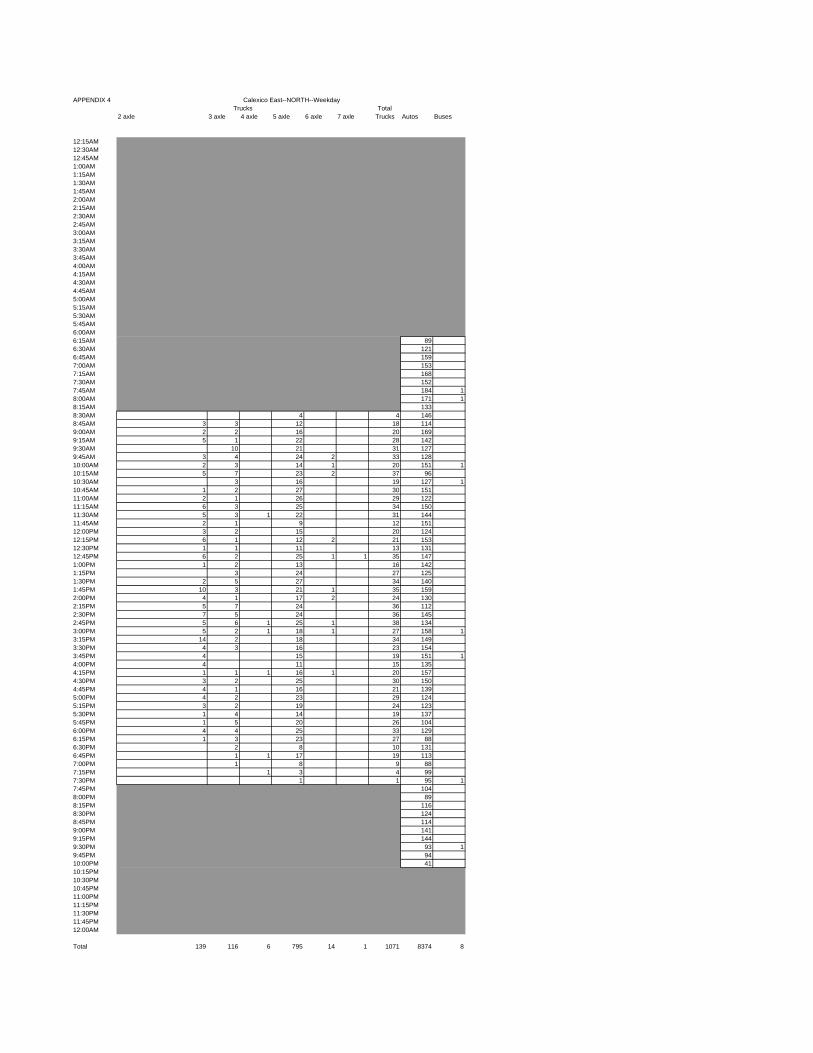
APPENDIX 4Total
2 axle 3 axle 4 axle 5 axle 6 axle 7 axle Trucks Autos Buses
12:15AM12:30AM12:45AM1:00AM1:15AM1:30AM1:45AM2:00AM2:15AM2:30AM2:45AM3:00AM3:15AM3:30AM3:45AM4:00AM4:15AM4:30AM4:45AM5:00AM5:15AM5:30AM5:45AM6:00AM6:15AM 896:30AM 1216:45AM 1597:00AM 1537:15AM 1687:30AM 1527:45AM 184 18:00AM 171 18:15AM 1338:30AM 4 4 1468:45AM 3 3 12 18 1149:00AM 2 2 16 20 1699:15AM 5 1 22 28 1429:30AM 10 21 31 1279:45AM 3 4 24 2 33 12810:00AM 2 3 14 1 20 151 110:15AM 5 7 23 2 37 9610:30AM 3 16 19 127 110:45AM 1 2 27 30 15111:00AM 2 1 26 29 12211:15AM 6 3 25 34 15011:30AM 5 3 1 22 31 14411:45AM 2 1 9 12 15112:00PM 3 2 15 20 12412:15PM 6 1 12 2 21 15312:30PM 1 1 11 13 13112:45PM 6 2 25 1 1 35 1471:00PM 1 2 13 16 1421:15PM 3 24 27 1251:30PM 2 5 27 34 1401:45PM 10 3 21 1 35 1592:00PM 4 1 17 2 24 1302:15PM 5 7 24 36 1122:30PM 7 5 24 36 1452:45PM 5 6 1 25 1 38 1343:00PM 5 2 1 18 1 27 158 13:15PM 14 2 18 34 1493:30PM 4 3 16 23 1543:45PM 4 15 19 151 14:00PM 4 11 15 1354:15PM 1 1 1 16 1 20 1574:30PM 3 2 25 30 1504:45PM 4 1 16 21 1395:00PM 4 2 23 29 1245:15PM 3 2 19 24 1235:30PM 1 4 14 19 1375:45PM 1 5 20 26 1046:00PM 4 4 25 33 1296:15PM 1 3 23 27 886:30PM 2 8 10 1316:45PM 1 1 17 19 1137:00PM 1 8 9 887:15PM 1 3 4 997:30PM 1 1 95 17:45PM 1048:00PM 898:15PM 1168:30PM 1248:45PM 1149:00PM 1419:15PM 1449:30PM 93 19:45PM 9410:00PM 4110:15PM10:30PM10:45PM11:00PM11:15PM11:30PM11:45PM12:00AM
Total 139 116 6 795 14 1 1071 8374 8
TrucksCalexico East--NORTH--Weekday
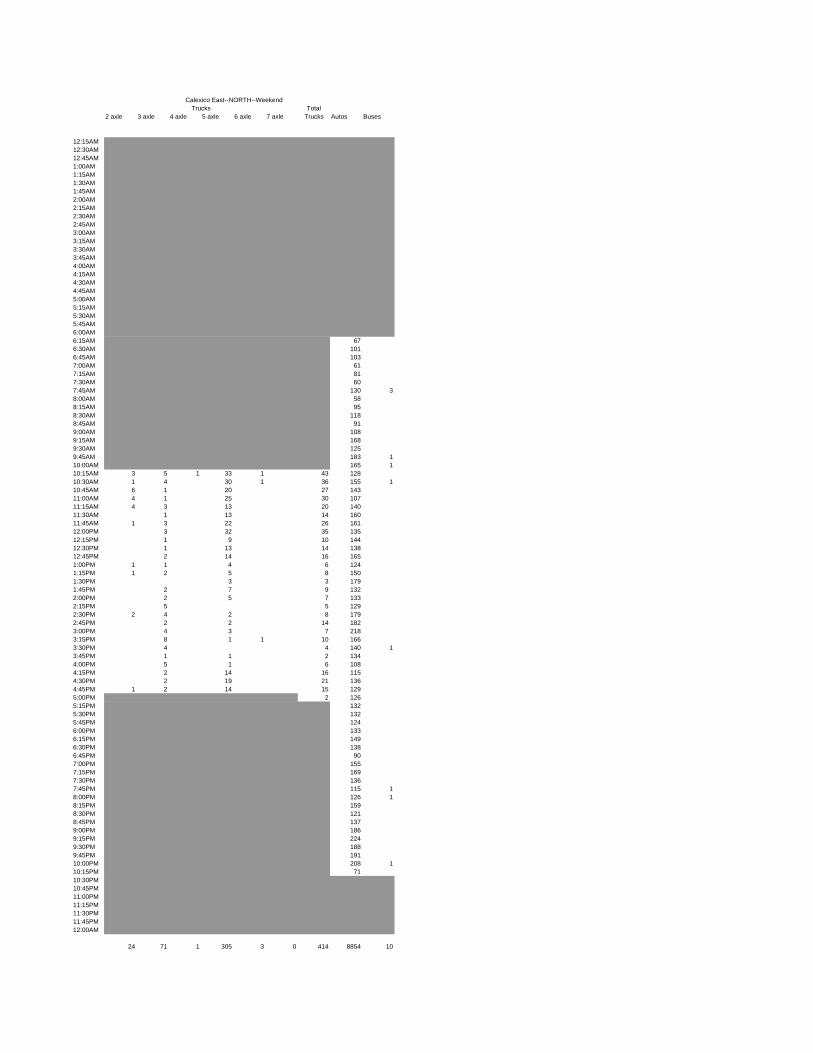
Total2 axle 3 axle 4 axle 5 axle 6 axle 7 axle Trucks Autos Buses
12:15AM12:30AM12:45AM1:00AM1:15AM1:30AM1:45AM2:00AM2:15AM2:30AM2:45AM3:00AM3:15AM3:30AM3:45AM4:00AM4:15AM4:30AM4:45AM5:00AM5:15AM5:30AM5:45AM6:00AM6:15AM 676:30AM 1016:45AM 1037:00AM 617:15AM 817:30AM 607:45AM 130 38:00AM 588:15AM 958:30AM 1188:45AM 919:00AM 1089:15AM 1689:30AM 1259:45AM 183 110:00AM 165 110:15AM 3 5 1 33 1 43 12810:30AM 1 4 30 1 36 155 110:45AM 6 1 20 27 14311:00AM 4 1 25 30 10711:15AM 4 3 13 20 14011:30AM 1 13 14 16011:45AM 1 3 22 26 16112:00PM 3 32 35 13512:15PM 1 9 10 14412:30PM 1 13 14 13812:45PM 2 14 16 1651:00PM 1 1 4 6 1241:15PM 1 2 5 8 1501:30PM 3 3 1791:45PM 2 7 9 1322:00PM 2 5 7 1332:15PM 5 5 1292:30PM 2 4 2 8 1792:45PM 2 2 14 1823:00PM 4 3 7 2183:15PM 8 1 1 10 1663:30PM 4 4 140 13:45PM 1 1 2 1344:00PM 5 1 6 1084:15PM 2 14 16 1154:30PM 2 19 21 1364:45PM 1 2 14 15 1295:00PM 2 1265:15PM 1325:30PM 1325:45PM 1246:00PM 1336:15PM 1496:30PM 1386:45PM 907:00PM 1557:15PM 1697:30PM 1367:45PM 115 18:00PM 126 18:15PM 1598:30PM 1218:45PM 1379:00PM 1869:15PM 2249:30PM 1889:45PM 19110:00PM 208 110:15PM 7110:30PM10:45PM11:00PM11:15PM11:30PM11:45PM12:00AM
24 71 1 305 3 0 414 8854 10
TrucksCalexico East--NORTH--Weekend
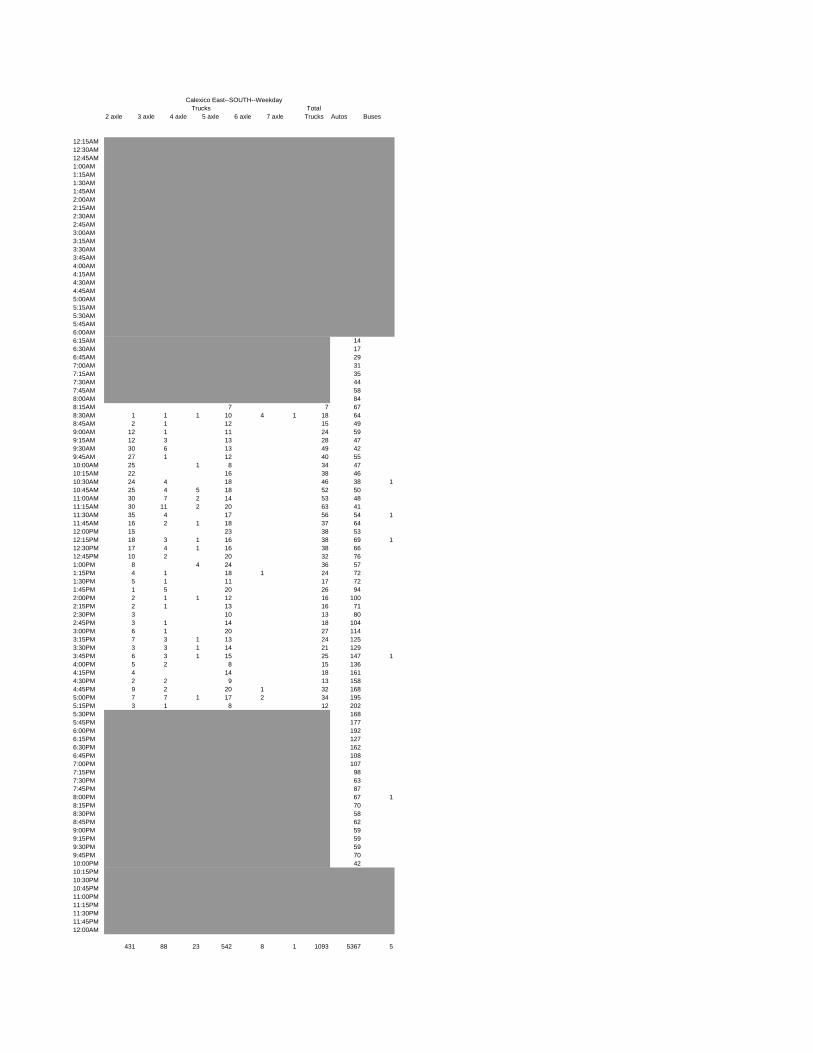
Total2 axle 3 axle 4 axle 5 axle 6 axle 7 axle Trucks Autos Buses
12:15AM12:30AM12:45AM1:00AM1:15AM1:30AM1:45AM2:00AM2:15AM2:30AM2:45AM3:00AM3:15AM3:30AM3:45AM4:00AM4:15AM4:30AM4:45AM5:00AM5:15AM5:30AM5:45AM6:00AM6:15AM 146:30AM 176:45AM 297:00AM 317:15AM 357:30AM 447:45AM 588:00AM 848:15AM 7 7 678:30AM 1 1 1 10 4 1 18 648:45AM 2 1 12 15 499:00AM 12 1 11 24 599:15AM 12 3 13 28 479:30AM 30 6 13 49 429:45AM 27 1 12 40 5510:00AM 25 1 8 34 4710:15AM 22 16 38 4610:30AM 24 4 18 46 38 110:45AM 25 4 5 18 52 5011:00AM 30 7 2 14 53 4811:15AM 30 11 2 20 63 4111:30AM 35 4 17 56 54 111:45AM 16 2 1 18 37 6412:00PM 15 23 38 5312:15PM 18 3 1 16 38 69 112:30PM 17 4 1 16 38 6612:45PM 10 2 20 32 761:00PM 8 4 24 36 571:15PM 4 1 18 1 24 721:30PM 5 1 11 17 721:45PM 1 5 20 26 942:00PM 2 1 1 12 16 1002:15PM 2 1 13 16 712:30PM 3 10 13 802:45PM 3 1 14 18 1043:00PM 6 1 20 27 1143:15PM 7 3 1 13 24 1253:30PM 3 3 1 14 21 1293:45PM 6 3 1 15 25 147 14:00PM 5 2 8 15 1364:15PM 4 14 18 1614:30PM 2 2 9 13 1584:45PM 9 2 20 1 32 1685:00PM 7 7 1 17 2 34 1955:15PM 3 1 8 12 2025:30PM 1685:45PM 1776:00PM 1926:15PM 1276:30PM 1626:45PM 1087:00PM 1077:15PM 987:30PM 637:45PM 878:00PM 67 18:15PM 708:30PM 588:45PM 629:00PM 599:15PM 599:30PM 599:45PM 7010:00PM 4210:15PM10:30PM10:45PM11:00PM11:15PM11:30PM11:45PM12:00AM
431 88 23 542 8 1 1093 5367 5
TrucksCalexico East--SOUTH--Weekday

Total2 axle 3 axle 4 axle 5 axle 6 axle 7 axle Trucks Autos Buses
12:15AM12:30AM12:45AM1:00AM1:15AM1:30AM1:45AM2:00AM2:15AM2:30AM2:45AM3:00AM3:15AM3:30AM3:45AM4:00AM4:15AM4:30AM4:45AM5:00AM5:15AM5:30AM5:45AM6:00AM6:15AM 106:30AM 206:45AM 227:00AM 207:15AM 287:30AM 347:45AM 438:00AM 388:15AM 438:30AM 708:45AM 559:00AM 569:15AM 589:30AM 859:45AM 10810:00AM 8310:15AM 2 5 12 23 42 9510:30AM 2 7 3 22 34 5610:45AM 22 22 93 111:00AM 1 7 21 29 8211:15AM 1 8 7 16 7611:30AM 2 4 12 18 7911:45AM 1 4 2 13 20 9312:00PM 3 5 1 9 18 78 112:15PM 1 2 14 17 9512:30PM 5 2 15 1 23 10512:45PM 1 1 14 16 1091:00PM 2 3 20 1 26 105 11:15PM 1 7 18 26 1261:30PM 2 6 10 18 1351:45PM 3 4 10 3 20 1162:00PM 4 5 12 21 1152:15PM 1 10 6 1 18 2072:30PM 1 7 10 18 1492:45PM 1 5 3 9 1243:00PM 4 3 7 1423:15PM 6 6 12 1623:30PM 6 16 1 23 1273:45PM 2 7 9 1304:00PM 2 4 6 1474:15PM 4 9 13 129 14:30PM 1 10 11 1354:45PM 4 4 8 1395:00PM 1105:15PM 1135:30PM 1285:45PM 1346:00PM 1216:15PM 1176:30PM 1206:45PM 1147:00PM 108 17:15PM 1067:30PM 1117:45PM 1048:00PM 928:15PM 1158:30PM 898:45PM 769:00PM 739:15PM 669:30PM 759:45PM 7310:00PM 6110:15PM10:30PM10:45PM11:00PM11:15PM11:30PM11:45PM12:00AM
33 114 18 321 13 1 500 6028 5
Calexico East--SOUTH--WeekendTrucks
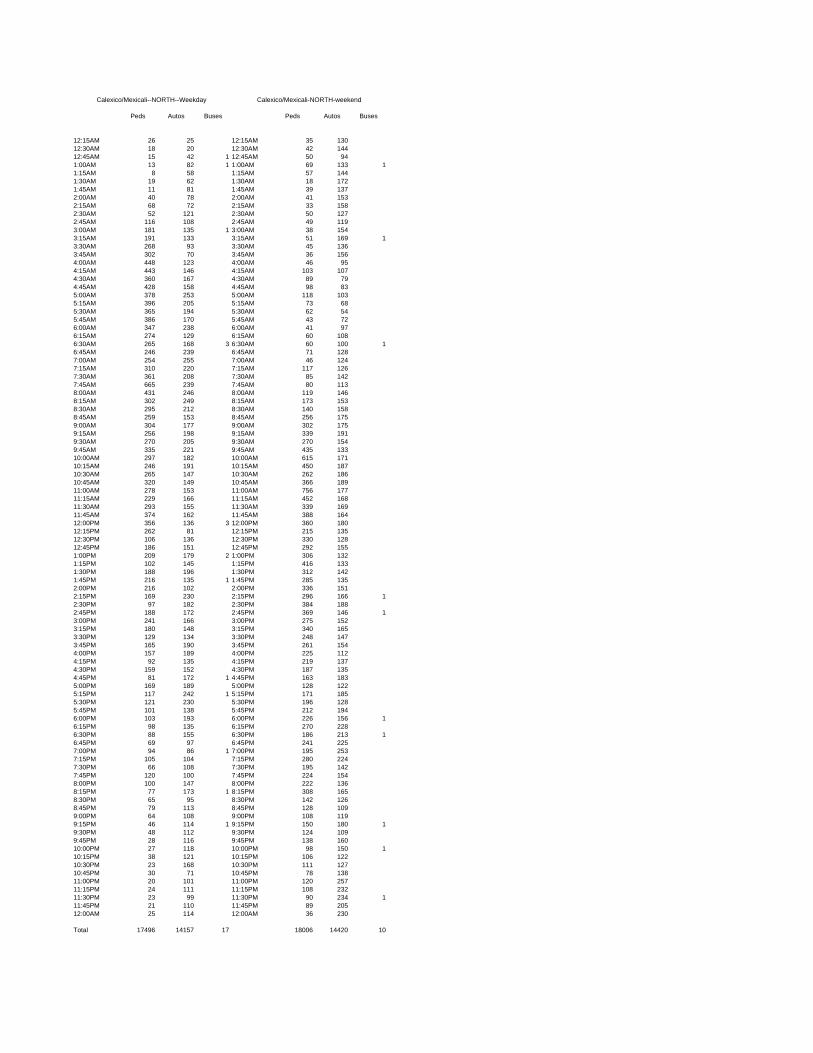
Peds Autos Buses Peds Autos Buses
12:15AM 26 25 12:15AM 35 13012:30AM 18 20 12:30AM 42 14412:45AM 15 42 1 12:45AM 50 941:00AM 13 82 1 1:00AM 69 133 11:15AM 8 58 1:15AM 57 1441:30AM 19 62 1:30AM 18 1721:45AM 11 81 1:45AM 39 1372:00AM 40 78 2:00AM 41 1532:15AM 68 72 2:15AM 33 1582:30AM 52 121 2:30AM 50 1272:45AM 116 108 2:45AM 49 1193:00AM 181 135 1 3:00AM 38 1543:15AM 191 133 3:15AM 51 169 13:30AM 268 93 3:30AM 45 1363:45AM 302 70 3:45AM 36 1564:00AM 448 123 4:00AM 46 954:15AM 443 146 4:15AM 103 1074:30AM 360 167 4:30AM 89 794:45AM 428 158 4:45AM 98 835:00AM 378 253 5:00AM 118 1035:15AM 396 205 5:15AM 73 685:30AM 365 194 5:30AM 62 545:45AM 386 170 5:45AM 43 726:00AM 347 238 6:00AM 41 976:15AM 274 129 6:15AM 60 1086:30AM 265 168 3 6:30AM 60 100 16:45AM 246 239 6:45AM 71 1287:00AM 254 255 7:00AM 46 1247:15AM 310 220 7:15AM 117 1267:30AM 361 208 7:30AM 85 1427:45AM 665 239 7:45AM 80 1138:00AM 431 246 8:00AM 119 1468:15AM 302 249 8:15AM 173 1538:30AM 295 212 8:30AM 140 1588:45AM 259 153 8:45AM 256 1759:00AM 304 177 9:00AM 302 1759:15AM 256 198 9:15AM 339 1919:30AM 270 205 9:30AM 270 1549:45AM 335 221 9:45AM 435 13310:00AM 297 182 10:00AM 615 17110:15AM 246 191 10:15AM 450 18710:30AM 265 147 10:30AM 262 18610:45AM 320 149 10:45AM 366 18911:00AM 278 153 11:00AM 756 17711:15AM 229 166 11:15AM 452 16811:30AM 293 155 11:30AM 339 16911:45AM 374 162 11:45AM 388 16412:00PM 356 136 3 12:00PM 360 18012:15PM 262 81 12:15PM 215 13512:30PM 106 136 12:30PM 330 12812:45PM 186 151 12:45PM 292 1551:00PM 209 179 2 1:00PM 306 1321:15PM 102 145 1:15PM 416 1331:30PM 188 196 1:30PM 312 1421:45PM 216 135 1 1:45PM 285 1352:00PM 216 102 2:00PM 336 1512:15PM 169 230 2:15PM 296 166 12:30PM 97 182 2:30PM 384 1882:45PM 188 172 2:45PM 369 146 13:00PM 241 166 3:00PM 275 1523:15PM 180 148 3:15PM 340 1653:30PM 129 134 3:30PM 248 1473:45PM 165 190 3:45PM 261 1544:00PM 157 189 4:00PM 225 1124:15PM 92 135 4:15PM 219 1374:30PM 159 152 4:30PM 187 1354:45PM 81 172 1 4:45PM 163 1835:00PM 169 189 5:00PM 128 1225:15PM 117 242 1 5:15PM 171 1855:30PM 121 230 5:30PM 196 1285:45PM 101 138 5:45PM 212 1946:00PM 103 193 6:00PM 226 156 16:15PM 98 135 6:15PM 270 2286:30PM 88 155 6:30PM 186 213 16:45PM 69 97 6:45PM 241 2257:00PM 94 86 1 7:00PM 195 2537:15PM 105 104 7:15PM 280 2247:30PM 66 108 7:30PM 195 1427:45PM 120 100 7:45PM 224 1548:00PM 100 147 8:00PM 222 1368:15PM 77 173 1 8:15PM 308 1658:30PM 65 95 8:30PM 142 1268:45PM 79 113 8:45PM 128 1099:00PM 64 108 9:00PM 108 1199:15PM 46 114 1 9:15PM 150 180 19:30PM 48 112 9:30PM 124 1099:45PM 28 116 9:45PM 138 16010:00PM 27 118 10:00PM 98 150 110:15PM 38 121 10:15PM 106 12210:30PM 23 168 10:30PM 111 12710:45PM 30 71 10:45PM 78 13811:00PM 20 101 11:00PM 120 25711:15PM 24 111 11:15PM 108 23211:30PM 23 99 11:30PM 90 234 111:45PM 21 110 11:45PM 89 20512:00AM 25 114 12:00AM 36 230
Total 17496 14157 17 18006 14420 10
Calexico/Mexicali--NORTH--Weekday Calexico/Mexicali-NORTH-weekend
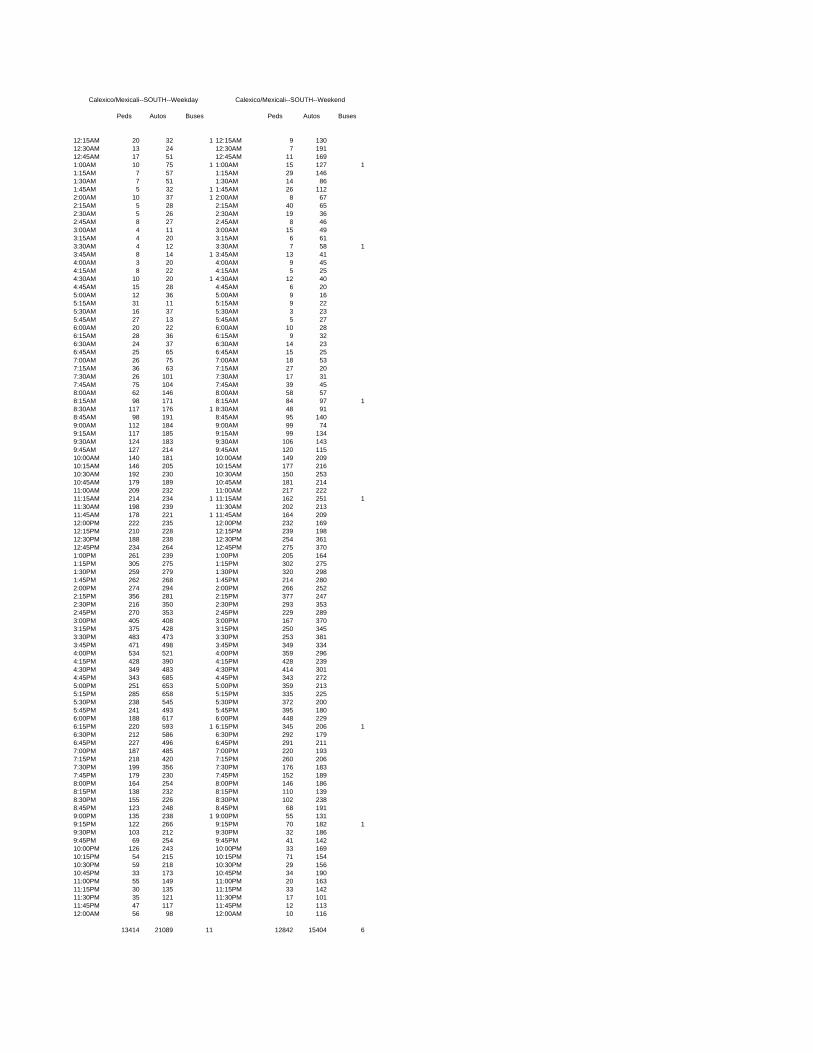
Peds Autos Buses Peds Autos Buses
12:15AM 20 32 1 12:15AM 9 13012:30AM 13 24 12:30AM 7 19112:45AM 17 51 12:45AM 11 1691:00AM 10 75 1 1:00AM 15 127 11:15AM 7 57 1:15AM 29 1461:30AM 7 51 1:30AM 14 861:45AM 5 32 1 1:45AM 26 1122:00AM 10 37 1 2:00AM 8 672:15AM 5 28 2:15AM 40 652:30AM 5 26 2:30AM 19 362:45AM 8 27 2:45AM 8 463:00AM 4 11 3:00AM 15 493:15AM 4 20 3:15AM 6 613:30AM 4 12 3:30AM 7 58 13:45AM 8 14 1 3:45AM 13 414:00AM 3 20 4:00AM 9 454:15AM 8 22 4:15AM 5 254:30AM 10 20 1 4:30AM 12 404:45AM 15 28 4:45AM 6 205:00AM 12 36 5:00AM 9 165:15AM 31 11 5:15AM 9 225:30AM 16 37 5:30AM 3 235:45AM 27 13 5:45AM 5 276:00AM 20 22 6:00AM 10 286:15AM 28 36 6:15AM 9 326:30AM 24 37 6:30AM 14 236:45AM 25 65 6:45AM 15 257:00AM 26 75 7:00AM 18 537:15AM 36 63 7:15AM 27 207:30AM 26 101 7:30AM 17 317:45AM 75 104 7:45AM 39 458:00AM 62 146 8:00AM 58 578:15AM 98 171 8:15AM 84 97 18:30AM 117 176 1 8:30AM 48 918:45AM 98 191 8:45AM 95 1409:00AM 112 184 9:00AM 99 749:15AM 117 185 9:15AM 99 1349:30AM 124 183 9:30AM 106 1439:45AM 127 214 9:45AM 120 11510:00AM 140 181 10:00AM 149 20910:15AM 146 205 10:15AM 177 21610:30AM 192 230 10:30AM 150 25310:45AM 179 189 10:45AM 181 21411:00AM 209 232 11:00AM 217 22211:15AM 214 234 1 11:15AM 162 251 111:30AM 198 239 11:30AM 202 21311:45AM 178 221 1 11:45AM 164 20912:00PM 222 235 12:00PM 232 16912:15PM 210 228 12:15PM 239 19812:30PM 188 238 12:30PM 254 36112:45PM 234 264 12:45PM 275 3701:00PM 261 239 1:00PM 205 1641:15PM 305 275 1:15PM 302 2751:30PM 259 279 1:30PM 320 2981:45PM 262 268 1:45PM 214 2802:00PM 274 294 2:00PM 266 2522:15PM 356 281 2:15PM 377 2472:30PM 216 350 2:30PM 293 3532:45PM 270 353 2:45PM 229 2893:00PM 405 408 3:00PM 167 3703:15PM 375 428 3:15PM 250 3453:30PM 483 473 3:30PM 253 3813:45PM 471 498 3:45PM 349 3344:00PM 534 521 4:00PM 359 2964:15PM 428 390 4:15PM 428 2394:30PM 349 483 4:30PM 414 3014:45PM 343 685 4:45PM 343 2725:00PM 251 653 5:00PM 359 2135:15PM 285 658 5:15PM 335 2255:30PM 238 545 5:30PM 372 2005:45PM 241 493 5:45PM 395 1806:00PM 188 617 6:00PM 448 2296:15PM 220 593 1 6:15PM 345 206 16:30PM 212 586 6:30PM 292 1796:45PM 227 496 6:45PM 291 2117:00PM 187 485 7:00PM 220 1937:15PM 218 420 7:15PM 260 2067:30PM 199 356 7:30PM 176 1837:45PM 179 230 7:45PM 152 1898:00PM 164 254 8:00PM 146 1868:15PM 138 232 8:15PM 110 1398:30PM 155 226 8:30PM 102 2388:45PM 123 248 8:45PM 68 1919:00PM 135 238 1 9:00PM 55 1319:15PM 122 266 9:15PM 70 182 19:30PM 103 212 9:30PM 32 1869:45PM 69 254 9:45PM 41 14210:00PM 126 243 10:00PM 33 16910:15PM 54 215 10:15PM 71 15410:30PM 59 218 10:30PM 29 15610:45PM 33 173 10:45PM 34 19011:00PM 55 149 11:00PM 20 16311:15PM 30 135 11:15PM 33 14211:30PM 35 121 11:30PM 17 10111:45PM 47 117 11:45PM 12 11312:00AM 56 98 12:00AM 10 116
13414 21089 11 12842 15404 6
Calexico/Mexicali--SOUTH--Weekday Calexico/Mexicali--SOUTH--Weekend
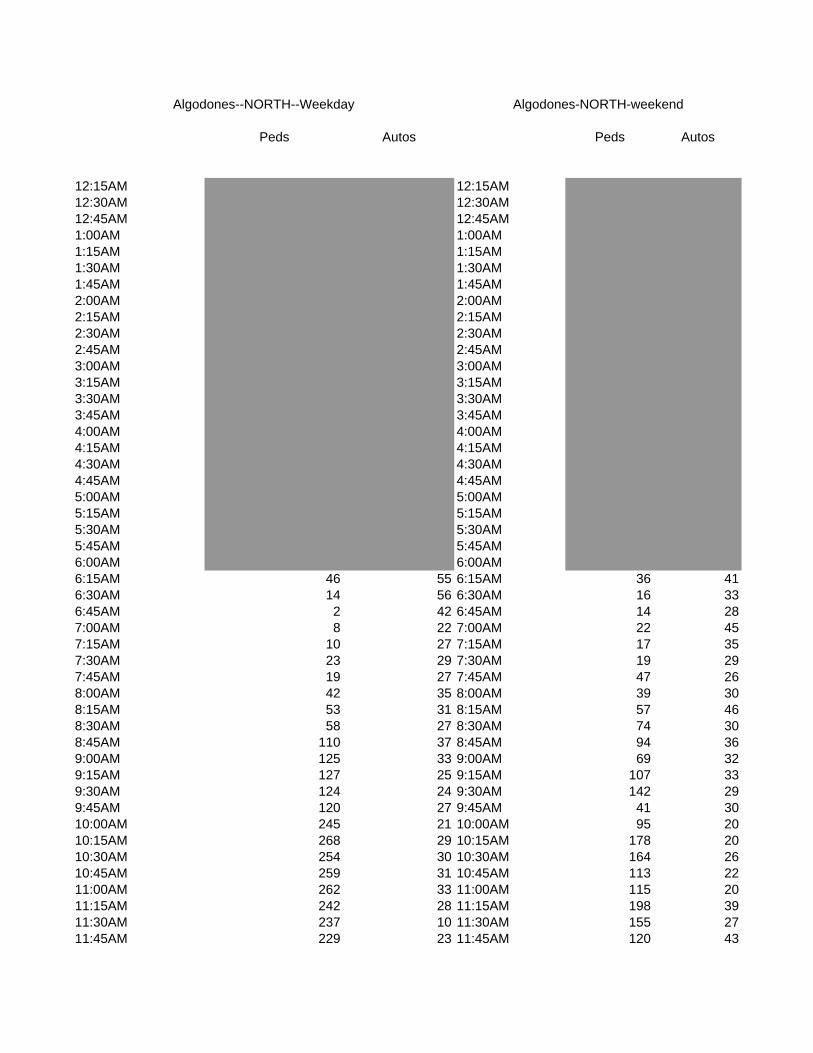
Peds Autos Peds Autos
12:15AM 12:15AM12:30AM 12:30AM12:45AM 12:45AM1:00AM 1:00AM1:15AM 1:15AM1:30AM 1:30AM1:45AM 1:45AM2:00AM 2:00AM2:15AM 2:15AM2:30AM 2:30AM2:45AM 2:45AM3:00AM 3:00AM3:15AM 3:15AM3:30AM 3:30AM3:45AM 3:45AM4:00AM 4:00AM4:15AM 4:15AM4:30AM 4:30AM4:45AM 4:45AM5:00AM 5:00AM5:15AM 5:15AM5:30AM 5:30AM5:45AM 5:45AM6:00AM 6:00AM6:15AM 46 55 6:15AM 36 416:30AM 14 56 6:30AM 16 336:45AM 2 42 6:45AM 14 287:00AM 8 22 7:00AM 22 457:15AM 10 27 7:15AM 17 357:30AM 23 29 7:30AM 19 297:45AM 19 27 7:45AM 47 268:00AM 42 35 8:00AM 39 308:15AM 53 31 8:15AM 57 468:30AM 58 27 8:30AM 74 308:45AM 110 37 8:45AM 94 369:00AM 125 33 9:00AM 69 329:15AM 127 25 9:15AM 107 339:30AM 124 24 9:30AM 142 299:45AM 120 27 9:45AM 41 3010:00AM 245 21 10:00AM 95 2010:15AM 268 29 10:15AM 178 2010:30AM 254 30 10:30AM 164 2610:45AM 259 31 10:45AM 113 2211:00AM 262 33 11:00AM 115 2011:15AM 242 28 11:15AM 198 3911:30AM 237 10 11:30AM 155 2711:45AM 229 23 11:45AM 120 43
Algodones-NORTH-weekendAlgodones--NORTH--Weekday
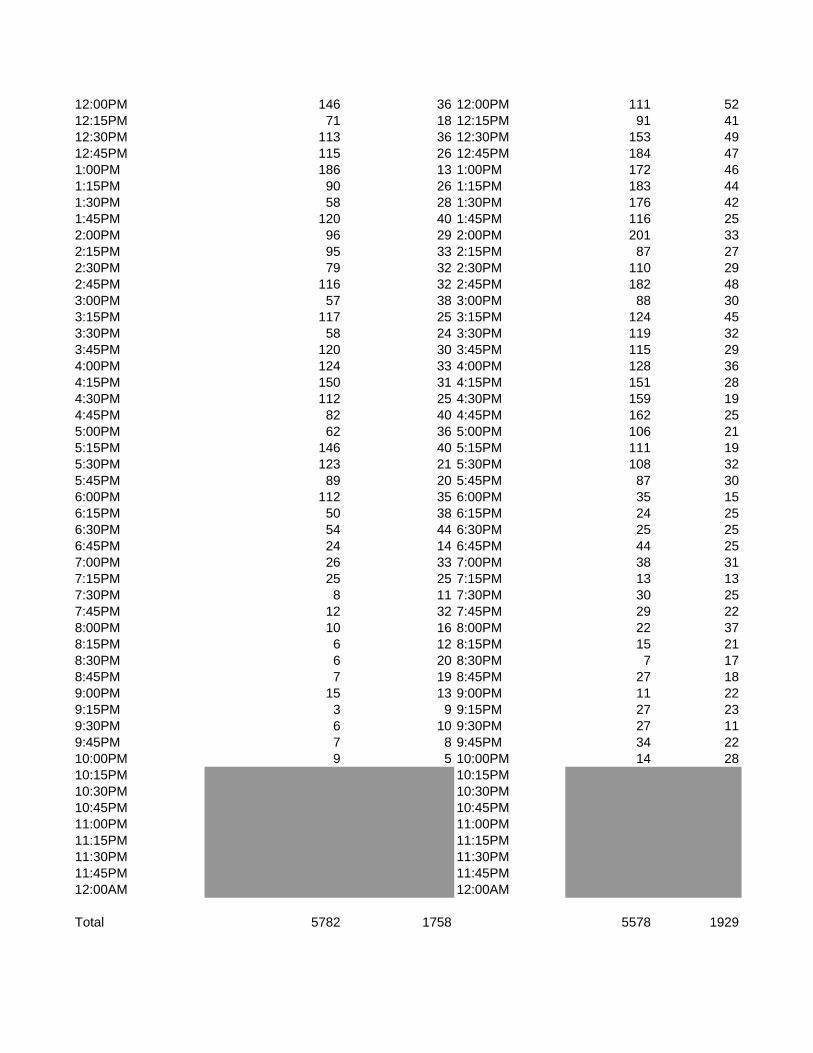
12:00PM 146 36 12:00PM 111 5212:15PM 71 18 12:15PM 91 4112:30PM 113 36 12:30PM 153 4912:45PM 115 26 12:45PM 184 471:00PM 186 13 1:00PM 172 461:15PM 90 26 1:15PM 183 441:30PM 58 28 1:30PM 176 421:45PM 120 40 1:45PM 116 252:00PM 96 29 2:00PM 201 332:15PM 95 33 2:15PM 87 272:30PM 79 32 2:30PM 110 292:45PM 116 32 2:45PM 182 483:00PM 57 38 3:00PM 88 303:15PM 117 25 3:15PM 124 453:30PM 58 24 3:30PM 119 323:45PM 120 30 3:45PM 115 294:00PM 124 33 4:00PM 128 364:15PM 150 31 4:15PM 151 284:30PM 112 25 4:30PM 159 194:45PM 82 40 4:45PM 162 255:00PM 62 36 5:00PM 106 215:15PM 146 40 5:15PM 111 195:30PM 123 21 5:30PM 108 325:45PM 89 20 5:45PM 87 306:00PM 112 35 6:00PM 35 156:15PM 50 38 6:15PM 24 256:30PM 54 44 6:30PM 25 256:45PM 24 14 6:45PM 44 257:00PM 26 33 7:00PM 38 317:15PM 25 25 7:15PM 13 137:30PM 8 11 7:30PM 30 257:45PM 12 32 7:45PM 29 228:00PM 10 16 8:00PM 22 378:15PM 6 12 8:15PM 15 218:30PM 6 20 8:30PM 7 178:45PM 7 19 8:45PM 27 189:00PM 15 13 9:00PM 11 229:15PM 3 9 9:15PM 27 239:30PM 6 10 9:30PM 27 119:45PM 7 8 9:45PM 34 2210:00PM 9 5 10:00PM 14 2810:15PM 10:15PM10:30PM 10:30PM10:45PM 10:45PM11:00PM 11:00PM11:15PM 11:15PM11:30PM 11:30PM11:45PM 11:45PM12:00AM 12:00AM
Total 5782 1758 5578 1929
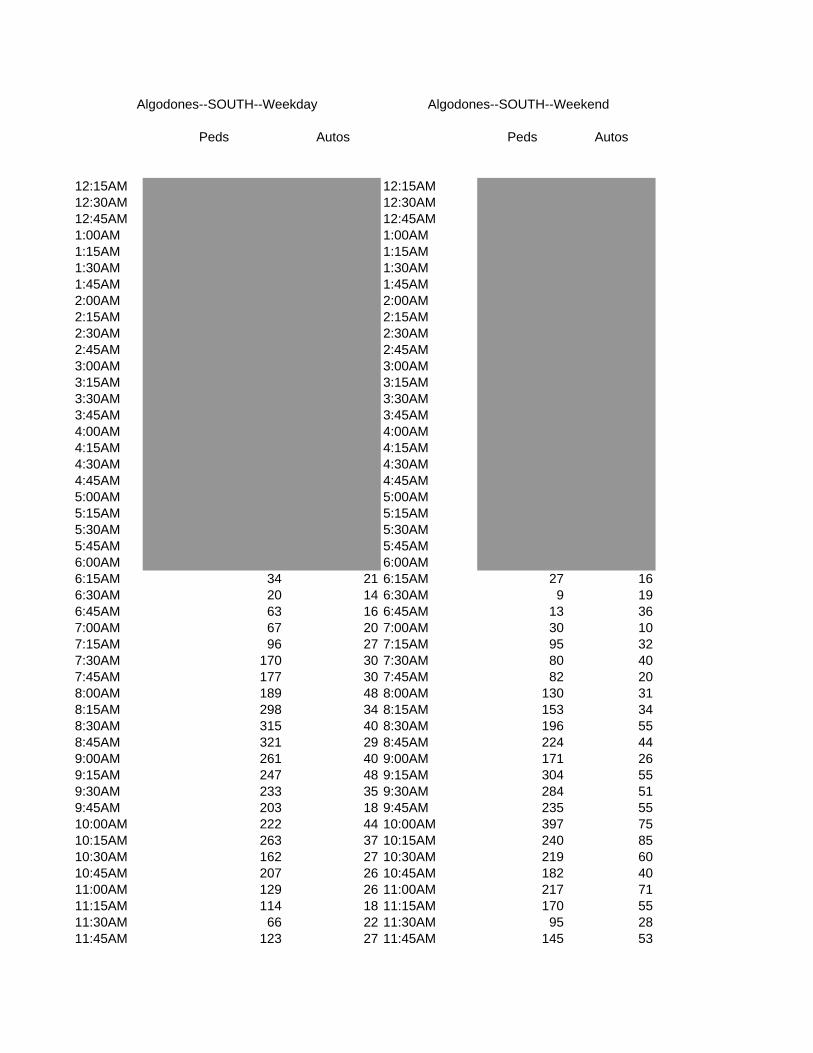
Peds Autos Peds Autos
12:15AM 12:15AM12:30AM 12:30AM12:45AM 12:45AM1:00AM 1:00AM1:15AM 1:15AM1:30AM 1:30AM1:45AM 1:45AM2:00AM 2:00AM2:15AM 2:15AM2:30AM 2:30AM2:45AM 2:45AM3:00AM 3:00AM3:15AM 3:15AM3:30AM 3:30AM3:45AM 3:45AM4:00AM 4:00AM4:15AM 4:15AM4:30AM 4:30AM4:45AM 4:45AM5:00AM 5:00AM5:15AM 5:15AM5:30AM 5:30AM5:45AM 5:45AM6:00AM 6:00AM6:15AM 34 21 6:15AM 27 166:30AM 20 14 6:30AM 9 196:45AM 63 16 6:45AM 13 367:00AM 67 20 7:00AM 30 107:15AM 96 27 7:15AM 95 327:30AM 170 30 7:30AM 80 407:45AM 177 30 7:45AM 82 208:00AM 189 48 8:00AM 130 318:15AM 298 34 8:15AM 153 348:30AM 315 40 8:30AM 196 558:45AM 321 29 8:45AM 224 449:00AM 261 40 9:00AM 171 269:15AM 247 48 9:15AM 304 559:30AM 233 35 9:30AM 284 519:45AM 203 18 9:45AM 235 5510:00AM 222 44 10:00AM 397 7510:15AM 263 37 10:15AM 240 8510:30AM 162 27 10:30AM 219 6010:45AM 207 26 10:45AM 182 4011:00AM 129 26 11:00AM 217 7111:15AM 114 18 11:15AM 170 5511:30AM 66 22 11:30AM 95 2811:45AM 123 27 11:45AM 145 53
Algodones--SOUTH--Weekday Algodones--SOUTH--Weekend
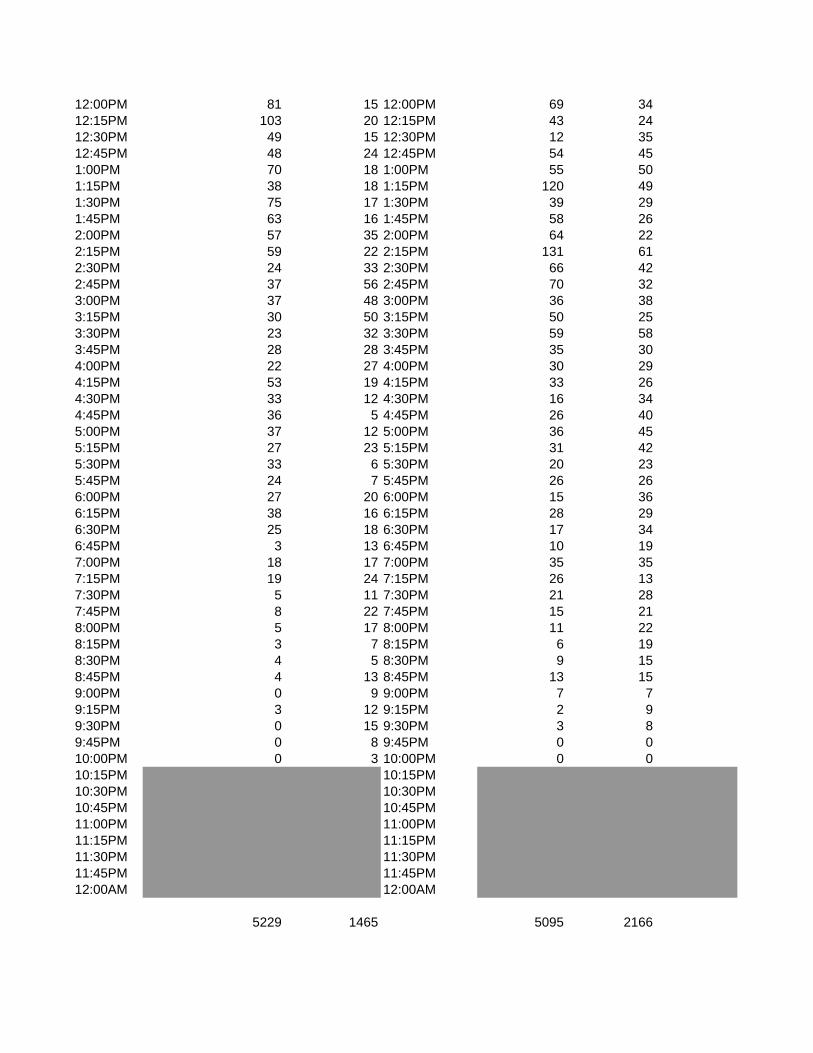
12:00PM 81 15 12:00PM 69 3412:15PM 103 20 12:15PM 43 2412:30PM 49 15 12:30PM 12 3512:45PM 48 24 12:45PM 54 451:00PM 70 18 1:00PM 55 501:15PM 38 18 1:15PM 120 491:30PM 75 17 1:30PM 39 291:45PM 63 16 1:45PM 58 262:00PM 57 35 2:00PM 64 222:15PM 59 22 2:15PM 131 612:30PM 24 33 2:30PM 66 422:45PM 37 56 2:45PM 70 323:00PM 37 48 3:00PM 36 383:15PM 30 50 3:15PM 50 253:30PM 23 32 3:30PM 59 583:45PM 28 28 3:45PM 35 304:00PM 22 27 4:00PM 30 294:15PM 53 19 4:15PM 33 264:30PM 33 12 4:30PM 16 344:45PM 36 5 4:45PM 26 405:00PM 37 12 5:00PM 36 455:15PM 27 23 5:15PM 31 425:30PM 33 6 5:30PM 20 235:45PM 24 7 5:45PM 26 266:00PM 27 20 6:00PM 15 366:15PM 38 16 6:15PM 28 296:30PM 25 18 6:30PM 17 346:45PM 3 13 6:45PM 10 197:00PM 18 17 7:00PM 35 357:15PM 19 24 7:15PM 26 137:30PM 5 11 7:30PM 21 287:45PM 8 22 7:45PM 15 218:00PM 5 17 8:00PM 11 228:15PM 3 7 8:15PM 6 198:30PM 4 5 8:30PM 9 158:45PM 4 13 8:45PM 13 159:00PM 0 9 9:00PM 7 79:15PM 3 12 9:15PM 2 99:30PM 0 15 9:30PM 3 89:45PM 0 8 9:45PM 0 010:00PM 0 3 10:00PM 0 010:15PM 10:15PM10:30PM 10:30PM10:45PM 10:45PM11:00PM 11:00PM11:15PM 11:15PM11:30PM 11:30PM11:45PM 11:45PM12:00AM 12:00AM
5229 1465 5095 2166