Embed Size (px)
Citation preview

National Assessments of Educational Achievement
Implementing a
National Assessment
of Educational
Achievement
Vincent GreaneyThomas Kellaghan
VOLUME 3
Pub
lic D
iscl
osur
e A
utho
rized
Pub
lic D
iscl
osur
e A
utho
rized
Pub
lic D
iscl
osur
e A
utho
rized
Pub
lic D
iscl
osur
e A
utho
rized


Implementing a
National
Assessment of
Educational
Achievement


National Assessments of Educational Achievement
VOLUME 3
Implementing a
National Assessment
of Educational
Achievement
EditorsVincent GreaneyThomas Kellaghan

© 2012 International Bank for Reconstruction and Development / International Development Association or The World Bank1818 H Street NWWashington DC 20433Telephone: 202-473-1000Internet: www.worldbank.org
1 2 3 4 15 14 13 12
This volume is a product of the staff of The World Bank with external contribu-tions. The fi ndings, interpretations, and conclusions expressed in this volume do not necessarily refl ect the views of The World Bank, its Board of Executive Directors, or the governments they represent.
The World Bank does not guarantee the accuracy of the data included in this work. The boundaries, colors, denominations, and other information shown on any map in this work do not imply any judgment on the part of The World Bank con-cerning the legal status of any territory or the endorsement or acceptance of such boundaries.
Rights and PermissionsThe material in this work is subject to copyright. Because The World Bank encour-ages dissemination of its knowledge, this work may be reproduced, in whole or in part, for noncommercial purposes as long as full attribution to the work is given.
For permission to reproduce any part of this work for commercial purposes, please send a request with complete information to the Copyright Clearance Cen-ter Inc., 222 Rosewood Drive, Danvers, MA 01923, USA; telephone: 978-750-8400; fax: 978-750-4470; Internet: www.copyright.com.
All other queries on rights and licenses, including subsidiary rights, should be addressed to the Offi ce of the Publisher, The World Bank, 1818 H Street NW, Washington, DC 20433, USA; fax: 202-522-2422; e-mail: [email protected].
ISBN (paper): 978-0-8213-8589-0ISBN (electronic): 978-0-8213-8590-6DOI: 10.1596/978-0-8213-8589-0
Library of Congress Cataloging-in-Publication DataImplementing a national assessment of educational achievement / editors, Vincent Greaney, Thomas Kellaghan. p. cm. — (National assessments of educational achievement ; v. 3) Includes bibliographical references and index. ISBN 978-0-8213-8589-0 (alk. paper) — ISBN 978-0-8213-8590-6 1. Educational tests and measurements—United States. 2. Educational evaluation—United States. I. Greaney, Vincent. II. Kellaghan, Thomas.
LB3051.I463 2011 371.26’2—dc22
2010036024
Cover design: Naylor Design, Washington, DC
Microsoft, Access, Excel, Offi ce, Windows, and Word are either registered trademarks or trademarks of Microsoft Corporation in the United States and/or other countries.SPSS is a registered trademark of IBM.WesVar is a registered trademark of Westat.

CONTENTS
PREFACE xiii
ABOUT THE AUTHORS AND EDITORS xv
ACKNOWLEDGMENTS xix
ABBREVIATIONS xxi
INTRODUCTION 1
Part IThe Logistics of a National Assessment
Sarah J. Howie and Sylvia Acana
1. PREPARING FOR THE NATIONAL ASSESSMENT:
DESIGN AND PLANNING 9
National Steering Committee 9 Design of a National Assessment 10 Planning 11 Budgeting 12
2. PERSONNEL AND FACILITIES REQUIRED IN A NATIONAL
ASSESSMENT 17
Staff Requirements 18 Facilities 28
v
vi | CONTENTS
3. PREPARATION FOR ADMINISTRATION IN SCHOOLS 31
Contacting Schools 31 Organizing Instruments 35 Preparing Schools 36
4. ADMINISTRATION IN SCHOOLS 39
The Test Administrator 39 Common Administration Problems 42 Quality Assurance 43
5. TASKS FOLLOWING ADMINISTRATION 47
Test Scoring 47 Data Recording 50 Data Analysis 52 Report Writing 53
Part IISchool Sampling MethodologyJean Dumais and J. Heward Gough
6. DEFINING THE POPULATION OF INTEREST 59
7. CREATING THE SAMPLING FRAME 63
The Sampling Frame 63 Senz Case Study 66
8. ELEMENTS OF SAMPLING THEORY 71
Simple Random Sampling 72 Systematic Random Sampling 73 Cluster Sampling 74 Stratifi cation 78 Allocation of Sample across Strata 83 Sampling with Probability Proportional to Size 87 Multistage Sampling 89 Drawing Samples 91
II.A. SAMPLING: FOLDERS AND FILES 103
CONTENTS | vii
Part IIIData Preparation, Validation, and Management
Chris Freeman and Kate O’Malley
9. CODEBOOKS 111
10. DATA MANAGEMENT 119
Data Entry 119 Preparing a Data Entry Template Using Microsoft Access 123
11. DATA VERIFICATION 145
Documentation 145 Consistency between Files 146 Within-File Consistency 146
12. IMPORTING AND MERGING DATA 155
The Dangers of Transferring Data between Programs 155 Exporting Data from SPSS into Access 156 Importing Other Related Data 158 Merging Data from Different Tables Using the Access Queries 159 Version Control 163 Securing the Data 163
13. DUPLICATE DATA 167
Using Access to Check for Duplicate IDs 167 Investigating Duplicate Records 167 Using Access to Check for Duplicate Names 171
III.A. DATA CLEANING AND MANAGEMENT:
FOLDERS AND FILES 177
Part IVWeighting, Estimation, and Sampling Error
Jean Dumais and J. Heward Gough
14. COMPUTING SURVEY WEIGHTS 183
Design Weights 183 Weight Adjustment for Nonresponse 192 Exporting and Importing Clean Data 200 Poststratifi cation: Using Auxiliary Information to Improve
Estimates by Adjusting Estimation Weights 201
viii | CONTENTS
15. COMPUTING ESTIMATES AND THEIR SAMPLING ERRORS
FROM SIMPLE RANDOM SAMPLES 207
Estimating a Population Total 208 Estimating a Population Average 212 Estimating a Population Proportion 213 Estimating for Subgroups of the Population 213 Conclusion 214
16. COMPUTING ESTIMATES AND THEIR SAMPLING ERRORS
FROM COMPLEX SAMPLES 215
17. SPECIAL TOPICS 225
Nonresponse 225 Stratifi cation, Frame Sorting, and Sample Selection 226 Oversize Schools 228 Undersize Schools 229 Standards for Judging the Adequacy of Response Rates 232
IV.A. STATISTICAL NOTATION FOR CALCULATING ESTIMATES 235
IV.B. A COMPARISON OF SR400 DATA AND CENSUS DATA 237
IV.C. ESTIMATING SAMPLING ERROR WITH RESAMPLING
TECHNIQUES 241 Using Replicated Sampling 241 Using Jackknife Estimation 243
IV.D. CREATING JACKKNIFE ZONES AND REPLICATES AND
COMPUTING JACKKNIFE WEIGHTS 249
REFERENCES 259
INDEX 261
BOXES
2.1 Numbering Systems Used in National Assessments 22 2.2 Storage Requirements 29 3.1 Example of a Letter to Schools 33 3.2 Packing Instruments 37 4.1 Student Tracking Form 41 4.2 Test Administration Form 44 4.3 Examples of Questions Addressed by Quality Control
Monitors in TIMSS 45 5.1 Instrument Tracking Form 48
CONTENTS | ix
EXERCISES
7.1 Getting Started 67 8.1 Sample Size Calculation and Allocation to Strata 85 8.2 Selection of SRS of 400 Students 91 8.3 Stratifi ed PPS without Replacement, Selection of Schools:
Reading School and School Allocation Files 93 8.4 Stratifi ed PPS without Replacement, Selection of Schools:
Merging School and School Allocation Files 94 8.5 Stratifi ed PPS without Replacement, Selection of Schools:
Selecting Schools 94 8.6 Stratifi ed PPS without Replacement, Selection of Schools:
Identifying Eligible Classes 96 8.7 Stratifi ed PPS without Replacement, Selection of Schools:
Cleaning the Sampling Frame 98 8.8 Stratifi ed PPS without Replacement, Selection of Schools:
Selecting One Class per School 99 9.1 Entering National Assessment Data into a Codebook 117 10.1 Creating a Database 121 10.2 Creating Database Variables 125 10.3 Creating Additional Database Fields 127 10.4 Setting Default Values 129 10.5 Using the Validation Rule and Validation Text Properties 130 10.6 Entering Item Field Data into a Database 133 10.7 Creating a Form 136 10.8 Changing the Form Layout 137 10.9 Entering Data into the Form 139 10.10 Importing Data into SPSS 143 11.1 Verifying Data Using Excel 147 11.2 Using the Frequency Command in SPSS 150 11.3 Using the Frequency Command to Locate Missing Values 152 12.1 Exporting Data from SPSS into Access 157 12.2 Importing School Data into Access 158 12.3 Creating a Simple Query in Access 160 13.1 Creating a “Find Duplicates” Query in Access 168 13.2 Using a Find Duplicates Query to Locate Duplicate
Student Names 172 14.1 Design Weight for a Simple Random Sample of 400 Students 184 14.2 Design Weight for a PPS Sample of Schools and Classes 187
x | CONTENTS
14.3 Adding Test Results for a Simple Random Sample of 400 Students 188
14.4 Adding Test Results for a PPS Design 190 14.5 Nonresponse Weight Adjustment for Simple Random
Sample of 400 Students 194 14.6 Nonresponse Weight Adjustment for a PPS Sample 198 15.1 Estimation for SRS400 209 16.1 Jackknife Variance Estimation for a PPS Sample 216 16.2 Calculating Gender Differences on a Mathematics Test 219
FIGURES
6.1 Percentages of Students in Desired, Defi ned, and Achieved Populations 61
7.1 Map of Sentz 69 8.1 SRS without Replacement of Schools 73 8.2 Systematic Random Sample of Schools 75 8.3 Cluster Sample of Schools 76 8.4 Stratifi ed Random Sample of Schools 80 8.5 Multistage Sampling 90 8.6 Data Excerpt 95 8.7 Class_Frame 97 II.A.1 Sampling File Directory Structure 106 9.1 Example of a Test Cover Page 112 9.2 Questionnaire Codebook for the Student Demographic
(Background) Information 114 9.3 Test Codebook for the Item Fields of Maths 3a 116 10.1 Data Entry Template (Access 2007) 120 12.1 Exclusive Use Warning Message 164 13.1 Duplicate Records Identifi ed 170 13.2 Documentation of Correction of UniqueID Mistakes 170 13.3 Deleting a Record 171 13.4 Same UniqueID for Two Students 171 13.5 Documentation of Correction of UniqueID Mistakes 171 III.A.1 Data Cleaning and Management File Directory Structure 179 IV.D.1 List of Available Variables 253 IV.D.2 WesVar Jackknife Zones 254 IV.D.3 WesVar Replication Weights 255 IV.D.4 WesVar: Creating Labels 256 IV.D.5 WesVar: Opening Screenshot 257
CONTENTS | xi
TABLES
1.1 Excerpt from a National Assessment Project Plan 13 1.2 National Assessment Funding Checklist 15 2.1 Advantages and Disadvantages of Categories of Personnel
for Test Administration 26 3.1 National Assessment: School Tracking Form 34 3.2 Packing Checklist 38 5.1 Dummy Table Describing Characteristics of Primary School
Teachers 54 7.1 Essential Elements of a Sampling Frame for a National
Assessment 65 II.A.1 Description of Folder Contents 104 9.1 Explanation of the Column Headings in the Codebook 115 10.1 Typical Variables Collected or Captured in National
Assessments 124 III.A.1 Exercises 178 III.A.2 Exercise Solutions 178 14.1 Stratifi ed Simple Random Sample with Equal Allocation 185 14.2 Stratifi ed Simple Random Sample: Urban and Rural
Population and Sample Sizes and Response Rates 197 14.3 Stratifi ed Simple Random Sample: Urban and Rural
Population and Sample Sizes, Response Rates andNonresponse-Adjusted Weights 197
14.4 School Survey: Poststratum Distribution of Staff by Gender 203
14.5 Survey Estimates Adjusted for Nonresponse 203 14.6 Survey Estimates Adjusted for Nonresponse, before and
after Poststratifi cation Adjustment 205 17.1 Sampling Frame with Different Measure of Size Order
within Strata 227 17.2 Sampling Frame for 10 Schools and Associated Design
Weights if Selected 228 17.3 Adjusted Sampling Frame 229 17.4 Sampling Frame 231 17.5 Modifi ed Sampling Frame 232 IV.B.1 Sentz Data Based on Census 237 IV.B.2 Comparing Estimates Calculated with and without the
Weights to Census Values, Beginning of School Year,Simple Random Sample 238

xii | CONTENTS
IV.B.3 Comparing Estimates Calculated with and without the Weights to Census Values, Time of Assessment,
Simple Random Sample 239 IV.C.1 Calculating the Estimated Sampling Variance of Yˆ Using
Replicated Sampling 242 IV.C.2 Preparing for Jackknife Variance Estimation 245 IV.C.3 Estimating Sampling Variance Using Jackknifi ng 246

PREFACE
xiii
Measuring student learning outcomes is necessary for monitoring a school system’s success and for improving education quality. Student achievement information can be used to inform a wide variety of education policies and decisions, including the design and implemen-tation of programs to improve teaching and learning in classrooms, the identifi cation of lagging students so that they can get the support they need, and the provision of appropriate technical assistance and train-ing where it is most needed.
This National Assessments of Educational Achievement series of pub-lications, of which this is the third volume, focuses on state-of-the-art procedures that need to be followed in order to ensure that the data (such as test scores and background information) produced by a large-scale national assessment exercise are of high quality and address the concerns of policy makers, decision makers, and other stakeholders in the education system.
Volume 1 in the series describes the key purposes and features of national assessments of educational achievement and is mainly aimed at policy makers and decision makers in education. Volume 2 ad dresses the design of two types of data collection instruments for national assessment exercises: student achievement tests and back-ground questionnaires.
This third volume in the series, Implementing a National Assessment of Educational Achievement, focuses on the practical tasks involved in

xiv | PREFACE
implementing a large-scale national assessment exercise, including detailed step-by-step instructions on logistics, sampling, and data cleaning and management. Like Volumes 2 and 4 in the series, this volume is intended primarily for the teams in developing and emerg-ing economies who are responsible for conducting a national assess-ment exercise.
Volume 4 in the series deals with how to generate information on test items and test scores and how to relate the test scores to other educational factors. Finally, Volume 5 covers how to write reports that are based on the national assessment fi ndings and how to use the re-sults to improve the quality of educational policy and decision making. Volume 5 should be of particular relevance to those with responsibil-ity for preparing assessment reports or for communicating or using the fi ndings from them.
As readers make their way through this third volume in the Na-tional Assessments of Educational Achievement series, it should become evident that the successful implementation of a national assessment exercise is a complex task that requires considerable knowledge, skill, and resources. At the same time, research has shown that the payoff from well-implemented national assessments can be substantial in terms of the quality of the information provided on levels of student achievement and on school and nonschool factors that might help raise those achievement levels. (Conversely, the “cost” of a poorlyimplemented national assessment may be inaccurate information about student achievement levels and related factors.) Good quality implementation can increase the confi dence of policy makers and other stakeholders in the validity of assessment fi ndings. It also can increase the likelihood that policy makers and other stakeholders will use the results of the national assessment to develop sound plans and programs designed to enhance educational quality and student learn-ing outcomes.
Marguerite ClarkeSenior Education SpecialistJanuary 2012

Sylvia Acana directs Uganda’s National Assessment of Progress in Edu-cation (NAPE). She is a former secondary school science teacher and subject offi cer at the Uganda National Examinations Board. Arcana has provided technical support in assessment to the Economic Policy Re-search Centre and to Save the Children. She is an executive committee member of the International Association for Educational Assessment (IAEA) and vice chairperson of the Board of Governors, Loro Core Primary Teachers’ College. She holds a master’s degree in educational measurement and evaluation.
Jean Dumais is chief of the Statistical Consultation Group at Statistics Canada and a survey statistician at its methodology branch. He has a particular interest in educational assessment. In recent years Dumais has overseen the implementation of the sampling and estimation activities of the International Association for the Evaluation of Educational Achievement comparative study of teacher education (TEDS-M), and the Organisation for Economic Co-operation and Development (OECD) Teaching and Learning International Survey (TALIS). He has also served as sampling referee for a number of international compara-tive educational assessments.
Chris Freeman is research director at the Australian Council for Educational Research. His work has focused on aspects of large-scale
ABOUT THE AUTHORS AND EDITORS
xv

xvi | ABOUT THE AUTHORS AND EDITORS
assessments in most Australian states and territories. National-level work includes the National Assessment Program Literacy and Numer-acy, surveys in science-related curricular areas, and directing the imple-mentation of OECD programs. He has also been closely associated with national monitoring programs in the South Pacifi c and in the Middle East. His current areas of interest include the impact of guess-ing in large-scale national assessments.
J. Heward Gough is a sample survey statistician and was until recently senior statistical consultant in the Statistical Consultation Group at Statistics Canada. He has extensive experience in survey methodology development and statistical consulting, including fi ve years at the UN Latin American Demographic Centre (CELADE). Gough has taught courses on statistical methods, sampling techniques, and survey meth-odology within Statistics Canada, for external clients across Canada, and for national statistical offi ces in Colombia, Cuba, Eritrea, Peru, and Zambia. He participated in a statistical capacity-building project in Burkina Faso.
Vincent Greaney is an educational consultant. He was lead education specialist at the World Bank and worked in Africa, Asia, and the Middle East. A former teacher, research fellow at the Educational Research Centre at St. Patrick’s College in Dublin, and visiting Fulbright profes-sor at Western Michigan University in Kalamazoo, Greaney is a mem-ber of the International Reading Association’s Reading Hall of Fame. Areas of interest include assessment, teacher education, reading, and promotion of social cohesion through textbook reform.
Sarah J. Howie is director of the Centre for Evaluation and Assessment and professor of education at the University of Pretoria. In South Af-rica, she has coordinated international assessments in reading literacy, mathematics, science, and information and communications technol-ogy. In addition to providing training in research in a range of countries, Howie has participated in international and national committees con-cerned with monitoring and evaluating educational quality. Areas of professional interest include large-scale assessment, student assessment, and performance and program evaluation.

ABOUT THE AUTHORS AND EDITORS | xvii
Thomas Kellaghan is an educational consultant. He was director of the Educational Research Centre at St. Patrick’s College, Dublin, and is a fellow of the International Academy of Education. He has worked at the University of Ibadan in Nigeria and at the Queen’s University in Belfast. Areas of research interest include assessment and examinations, educational disadvantage, and home-school relationships. Kellaghan served as president of the International Association for Educational As-sessment. He has worked on assessment issues in Africa, Asia, Latin America, and the Middle East.
Kate O’Malley is a research fellow at the Australian Council for Edu-cational Research. She has been closely associated with a series of national assessments in Australia and with the triennial civics and citizenship and ICT literacy assessments, the annual National Assess-ment Program Literacy and Numeracy (NAPLAN), and the Essential Secondary Science Assessment (ESSA). O’Malley coordinated the Australian component of IEA’s Second Information Technology in Education Study (SITES), and OECD’s Teaching and Learning Inter-national Survey (TALIS) and coauthored the reports for these two projects.


A team led by Vincent Greaney (consultant, Human Development Network, Education Group, World Bank) and Thomas Kellaghan (con-sultant, Educational Research Centre, St. Patrick’s College, Dublin) prepared the series of books titled National Assessments of Educational Achievement, of which this is the third volume. Other contributors to the series are Sylvia Acana (Uganda National Examinations Board), Prue Anderson (Australian Council for Educational Research), Fernan-do Cartwright (Statistics Canada), Jean Dumais (Statistics Canada), Chris Freeman (Australian Council for Educational Research), J. Heward Gough (Statistics Canada), Sara J. Howie (University of Pre-toria), George Morgan (Australian Council for Educational Research), T. Scott Murray (Data Angel, Canada), Kate O’Malley (Australian Council for Educational Research), and Gerry Shiel (Educational Research Centre, St. Patrick’s College, Dublin).
The work was conducted under the general direction of Ruth Kagia, director of education, and of her successor Elizabeth King, and Robin Horn, manager, Human Development Network, Education Group, all at the World Bank. Robert Prouty initiated the project and managed it up to August 2007. Marguerite Clarke has managed it since then through review and publication.
We are grateful for contributions of the review panel: Al Beaton (Boston College), Zewdu Gebrekidan (Assessment Consultant, Ethio-pia), Eugenio Gonzalez (Educational Testing Service), Kelvin Gregory
ACKNOWLEDGMENTS
xix

xx | ACKNOWLEDGMENTS
(New South Wales Board of Studies), Louis Rizzo (Westat), and Carlos Rojas (World Bank). Marguerite Clarke and Robin Horn provided ad-ditional helpful comments.
Hilary Walshe helped prepare the various drafts of this document. We also received input and support from Peter Archer, Jung-Hwan Choi, Mary Rohan, Hans Wagemaker, and Hana Yoshimoto.
We wish to thank the following organizations for permission to re-produce material: the Australian Council for Educational Research, the International Association for the Evaluation of Educational Achieve-ment, and Statistics Canada.
Book design, editing, and production were coordinated by Janice Tuten and Paola Scalabrin of the World Bank’s Offi ce of the Publisher; printing was coordinated by Nora Ridolfi .
The Australian Council for Educational Research, the Bank Nether-lands Partnership Program, the Educational Research Centre in Dublin, the Irish Educational Trust Fund, Statistics Canada, and the Russia Education Aid for Development (READ) Trust Fund have generously supported preparation and publication of the series.

DM data managerIAEA International Association for Educational AssessmentID identifi erIEA International Association for the Evaluation of
Educational AchievementISCED International Standard Classifi cation of EducationJK jackknifeMOS measure of sizeNAMA National Assessment of Mathematics AchievementNC national coordinatorNSC national steering committeePASW Predictive Analytic SoftwarePPS probability proportional to sizePSU primary sampling unitSAS Statistical Analysis SoftwareSPSS Statistical Package for Social SciencesSRS simple random samplingSUDAAN Survey Data AnalysisSYS systematic random samplingTIMSS Trends in International Mathematics and Science Study
ABBREVIATIONS
xxi


1
INTRODUCTION
The importance of obtaining evidence about the quality of education, not just of provision but also of student learning, has been a major theme of education policy throughout the world since the 1990s. For a considerable time, impressionistic evidence has suggested that many children derive little benefi t from their experience of schooling, in particular if that experience is limited to only a few years in the edu-cation system. However, governments now recognize the need for more objective and systematic information on how successful schools are in transforming resources into student learning. Such information is required (a) to obtain an adequate picture of national levels of learn-ing achievement, especially in key curriculum areas; (b) to compare the achievement levels of subpopulations (for example, boys and girls, language or ethnic groups, urban and rural students), which can have important implications in judging the equity of the system; (c) to monitor change in achievement over time; and (d) to guide policy and management decisions regarding the provision of resources.
The procedure used to assess student learning at the system level is called a national assessment; its administration is a complex activity requiring a variety of skills and facilities. The centerpiece of the assess-ment is the collection of data in schools, primarily through responses to assessment instruments and questionnaires from students in groups.

2 | IMPLEMENTING A NATIONAL ASSESSMENT OF EDUCATIONAL ACHIEVEMENT
However, activities begin well before data collection and extend well after it. An institution with responsibility for collecting data has to be appointed, decisions have to be made about the policy and research issues to be addressed, and tests and questionnaires have to be de-signed and tried out. In preparation for the actual testing, populations and samples of schools and students have to be identifi ed, schools have to be contacted, and test administrators need to be selected and trained. Following test administration, much time and effort will be required to prepare data for analysis, to carry out analyses, to write reports, and to disseminate the fi ndings of the assessment.
Although many education systems since 1990 have committed themselves to carrying out a national assessment, few had the wide range of technical skills required to undertake the many tasks in-volved. As a result, many assessments have been of poor quality. This series of publications, National Assessments of Educational Achieve-ment, of which this is the third volume, was planned to address the issue of improving the quality of national assessments. The focus of the series is on state-of-the-art procedures that need to be followed in implementing the components of an assessment to ensure that the data they provide on student learning are of high quality and address the concerns of policy makers, decision makers, and other stakehold-ers in the education system.
Volume 1, Assessing National Achievement Levels in Education (Greaney and Kellaghan 2008), describes key national assessment concepts and procedures and is intended primarily for policy and de-cision makers in education. Issues addressed are the purposes and main features of a national assessment, the reasons for carrying out an assessment, and the main decisions that have to be made in the design and planning of an assessment. International assessments of student achievement, which share many procedural features with national as-sessments (such as sampling, administration, and methods of analy-sis), are also described.
Volumes 2, 3, and 4 provide step-by-step details on the design and implementation of a national assessment and the analysis of data col-lected in the assessment. They are intended primarily for the teams in developing countries responsible for carrying out an assessment. Volume 2, Developing Tests and Questionnaires for a National Assess-

INTRODUCTION | 3
ment of Educational Achievement (Anderson and Morgan 2008), de-scribes the development of achievement tests, questionnaires, and administration manuals. The book has an accompanying CD that con-tains achievement and questionnaire items released from national and international assessments and a test administration manual.
Volume 4, Analyzing Data from a National Assessment of Educa-tional Achievement (Cartwright and Shiel forthcoming), has two parts. The fi rst is designed to help analysts carry out basic analyses of the data collected in a national assessment. The second half of the book deals with the generation of item-level data using classical test theory and item-response modeling. A CD is provided that allows users to apply statistical procedures to data sets and to check their mastery levels against solutions depicted on screenshots in the text.
Volume 5, Using the Results of a National Assessment of Educational Achievement (Kellaghan, Greaney, and Murray 2009), the fi nal book in the series, provides guidelines to describe the fi ndings of a national assessment in technical reports, press releases, briefi ngs for policy makers, and reports for teachers and specialist groups. It also consid-ers how national assessment fi ndings can be used to guide policy and educational management, to infl uence curriculum and classroom practice, and to raise public awareness of educational issues. Its con-tents should be of particular relevance to (a) those who have respon-sibility for preparing assessment reports and for communicating and disseminating fi ndings and (b) users of fi ndings (policy makers, educa-tion managers, and school personnel).
This volume, Implementing a National Assessment of Educational Achievement, like volumes 2 and 4, focuses on the practical tasks in-volved in running a large-scale national assessment program. It has four parts. Part I (“The Logistics of a National Assessment”) provides an overview of the tasks involved: how the essential activities of an assessment are organized and implemented, what personnel and re-sources are required, and what tasks follow the collection of data.
Part II (“School Sampling Methodology”) presents a methodology for selecting a sample of students that will be representative of stu-dents in the education system. Principles underlying sampling are de-scribed, as well as step-by-step procedures that can be implemented in nearly any national assessment. Readers should be able to follow
4 | IMPLEMENTING A NATIONAL ASSESSMENT OF EDUCATIONAL ACHIEVEMENT
the sampling procedures by working through a realistic set of training materials and checking their progress by referring to screenshots and data fi les with solutions.
An accompanying CD contains supporting data fi les. To reproduce the various steps in the demonstration assessment, the user will require SPSS (Statistical Package for the Social Sciences),1 including the Com-plex Samples add-on module, and Westat’s WesVar. SPSS is also used for some analysis sections in volume 4 of this series. The software Wes-Var and its user’s guide may be downloaded from Westat’s web site.2
A description of how the population of interest is defi ned is fol-lowed by the steps involved in creating a sampling frame. The case of a fi ctitious small country (Sentz), data from which will be used for the various exercises, is introduced. This part of the volume concludes with a description of basic concepts and methods of probability sampling.
Part III (“Data Preparation, Validation, and Management”) de-scribes procedures for cleaning and managing data collected in a na-tional assessment. These procedures are essential elements of a qual-ity assurance process. It also describes how to export and import data (that is, make data available in a format that is appropriate for users of statistical software such as Microsoft Access, SPSS, WesVar, and Microsoft Excel). The primary objective of this section is to enable the national assessment team to develop and implement a systematic set of procedures to help ensure that the assessment data are accurate and reliable.
Following sampling, test administration, and data entry and clean-ing, the next step is to prepare data for analysis. Part IV (“Weighting, Estimation, and Sampling Error”) describes a series of important pre-analysis steps, including producing estimates, computing and using survey weights, and computing estimates. The exercises build on the earlier work carried out on the Sentz data set (in part II). The section dealing with the computation of estimates describes how they and their sampling errors are computed from simple and complex sam-ples, such as those prepared for Sentz. Finally, a range of special top-ics, including nonresponse and issues relating to oversize and under-size schools, is addressed.
The procedures described in this volume (and in volumes 2 and 4) are designed to ensure the quality of a national assessment. The im-

INTRODUCTION | 5
portance of adopting appropriate procedures is reiterated throughout part I when it addresses the various components of an assessment:
• Recruiting a competent team to carry out the assessment• Deciding on the staffi ng, facilities, and equipment required to carry
out a large-scale survey• Monitoring the quality of items produced by item writers• Training and monitoring the performance of the individuals who
collect data in schools• Monitoring the accuracy of scoring and data recording• Ensuring that statistical analyses of data collected in the assessment
are appropriate and address issues of concern to policy makers, edu-cation managers, and other stakeholders
The quality of some components of a national assessment is often taken for granted, presumably on the assumption that personnel re-sponsible for the components have the required expertise. However, that assumption may not always be warranted. For example, although one might assume that individuals with experience in the develop-ment of public examinations would have the skills required for a na-tional assessment, very different approaches are required in develop-ing tests for selection of students and developing tests to describe the achievement levels of the education system. Whatever the back-ground, knowledge, or skills of personnel who carry out a national assessment, a need exists for studies or reviews, carried out perhaps by an external consultant, to assess the quality of some of the compo-nents of the assessment (for example, the tests used to assess students’ achievement or the appropriateness of the sampling procedures that were used).
Quality assurance requires a planned and systematic set of actions to provide evidence that a national assessment has been implemented to a high professional standard. In chapter 5 of volume 1 of this series, Assessing National Achievement Levels in Education, a number of issues are identifi ed that are relevant to the confi dence that stakeholders can have in the results of an assessment. Activities for fi ve components of a national assessment (design, implementation, data analysis, report writing, and dissemination and use of fi ndings) are identifi ed, and sug-gestions are made of activities that should serve to enhance confi -
6 | IMPLEMENTING A NATIONAL ASSESSMENT OF EDUCATIONAL ACHIEVEMENT
dence. Common errors in national assessments for each component are also identifi ed. The issues could be used to form a checklist that a national assessment team could use to assess the quality of its work.
Specifi c quality assurance measures are usually built into several components of a national assessment: test development, administra-tion of tests in schools, the scoring of test items, data entry, and data cleaning. Measures for training test developers and scorers and for checking the quality of scoring are described in volume 2 of this se-ries, Developing Tests and Questionnaires for a National Assessment of Educational Achievement. Issues relating to the quality assurance of test administration in schools, which requires particular scrutiny be-cause it is an area in which departure from standards can easily occur, are addressed in chapter 4 of this volume. Procedures to address is-sues of quality in data recording, data cleaning, and data management are described in part III (chapters 9 to 13).
Although standards exist for conducting a national assessment, those responsible for implementation will at varying times need to exercise judgment (for example, in sampling and analysis). They may, on occasion, also require the advice of more experienced practitioners in making their judgments. And they should always be prepared to adapt their practice in light of developments in knowledge and tech-nology that will inevitably occur in the coming years.
NOTES
1. In 2009–10, the premier software for SPSS was called Predictive Analytic Software (PASW).
2. The Web site is http://www.westat.com/westat/statistical_software/WesVar/index.cfm.

7
THE LOGISTICS
OF A NATIONAL
ASSESSMENT
Sarah J. Howie and Sylvia Acana
IPART
Part I provides an overview of the tasks involved in implementing a national assessment. It describes the important role a national steer-ing or advisory committee, with representatives of the major stake-holders in the education system, can play in the design, planning, and implementation of an assessment and in the communication of its fi ndings. The personnel and the facilities that are required to carry out an assessment are identifi ed, and activities involved in preparation for an assessment, in its administration in schools, and following ad-ministration are outlined. Choices will be required at varying points in the assessment, depending on local circumstances, but the proce-dures adopted always have to meet basic standards. Otherwise, the quality of the assessment and, hence, the value of its fi ndings, will be compromised.
Many of the topics dealt with in part I are considered in greater detail in later parts of this volume, as well as in other volumes in the series.


PREPARING
FOR THE
NATIONAL
ASSESSMENT:
DESIGN AND
PLANNING
1CHAPTER
9
This chapter describes the main issues to be con-sidered in designing a national assessment. It outlines the value of establishing a committee to oversee design and implementation, and then identifi es important planning issues, concluding with a descrip-tion of budgetary issues.
NATIONAL STEERING COMMITTEE
In many, but not all, national assessments, the ministry of education appoints a national steering committee (NSC) or advisory committee to oversee design and implementation of the assessment. Such a com-mittee has several advantages. First, the committee can help ensure that the assessment has status and will have credibility in the eyes of government agencies, teacher education institutions, organizations that represent teachers, and other key stakeholders in the broader community. Second, it can contribute to the identifi cation of key pol-icy questions to be addressed in the assessment. Third, it can act as a channel of communication between key educational stakeholders, an important consideration in both designing an assessment and increas-ing the likelihood that its results will play a role in policy formation

10 | IMPLEMENTING A NATIONAL ASSESSMENT OF EDUCATIONAL ACHIEVEMENT
and decision making. Fourth, an NSC can help resolve administrative and fi nancial problems that might arise during implementation of the assessment. Finally, the committee can have an important role in dealing with possible negative reactions to the assessment from poli-ticians, who may fear that publication of the fi ndings will give rise to political debate that refl ects on their stewardship, or from teacher representatives, who may perceive the assessment as a new form of accountability.
Composition of an NSC will vary from one education system to another, depending on the organization and power structure of the system. One would expect to see on the committee representatives of the ministry of education (especially policy analysts and curriculum bodies); of the agency implementing the assessment; of teachers, teacher educators, and parents; and of major ethnic, religious, and linguistic groups (see volume 1, Assessing National Achievement Levels in Education).
The size of the committee should refl ect the need for a balance between the minimum number of stakeholders that should be repre-sented and the costs and logistical efforts necessary to organize com-mittee meetings. The latter is especially relevant in a country where committee members have to travel long distances and stay overnight to attend meetings. As noted in volume 1, the NSC should have a limited number of meetings. The need for meetings is likely to be greatest at the initial and fi nal stages of the assessment.
DESIGN OF A NATIONAL ASSESSMENT
The team appointed to carry out an assessment should, from the outset, work closely with the NSC, if one has been established. The national assessment team and the NSC, together with the funding agency (usu-ally the ministry of education), should reach agreement on the objec-tives, general design, and scope of the assessment, taking into account available resources, including personnel and budget. The actual drafting of the design might be entrusted to the NSC or to the national assess-ment team. The design should encompass the following decisions:
PREPARING FOR THE NATIONAL ASSESSMENT: DESIGN AND PLANNING | 11
• Indicate the policy questions to be addressed.• Specify the target population to be assessed.• Indicate whether the assessment is to be based on a sample or on the
entire target population (census).• Identify the curriculum areas or constructs to be assessed.• Describe the data collection instruments (tests and questionnaires)
as well as the methods to be used to collect the data.• Assign responsibility for developing tests and questionnaires.• Specify the specifi c questions to be addressed in analyses.• Assign responsibility for preparing fi nal reports and other documents
(for example, reports for policy makers), and decide on the number of copies of each report.
• Specify dissemination activities to ensure that the education system learns about—and benefi ts from—the results of the assessment.
One issue that should be taken into account in the design of a study is whether to monitor change over time by repeating an assessment at a future date. Also, it is important to consider whether the assessment will be carried out at more than one grade level to provide informa-tion on achievement at different levels of the education system. Ac-count should also be taken of the budget that has been allocated and support services that can be provided at no additional cost.
PLANNING
A detailed plan for implementing the national assessment should build on and refl ect the overall design. A project plan is a document that outlines the activities, tasks, duration, time frames, and people involved. The plan should do the following:
• Specify the scope of the national assessment.• Identify major activities and tasks.• Allocate resources for each activity in terms of the individuals
responsible.• Develop a schedule with start and completion dates for each
activity.

12 | IMPLEMENTING A NATIONAL ASSESSMENT OF EDUCATIONAL ACHIEVEMENT
The plan should serve as a reference for the entire project and as a basis for monitoring its progress. The NSC, for example, may use the plan to check discrepancies between achieved and planned deadlines, which would assist in managing the assessment.
Table 1.1 presents an example of a section of the project plan de-veloped for South Africa. The overall plan, which covered many more activities than are presented here, applied to a period extending from early 2004 to December 2006.
The plan for the national assessment should take into account the timing of the release of funds. Recruiting personnel and procuring services and equipment are unwise until funds for recurrent and capi-tal costs are guaranteed.
Many national assessment plans have unrealistic time estimates. In developing countries, in particular, a wide range of problems should be anticipated relating to delays in hiring personnel; fi nding qualifi ed experts; obtaining up-to-date, accurate data on schools and student numbers; training local staff members on specifi c tasks (for example, item writing, sampling, statistical analysis); piloting and developing fi nal versions of achievement tests; getting permission to administer tests and questionnaires; printing materials; and cleaning data. Time estimates that are based on international studies of achievement or studies in industrial countries are likely to be inappropriate, because such studies do not normally encounter problems such as inadequa-cies in communication and transport systems, interruptions in the supply of electricity, and work practices and constraints that limit the amount of time individuals can devote to national assessment tasks.
BUDGETING
Having a realistic budget and obtaining suffi cient funding for large-scale assessments are fundamental. Several national assessment efforts have failed because of gross underbudgeting. Because no established formula exists for estimating the cost of a national assessment, the national assessment team might start with a crude budget based on the various phases of the project and then begin to refi ne it. The design of the assessment should refl ect the available budget. Alternatively,

PREPARING FOR THE NATIONAL ASSESSMENT: DESIGN AND PLANNING | 13
TABLE 1.1
Excerpt from a National Assessment Project Plan
Main activity and subactivities Duration
Hours of work needed Start date
Finish date Person
Plan and convene NSC meeting.
1 month 40 05/01/04 05/02/04
Identify and contact participants.
Determine suitable date for meeting.
Organize transportation, venue, accommodation, meeting, and refreshments.
Send out invitations.
Specify an assessment framework.
1 month 120 05/01/04 05/02/04
Select sample of schools. 2 months 160 05/02/04 05/04/04
Specify target population.
Contact Department of Education for school data.
Prepare school and within-school sampling procedures.
Draw sample.
Finalize sample.
Develop instruments. 4 months 640 20/02/04 30/06/04
Develop, edit, and fi nalize items and scoring guides.
Identify item writers.
Appoint item writers.
Train item writers.
Draft test items, sample items, and administration manual.
Review test items.
Pilot test items.
(continued)

14 | IMPLEMENTING A NATIONAL ASSESSMENT OF EDUCATIONAL ACHIEVEMENT
given a predetermined budget, adaptations can be made to an initial design. If possible, assessment experts and fi nancial decision makers should be involved in budgetary discussions.
In developing a budget, all major activities in the assessment design should be listed, and timelines and costs should be allocated to each item (activity and subactivity or task) (see Greaney and Kellaghan 2008; Ilon 1996). This process may take several days to complete. Conditions and costs will vary widely from country to country. Na-tional pay rates for specifi c task types are normally taken into consid-eration. In some instances, adjustments may have to be made to refl ect skill shortages in key professional areas (such as statistical analysis). Budgetary provision should be made for likely salary increases over the life of the assessment (normally two to three years), for infl ation, and for unexpected events (contingencies).
Funding Checklist
The checklist presented in table 1.2 lists the major expense items normally associated with a national assessment. Because circumstances will vary from country to country, some items may not be relevant in
Main activity and subactivities Duration
Hours of work needed Start date
Finish date Person
Develop scoring guides.
Score test items.
After formal review, select fi nal set of test items and sample items.
Complete artwork and test layout.
Estimate time allowed for each test.
Prepare administration manual and scoring guides.
Source: Adapted from Howie 2004.
TABLE 1.1
Excerpt from a National Assessment Project Plan (continued)
PREPARING FOR THE NATIONAL ASSESSMENT: DESIGN AND PLANNING | 15
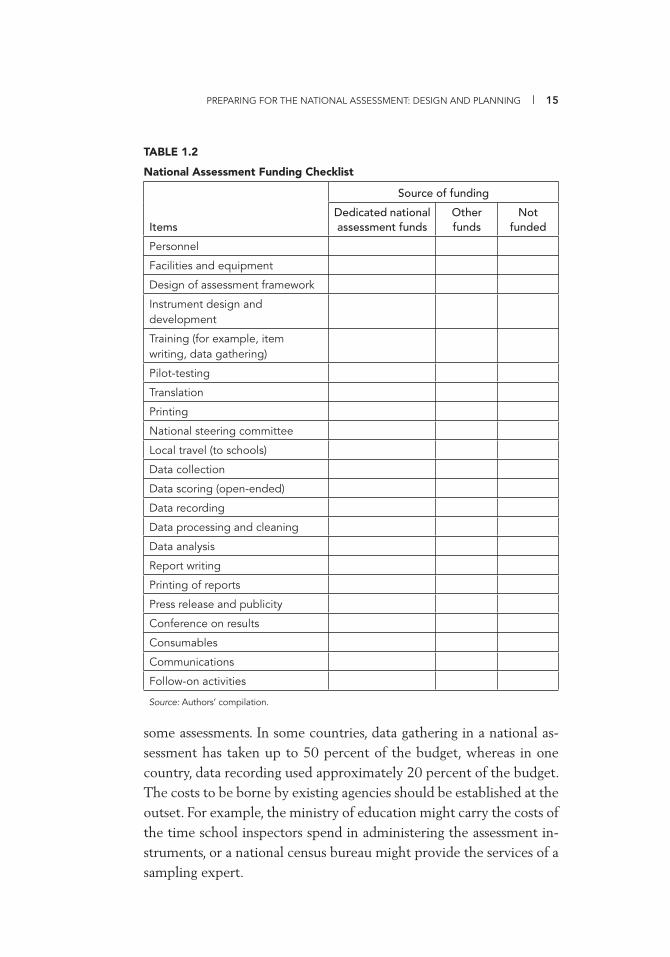
TABLE 1.2
National Assessment Funding Checklist
Items
Source of funding
Dedicated national assessment funds
Otherfunds
Notfunded
Personnel
Facilities and equipment
Design of assessment framework
Instrument design and development
Training (for example, item writing, data gathering)
Pilot-testing
Translation
Printing
National steering committee
Local travel (to schools)
Data collection
Data scoring (open-ended)
Data recording
Data processing and cleaning
Data analysis
Report writing
Printing of reports
Press release and publicity
Conference on results
Consumables
Communications
Follow-on activities
Source: Authors’ compilation.
some assessments. In some countries, data gathering in a national as-sessment has taken up to 50 percent of the budget, whereas in one country, data recording used approximately 20 percent of the budget. The costs to be borne by existing agencies should be established at the outset. For example, the ministry of education might carry the costs of the time school inspectors spend in administering the assessment in-struments, or a national census bureau might provide the services of a sampling expert.


PERSONNEL
AND FACILITIES
REQUIRED IN
A NATIONAL
ASSESSMENT
2CHAPTER
17
If one accepts that the reason for carrying out a national assessment is to provide valid information about the achieve-ments of students in the education system, then decisions regarding the personnel who will carry out the assessment and the facilities they will need are crucial. All sorts of problems can be anticipated if personnel are not competent or if facilities are inadequate. For ex-ample, the test used may not provide valid and reliable information about student achievement in the curriculum area or construct being assessed; the sample that is selected may not adequately represent the target population; the students that take the tests may not be the ones who were selected; test administrators may not follow precisely di-rections for test administration; data collected in schools may not be correctly entered in the database; the statistical analysis of data may not be appropriate; unwarranted conclusions (for example, regarding causation) may be drawn; and reports may provide inadequate infor-mation on technical aspects of the study, content of achievement tests, methods used, or error and bias in estimates. This chapter de-scribes the staffi ng and the basic facilities and equipment required in a national assessment to help prevent these problems, thus contribut-ing to the quality of the exercise. Planning for quality control needs to start with project planning.

18 | IMPLEMENTING A NATIONAL ASSESSMENT OF EDUCATIONAL ACHIEVEMENT
STAFF REQUIREMENTS
As a general principle, not only should personnel have specialist skills; they should also be committed and open-minded, attentive to detail, and willing to put in additional hours beyond the normal workday. From the point of view of technical adequacy and effi ciency, these attributes are more important than seniority within a government department or within an academic institution.
The level of funding provided for the national assessment will de-termine to a considerable extent the number and skill levels of key staff members. The design or planning proposal can help clarify the roles and functions of staff members. Thus, identifi cation of the target population (for example, grade level) and of the curriculum areas or constructs to be assessed will indicate the knowledge and skills that will be required of item writers, whereas a decision to base the assess-ment on a sample rather than on the whole population will point to the need for a person skilled in probability sampling. Some staff mem-bers (for example, item writers, test administrators, or data entry per-sonnel) will be employed on a temporary basis at various stages. This section describes the role of key or core staff members (for example, the national coordinator) as well as the roles of additional personnel, such as test administrators, who will be required to carry out the assessment.
National Coordinator
The national coordinator (NC)1 should give general direction and provide leadership throughout the planning and implementation stages of the national assessment. The NC should help ensure that the assessment
• Addresses the key policy questions requested by the ministry• Is technically adequate• Is carried out on time and within budget
The NC should be respected within the educational community and should have access to key educational stakeholders and to the main

PERSONNEL AND FACILITIES REQUIRED IN A NATIONAL ASSESSMENT | 19
sources of funding. He or she should be able to see the “big picture.” NCs have been recruited from public examination boards, national ministries of education, universities, and research institutions. NCs should be familiar with key concepts in educational measurement and with the curriculum or construct being assessed. They should have extensive experience in test development as well as in project management and in management of large groups of people. They should have strong leadership and good communication skills. Some of the key responsibilities of the NC might include
• Liaising with national organizations and bodies concerned with edu-cation and reporting to a national steering committee
• Managing the personnel and budget at each phase of the assessment
• Providing training and leadership for item writers• Reviewing tests, questionnaires, and related materials to ensure that
contents are appropriate and free of bias (for example, relating to males and females, urban and rural students, or ethnic group membership)
• Providing advice on the interpretation of test results• Coordinating and ensuring the quality of publications that follow
the national assessment• Managing public relations, including the conduct of awareness and
sensitization seminars during and after the national assessment
Assistant National Coordinator
An assistant national coordinator may be required depending on the structure of the education system, the scope of the assessment, the time demands on the NC, and the availability of funding. The assis-tant NC should have many of the attributes required of the NC and should support and serve as a substitute for the NC when necessary. He or she might be assigned primary responsibility for particular as-pects of the assessment, such as test development or data manage-ment, or might focus on operational and logistical issues. Detailed knowledge of the overall national assessment implementation plan is essential.
20 | IMPLEMENTING A NATIONAL ASSESSMENT OF EDUCATIONAL ACHIEVEMENT
Regional Coordinators
In large countries with regional administrative systems, the national assessment team should consider appointing regional coordinators to organize testing and to liaise with schools and test administrators. Such coordinators would be responsible for allocating and delivering materials to the test administrators and should check the contents of boxes coming from the central offi ce. They would also be responsible for materials returned from schools following test and questionnaire administration. Under this arrangement, the coordinator’s offi ce would become the regional offi ce and the storage facility for assessment instruments.
Item Writers
Experience suggests that practicing teachers with a good command of the curriculum make effective item writers. It is a good idea to ensure that teachers are drawn from different types of schools, including ru-ral and remote schools. Academics, public examination offi cials, and school inspectors have been used to draft pilot items for some na-tional assessments. The experience has not always been positive, how-ever, because these individuals often lack contact with classroom re-alities and may have unrealistically high expectations of student achievement standards.
Item writers should be trained in how to analyze the curriculum, develop learning objectives, identify the common misconceptions and errors of students, write items that provide diagnostic information, and judge the quality of pilot-test items in terms of both content and statis-tical properties. They are normally recruited on a part-time basis. After a trial period, the test development coordinator may have to dispense with the services of some individuals who fail to produce good items or who are careless in terms of attention to detail or in fi ling.
Statistician
A statistician is responsible for the technical adequacy of statistical analyses. He or she is likely to be involved in designing an assessment,

PERSONNEL AND FACILITIES REQUIRED IN A NATIONAL ASSESSMENT | 21
in developing a national sampling frame, and in drawing the represen-tative sample used in the national assessment. He or she also helps interpret pilot and fi nal test results, may be involved in database con-struction, and guides or carries out analyses of the results of the as-sessment. Volume 4 in this series, Analyzing Data from a National Assessment of Educational Achievement, describes many of the statisti-cal tasks involved in an assessment. The statistician should be compe-tent in the use of SPSS (Statistical Package for the Social Sciences), WesVar, Excel, and Access.
The services of a statistician may not be required on a full-time basis. The statistical workload is likely to be heavy at the initial stage, when the focus is on the design and, in particular, on the sampling and piloting of instruments, and again after data have been collected and cleaned.
Sources of competent statisticians include universities and some government departments. The national census bureau can be a par-ticularly good source. In some instances, recruiting the services of an external, nonnational statistician may be necessary to assist in sam-pling, analysis, and interpretation of results. If an external statistician is recruited, he or she should be expected to help develop technical capacity within the national assessment team.
Data Manager
Ultimately, the data manager (DM) bears a good deal of responsibility for the quality of the data used in analyses. In particular, he or she is responsible for the accuracy of data—specifi cally for the correct cod-ing, cleaning, and recording of test and questionnaire data. He or she will have a working knowledge of Microsoft Word, Excel, and Access as well as SPSS and WesVar. Ideally, he or she should also have exten-sive data management experience, should be appointed at the begin-ning of the assessment, and should be involved in sampling and in designing and coding instruments.
With the agreement of the NC, and together with the survey stat-istician working on the sampling frame and design, the DM prepares the numbering scheme and procedures that will be used during the assessment. This scheme should apply to schools, classes, and students.

22 | IMPLEMENTING A NATIONAL ASSESSMENT OF EDUCATIONAL ACHIEVEMENT
The numbering scheme is a key component of quality control. It is required for sampling activities and must be implemented, at the lat-est, at the time of sample selection. The DM should ensure that indi-vidual student booklets, questionnaires, and answer sheets (if used) can be identifi ed by numbering them before sending out materials for administration. Prior numbering is critical for monitoring student participation rates and for checking on the security of the materials.
School identifi er numbers from the education management infor-mation system may be used to identify schools selected for an assess-ment. An alternative is to catalog schools by using a numbering sys-tem that identifi es the province or region, school, and individual pupil. Box 2.1 gives examples of two such numbering systems. The fi rst identifi es individual schools; the second identifi es not just indi-vidual schools but also participating students within schools.
A computer programmer, or someone with suffi cient knowledge of and experience with setting up and managing databases, will be re-quired at critical points during the assessment. In some instances, the same person may be called on to play various roles: programmer and data manager, or data manager and statistician, depending on the ex-pertise available locally. Part III deals with data cleaning and manage-ment, key skills required of a DM.
Numbering Systems Used in National Assessments
The following are examples of numbering systems used in national assessments:
1. A four-digit fi gure is used. The fi rst digit represents the region, the second the zone, the third the district, and the last the school. Number 5342 refers to school number 2, which is located in district 4, in zone 3, in region 5.
2. Six digits are used. The fi rst digit indicates the province, the next three digits indicate the school number, and the last two digits are the pupil’s identifi cation code. For example, pupil number 200537 refers to a student located in province 2, in the fi fth school on the list, and he or she is the 37th pupil on the class list.
Source: Authors’ compilation.
BOX 2.1
PERSONNEL AND FACILITIES REQUIRED IN A NATIONAL ASSESSMENT | 23
Designer or Graphics Person
A designer or graphics person has responsibility for giving a profes-sional appearance to all tests, questionnaires, manuals, and reports as-sociated with the national assessment. He or she should provide the pictorial representations linked to test items as well as charts and graphs and other visuals used in reports. Sources of experienced per-sonnel include publishing fi rms and printing houses. A designer or graphics person should be available when needed and should be given suffi cient notice of likely time demands. The CD that accompanies volume 2, Developing Tests and Questionnaires for a National Assess-ment of Educational Achievement, contains examples of well-presented test items with supportive pictorial and graphical material.
Translators
Many countries have large populations of students who do not share a common language, in which case instruments may need to be trans-lated. Clearly, translators should have a high level of competence in the languages involved in the translation and should be familiar with the content of the material they are translating. A minimum of two translators per language is advisable. Both may translate the same test simultaneously, compare results, and where inconsistencies arise, reach agreement through discussion. This process is termed simulta-neous translation. An alternative is to have one person translate from the fi rst language into the second and then give the translated test to the other translator who then translates from the second language back into the fi rst. Versions are compared, and again through a pro-cess of discussion, discrepancies are resolved. This process is termed back translation. Despite the best efforts of translators, for a variety of reasons, including differences between languages in their structure, achieving precise equivalence between a test and its translated ver-sion may prove very diffi cult or even impossible.
Pilot tests provide a good opportunity for removing linguistically diffi cult terms or words. In Ghana, for example, pupils were asked to translate some words (from English) into local languages during a pilot test to identify commonly misunderstood words. In a somewhat

24 | IMPLEMENTING A NATIONAL ASSESSMENT OF EDUCATIONAL ACHIEVEMENT
similar fashion, South African children underlined words they did not understand during the pilot-testing phase; this information helped modify items for the main study. The services of translators are nor-mally required only during the preparation of the pilot and fi nal ver-sions of tests and questionnaires and when reports are being prepared for publication.
School Liaison Person
The school liaison person or school coordinator could be a teacher or guidance counselor in a school, but he or she should not be teaching students selected for the assessment. Frequently, the school principal serves in this role. The school liaison person serves as a contact point in schools for the national assessment team and helps ensure that school personnel are aware of the assessment. He or she arranges the test venue, sets testing times and dates with pupils and their teachers, and meets the assessment team on the day of testing. The school liaison person should coordinate the completion of student tracking forms and distribute teacher and school questionnaires. He or she is responsible for ensuring that all testing materials are received and kept secure and are returned to the national or regional center following test administra-tion. He or she should also strive to ensure that the classroom used for the assessment is suffi ciently large to accommodate all students selected to take the tests, allowing adequate space between them to prevent communication with others and copying. The school liaison person es-sentially supports the assessment team by making all the arrangements necessary to ensure the orderly conduct of the assessment in a school.
Data Recorders
Some national assessment teams use professional data entry person-nel to record or capture data from tests and questionnaires. Individu-als selected to perform this task should have experience and a record of speed and precision in entering data. Careless data recording can undermine the quality of the assessment. An alternative to in-house data recording is contracting the work to an external agency. In this case, one or more members of the assessment team should routinely check the quality of the work. Whether data recording is conducted

PERSONNEL AND FACILITIES REQUIRED IN A NATIONAL ASSESSMENT | 25
in house or is outsourced, quality control is essential. Electronic scan-ners are increasingly being used to record test and questionnaire data, which are then fi led for data cleaning and analysis. In some countries, however, access to scanners or to necessary backup maintenance services is not available.
Test Administrators
In some countries, classroom teachers administer national assessment tests to their own students. More often than not, however, teachers other than those who teach the students who are taking the test or individuals who are external to the school are entrusted with this task. Local work practices, levels of fi nancial reward, and availability of personnel play important roles in selecting test administrators. Test administration personnel have included teachers (including retired teachers), school inspectors, teacher trainers, public examination offi cials, and university students (especially students in education and psychology programs). In some countries, data collection is contracted to a body that specializes in that activity. Potential administrators should have the following characteristics:
• Good organizational and communication skills• Experience working in schools• Reliability, and ability and willingness to follow instructions
precisely
Some possible advantages and disadvantages of using personnel from different backgrounds are summarized in table 2.1. Providing clear guidelines and intensive training can help address any disadvantages that exist.
Because faulty test administration tends to be the most common source of error in a national assessment, particular attention should be paid to selecting, training, and supervising test and questionnaire administrators. Above all, persons assigned this position should be trustworthy, responsible, and committed.
Test administrators should
• Ensure that teachers and other staff members are not present in the room when tests are being administered.
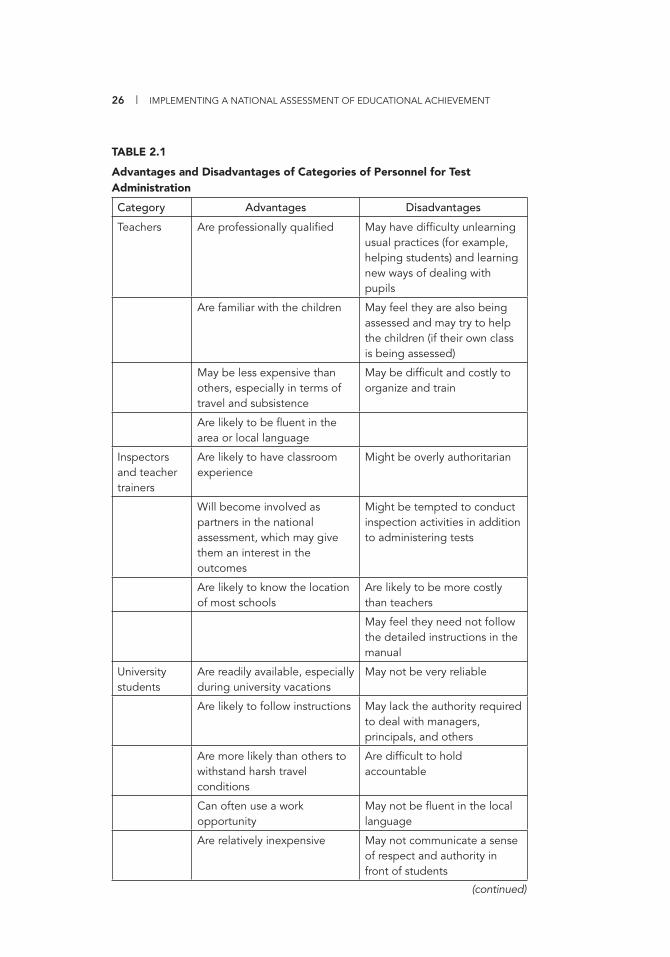
26 | IMPLEMENTING A NATIONAL ASSESSMENT OF EDUCATIONAL ACHIEVEMENT
TABLE 2.1
Advantages and Disadvantages of Categories of Personnel for Test Administration
Category Advantages Disadvantages
Teachers Are professionally qualifi ed May have diffi culty unlearning usual practices (for example, helping students) and learning new ways of dealing with pupils
Are familiar with the children May feel they are also being assessed and may try to help the children (if their own class is being assessed)
May be less expensive than others, especially in terms of travel and subsistence
May be diffi cult and costly to organize and train
Are likely to be fl uent in the area or local language
Inspectors and teacher trainers
Are likely to have classroom experience
Might be overly authoritarian
Will become involved as partners in the national assessment, which may give them an interest in the outcomes
Might be tempted to conduct inspection activities in addition to administering tests
Are likely to know the location of most schools
Are likely to be more costly than teachers
May feel they need not follow the detailed instructions in the manual
University students
Are readily available, especially during university vacations
May not be very reliable
Are likely to follow instructions May lack the authority required to deal with managers, principals, and others
Are more likely than others to withstand harsh travel conditions
Are diffi cult to hold accountable
Can often use a work opportunity
May not be fl uent in the local language
Are relatively inexpensive May not communicate a sense of respect and authority in front of students
(continued)
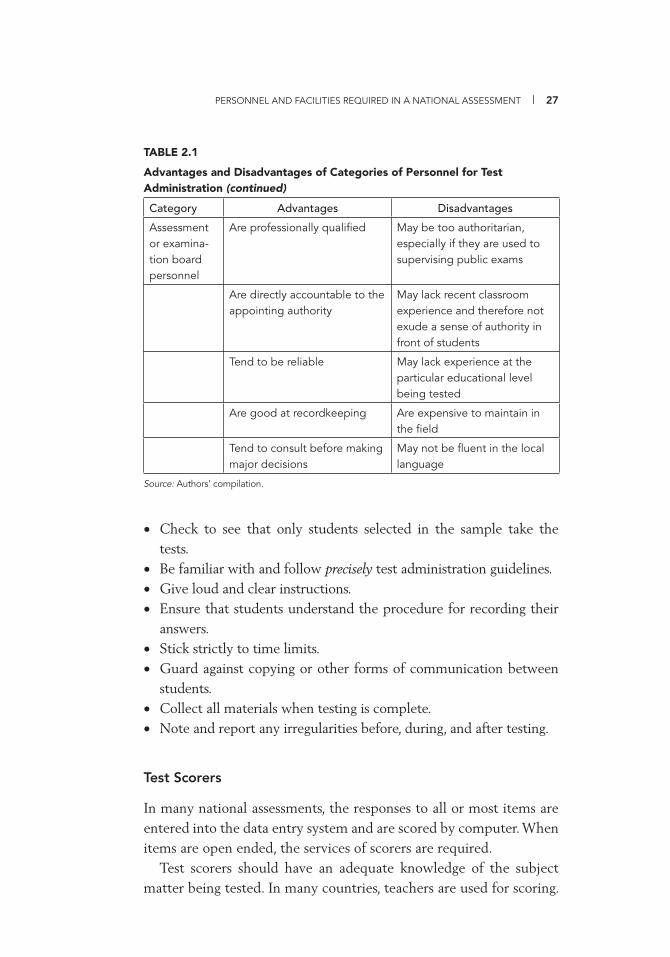
PERSONNEL AND FACILITIES REQUIRED IN A NATIONAL ASSESSMENT | 27
• Check to see that only students selected in the sample take the tests.
• Be familiar with and follow precisely test administration guidelines.• Give loud and clear instructions.• Ensure that students understand the procedure for recording their
answers.• Stick strictly to time limits.• Guard against copying or other forms of communication between
students.• Collect all materials when testing is complete.• Note and report any irregularities before, during, and after testing.
Test Scorers
In many national assessments, the responses to all or most items are entered into the data entry system and are scored by computer. When items are open ended, the services of scorers are required.
Test scorers should have an adequate knowledge of the subject matter being tested. In many countries, teachers are used for scoring.
Category Advantages Disadvantages
Assessment or examina-tion board personnel
Are professionally qualifi ed May be too authoritarian, especially if they are used to supervising public exams
Are directly accountable to the appointing authority
May lack recent classroom experience and therefore not exude a sense of authority in front of students
Tend to be reliable May lack experience at the particular educational level being tested
Are good at recordkeeping Are expensive to maintain in the fi eld
Tend to consult before making major decisions
May not be fl uent in the local language
Source: Authors’ compilation.
TABLE 2.1
Advantages and Disadvantages of Categories of Personnel for Test Administration (continued)
28 | IMPLEMENTING A NATIONAL ASSESSMENT OF EDUCATIONAL ACHIEVEMENT
Recruiting teachers can be diffi cult during school term, however, when they may be available only outside school hours. Some national assessments use examination board personnel. Others engage the ser-vices of ministry of education staff or university students. Irrespective of their backgrounds or status, scorers must be trained specifi cally to score the particular national assessment tests. A member of the core team should monitor the quality of scoring on a daily basis and should dispense with the services of inaccurate scorers.
FACILITIES
Those involved in the administration of a national assessment need space for work and a range of equipment.
Space for Personnel
Core staff members require offi ces that are secure and equipped with computers. Space is needed for books and fi les. Part-time staff mem-bers also require some offi ce space. Because national assessments tend to involve many meetings with subject-matter specialists, item writ-ers, and others, access to a room that is large enough to accommodate group meetings is advisable.
Space for Organizing and Storing Instruments
Adequate provision needs to be made for the space requirements as-sociated with packing tests for distribution to schools. Some national assessments hire a hall or other space in an institution of learning. The space requirements can be substantial (see box 2.2). Unpacking at least one school’s test booklets and other required materials can be useful to obtain an idea of how much space will be needed to provide for all schools in the national assessment.
A large storage facility is required both before and after scoring, data entry, and data cleaning. If possible, a specifi c room should be set aside for data recording. It should provide adequate desktop working
PERSONNEL AND FACILITIES REQUIRED IN A NATIONAL ASSESSMENT | 29
space, including computer space, for each of the data recorders. Ad-ditional space will be needed for storing and organizing booklets that are being processed. Test booklets and questionnaires should be read-ily accessible because some items may have to be checked.
Equipment and Supplies
The amount and nature of equipment and supplies that are needed will vary depending on the size of the national assessment and local conditions. Essential basic equipment includes
• Telephones, desks, chairs, fi ling cabinets, shelving, packing tables, cupboards, and trolleys for transporting instruments
• Normal offi ce supplies (stationery, pads, print cartridges, discs, tapes, punches, scissors, staplers, pens, pencils, packing tape, string, labels, glue, and thick pens)
• Packing paper and boxes or bags • Vehicles for transporting tests and other materials as needed
The available budget will help determine the amount and quality of technical equipment. Some national assessment teams (for example, in ministries of education or in universities) may have access to electronic equipment such as computers, software (such as Microsoft Offi ce and
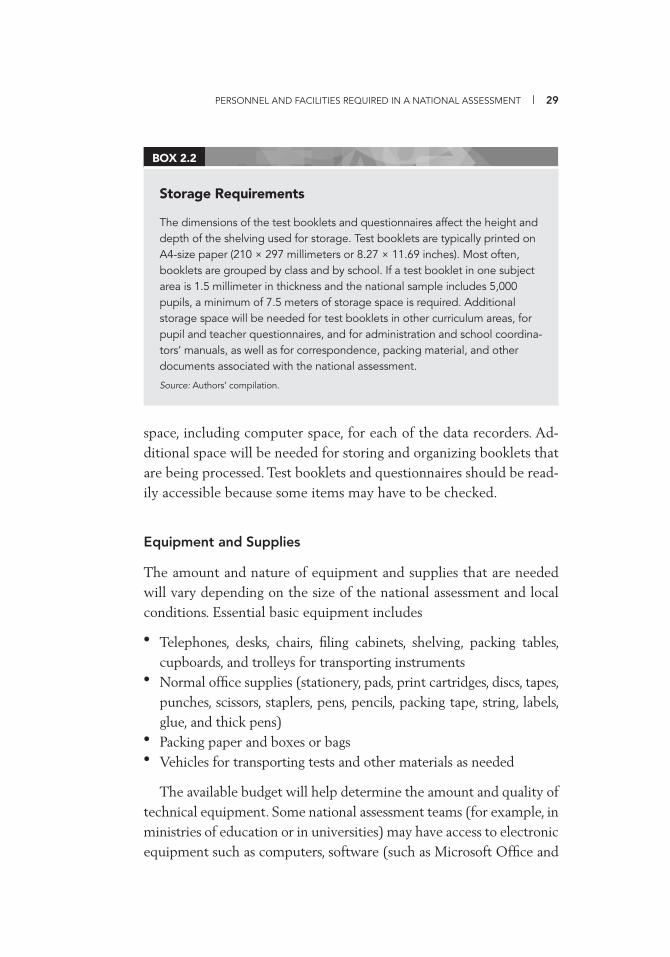
Storage Requirements
The dimensions of the test booklets and questionnaires affect the height and depth of the shelving used for storage. Test booklets are typically printed on A4-size paper (210 × 297 millimeters or 8.27 × 11.69 inches). Most often, booklets are grouped by class and by school. If a test booklet in one subject area is 1.5 millimeter in thickness and the national sample includes 5,000 pupils, a minimum of 7.5 meters of storage space is required. Additional storage space will be needed for test booklets in other curriculum areas, for pupil and teacher questionnaires, and for administration and school coordina-tors’ manuals, as well as for correspondence, packing material, and other documents associated with the national assessment.
Source: Authors’ compilation.
BOX 2.2

30 | IMPLEMENTING A NATIONAL ASSESSMENT OF EDUCATIONAL ACHIEVEMENT
SPSS), printers, photocopiers, scanners, and fax machines. Other teams may have to purchase or rent some equipment. Appropriate software can enhance accuracy and effi ciency, especially in areas such as data recording, entry, cleaning, and analysis, as well as graphic design.
NOTE
1. Other terms may be used in some countries.
PREPARATION FOR
ADMINISTRATION
IN SCHOOLS
3CHAPTER
31
The national coordinator should inform schools that they have been selected for the national assessment as soon as possible after sample selection. Inviting them to participate is a cour-tesy. Experience to date suggests that the vast majority of public schools in developing countries are willing to take part in a national assessment. In some countries, schools have the option of refusing to participate. Most likely private schools (which are not included in many national assessments) would have such an option. In many ju-risdictions, the refusal option is not open to public schools.
In some countries, the permission of parents is required for their children’s participation in an assessment, in which case arrangements must be made to obtain it. Asking parents to respond only if they are refusing permission may be suffi cient. In this case, if parents do not respond, their agreement is assumed.
This chapter describes preparatory steps in the administration of a national assessment. These steps involve contacting schools, organiz-ing instruments, and preparing schools.
CONTACTING SCHOOLS
If required, the permission of the ministry of education or regional education authority should be obtained before schools are contacted.
32 | IMPLEMENTING A NATIONAL ASSESSMENT OF EDUCATIONAL ACHIEVEMENT
When schools are contacted and invited to participate, they should be asked to acknowledge receipt of the invitation. The initial communi-cation should be followed up on a regular basis right up to the day before testing. The school should be asked to appoint a contact person, school liaison person, or coordinator for the assessment. The national assessment team should strive to ensure that it establishes and main-tains a good rapport with local education authorities, if they exist.
Informing Schools
Many schools, especially at primary level, prefer letters, which they can fi le. In Uganda, the national assessment agency sends letters to all selected schools as well as to each district education offi ce. This step is followed by telephone calls (using mainly cell phones) and notes delivered by bodaboda (bicycle and motorcycle riders hired to trans-port people or luggage).
The fi rst communication should inform schools that they have been selected to participate in a national assessment (see box 3.1). It should also include provisional dates for test administration. A re-minder note, which should reach the schools about a month before testing, should give the exact date and more details about the actual assessment exercise. Confi rming the school’s participation two weeks prior to testing, and again the day before the event, is advisable.
The national assessment team should keep an updated list or track-ing form of participating schools to help monitor fi eldwork progress. The form will provide information on schools, such as school name, size, and contact information (see table 3.1).
Replacing Schools
Insofar as possible, after schools have been selected, they should not be changed or replaced. Despite the best efforts of a national assessment team, however, some school replacements may be necessary. Should the need to replace schools be anticipated, that possibility should be discussed with the sampling statistician so that adequate sampling procedures are implemented and replacement schools are properly

PREPARATION FOR ADMINISTRATION IN SCHOOLS | 33
Example of a Letter to Schools
Dear _____________,
I am writing to seek your support for the 2012 National Assessment of Mathematics Achievement (NAMA), which is being conducted by the National Research Center for Educational Research.
As you may know, the level of student achievement in mathematics in the education system is assessed every fi ve years. In October 2012, data will be collected from sixth-grade students in 160 schools across the country. Students will be tested for two 1-hour periods during the third week of October. Your school has been randomly selected to participate in this important national study.
Your local school inspector will visit you over the next two months to answer any questions you may have and to discuss your school’s participation. The precise dates of testing will be confi rmed over the local radio. A representative of the National Research Center for Educational Research will administer the test and a short questionnaire to the students and will also request you and the class teacher to complete questionnaires. All information collected in your school will be treated in confi dence, and results for individual students or schools will not be made available to anyone. Rather, information collected will be used by the Ministry of Education to help identify the strengths and weaknesses of learning in the system. The ministry requires the information to help it improve the quality of learning of our students, and NAMA has the support and approval of the National Union of Teachers.
You do not need to make elaborate preparations for the assessment, but please inform the pupils the week before the assessment. Students do not need to prepare for the test. Each student will be given a pencil to complete the test and questionnaire and will be allowed to keep the pencil after the assessment has been completed.
Yours sincerely,
DirectorNational Research Center for Educational Research
Source: Authors’ compilation.
BOX 3.1
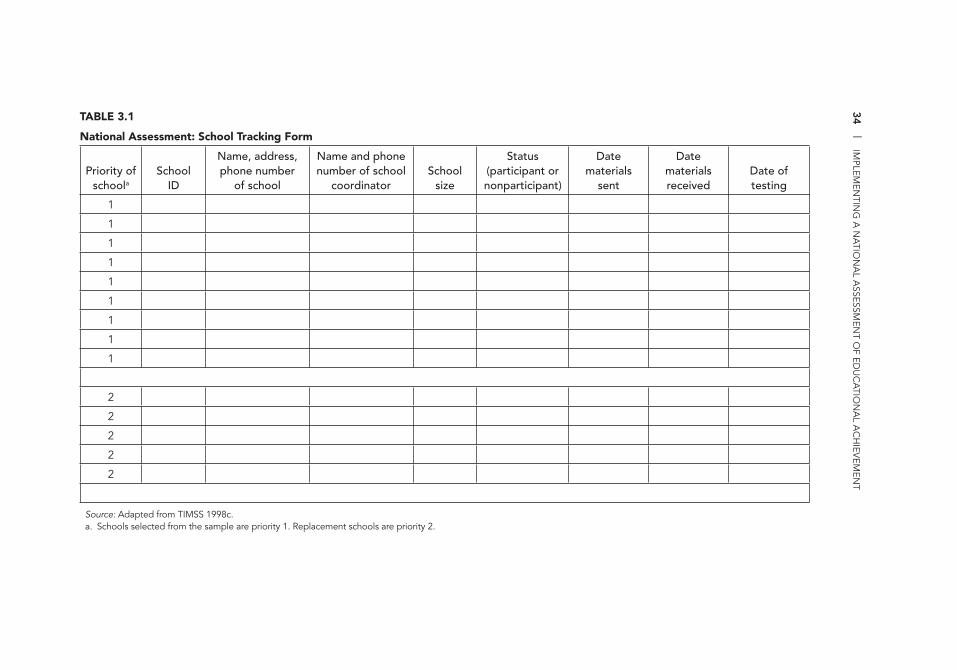
34
| IM
PLEMEN
TING
A N
ATIO
NA
L ASSESSM
ENT O
F EDU
CA
TION
AL A
CH
IEVEM
ENT
TABLE 3.1
National Assessment: School Tracking Form
Priority of schoola
School ID
Name, address, phone number
of school
Name and phone number of school
coordinatorSchool
size
Status (participant or nonparticipant)
Date materials
sent
Date materials received
Date of testing
1
1
1
1
1
1
1
1
1
2
2
2
2
2
Source: Adapted from TIMSS 1998c.a. Schools selected from the sample are priority 1. Replacement schools are priority 2.
PREPARATION FOR ADMINISTRATION IN SCHOOLS | 35
selected. Under no circumstances should the selection of replacement schools be left to the discretion of the test administrator or local school offi cial. This topic is discussed further in part II of this volume.
ORGANIZING INSTRUMENTS
The national coordinator or his or her appointee should check the qual-ity of all tests, questionnaires, and manuals to ensure the following:
• Spelling and typographical errors are removed.• Font size in test booklets is suffi ciently large. Large font sizes are
particularly important for young children. A 14-point font is recom-mended for grades 3 and 4, and a 12-point font for higher grades. One set of national achievement tests uses a 16-point font for grades 1 and 2; a 13-point font for grades 3, 4, and 5; and a 12-point font for grade 6. Question or item numbers should use a larger font.
• Adequate spacing is used between lines of text.• Diagrams are simple and clear. Where possible, they should be on
the same page as the relevant text.
A qualifi ed data entry person who is familiar with computer pack-ages such as Microsoft Offi ce should type tests, questionnaires, and other materials. Manuscript secretaries employed by examination boards have considerable experience, both in laying out questions and accompanying graphics and in ensuring the security of tests. Cost-saving measures that should be considered at this stage include
• Preparing test booklets to fi t on an even number of pages• Careful proofreading, especially of fi nal drafts, which can help pre-
vent reprinting of test booklets necessitated by serious typographical or graphical errors
• Giving the printer adequate time to print tests and questionnaires to avoid paying overtime rates when the assignment has to be com-pleted over a relatively short time or when the printer has other priorities
Three people should independently proofread fi nal drafts of all the materials used in a national assessment. This system is preferable to
36 | IMPLEMENTING A NATIONAL ASSESSMENT OF EDUCATIONAL ACHIEVEMENT
asking the same proofreader to examine each document three times. When print runs are ordered, additional copies should be requested for each school package in anticipation of the need for replacement schools and of some spoilage. Volume 2 of this series, Developing Tests and Questionnaires for a National Assessment of Educational Achieve-ment, has an extensive section on layout and printing.
PREPARING SCHOOLS
Effective national assessment team leaders plan thoroughly and well in advance of administration of the assessment in schools. They also tend to delegate responsibility while retaining overall control of the preparation process through quality control measures, in particular spot-checking the work of others.
Packing
A set of packing procedures should be established and documented. Box 3.2 provides a sample set. A packing checklist is required. Na-tional assessment staff members should sign and date the appropriate boxes in the “Packed” and “Returned” columns in the packing check-list. The school liaison person is expected to do the same in the boxes in the “Received” columns after checking the material sent from the national assessment offi ce. Table 3.2 presents a copy of a checklist used in the South African assessment.
Delivery
Local circumstances will determine the most appropriate and cost-effective method of delivering and collecting materials for the na-tional assessment. In some instances, materials are delivered to central offi ces that are secure (for example, district education or local gov-ernment offi ces), and test administrators collect them using public transportation. In other cases, where secure and reliable delivery sys-tems exist, materials are delivered to test administrators’ homes. Sometimes, teams of administrators travel together in a van and are dropped off with the necessary materials at schools.
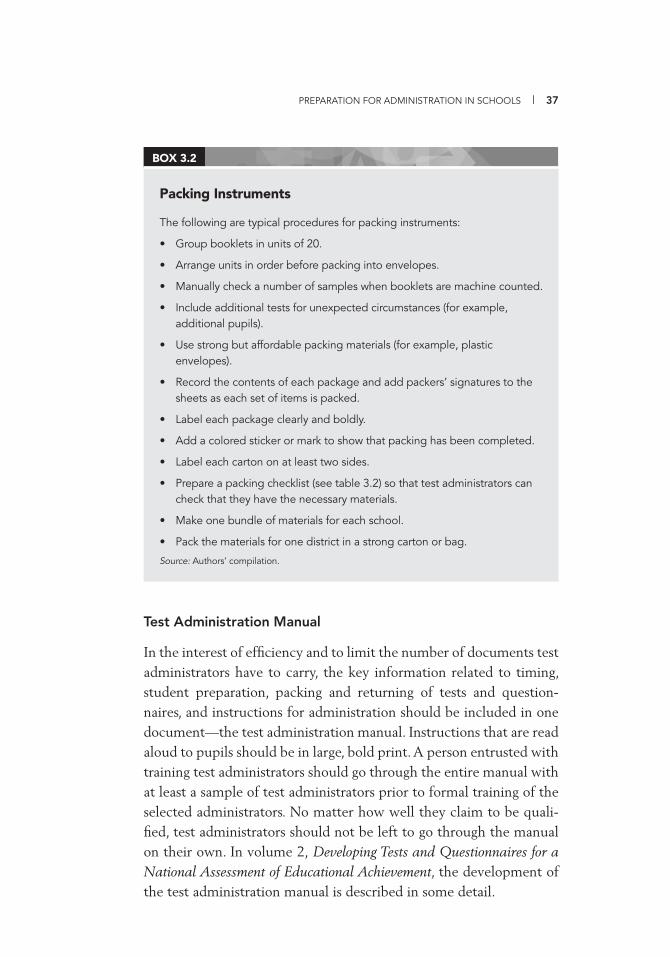
PREPARATION FOR ADMINISTRATION IN SCHOOLS | 37
Test Administration Manual
In the interest of effi ciency and to limit the number of documents test administrators have to carry, the key information related to timing, student preparation, packing and returning of tests and question-naires, and instructions for administration should be included in one document—the test administration manual. Instructions that are read aloud to pupils should be in large, bold print. A person entrusted with training test administrators should go through the entire manual with at least a sample of test administrators prior to formal training of the selected administrators. No matter how well they claim to be quali-fi ed, test administrators should not be left to go through the manual on their own. In volume 2, Developing Tests and Questionnaires for a National Assessment of Educational Achievement, the development of the test administration manual is described in some detail.
Packing Instruments
The following are typical procedures for packing instruments:
• Group booklets in units of 20.
• Arrange units in order before packing into envelopes.
• Manually check a number of samples when booklets are machine counted.
• Include additional tests for unexpected circumstances (for example, additional pupils).
• Use strong but affordable packing materials (for example, plastic envelopes).
• Record the contents of each package and add packers’ signatures to the sheets as each set of items is packed.
• Label each package clearly and boldly.
• Add a colored sticker or mark to show that packing has been completed.
• Label each carton on at least two sides.
• Prepare a packing checklist (see table 3.2) so that test administrators can check that they have the necessary materials.
• Make one bundle of materials for each school.
• Pack the materials for one district in a strong carton or bag.
Source: Authors’ compilation.
BOX 3.2
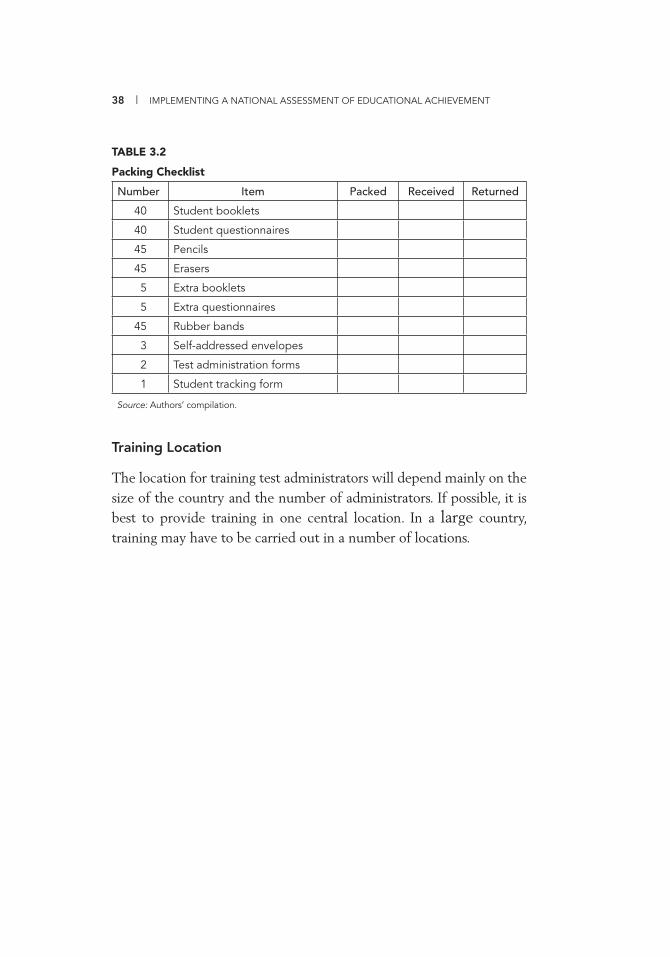
38 | IMPLEMENTING A NATIONAL ASSESSMENT OF EDUCATIONAL ACHIEVEMENT
TABLE 3.2
Packing Checklist
Number Item Packed Received Returned
40 Student booklets
40 Student questionnaires
45 Pencils
45 Erasers
5 Extra booklets
5 Extra questionnaires
45 Rubber bands
3 Self-addressed envelopes
2 Test administration forms
1 Student tracking form
Source: Authors’ compilation.
Training Location
The location for training test administrators will depend mainly on the size of the country and the number of administrators. If possible, it is best to provide training in one central location. In a large country, training may have to be carried out in a number of locations.

ADMINISTRATION
IN SCHOOLS4CHAPTER
39
This chapter outlines the role of the test adminis-trator. Then it describes problems frequently encountered in test ad-ministration and procedures to enhance the quality of the exercise.
THE TEST ADMINISTRATOR
Test administrators, if external to the school, should follow conven-tional procedures for school visits, including reporting to the school principal’s offi ce (if it exists).
In some national assessments, test administration is carried out at the same time in all schools, usually over one or two days. In others, test administrators travel from school to school over a short period. In the latter case, care has to be taken to maintain the security of test materials and to ensure that test-related information is not exchanged between schools. The temptation to obtain information about tests before administration is likely to be particularly strong in education systems that have a tradition of high-stakes testing, because in this situation some teachers may feel that they or their schools are being evaluated. This situation can arise even when the initial letter to schools and announcements in the public media make clear that the
40 | IMPLEMENTING A NATIONAL ASSESSMENT OF EDUCATIONAL ACHIEVEMENT
education system as a whole, not individual teachers or schools, is be-ing evaluated.
When test administrators travel to a region and test in a number of schools in the same locality in one week, they will normally carry only those materials they need to use during a single day of testing.
The national assessment team should ensure that each test admin-istrator has, or has access to, a timing device to be used during test administration. In one national assessment that overlooked this re-quirement, almost 50 percent of test administrators were found not to have access to a watch or clock during test administration. The role of the test administrator during testing is described in volume 2 of this series, Developing Tests and Questionnaires for a National Assess-ment of Educational Achievement. Issues related to test instructions, level of assistance to students, timing, and materials allowed in the testing location are addressed.
The test administrator is responsible for ensuring that teachers do not help students and that students do not copy from each other or bring unauthorized materials into the room. School conditions will dictate seating arrangement options. The test administrator should check that desks are free of books and other materials prior to testing. National assessments that use more than one form of a test reduce the possibility of copying by requiring students seated near each other to take different versions of the test.
Student Tracking Form
The design of a national assessment will specify how students are to be selected within a school. If selection of an intact class is specifi ed, it may be done in advance of administration by the national assess-ment center, or instructions may be given to the test administrator on how to select the class. If the design of the assessment specifi es the selection of students from across all classes at the relevant grade level, again the national assessment center may select the students prior to administration or the test administrator will be instructed on how they are to be selected.
During test administration, the test administrator should complete a student tracking form, which is sent to schools with test booklets
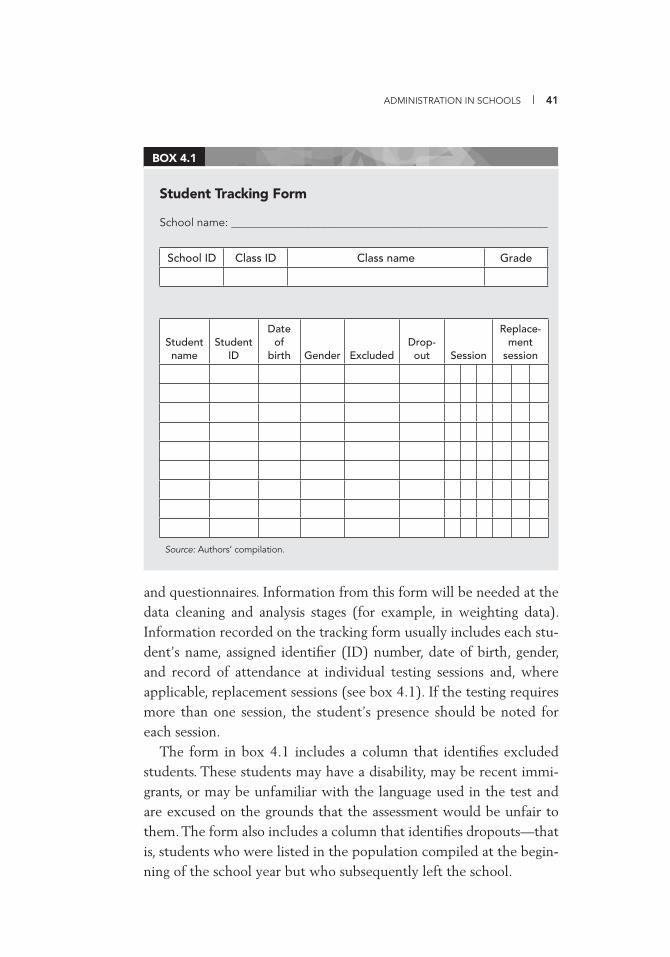
ADMINISTRATION IN SCHOOLS | 41
and questionnaires. Information from this form will be needed at the data cleaning and analysis stages (for example, in weighting data). Information recorded on the tracking form usually includes each stu-dent’s name, assigned identifi er (ID) number, date of birth, gender, and record of attendance at individual testing sessions and, where applicable, replacement sessions (see box 4.1). If the testing requires more than one session, the student’s presence should be noted for each session.
The form in box 4.1 includes a column that identifi es excluded students. These students may have a disability, may be recent immi-grants, or may be unfamiliar with the language used in the test and are excused on the grounds that the assessment would be unfair to them. The form also includes a column that identifi es dropouts—that is, students who were listed in the population compiled at the begin-ning of the school year but who subsequently left the school.
Student Tracking Form
School name: ________________________________________________________
School ID Class ID Class name Grade
Student name
Student ID
Date of
birth Gender ExcludedDrop-out Session
Replace-ment
session
Source: Authors’ compilation.
BOX 4.1
42 | IMPLEMENTING A NATIONAL ASSESSMENT OF EDUCATIONAL ACHIEVEMENT
Return of Instruments
The test administrator must ensure that all tests and questionnaires, used and unused, are kept secure and are returned to the national as-sessment center. This step is important because items, and in some instances an entire test, might be used in a subsequent national assess-ment. If some teachers and students have prior access to those items, the credibility of the subsequent assessment would be undermined. The paper or rough notes used by students while doing the tests should also be returned to the national assessment offi ce. Packing instructions should be provided for test administrators (see box 3.2). Methods of returning materials tend to be the same as methods of delivery.
Clear instructions should be provided on how returns from schools to the national assessment center should be organized. A large space is required to accommodate returns. Returned instruments should be sorted and placed on clearly labeled shelves. Tests and questionnaires should be stored so that they can be easily retrieved for data entry and data cleaning. All returns should be recorded in a returns book or in a computer database (not on a piece of paper).
COMMON ADMINISTRATION PROBLEMS
Problems associated with administering a national assessment tend to vary from country to country in both nature and magnitude. The more serious the problem, the more it undermines the entire national assessment enterprise. From the outset, the national assessment team should ensure that the sampled schools are in fact the ones in which students are being assessed. In one country, district offi cials are known to have insisted, after the national sample had been drawn, that dif-ferent political constituencies be represented in the fi nal selection. Some teams have discovered “ghost” (bogus) schools after using na-tional data sources for sampling purposes. The test administrator and the school liaison person should establish that the pupils who take the tests are in fact the pupils who were selected for participation. School lists or enrollment data may be infl ated, especially in situa-tions where school grants are based on pupil enrollment data. It is not

ADMINISTRATION IN SCHOOLS | 43
uncommon for teachers to want to substitute pupils on the basis that “only dull ones were selected.”
The following are other problems that have been identifi ed in administration:
• Date of testing clashing with a school event• Pupils completing the fi rst section of the test and leaving school
before the second section• Teachers and pupils arriving late• Teachers, and even the principal, insisting on remaining in the class
while students are taking the test• Lack of adequate seating arrangements for test taking• Failure to stick to time limits• Test administrator or others giving assistance to students• Copying by pupils
Low Participation Rates
High levels of participation are required in a national assessment to provide valid information on student achievement in the education system. International Association for the Evaluation of Educational Achievement (IEA) studies, for example, require (a) a participation rate of at least 85 percent for both schools and students or (b) a com-bined rate (the product of school and student participation) of 75 percent (see part IV). IEA also sets the upper limit of exclusions (on grounds such as school remoteness and disability) at 5 percent of the desired target population. In an effort to improve the level of school cooperation in one country, replacement sessions were held at a later date for students who had been absent for the initial testing session. This experience suggested that students and schools tended to coop-erate more fully when they realized that the test administrators would keep returning until all selected pupils had been tested.
QUALITY ASSURANCE
To monitor the quality of test administration, the test administrator should complete a test administration form (box 4.2) after work in an
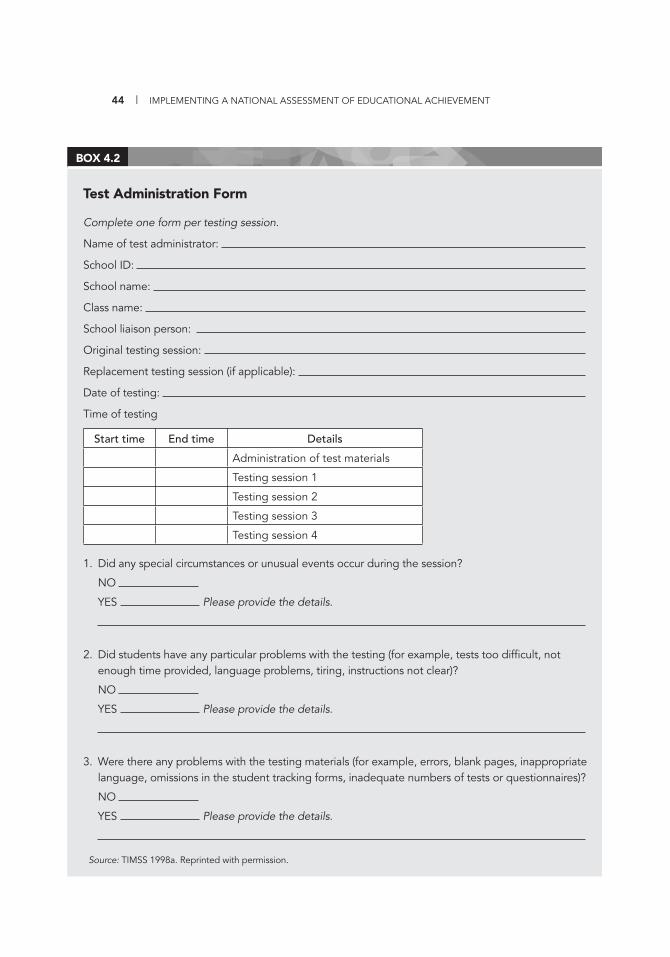
44 | IMPLEMENTING A NATIONAL ASSESSMENT OF EDUCATIONAL ACHIEVEMENT
Test Administration Form
Complete one form per testing session.
Name of test administrator:
School ID:
School name:
Class name:
School liaison person:
Original testing session:
Replacement testing session (if applicable):
Date of testing:
Time of testing
Start time End time Details
Administration of test materials
Testing session 1
Testing session 2
Testing session 3
Testing session 4
1. Did any special circumstances or unusual events occur during the session?
NO
YES Please provide the details.
2. Did students have any particular problems with the testing (for example, tests too diffi cult, not enough time provided, language problems, tiring, instructions not clear)?
NO
YES Please provide the details.
3. Were there any problems with the testing materials (for example, errors, blank pages, inappropriate language, omissions in the student tracking forms, inadequate numbers of tests or questionnaires)?
NO
YES Please provide the details.
Source: TIMSS 1998a. Reprinted with permission.
BOX 4.2
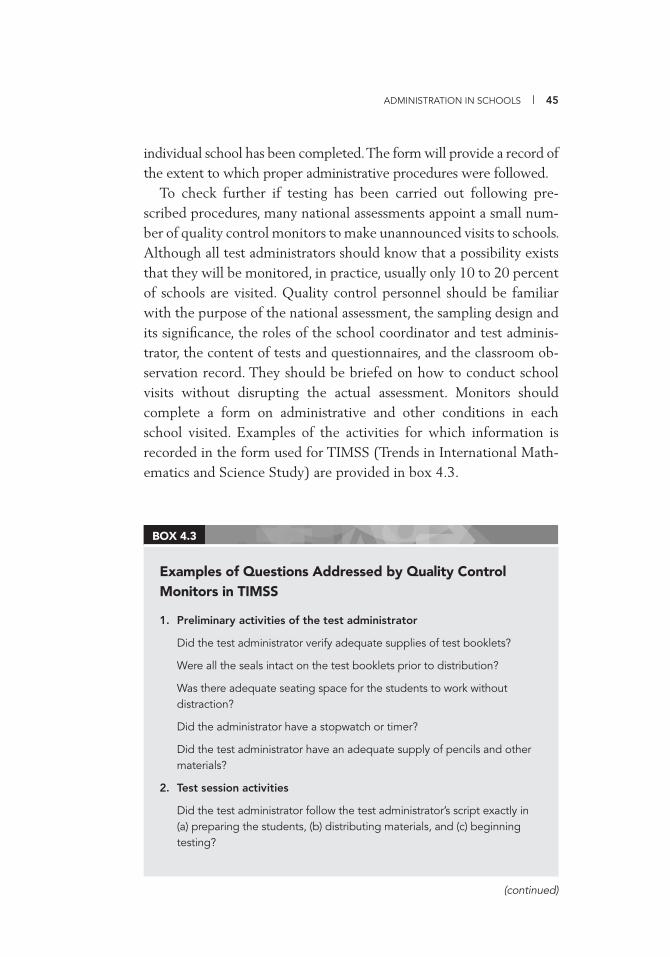
ADMINISTRATION IN SCHOOLS | 45
individual school has been completed. The form will provide a record of the extent to which proper administrative procedures were followed.
To check further if testing has been carried out following pre-scribed procedures, many national assessments appoint a small num-ber of quality control monitors to make unannounced visits to schools. Although all test administrators should know that a possibility exists that they will be monitored, in practice, usually only 10 to 20 percent of schools are visited. Quality control personnel should be familiar with the purpose of the national assessment, the sampling design and its signifi cance, the roles of the school coordinator and test adminis-trator, the content of tests and questionnaires, and the classroom ob-servation record. They should be briefed on how to conduct school visits without disrupting the actual assessment. Monitors should complete a form on administrative and other conditions in each school visited. Examples of the activities for which information is recorded in the form used for TIMSS (Trends in International Math-ematics and Science Study) are provided in box 4.3.
Examples of Questions Addressed by Quality Control Monitors in TIMSS
1. Preliminary activities of the test administrator
Did the test administrator verify adequate supplies of test booklets?
Were all the seals intact on the test booklets prior to distribution?
Was there adequate seating space for the students to work without distraction?
Did the administrator have a stopwatch or timer?
Did the test administrator have an adequate supply of pencils and other materials?
2. Test session activities
Did the test administrator follow the test administrator’s script exactly in (a) preparing the students, (b) distributing materials, and (c) beginning testing?
BOX 4.3
(continued)
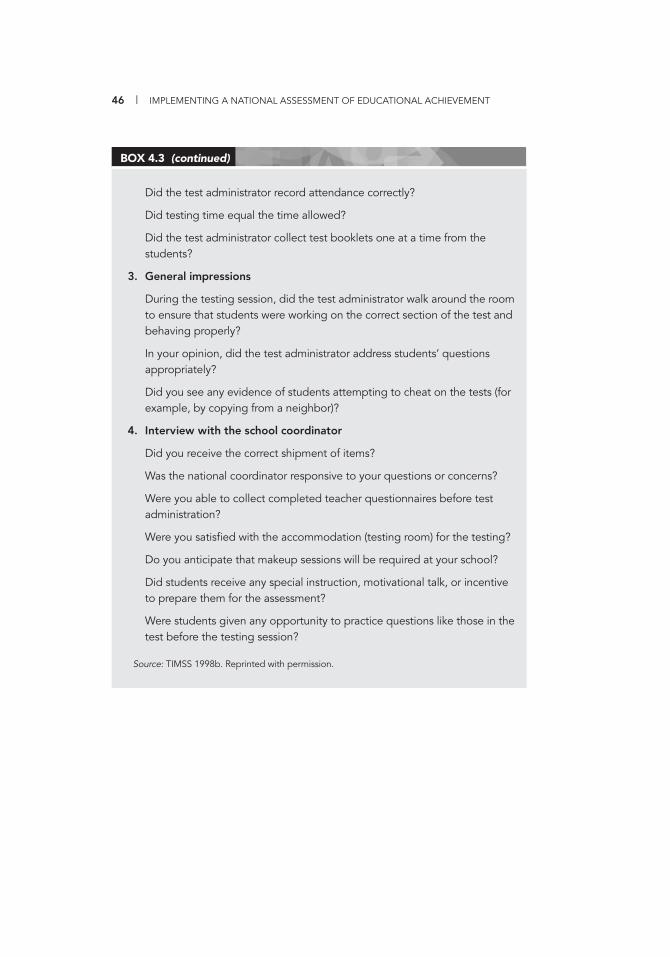
46 | IMPLEMENTING A NATIONAL ASSESSMENT OF EDUCATIONAL ACHIEVEMENT
Did the test administrator record attendance correctly?
Did testing time equal the time allowed?
Did the test administrator collect test booklets one at a time from the students?
3. General impressions
During the testing session, did the test administrator walk around the room to ensure that students were working on the correct section of the test and behaving properly?
In your opinion, did the test administrator address students’ questions appropriately?
Did you see any evidence of students attempting to cheat on the tests (for example, by copying from a neighbor)?
4. Interview with the school coordinator
Did you receive the correct shipment of items?
Was the national coordinator responsive to your questions or concerns?
Were you able to collect completed teacher questionnaires before test administration?
Were you satisfi ed with the accommodation (testing room) for the testing?
Do you anticipate that makeup sessions will be required at your school?
Did students receive any special instruction, motivational talk, or incentive to prepare them for the assessment?
Were students given any opportunity to practice questions like those in the test before the testing session?
Source: TIMSS 1998b. Reprinted with permission.
BOX 4.3 (continued)
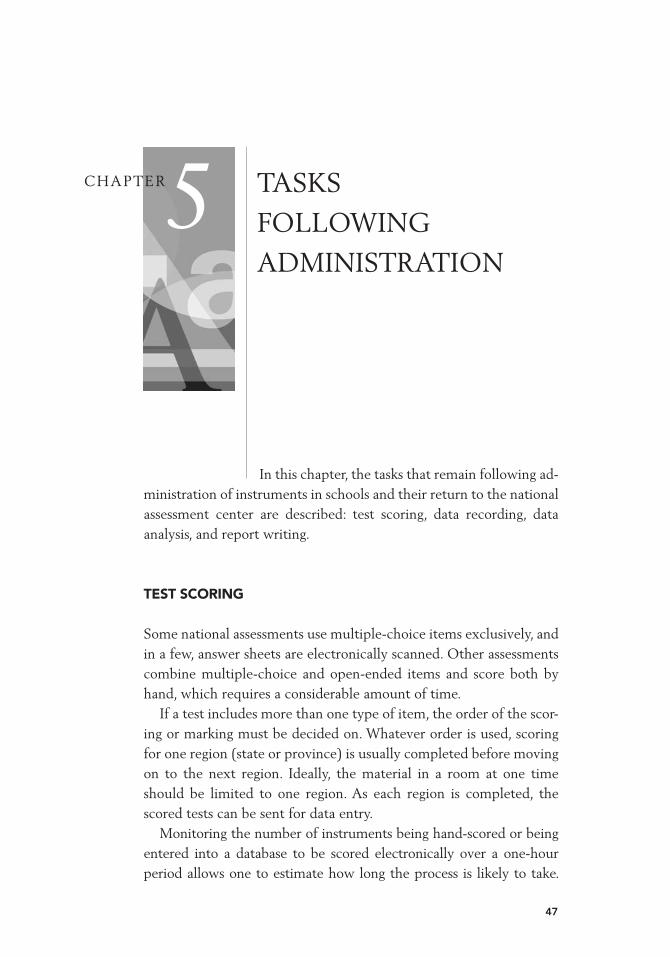
TASKS
FOLLOWING
ADMINISTRATION
5CHAPTER
47
In this chapter, the tasks that remain following ad-ministration of instruments in schools and their return to the national assessment center are described: test scoring, data recording, data analysis, and report writing.
TEST SCORING
Some national assessments use multiple-choice items exclusively, and in a few, answer sheets are electronically scanned. Other assessments combine multiple-choice and open-ended items and score both by hand, which requires a considerable amount of time.
If a test includes more than one type of item, the order of the scor-ing or marking must be decided on. Whatever order is used, scoring for one region (state or province) is usually completed before moving on to the next region. Ideally, the material in a room at one time should be limited to one region. As each region is completed, the scored tests can be sent for data entry.
Monitoring the number of instruments being hand-scored or being entered into a database to be scored electronically over a one-hour period allows one to estimate how long the process is likely to take.
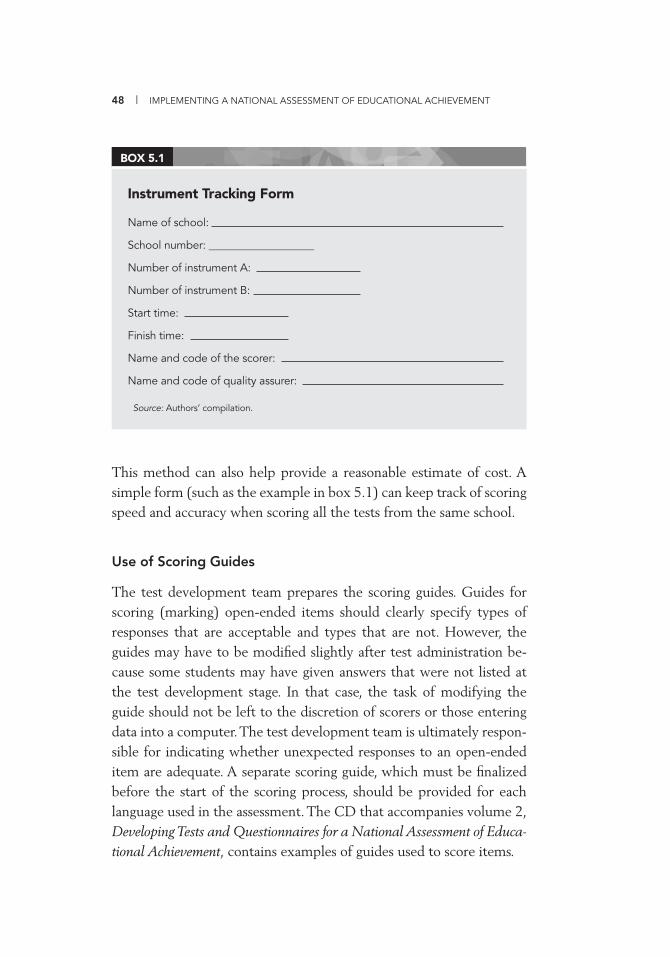
48 | IMPLEMENTING A NATIONAL ASSESSMENT OF EDUCATIONAL ACHIEVEMENT
This method can also help provide a reasonable estimate of cost. A simple form (such as the example in box 5.1) can keep track of scoring speed and accuracy when scoring all the tests from the same school.
Use of Scoring Guides
The test development team prepares the scoring guides. Guides for scoring (marking) open-ended items should clearly specify types of responses that are acceptable and types that are not. However, the guides may have to be modifi ed slightly after test administration be-cause some students may have given answers that were not listed at the test development stage. In that case, the task of modifying the guide should not be left to the discretion of scorers or those entering data into a computer. The test development team is ultimately respon-sible for indicating whether unexpected responses to an open-ended item are adequate. A separate scoring guide, which must be fi nalized before the start of the scoring process, should be provided for each language used in the assessment. The CD that accompanies volume 2, Developing Tests and Questionnaires for a National Assessment of Educa-tional Achievement, contains examples of guides used to score items.
Instrument Tracking Form
Name of school:
School number: ___________________
Number of instrument A:
Number of instrument B:
Start time:
Finish time:
Name and code of the scorer:
Name and code of quality assurer:
Source: Authors’ compilation.
BOX 5.1
TASKS FOLLOWING ADMINISTRATION | 49
Scoring
Scorers and data entry personnel require adequate space to sit com-fortably. Having a clear system in place for handling materials is im-portant, given the large amount of material that is being processed and to avoid clutter. Allowing two scorers to work side by side has been found to be more effi cient and to result in less gossip during scoring. It also permits an individual scorer to clarify issues with a colleague. The scoring room should have suffi cient tables and boxes for packing tests after scoring so that they can be sent for data recording.
The national coordinator has ultimate responsibility for the quality of the scoring of items. He or she should establish a quality assurance procedure to ensure the accuracy and consistency of scoring. This procedure involves rescoring a sample of tests, the size of which var-ies from one national assessment to another. In some cases, lead raters check 50 percent of the test booklets, whereas in other cases, as few as 10 percent are checked. Factors to be considered in deciding on the size of the quality control sample include the experience of scorers, the number of pupils being tested, the time available, and the size of the budget. Responses to test items that are computer scored can be entered twice and the results compared.
In one national assessment, scorers marked multiple-choice an-swers in the test booklets. In the case of open-ended items, 100 per-cent of the items were checked. In another assessment, scores were recorded on a separate verifi cation sheet, and a colleague marked the same items without seeing the previous scorer’s marks. The two marks were then compared and discrepancies resolved. The verifi ca-tion sheet also helped identify individual scorers who made serious errors on a regular basis.
Breaks in work should be provided as the quality of scoring and data entry can suffer if scorers get tired and lose concentration. Ade-quate refreshment should also be provided. In one national assess-ment, government scorers threatened to strike on the grounds that they had not been provided with snacks between meals.
Sometimes, when multiple-choice items are hand-scored, scorers may not be able to read or understand some answers, or they may be confronted with double answers for a particular item. Rather than
50 | IMPLEMENTING A NATIONAL ASSESSMENT OF EDUCATIONAL ACHIEVEMENT
leave the resolution of these problems to the data recording stage, scorers should resolve such problems and record their decisions. In the event of lack of agreement, the lead rater should make the fi nal decision. When multiple-choice items are scored by computer, proce-dures for dealing with double answers will be built into the scoring program.
DATA RECORDING
Attention to detail and careful recording of data will help reduce the amount of time spent cleaning data and rectifying errors. This section outlines general principles relating to the facilities and staff required for data recording, quality assurance, data cleaning, and data storage. Procedures for data cleaning and management are described in detail in part III of this volume (see also TIMSS 1998a).
Facilities for Data Recording
In planning data recording, one should bear in mind the available budget and the date by which data are required. By calculating the amount of time necessary to enter and verify data for each test (such as one mathematics test booklet and one language test booklet) and each questionnaire (such as student and teacher questionnaires), one can estimate the amount of time that will be needed to enter or type and verify all the data. This estimate will give a rough guide to how many data entry personnel will be needed to complete the task on time.
After determining how many staff members will be needed, one computer should be provided for each data entry person, as well as one for the supervisor. Ideally, computers should be linked to a network. Some national assessment teams use custom software (such as the In-ternational Association for the Evaluation of Educational Achieve-ment’s WinDem or EpiData) for data entry; others use database pack-ages such as Access and Excel. Examples of data entry using Access are presented in part III of this volume.
TASKS FOLLOWING ADMINISTRATION | 51
Furniture requirements include good chairs for people who have to spend long hours entering data and long tables for organizing tests and questionnaires. Each data entry person should also have adequate workspace (a) for material that has to be entered; (b) for material that has been recorded; and (c) for problem documents to be discussed with the supervisor, data manager, or leader.
Staff for Data Recording
The data manager plays a crucial role in the data recording process and should be consulted constantly. He or she should, if possible, be involved in selecting data entry personnel. A competent data manager will generally pick up problems caused by poor work practices or in-experience. The data manager should have responsibility for procur-ing and ensuring the adequacy of both the hardware and software to be used in data entry. If possible, the national assessment team should employ experienced data entry personnel who are meticulous in their work. Although employing inexperienced individuals at low rates of pay may seem economical, they may cost more than professionals in the long run.
Data Recording and Quality Assurance
Data recording templates for each instrument should be prepared as soon as the instruments have been developed. The template is a matrix within which the data are typed. Templates look different in different data recording software. Part III of this volume goes into considerable detail on how to create and use a data entry template. Altering a template once data recording has commenced is not recommended.
Data entry personnel will make mistakes. As part of quality assur-ance, the national assessment team should decide (when estimating the budgetary requirements) what percentage (perhaps between 6 and 10 percent) of test records will be entered twice. Such double entry can determine whether a widespread problem exists or if most errors are attributable to one or two data entry personnel.
52 | IMPLEMENTING A NATIONAL ASSESSMENT OF EDUCATIONAL ACHIEVEMENT
Data Cleaning
When data recording has been completed, tests and questionnaires should be carefully stored in a systematic way because some docu-ments may have to be retrieved during data cleaning. Data cleaning, which is treated in detail in part III, is a tedious but very important part of data processing. It includes checking to ensure that data look plausible and that scores and response categories are within accept-able limits. It provides an opportunity to check problematic responses to test and questionnaire items. The data can also be checked for pat-terns that suggest cheating.
Data Storage
After the assessment has been completed, storage of data may be re-quired for a number of years. Many research institutions regard fi ve years as an appropriate length of storage time. In some countries, tests and questionnaires are scanned and data are stored in electronic form.
DATA ANALYSIS
In this section, some practical logistical issues that can have a bearing on the quality and effi ciency of data analysis are raised. Volume 4, Analyzing Data from a National Assessment of Educational Achieve-ment, focuses on generation of item statistics and test score results and on analysis to generate data for policy.
One core team member, with proven competence in statistics, in-cluding psychometrics, should be responsible for data analysis. Others may assist that person. Although employing a full-time statistician may not always be possible, a statistician’s services will be required at many stages of the assessment process from the initial design to re-port writing.
The national assessment team will need the services of a data ana-lyst at the pretest stage of test development. During that stage, test items are administered to a sample of students similar to those who will eventually take the test. Pretesting is covered in some detail in volume 2 of this series, Developing Tests and Questionnaires for a
TASKS FOLLOWING ADMINISTRATION | 53
National Assessment of Educational Achievement. The analyst should be able to apply appropriate computer software packages to analyze pre-test results. He or she should work closely with item writers and subject-matter specialists in selecting the items from the pool of pre-tested items that will be included in the test administered in the national assessment.
Experience suggests that selecting appropriate hardware and spe-cialized software; getting release of government, donor, or other funds; ordering equipment and software (if necessary); and having it installed and operational can all take a considerable amount of time. The na-tional assessment team should ensure that provision has been made in the budget to purchase and service hardware and for supplies such as paper and ink cartridges. Ideally, appropriate hardware and software should be in place before pretesting.
Many universities and government departments have access to various software packages and receive regular updates. At the time of writing, among the more widely used packages are SPSS (Statistical Package for the Social Sciences), which is used extensively in volume 4, Analyzing Data from a National Assessment of Educational Achieve-ment; SAS (Statistical Analysis Software); and STATISTICA. Relevant specialist software, in addition to item and test analysis software, which was developed for this series and which is introduced in vol-ume 4, includes
� Iteman (http://www.assess.com/xcart/product.php?productid=541)� Conquest (https://shop.acer.edu.au/acer-shop/group/CON2/9) � Winsteps (a free, less powerful version, Ministep, is available at
http://www.winsteps.com/)
The data analyst should have access to a good-quality, high-speed printer, which is needed at many stages, but especially during data clean-ing, item analysis, and more general data analysis, as well as for produc-ing text, tables, charts, and graphs for the reports of the assessment.
REPORT WRITING
Because volume 5, Using the Results of a National Assessment of Edu-cational Achievement, covers report writing in considerable detail, the
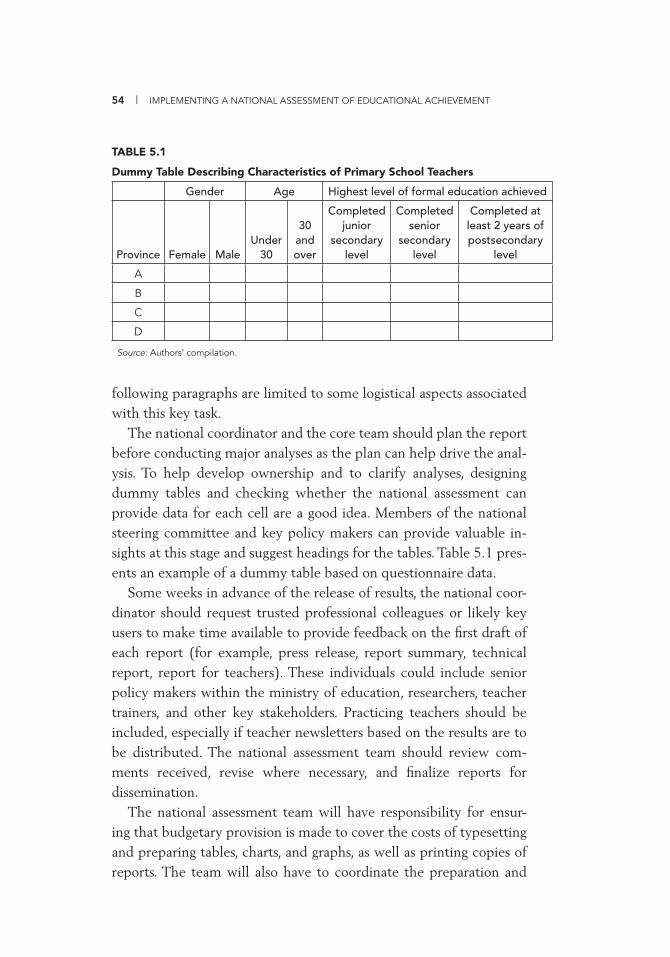
54 | IMPLEMENTING A NATIONAL ASSESSMENT OF EDUCATIONAL ACHIEVEMENT
following paragraphs are limited to some logistical aspects associated with this key task.
The national coordinator and the core team should plan the report before conducting major analyses as the plan can help drive the anal-ysis. To help develop ownership and to clarify analyses, designing dummy tables and checking whether the national assessment can provide data for each cell are a good idea. Members of the national steering committee and key policy makers can provide valuable in-sights at this stage and suggest headings for the tables. Table 5.1 pres-ents an example of a dummy table based on questionnaire data.
Some weeks in advance of the release of results, the national coor-dinator should request trusted professional colleagues or likely key users to make time available to provide feedback on the fi rst draft of each report (for example, press release, report summary, technical report, report for teachers). These individuals could include senior policy makers within the ministry of education, researchers, teacher trainers, and other key stakeholders. Practicing teachers should be included, especially if teacher newsletters based on the results are to be distributed. The national assessment team should review com-ments received, revise where necessary, and fi nalize reports for dissemination.
The national assessment team will have responsibility for ensur-ing that budgetary provision is made to cover the costs of typesetting and preparing tables, charts, and graphs, as well as printing copies of reports. The team will also have to coordinate the preparation and
TABLE 5.1
Dummy Table Describing Characteristics of Primary School Teachers
Gender Age Highest level of formal education achieved
Province Female MaleUnder
30
30 and over
Completed junior
secondary level
Completed senior
secondary level
Completed at least 2 years of postsecondary
level
A
B
C
D
Source: Authors’ compilation.

TASKS FOLLOWING ADMINISTRATION | 55
production of fi nal reports and ensure that printers are given ade-quate time to have the published versions of reports available on a predetermined date. The team should proofread the manuscripts and follow up later to check that appropriate changes have been made. Experience suggests that in developing countries the process from the preparation of the fi rst draft to the offi cial launch of a fi nal report can take three to six months.
The national assessment team should plan a press conference for the day when results are due to be released and invite key education stakeholders to attend. It should make budgetary provision to cover costs related to the press conference. In at least one country, reporters expect to have their expenses paid by the organizers of such events. If a national assessment team wishes to have the minister of education or other senior policy personnel attend the launch of a report, it should give adequate notice, given the busy schedules of these individuals.


SCHOOL
SAMPLING
METHODOLOGY
Jean Dumais and J. Heward Gough
IIPART IIPART
57
Part II describes how to defi ne the population that is to be assessed in the national assessment. Different sampling approaches are described. Much of the section is devoted to the methodology for selecting a sample of students that will be representative of students in the edu-cation system. The emphasis is on “learning by doing.” Readers are guided through the various sampling steps by working on a set of concrete tasks presented in the text and using data fi les in the accom-panying CD. They can check their solutions by comparing them to correct solutions that are presented on screenshots in the text. The fi les are based on national assessment data from a fi ctional country, Sentz.


DEFINING THE
POPULATION OF
INTEREST
6CHAPTER
59
This chapter introduces the terms target popula-tion and survey population, the fi rst building blocks in the design of a probability survey. Later chapters describe a sampling frame (chapter 7) and probability sampling (chapter 8).
The fi rst major task is to identify and defi ne the population to be assessed in accordance with the goals of the assessment. This task in-volves specifying who (such as students, teachers, aides, principals, or parents), or what (for example, all schools or only publicly funded schools) the assessment will cover. The scope of the study helps de-fi ne the populations of interest and determine whether the results can be compared with those of similar studies.
The desired target population comprises all the units of interest—the population for which information is sought and estimates are needed. In a national assessment, the population might be all students enrolled in grade 5 in all schools in the country or grade 5 students enrolled only in public schools. A desired target population could also be all teachers employed in primary schools.
Unfortunately, in some instances, practical reasons prevent the sur-vey of some elements of a target population, in which case they may have to be excluded. Reasons for exclusion may relate to cost, ab-sence of roads, geographic isolation (remote islands or mountainous

60 | IMPLEMENTING A NATIONAL ASSESSMENT OF EDUCATIONAL ACHIEVEMENT
regions), civil unrest, schools that serve very few students, or children with special needs. The remaining population elements will form the defi ned target population—the population that the national assessment team can reasonably cover. International studies of educational achievement routinely publish data on desired and defi ned target populations for each participating country.
Exclusions should be kept to a minimum and should not be used as a means of obtaining a “convenience” sample. International studies have routinely set the upper limit of exclusions at 5 percent of the desired target population; data on countries that fail to meet this cri-terion are usually reported with a cautionary note. Failure to meet the exclusion criterion in a national assessment could be highlighted by a comment such as the following: “Data for rural secondary schools in region Y should be treated with caution because three large remote areas were excluded from the survey.”
The national steering committee should play a key role in making decisions about the population to be assessed. It could, for instance, defi ne the desired target population as all students enrolled in grade 6 during any part of a specifi c or reference school year. However, it might specify that the defi ned target population should be limited to students enrolled in grade 6 on May 31 of a reference year in schools with at least 10 students in grade 6. From logistical and budgetary perspectives, assessing students in smaller schools would be impracti-cal. Furthermore, the steering committee would be aware that some grade 6 students would have dropped out of school or migrated dur-ing the school year and that attempting to fi nd and assess these stu-dents would not be practical.
Figure 6.1 depicts a fairly typical situation in which the desired target population is defi ned (left bar). The target population has been reduced by omitting certain categories of schools (such as remote or very small schools or schools serving children with special needs) and results in a new population, the defi ned target population (middle bar). The size of this population may be reduced further, mainly by fi nding excluded units (for example, special needs students) in par-ticipating schools on the day of testing, resulting in the achieved pop-ulation (right column).
DEFINING THE POPULATION OF INTEREST | 61
The national steering committee may also wish to identify subna-tional groups of interest that it defi nes, for example, in terms of region or gender. Having determined the defi ned target population and pos-sibly the subgroups of interest, the national assessment team or its sampling experts must then construct an appropriate sampling frame.
FIGURE 6.1
Percentages of Students in Desired, Defi ned, and Achieved Populations
Source: Authors’ representation.
100
75
50
25
0national desired target population
national defined target population
national achieved(survey) population
per
cent
age
of
stud
ents
schools covered units excluded within schoolsschools excluded

CREATING THE
SAMPLING
FRAME
7CHAPTER
63
This chapter introduces the most basic tool for survey sampling: the sampling frame. The chapter addresses how the frame and the population can be very similar or completely different, as well as the properties of a “good” frame. Finally, the chapter intro-duces the demonstration assessment conducted in Sentz.
THE SAMPLING FRAME
Ideally, a sampling frame is a comprehensive, complete, up-to-date list that (a) includes the students of the defi ned target population and (b) contains information that helps access the students. In the case of a national assessment of educational achievement, the availability of a list of all the students enrolled in the school grades of interest would allow the sampling team to pick a sample of students directly.
In many countries, such a complete and up-to-date list is impossi-ble to obtain, even when the central public administration (such as the ministry of education) conducts the assessment. Such countries may have to resort to alternative sources of information or construct their own complete and up-to-date frame.

64 | IMPLEMENTING A NATIONAL ASSESSMENT OF EDUCATIONAL ACHIEVEMENT
One alternative to a comprehensive, complete, and up-to-date list of students is partial up-to-date coverage of the target population. Indirect access to a list of students may be achieved by fi rst selecting schools and then their students. In effect, this means lists of students are required only for the schools selected to take part in the national assessment.
In many countries, the national ministry of education or an equiva-lent authority will be the primary source of information for construct-ing the sampling frame. Such a list will likely contain a national school identifi er, the name and address of the school, the name of the school principal, a phone number, the grade levels covered, the size of staff, student enrollment, and possibly the source of funding and type of education provided.
In practice, the sampling frame will usually be imperfect to some degree because it will not cover exactly the defi ned target population. Some frame entries may not correspond to actual target population units. The school frame entries may contain more schools than are in the actual population, a situation known as overcoverage, which oc-curs, for example, when a school closes or merges with another be-tween the time of frame creation and data collection. Furthermore, some elements of the target population may be missing from the frame (undercoverage), for example, when a school is not listed in the frame or is misclassifi ed as out of scope. The elements actually cov-ered by the frame constitute the population from which the survey sample is selected and are normally referred to as the survey popula-tion. Essential elements of a sampling frame are outlined in table 7.1.
Sampling frames can take many forms. The following example is based on a desired target population of all students enrolled in pri-mary schools during any part of the reference school year and a de-fi ned target population of students enrolled in primary schools on May 31 of the reference year. In this instance, the sampling frame was based on the ministry of education’s list of all students enrolled in primary schools on April 15 of the reference year. This approach should be adequate provided that the list is updated several times a year. However, the survey population defi ned by this frame might not cover the defi ned target population if some students leave and others enroll after April 15. If the ministry has an out-of-date or defi cient list
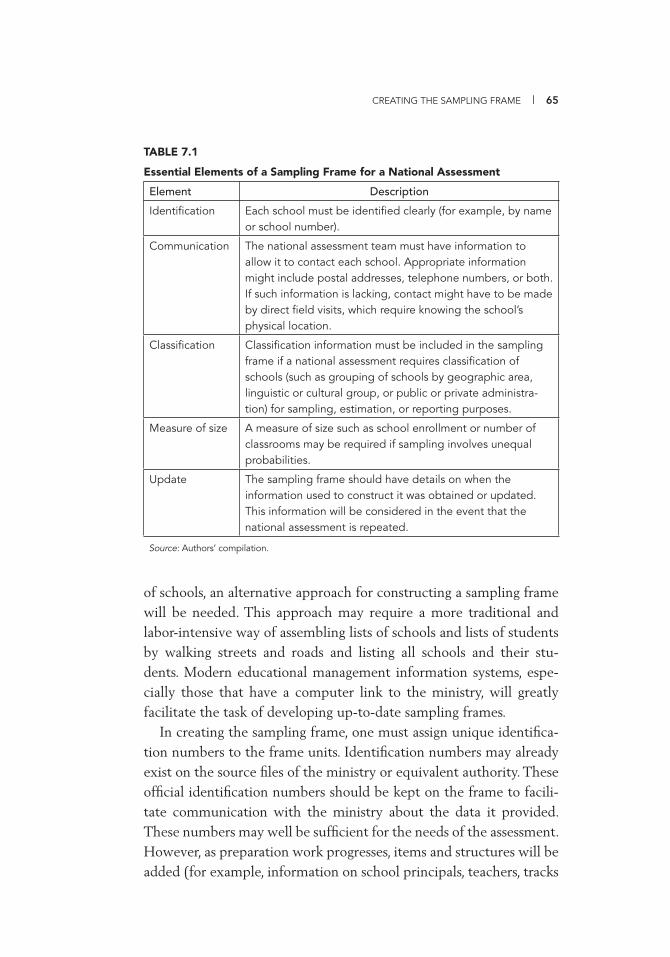
CREATING THE SAMPLING FRAME | 65
of schools, an alternative approach for constructing a sampling frame will be needed. This approach may require a more traditional and labor-intensive way of assembling lists of schools and lists of students by walking streets and roads and listing all schools and their stu-dents. Modern educational management information systems, espe-cially those that have a computer link to the ministry, will greatly facilitate the task of developing up-to-date sampling frames.
In creating the sampling frame, one must assign unique identifi ca-tion numbers to the frame units. Identifi cation numbers may already exist on the source fi les of the ministry or equivalent authority. These offi cial identifi cation numbers should be kept on the frame to facili-tate communication with the ministry about the data it provided. These numbers may well be suffi cient for the needs of the assessment. However, as preparation work progresses, items and structures will be added (for example, information on school principals, teachers, tracks
TABLE 7.1
Essential Elements of a Sampling Frame for a National Assessment
Element Description
Identifi cation Each school must be identifi ed clearly (for example, by name or school number).
Communication The national assessment team must have information to allow it to contact each school. Appropriate information might include postal addresses, telephone numbers, or both. If such information is lacking, contact might have to be made by direct fi eld visits, which require knowing the school’s physical location.
Classifi cation Classifi cation information must be included in the sampling frame if a national assessment requires classifi cation of schools (such as grouping of schools by geographic area, linguistic or cultural group, or public or private administra-tion) for sampling, estimation, or reporting purposes.
Measure of size A measure of size such as school enrollment or number of classrooms may be required if sampling involves unequal probabilities.
Update The sampling frame should have details on when the information used to construct it was obtained or updated. This information will be considered in the event that the national assessment is repeated.
Source: Authors’ compilation.

66 | IMPLEMENTING A NATIONAL ASSESSMENT OF EDUCATIONAL ACHIEVEMENT
or classes within schools, and students within classes). The units of each layer should be properly identifi ed as they are added to the frame or frames. The ultimate objective is to create a set of identifi ers that allows location and tracking of each individual and each institution through the entire assessment process. Box 2.1 in part I has examples of identifi cation numbering systems used in national assessments.
SENTZ CASE STUDY
The CD accompanying this manual contains a number of fi les with the necessary frame and sample data for the case study of Sentz. A sum-mary description of the fi les can be found in annex II.A. Follow the case study (see exercise 7.1) step by step to become familiar with the neces-sary steps in designing and selecting a national assessment sample.
Sentz is about to embark on a multiyear program of national assess-ment of educational achievement. In Sentz, schooling is compulsory until the end of International Standard Classifi cation of Education (ISCED) level 2 (lower secondary) (UNESCO 1997). The ministry wishes to establish the learning achievement levels of students at vari-ous stages of the education system, starting with eighth grade. It speci-fi ed that literacy should be assessed during each assessment. The fi rst national assessment should also assess student achievement in math-ematics and science. Future assessments would include other curricu-lum areas.
Sentz has two distinct geographic regions, the Northeast and Southwest, which are separated by the Grand River (see fi gure 7.1). The national capital, Capital City, is located in the Southwest region. The Northeast consists of three provinces (provinces 1, 3, and 5) and 21 towns, while the Southwest has two provinces (provinces 2 and 4) with a total of 12 towns. (The term town includes cities, smaller towns, or rural areas consisting of farms and small villages.) Each province is divided into an urban and a rural section with the exception of prov-ince 4 in the Southwest, which has a rural section only. Each town is classifi ed as either urban or rural.
Every child in Sentz can attend a local school up to and including ISCED level 2 (second stage of basic education: lower secondary edu-cation). The 227 schools offering instruction at this level comprise
CREATING THE SAMPLING FRAME | 67
Getting Started
On your local hard drive or server, create a folder called NAEA SAMPLING (or something similar). Create fi ve separate subfolders within NAEA SAMPLING. These subfolders are BASE FILES, MYSAMPLSOL (for My Sampling Solutions), SRS400, 2STG4400, and NATASSESS (for an actual national sample assessment that we will use later). Copy the fi les for BASE FILES, SRS400, 2STG4400, and NATASSESS subfolders from the SPSS VERSION folder in the CD that accompanies this book. You will use the MYSAMPLSOL folder to fi le your output after completing an exercise. The proposed fi le structure can be examined in fi gure II.A.1 of annex II.A (page 106). The various exercises are organized so that you should be able to work through the case study, building on the work already accomplished and saved under MYSAMPLSOL. However, you can always start from one of the permanent fi les (located in SRS400 or 2STG4400); doing so will prevent carrying out analyses on incomplete or inaccurate exercise fi les. To avoid a lot of wasted effort later, take considerable care at this stage in setting up the NAEA SAMPLING folder and the subfolders. Unless you are so instructed, do not use automatic save and do not write over the permanent fi les in the subfolders.
From this point on, you should be working from the fi les located on your hard drive or server. If you need to, you can open the answer fi les located on the CD to verify your work.
As you progress through the various tasks or exercises, you will be accessing, creating, and storing the equivalent fi les on your local drive or server. Note that SPSS17,a including the Complex Samples add-on modules, was used to create this case study; earlier versions of SPSS might show slight differences in menu presentation or options. The optional SPSS module Complex Samples is required to carry out some of the exercises.
The reasons behind the choices of stratifi cation, sample allocation, sample selection scheme, and a number of other key concepts, as well as related terminology and abbrevia-tions, are explained as they are introduced.
The survey manager for Sentz has been able to obtain from the ministry of education a list of the 227 schools in the country where eighth-grade education is offered. The list is organized by region, province, density (urban or rural ), town, and school. Each school on the list has a unique identifi cation number (schoolid) built using the province (left-hand digit), the town (second digit), and the school within the city (two right-hand digits). For example, the school identifi ed by the number 1413 is located in province 1, town 4. Similarly, for classes within schools (in this case the grade 8 classes in a school), an identifi cation number will be created for the class by adding a digit to the right of the school identifi er: 14131, 14132, 14133, and so forth. Two more digits are added to identify the students within their class; if, for instance, the class has 43 students, you would use 1413101, 1413102, …, 1413143. For each school, the ministry has provided the number of eighth-grade classes (nbclass), the total number of children enrolled in eighth-grade classes (measure of size, or school_size), and the average class size (avgclass).
The fi le SCHOOLS.SAV is the provisional sampling frame of schools in Sentz. You can open it in the SPSS viewer by following the SPSS instructions given here. SPSS keywords and instructions are in lowercase.
EXERCISE 7.1
(continued)
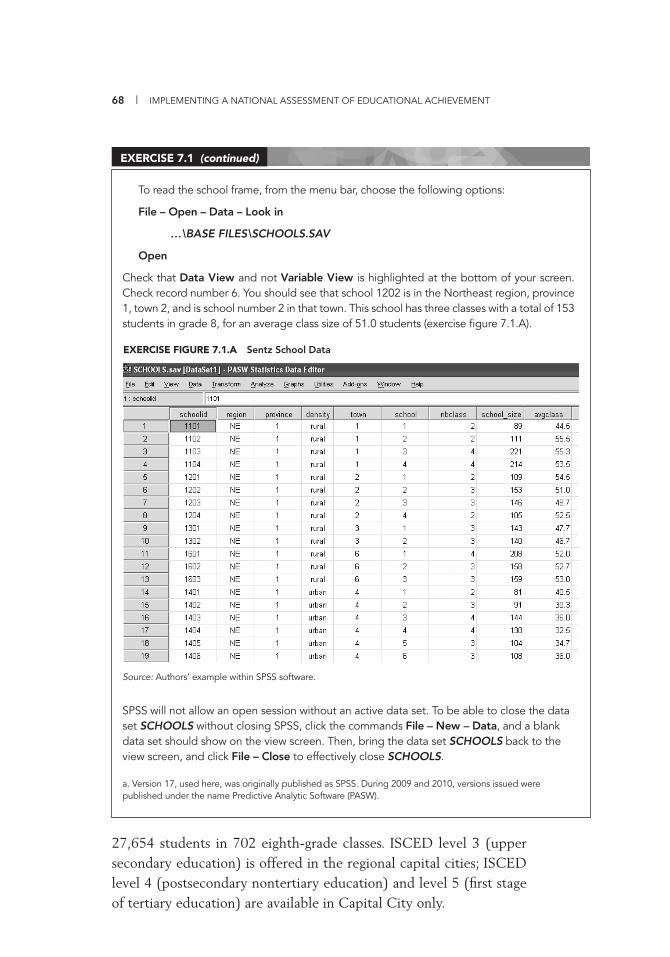
68 | IMPLEMENTING A NATIONAL ASSESSMENT OF EDUCATIONAL ACHIEVEMENT
To read the school frame, from the menu bar, choose the following options:
File – Open – Data – Look in
…\BASE FILES\SCHOOLS.SAV
Open
Check that Data View and not Variable View is highlighted at the bottom of your screen. Check record number 6. You should see that school 1202 is in the Northeast region, province 1, town 2, and is school number 2 in that town. This school has three classes with a total of 153 students in grade 8, for an average class size of 51.0 students (exercise fi gure 7.1.A).
SPSS will not allow an open session without an active data set. To be able to close the data set SCHOOLS without closing SPSS, click the commands File – New – Data, and a blank data set should show on the view screen. Then, bring the data set SCHOOLS back to the view screen, and click File – Close to effectively close SCHOOLS.
a. Version 17, used here, was originally published as SPSS. During 2009 and 2010, versions issued were published under the name Predictive Analytic Software (PASW).
EXERCISE 7.1 (continued)
Source: Authors’ example within SPSS software.
EXERCISE FIGURE 7.1.A Sentz School Data
27,654 students in 702 eighth-grade classes. ISCED level 3 (upper secondary education) is offered in the regional capital cities; ISCED level 4 (postsecondary nontertiary education) and level 5 (fi rst stage of tertiary education) are available in Capital City only.
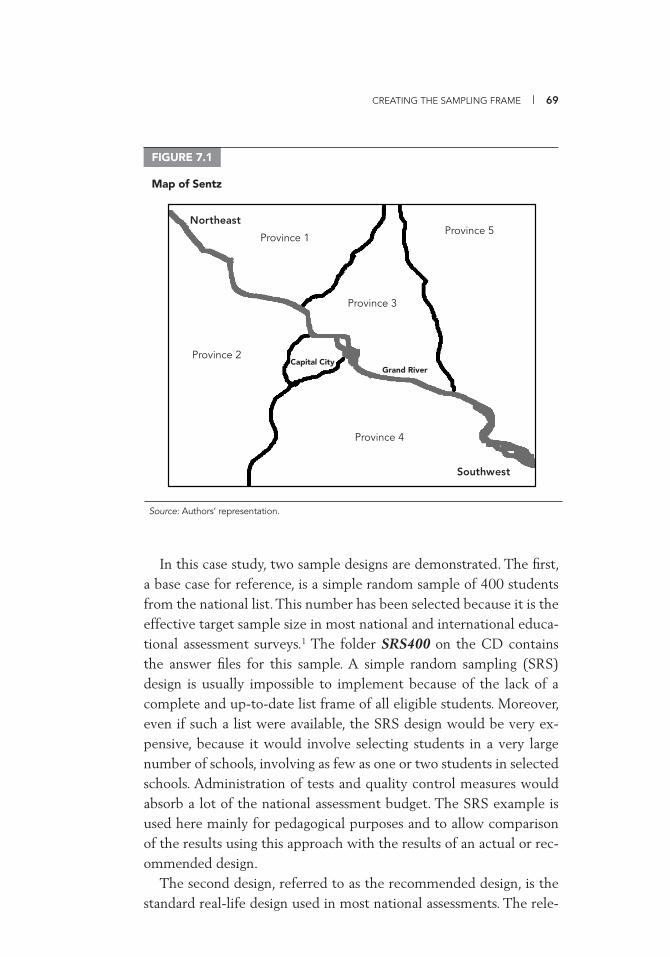
CREATING THE SAMPLING FRAME | 69
Northeast
Southwest
Province 4
Province 5Province 1
Province 3
Province 2Capital City
Grand River
FIGURE 7.1
Map of Sentz
Source: Authors’ representation.
In this case study, two sample designs are demonstrated. The fi rst, a base case for reference, is a simple random sample of 400 students from the national list. This number has been selected because it is the effective target sample size in most national and international educa-tional assessment surveys.1 The folder SRS400 on the CD contains the answer fi les for this sample. A simple random sampling (SRS) design is usually impossible to implement because of the lack of a complete and up-to-date list frame of all eligible students. Moreover, even if such a list were available, the SRS design would be very ex-pensive, because it would involve selecting students in a very large number of schools, involving as few as one or two students in selected schools. Administration of tests and quality control measures would absorb a lot of the national assessment budget. The SRS example is used here mainly for pedagogical purposes and to allow comparison of the results using this approach with the results of an actual or rec-ommended design.
The second design, referred to as the recommended design, is the standard real-life design used in most national assessments. The rele-
70 | IMPLEMENTING A NATIONAL ASSESSMENT OF EDUCATIONAL ACHIEVEMENT
vant answer fi les are in folder 2STG4400, so called because the design will be a two-stage sample with an expected size of 4,400 students. The design includes geographic or administrative stratifi cation, in this case the fi ve provinces of Sentz. The sample design will involve initial selection of schools (stage 1) followed by selection of one class per selected school (stage 2). If researchers wanted to isolate the effect of the teachers on student performance from that of the school, more than one classroom would be selected. If they were only interested in the effect of the school, the sample of students should be selected from the entire target grade, regardless of their class. For reasons of budget and practicality, Sentz has decided to survey one entire class-room from each school. The desired size of the sample of students is based on the available information on class size, intraclass correlation, expected design effects, and the analytical and reporting needs of the assessment. In the fi rst stage, schools are allocated in proportion to the number of eligible students in each province, and are selected us-ing systematic probability proportional to size sampling (PPS). Then a simple random sample of one entire class per school is taken.
NOTE
1. In some major assessments (such as Trends in International Mathematics and Science Study, or TIMSS), psychometric scales are centered on 500 with a set standard deviation of 100; then, with a sample size of 400, the coeffi cient of variation of the estimated scores is about 1 percent, and confi dence intervals for unknown characteristic prevalence are ±5 percentage points.
ELEMENTS OF
SAMPLING
THEORY
8CHAPTER
71
This chapter describes the fundamental elements of sampling theory, including random sampling and some of the most important random sampling techniques, such as sample stratifi cation and multistage and cluster sampling.
Probability sampling is normally used when reliable and valid esti-mates of certain population characteristics are needed from a sample, because it allows estimation of the precision (sampling variance or standard error) of those estimates. Those characteristics can be ex-pressed as counts (for example, number of children between 10 and 15 years of age); as totals (for example, total enrollment in lower sec-ondary schools); or as proportions (for example, proportion of chil-dren living in households whose annual income is below the national poverty line). Any and all of those characteristics can be estimated from a sample, as long as it has been selected with a probability sam-pling scheme and proper fi eld procedures have been developed and implemented.
Probability sampling requires that each unit in the population of interest—the population for which estimates are sought—have a known nonzero probability of being selected into the sample. Proba-bility sampling does not require that all units have the same probabil-ity of selection, just that they have a probability of being selected. In
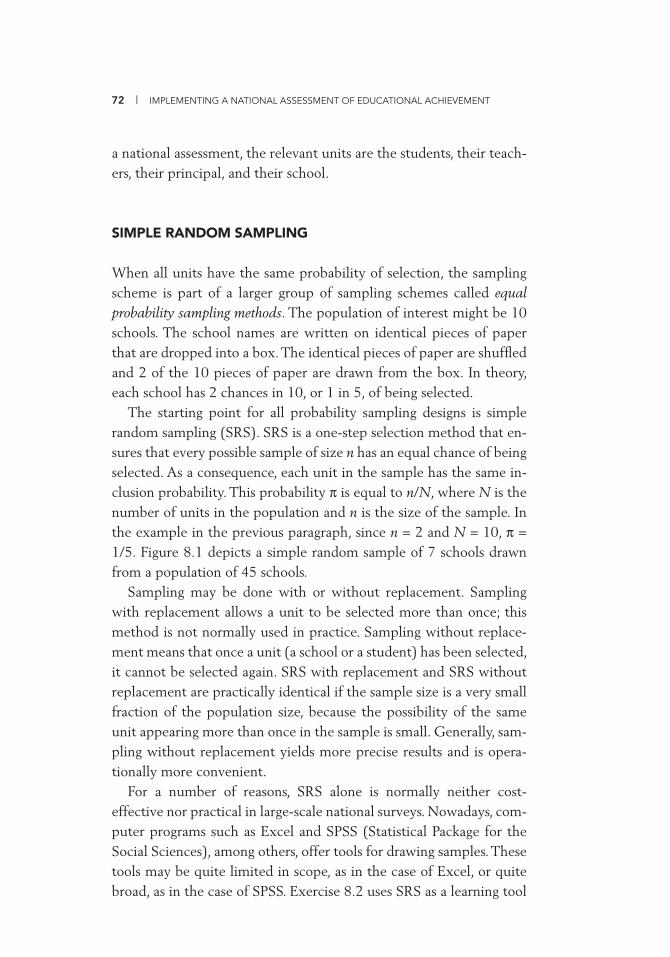
72 | IMPLEMENTING A NATIONAL ASSESSMENT OF EDUCATIONAL ACHIEVEMENT
a national assessment, the relevant units are the students, their teach-ers, their principal, and their school.
SIMPLE RANDOM SAMPLING
When all units have the same probability of selection, the sampling scheme is part of a larger group of sampling schemes called equal probability sampling methods. The population of interest might be 10 schools. The school names are written on identical pieces of paper that are dropped into a box. The identical pieces of paper are shuffl ed and 2 of the 10 pieces of paper are drawn from the box. In theory, each school has 2 chances in 10, or 1 in 5, of being selected.
The starting point for all probability sampling designs is simple random sampling (SRS). SRS is a one-step selection method that en-sures that every possible sample of size n has an equal chance of being selected. As a consequence, each unit in the sample has the same in-clusion probability. This probability π is equal to n/N, where N is the number of units in the population and n is the size of the sample. In the example in the previous paragraph, since n = 2 and N = 10, π = 1/5. Figure 8.1 depicts a simple random sample of 7 schools drawn from a population of 45 schools.
Sampling may be done with or without replacement. Sampling with replacement allows a unit to be selected more than once; this method is not normally used in practice. Sampling without replace-ment means that once a unit (a school or a student) has been selected, it cannot be selected again. SRS with replacement and SRS without replacement are practically identical if the sample size is a very small fraction of the population size, because the possibility of the same unit appearing more than once in the sample is small. Generally, sam-pling without replacement yields more precise results and is opera-tionally more convenient.
For a number of reasons, SRS alone is normally neither cost-effective nor practical in large-scale national surveys. Nowadays, com-puter programs such as Excel and SPSS (Statistical Package for the Social Sciences), among others, offer tools for drawing samples. These tools may be quite limited in scope, as in the case of Excel, or quite broad, as in the case of SPSS. Exercise 8.2 uses SRS as a learning tool
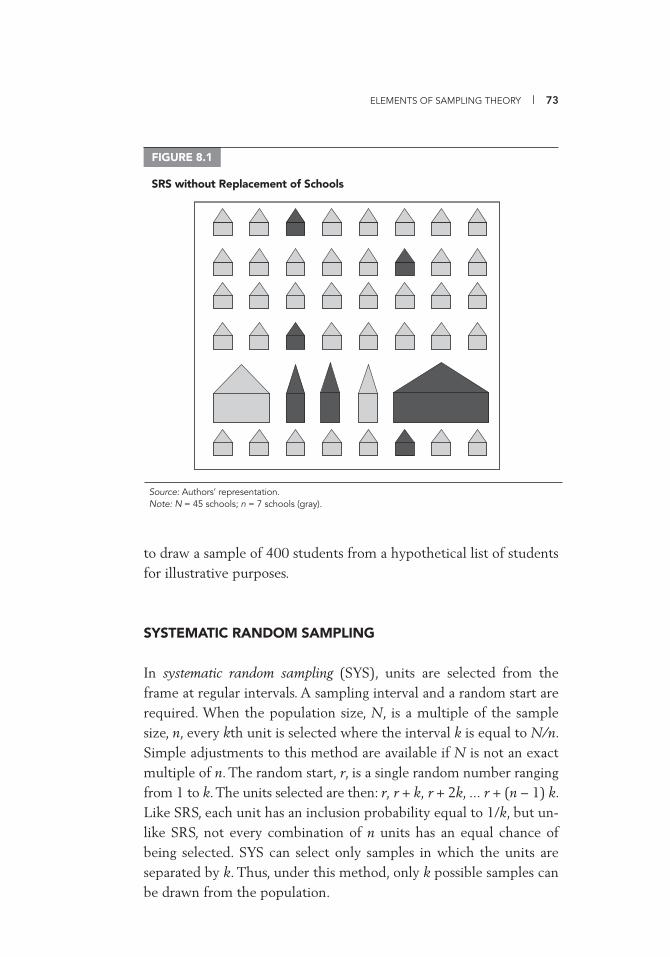
ELEMENTS OF SAMPLING THEORY | 73
to draw a sample of 400 students from a hypothetical list of students for illustrative purposes.
SYSTEMATIC RANDOM SAMPLING
In systematic random sampling (SYS), units are selected from the frame at regular intervals. A sampling interval and a random start are required. When the population size, N, is a multiple of the sample size, n, every kth unit is selected where the interval k is equal to N/n. Simple adjustments to this method are available if N is not an exact multiple of n. The random start, r, is a single random number ranging from 1 to k. The units selected are then: r, r + k, r + 2k, ... r + (n − 1) k. Like SRS, each unit has an inclusion probability equal to 1/k, but un-like SRS, not every combination of n units has an equal chance of being selected. SYS can select only samples in which the units are separated by k. Thus, under this method, only k possible samples can be drawn from the population.
FIGURE 8.1
SRS without Replacement of Schools
Source: Authors’ representation.Note: N = 45 schools; n = 7 schools (gray).
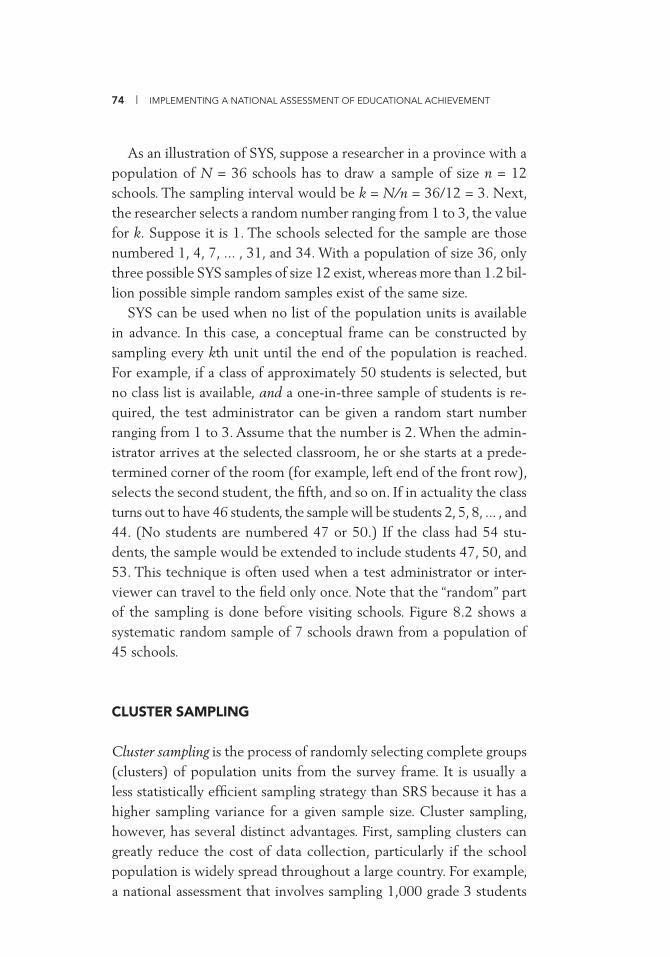
74 | IMPLEMENTING A NATIONAL ASSESSMENT OF EDUCATIONAL ACHIEVEMENT
As an illustration of SYS, suppose a researcher in a province with a population of N = 36 schools has to draw a sample of size n = 12 schools. The sampling interval would be k = N/n = 36/12 = 3. Next, the researcher selects a random number ranging from 1 to 3, the value for k. Suppose it is 1. The schools selected for the sample are those numbered 1, 4, 7, ... , 31, and 34. With a population of size 36, only three possible SYS samples of size 12 exist, whereas more than 1.2 bil-lion possible simple random samples exist of the same size.
SYS can be used when no list of the population units is available in advance. In this case, a conceptual frame can be constructed by sampling every kth unit until the end of the population is reached. For example, if a class of approximately 50 students is selected, but no class list is available, and a one-in-three sample of students is re-quired, the test administrator can be given a random start number ranging from 1 to 3. Assume that the number is 2. When the admin-istrator arrives at the selected classroom, he or she starts at a prede-termined corner of the room (for example, left end of the front row), selects the second student, the fi fth, and so on. If in actuality the class turns out to have 46 students, the sample will be students 2, 5, 8, ... , and 44. (No students are numbered 47 or 50.) If the class had 54 stu-dents, the sample would be extended to include students 47, 50, and 53. This technique is often used when a test administrator or inter-viewer can travel to the fi eld only once. Note that the “random” part of the sampling is done before visiting schools. Figure 8.2 shows a systematic random sample of 7 schools drawn from a population of 45 schools.
CLUSTER SAMPLING
Cluster sampling is the process of randomly selecting complete groups (clusters) of population units from the survey frame. It is usually a less statistically effi cient sampling strategy than SRS because it has a higher sampling variance for a given sample size. Cluster sampling, however, has several distinct advantages. First, sampling clusters can greatly reduce the cost of data collection, particularly if the school population is widely spread throughout a large country. For example, a national assessment that involves sampling 1,000 grade 3 students
ELEMENTS OF SAMPLING THEORY | 75
in schools at a rate of 25 in each of 40 selected schools will be much less expensive than sampling 1,000 grade 3 students scattered at ran-dom across the country. Second, sampling individual units from the population is not always practical. Sometimes sampling groups of the population units or clusters (for example, entire classrooms) is much easier, or it may be required for administrative reasons. Finally, cluster sampling supports the production of estimates (for example, average achievement per classroom or per school). Figure 8.3 provides an ex-ample of a sample of three school clusters involving 19 schools, taken from a population of 45 schools grouped into seven clusters.
Cluster sampling is a two-step process. First, the population is grouped into clusters. (Natural clusters such as schools or classrooms might already exist.) Second, a sample of clusters is selected, and all units within the selected clusters are included in the survey (for ex-ample, all are administered tests). The survey frame may dictate the method of sampling. If the units of the population are naturally grouped together, creating a frame of these groups and sampling them is often easier than trying to create a list of all individual units in the
FIGURE 8.2
Systematic Random Sample of Schools
Source: Authors’ representation.Note: N = 45 schools; n = 7 schools (gray); step = 6; start = 4.
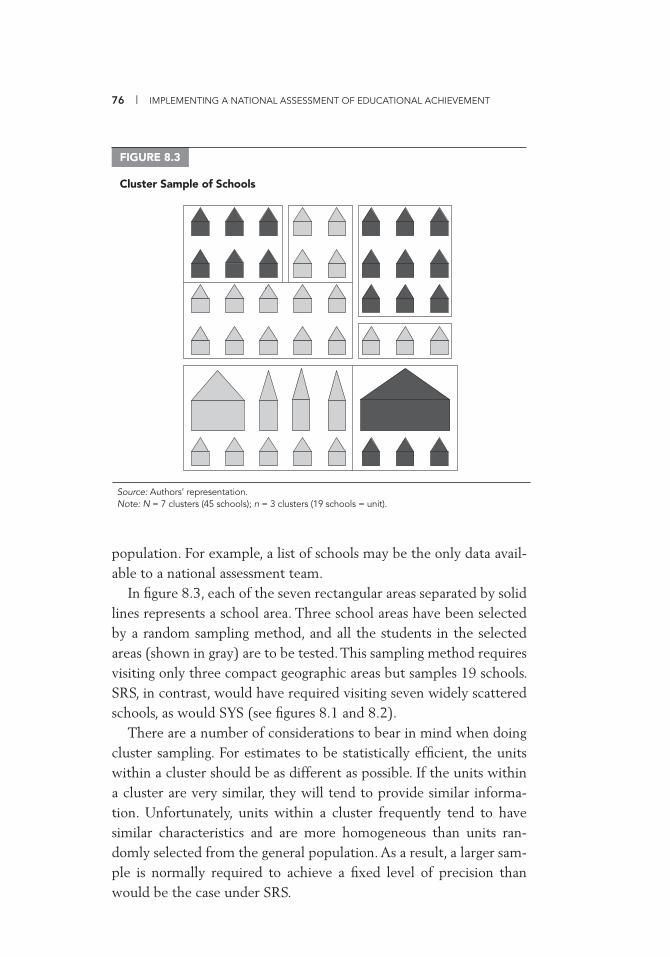
76 | IMPLEMENTING A NATIONAL ASSESSMENT OF EDUCATIONAL ACHIEVEMENT
population. For example, a list of schools may be the only data avail-able to a national assessment team.
In fi gure 8.3, each of the seven rectangular areas separated by solid lines represents a school area. Three school areas have been selected by a random sampling method, and all the students in the selected areas (shown in gray) are to be tested. This sampling method requires visiting only three compact geographic areas but samples 19 schools. SRS, in contrast, would have required visiting seven widely scattered schools, as would SYS (see fi gures 8.1 and 8.2).
There are a number of considerations to bear in mind when doing cluster sampling. For estimates to be statistically effi cient, the units within a cluster should be as different as possible. If the units within a cluster are very similar, they will tend to provide similar informa-tion. Unfortunately, units within a cluster frequently tend to have similar characteristics and are more homogeneous than units ran-domly selected from the general population. As a result, a larger sam-ple is normally required to achieve a fi xed level of precision than would be the case under SRS.
FIGURE 8.3
Cluster Sample of Schools
Source: Authors’ representation.Note: N = 7 clusters (45 schools); n = 3 clusters (19 schools = unit).
ELEMENTS OF SAMPLING THEORY | 77
Some schools or education systems organize classes taking into account factors such as perceived student competence in curriculum subject areas. In such a situation, a school might, for instance, have suffi cient student numbers at a particular level to form three classes. One class might consist of students who are expected (on the basis of previous years’ results or their expressed interest) to continue their studies in mathematics or the sciences, another might consist of students who have an aptitude or preference for the humanities, and a third class might be formed from students who are not expected to persist much longer in school. In this situation, one would expect that most of the students in the fi rst class would do well on mathe-matics tests, the second group perhaps less well at mathematics but well at languages, while quite likely the third group would appear relatively weak in both areas. In such circumstances, cluster sampling would be statistically quite ineffi cient: selection of a single entire class would suggest that the students are strong in mathematics and weak at languages, or the reverse, or weak in both areas. Such a situ-ation suggests that from the point of view of sampling effi ciency, se-lecting a few students from each of the three classes would be better to increase the chances of obtaining a balanced picture of student achievement levels in the school. However, practical reasons often exist—related to the research objectives, administrative constraints, or testing costs—for selecting intact classrooms. Reasons for selecting intact classes include a school principal’s or manager’s interest in minimizing the amount of disruption in a school during testing or a researcher’s interest in applying a specifi c analytical model or in quantifying the relative infl uence of the school, teacher, or class on individual achievement.
The statistical effi ciency of cluster sampling depends on how ho-mogeneous the clusters are, how many population units are in each cluster, and the number of clusters that are sampled. A standard mea-sure of this effi ciency (really, ineffi ciency) is called the clustering effect or the design effect. A value of 1 means that the design in question is as effi cient as SRS. If the design effect is much larger than 1, as is usu-ally the case in cluster sampling, the design is less effi cient. A cluster sample with a design effect of 5 would need to draw a sample size fi ve times larger than that of a simple random sample to yield estimates of comparable precision.
78 | IMPLEMENTING A NATIONAL ASSESSMENT OF EDUCATIONAL ACHIEVEMENT
The value of the design effect depends on two factors: (a) the num-ber of units in the cluster (number of students in the class, in this in-stance) and (b) the degree to which students in the same class re-semble each other more than they resemble those in other classes or schools with respect to some variable or variables to be measured. This latter measure is known as the intraclass correlation, commonly referred to as roh (rate of homogeneity) or sometimes as rho. In the case of test scores in mathematics, which this exercise takes as the most important assessment variable in Sentz’s national assessment, this in-traclass correlation is frequently as high as 0.25 or even 0.30. The value of roh would probably be different for other variables.
National assessment sampling or statistical personnel should use the following formula to calculate the design effect (deff) (Kish 1965; Lohr 1999):
deff = (1 + roh × (M − 1)),
where M is the cluster (class) size and roh is the rate of homogeneity or intraclass correlation. For a roh = 0.25 and class size M = 35, deff = (1 + 0.25 × (35 − 1)) = 1 + 8.5 = 9.5.
Estimates of roh may be obtained from previous national assess-ments of similar or adjacent grade levels. If such data are not available, estimates may be obtained from public examinations results or “bor-rowed” from neighboring country assessments conducted in a country with similar educational characteristics. When neighboring units are similar, selecting many small clusters is statistically more effi cient than selecting a few larger clusters.
In the case of Sentz, the recommended design is to select a certain number of schools and then to take one entire class as a cluster in each selected school. Although this approach is used largely for ad-ministrative reasons, a substantial price is paid in terms of statistical effi ciency because the intraclass correlations and large class sizes are likely to make the design effects quite high.
STRATIFICATION
SRS and SYS of elements and of clusters are simple, basic methods for drawing random samples, but they may not be the most effi cient
ELEMENTS OF SAMPLING THEORY | 79
methods. A good strategy often makes use of available information on the units of interest by creating homogeneous groups of units—called strata—and then applies some basic sampling method within the strata.
Before sample selection, the national assessment team may want to organize sampling so that particular groups of units or specifi c areas of the country are covered with certainty. Policy makers, for instance, may wish to obtain estimates of learning achievement for provinces or regions, or they may wish to be able to look at data from different linguistic groups or from large and small schools. The team may hope that the random choices will yield a suffi cient number of units in each province or region to allow for reliable estimates. Alternatively, it might arrange its sampling strategy by fi rst listing the population of schools in groups (for example, provinces or linguistic groups) and then selecting part of the total sample from each of these groups. This strategy, termed stratifi cation, can be used with any probability sam-pling method. Stratifi cation requires a bit more work at the beginning of the national assessment, but the rewards often far outweigh the extra work required. Schools have been stratifi ed in national assess-ments by location, language, religious affi liation, source of funding, and degree of urbanization.
Experience shows that stratifying on too many criteria proves counterproductive; in fact, the requirements imposed by fi ne stratifi -cation often increase the sample size. Furthermore, the number of units that end up in the “wrong” stratum may increase with the num-ber of strata, especially those that are based on more volatile or less reliable information, such as number of staff members or student enrollment.
Depending on the situation, some national assessments use one, two, or more stratifi cation variables. Stratifi cation can improve both statistical and overall effi ciency, reducing the size (and cost) of the sample while maintaining the level of reliability. This course of action requires the input of a survey statistician used to dealing with such problems. Figure 8.4 illustrates a stratifi ed random sample of 45 schools using one 3-level stratifi cation variable.
A population can be stratifi ed by any variable for which data are available for all units of the frame prior to the assessment. This infor-
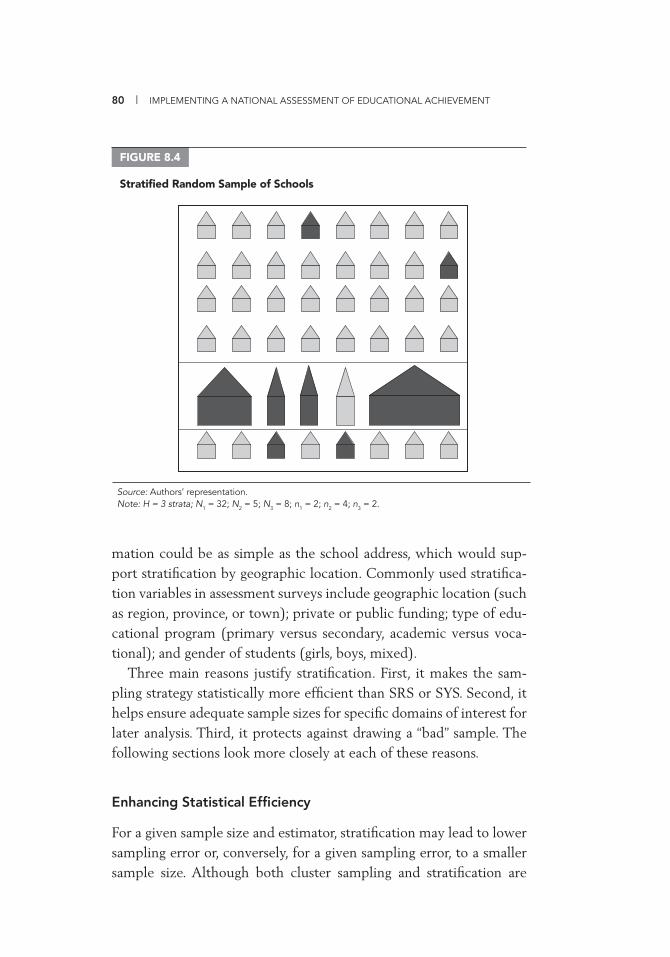
80 | IMPLEMENTING A NATIONAL ASSESSMENT OF EDUCATIONAL ACHIEVEMENT
mation could be as simple as the school address, which would sup-port stratifi cation by geographic location. Commonly used stratifi ca-tion variables in assessment surveys include geographic location (such as region, province, or town); private or public funding; type of edu-cational program (primary versus secondary, academic versus voca-tional); and gender of students (girls, boys, mixed).
Three main reasons justify stratifi cation. First, it makes the sam-pling strategy statistically more effi cient than SRS or SYS. Second, it helps ensure adequate sample sizes for specifi c domains of interest for later analysis. Third, it protects against drawing a “bad” sample. The following sections look more closely at each of these reasons.
Enhancing Statistical Effi ciency
For a given sample size and estimator, stratifi cation may lead to lower sampling error or, conversely, for a given sampling error, to a smaller sample size. Although both cluster sampling and stratifi cation are
FIGURE 8.4
Stratifi ed Random Sample of Schools
Source: Authors’ representation.Note: H = 3 strata; N
1 = 32; N 2 = 5; N
3 = 8; n 1 = 2; n
2 = 4; n 3 = 2.
ELEMENTS OF SAMPLING THEORY | 81
methods of grouping units in the population, in stratifi ed sampling, samples of units are drawn within each stratum, whereas in cluster sampling, samples of clusters are drawn and everyone in the cluster is assessed. Stratifi cation generally increases the precision of estimation with respect to SRS, whereas clustering generally decreases it (be-cause neighboring units are usually similar).
For improved statistical effi ciency of a sampling strategy with re-spect to SRS, strong homogeneity must exist within a stratum (that is, units within a stratum should be similar with respect to the variable of interest), and the strata themselves must be as different as possible (with respect to the same variable of interest). Generally, this goal is achieved if the stratifi cation variables are correlated with the survey variable of interest (such as literacy achievement and rural versus ur-ban location).
The example of the three classes (mathematics, humanities, and potential early leavers) already given for cluster sampling can be ex-tended for illustration. Suppose the provincial lists of classes could be organized into three strata, corresponding to the three types of classes. Random selection of classes from the fi rst stratum would in general yield samples of students strong in mathematics, irrespective of the classes that were selected. Similarly, the second stratum would result in a selection of students who generally were relatively weak in math-ematics. With stratifi ed random sampling, the sample from each of the three strata should give a result that is closely representative of the strata as a whole and, when the results are combined, should give a precise estimate for the province as a whole.
Stratifi cation can increase the precision of the estimates relative to SRS. According to Cochran (1977, 90),
If each stratum is homogeneous, in that the measurements vary little from one unit to another, a precise estimate of any stratum mean can be obtained from a small sample in that stratum. These estimates can then be combined into a precise estimate for the whole population.
Stratifi cation is particularly important in the case of skewed popula-tions (that is, when the distribution of values of a variable of interest is not symmetric, but leans to the right or the left). For example, the fi rst-stage sampling frame might simply be a list of schools containing approximate but out-of-date enrollment fi gures. In that case, more
82 | IMPLEMENTING A NATIONAL ASSESSMENT OF EDUCATIONAL ACHIEVEMENT
accurate estimation of total enrollment might in itself be a goal of the assessment survey. If SRS is used, a few schools can exert a large infl u-ence on the estimates of total enrollment. If the largest schools hap-pen to be selected, they can cause serious overestimation of the total. Stratifying by size (a stratum for the largest schools, a stratum for midsize schools, and a stratum for small schools) can help ensure that schools selected in each stratum represent other schools of roughly the same size in the population.
Stratifying by school size appears reasonable if an estimate of the size of the enrolled population is desired. Stratifying by school size, however, may not be recommended if the variable of interest is, say, average age of mathematics teachers, because no reason exists to assume a correlation between teacher age and school size. Frequently, stratifi cation variables are chosen on the basis of their expected cor-relation with the key variables being assessed (such as language or mathematics) in the national assessment. Note that a stratifi cation approach that is statistically effi cient for one survey variable may not work well for other variables.
Ensuring Coverage of the Domain of Interest
In a national assessment, policy makers may seek estimates of achieve-ment for subgroups of the population, called domains, as well as for the total population. They may, for example, wish to compare achieve-ment levels of students in different provinces or regions, or of girls and boys, or of students attending different types of schools (public or private). Creating estimates for subgroups is called domain estimation. If domain estimates are required, the sample design should ensure that the sample size for each domain is adequate. Ideally, the strata should correspond to the domains of interest.
Avoiding “Bad” Samples
Stratifi cation helps guard against drawing a “bad” or unusual sample. In SRS, sample selection is left entirely to chance. Stratifi ed sampling attempts to restrict potentially extreme samples by taking steps to ensure that certain categories of the student population are included
ELEMENTS OF SAMPLING THEORY | 83
in the sample. For example, if a national assessment focused on the effects of school size on learning achievement, the sample design could include stratifi cation by school size.
The national assessment team in Sentz considered various stratifi -cation options. Limiting the frame to the two regions, Northeast and Southwest, was considered inadequate because it would not provide suffi ciently informative data for policy makers. Instead, the team opted to stratify by province (three in the Northeast and two in the Southwest). Calculating regional estimates would be a simple sum-mation process when provincial-level estimates were available.
Furthermore, if the fi les for each provincial stratum are sorted by town density (that is, urban or rural) before the selection of schools, systematic sampling (whether with equal probability or with proba-bility proportional to the size of city) will guarantee that some urban and some rural schools are selected, yielding reasonably effi cient do-main estimates if urban compared with rural analysis is later thought to be important. The national assessment team felt that using the towns directly as strata was unnecessary (it would have yielded 33 strata, a number of which would have only two eligible schools).
ALLOCATION OF THE SAMPLE ACROSS STRATA
After the population has been divided into strata, the national assess-ment team, with guidance from its sampling adviser, should deter-mine how many units should be sampled from each stratum. This step is referred to as allocation of the sample.
Inclusion probabilities (that is, the probability that the unit will be chosen in a sample) usually vary from stratum to stratum because they depend on how the sample is allocated to each stratum. To cal-culate the inclusion probabilities for most sample designs, one must consider the size of the sample and the size of the population in each stratum. To illustrate, consider a population of N = 1,000 schools stratifi ed into two groups, rural and urban. The urban group or stra-tum has N1 = 250 schools and the rural stratum has N2 = 750 schools. If SRS is used to select n1 = 50 schools from the fi rst stratum and n2 = 50 schools from the second, then the probability that a school is
84 | IMPLEMENTING A NATIONAL ASSESSMENT OF EDUCATIONAL ACHIEVEMENT
selected from the fi rst stratum is π1 = 50/250 = 1/5, and the probabil-ity that a school in the second stratum is selected is π2 = 50/750 = 1/15. Schools thus have different probabilities of inclusion depending on their location or stratum. In this instance, an urban school is more likely to be selected than a rural school.
Allocating the national assessment sample to the strata can be a diffi cult task. With a fi xed budget and limited (if any) knowledge of the characteristics of the units of interest, most of the theory on strat-ifi cation and optimal sample allocation is of limited use. Frequently, resorting to practical considerations and seeking expert advice are necessary to devise a viable sample allocation strategy.
Two common sample allocation strategies are (a) equal allocation and (b) proportional allocation. With equal allocation, each stratum is allocated the same number of sample units; this method is recom-mended for well-balanced strata. In proportional allocation, each stra-tum receives a share of the sample that corresponds to its share of the population; this method is the preferred option when national esti-mates are of greatest interest. Equal allocation may not be as good as proportional allocation for national estimates, but it may be prefera-ble if domain estimates are required and if strata and domains corre-spond. Equal allocation can also help ensure that enough units are sampled from each domain or stratum.
If proportional allocation is used, the sample of schools must be allocated so that the number of students in the sample in each stra-tum is proportional to the number of students in the population in each stratum. Some schools may have a measure of size (MOS) of zero for the target population. They should remain in the frame if they have some chance of acquiring eligible students during the test-ing period; they should be given a preliminary MOS value of one and be included in the relevant totals. If virtually no chance exists that these schools will acquire any eligible students in time for the assess-ment, they should be removed from the sampling frame.
In general, if separate estimates are required for strata, then equal levels of sampling precision will usually be required for each stratum. Such precision usually requires sampling an equal number of schools in each stratum regardless of the size of the stratum. Because each stra-tum should have a minimum of two participating schools to allow for
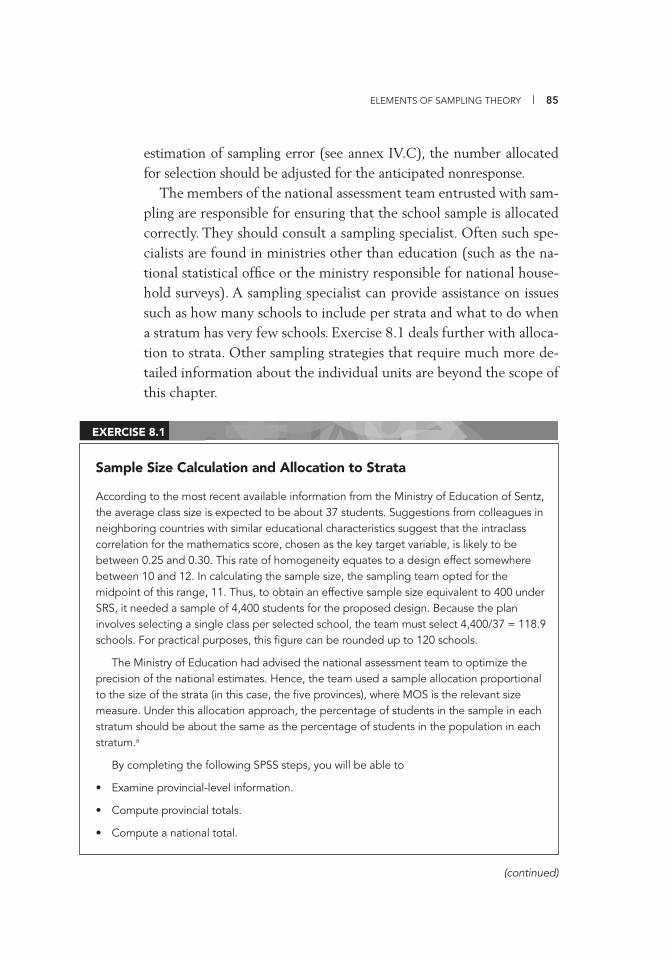
ELEMENTS OF SAMPLING THEORY | 85
estimation of sampling error (see annex IV.C), the number allocated for selection should be adjusted for the anticipated nonresponse.
The members of the national assessment team entrusted with sam-pling are responsible for ensuring that the school sample is allocated correctly. They should consult a sampling specialist. Often such spe-cialists are found in ministries other than education (such as the na-tional statistical offi ce or the ministry responsible for national house-hold surveys). A sampling specialist can provide assistance on issues such as how many schools to include per strata and what to do when a stratum has very few schools. Exercise 8.1 deals further with alloca-tion to strata. Other sampling strategies that require much more de-tailed information about the individual units are beyond the scope of this chapter.
Sample Size Calculation and Allocation to Strata
According to the most recent available information from the Ministry of Education of Sentz, the average class size is expected to be about 37 students. Suggestions from colleagues in neighboring countries with similar educational characteristics suggest that the intraclass correlation for the mathematics score, chosen as the key target variable, is likely to be between 0.25 and 0.30. This rate of homogeneity equates to a design effect somewhere between 10 and 12. In calculating the sample size, the sampling team opted for the midpoint of this range, 11. Thus, to obtain an effective sample size equivalent to 400 under SRS, it needed a sample of 4,400 students for the proposed design. Because the plan involves selecting a single class per selected school, the team must select 4,400/37 = 118.9 schools. For practical purposes, this fi gure can be rounded up to 120 schools.
The Ministry of Education had advised the national assessment team to optimize the precision of the national estimates. Hence, the team used a sample allocation proportional to the size of the strata (in this case, the fi ve provinces), where MOS is the relevant size measure. Under this allocation approach, the percentage of students in the sample in each stratum should be about the same as the percentage of students in the population in each stratum.a
By completing the following SPSS steps, you will be able to
• Examine provincial-level information.
• Compute provincial totals.
• Compute a national total.
EXERCISE 8.1
(continued)

86 | IMPLEMENTING A NATIONAL ASSESSMENT OF EDUCATIONAL ACHIEVEMENT
• Compute the proportional allocation of a sample size of n = 120 schools to the strata (provinces).
• Store all of this information for later use.
First, open the PROVINCES fi le, using the following commands:
File – Open – Data – Look inb
…\BASE FILES\PROVINCES.SAV
Open
You will see a total MOS (PROV_SIZE) for rural and urban parts of each province. The national total will also be required; hence, a dummy COUNTRY variable will be created and set to 1 as follows:
Select Transform – Compute Variable. Type COUNTRY in Target Variable. Type 1 in Numeric expression, and click OK.
Select Data – Aggregate. Then move COUNTRY PROVINCE to Break variables. Next, move PROV_SIZE to Summaries of variables.
Click Function and select Sum. Click Continue.
Click Name & Label. Type PROV_TOT as a name, and click Continue.
Click Create a new dataset… and type in a name, PROVTOT. Click OK.
You should see PROV_TOT data for each of the fi ve provinces; check the output windows because the results may appear in a different window Untitled [PROVTOT]. The PROV_TOT data for province 2 is 4,448.
Bring the PROVTOT data set you just created to the view screen and select Data – Aggregate. Next, move COUNTRY to Break variables. Then, move PROV_TOT to Summaries of variables.
Click Function and select Sum. Click Continue. Now, click Name & Label. Type COUNTRY_TOT as a name, and click Continue. Click Add aggregated…. Finally, click OK.
You should see a national total of 27,654 in the Data View screen.
Now the data set PROVTOT contains both the national and the provincial totals. The provincial allocation of 120 schools can now be computed, and the results stored for later use. This exercise uses the RND function to obtain integer values.
Select Transform – Compute Variable. Then type ALLOC in Target Variable. Type RND(120*PROV_TOT/COUNTRY_TOT) in Numeric expression. Click OK.
EXERCISE 8.1 (continued)
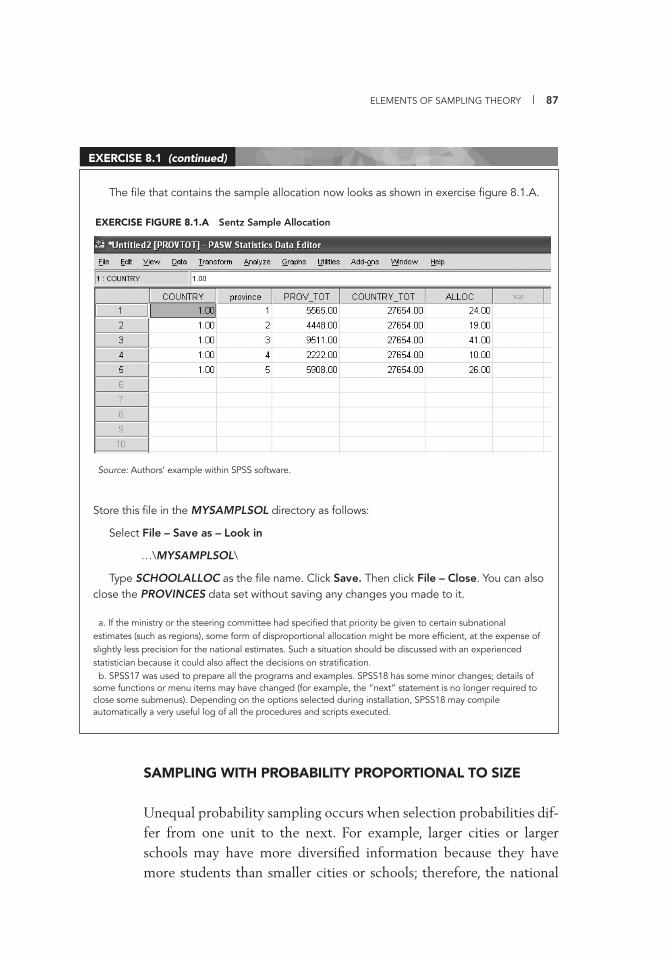
ELEMENTS OF SAMPLING THEORY | 87
SAMPLING WITH PROBABILITY PROPORTIONAL TO SIZE
Unequal probability sampling occurs when selection probabilities dif-fer from one unit to the next. For example, larger cities or larger schools may have more diversifi ed information because they have more students than smaller cities or schools; therefore, the national
The fi le that contains the sample allocation now looks as shown in exercise fi gure 8.1.A.
Store this fi le in the MYSAMPLSOL directory as follows:
Select File – Save as – Look in
…\MYSAMPLSOL\
Type SCHOOLALLOC as the fi le name. Click Save. Then click File – Close. You can also close the PROVINCES data set without saving any changes you made to it.
a. If the ministry or the steering committee had specifi ed that priority be given to certain subnational estimates (such as regions), some form of disproportional allocation might be more effi cient, at the expense of slightly less precision for the national estimates. Such a situation should be discussed with an experienced statistician because it could also affect the decisions on stratifi cation.
b. SPSS17 was used to prepare all the programs and examples. SPSS18 has some minor changes; details of some functions or menu items may have changed (for example, the “next” statement is no longer required to close some submenus). Depending on the options selected during installation, SPSS18 may compile automatically a very useful log of all the procedures and scripts executed.
EXERCISE 8.1 (continued)
EXERCISE FIGURE 8.1.A Sentz Sample Allocation
Source: Authors’ example within SPSS software.
88 | IMPLEMENTING A NATIONAL ASSESSMENT OF EDUCATIONAL ACHIEVEMENT
assessment sampling adviser may give priority, in the form of a higher probability of selection, to the larger units over the smaller ones. Smaller towns or schools may, in some instances, yield little additional information, and data collection costs may be almost as expensive as for larger units. In the interest of economy, the sampling team may be tempted to restrict sampling to the larger units, perhaps even to limit selection to the 5 or 10 largest towns or schools. If this happens, the smaller units have effectively no chance of being selected. The sample is not a probability sample from the defi ned population or from the available sampling frame because many schools have been excluded.
An alternative approach would be to adopt an unequal probability sampling plan that would give a higher probability to the larger units and a smaller probability to the smaller units. Under this plan, all units would have some chance of being selected, but the larger and more informative units would receive preferential treatment. Assum-ing an example of a population of 12 schools, 4 with 100 students and 8 with 50 students each, one could draw a sample of students by se-lecting the large schools with probability 1/4 (or 100/400) and the smaller schools with probability 1/8 (or 50/400). The larger schools would have twice as many chances of being selected as the smaller schools, but all schools would have some chance of being drawn.
In probability sampling, each sampled unit represents a certain number of units in the population in such a way that the sample as a whole represents the entire population. The number of population units represented by a given sampled unit is called its sampling weight. When the sample is drawn with equal probability (for example, two schools selected with probability 1/10 each), then each selected school represents the same number of schools in the population. Likewise, in unequal probability sampling, the number of schools in the population represented by a sampled school will vary according to the chances the school had of being selected: the more chances of being selected, the smaller the sampling weight and vice versa.
The major international studies of educational achievement (such as Programme for International Student Assessment, Progress in In-ternational Reading Literacy Study, and Trends in International Math-ematics and Science Study) use unequal probability sampling. The samples are drawn with an unequal probability method known as
ELEMENTS OF SAMPLING THEORY | 89
PPS, which stands for probability proportional to size. Typically, the school selection probabilities are based on their MOS (that is, the number of students in the target population in each school). For ex-ample, in a city with fi ve schools having 400, 250, 200, 100, and 50 students for a total of 1,000 students, PPS sampling would result in school selection probabilities proportional to these sizes: 400/1,000, 250/1,000, 200/1,000, 150/1,000, and 50/1,000, respectively, if only one school is to be selected, or 800/1,000, 500/1,000, 400/1,000, 300/1,000, and 100/1,000 if two schools are to be selected. Note that if three schools are to be selected in this example, the fi rst school can-not be given a probability of 1,200/1,000, which is greater than 1; it must be selected with certainty. The probability of selection with PPS for the two remaining schools selected is determined by reallocating the remaining size measures among the other four schools. The selec-tion probabilities under PPS of these four schools would be 500/600, 400/600, 200/600, and 100/600.
This sampling approach can be applied to school-level sampling frames as well as to area-based sampling frames (such as lists of prov-inces or towns) if the appropriate MOS data are known.
MULTISTAGE SAMPLING
In many surveys of human populations, direct access to the individu-als is not possible. A central up-to-date registry of persons may not exist, or if it does, its use may be strictly regulated, or it may be out of the reach of survey takers. This situation is almost always the case with educational assessments of students within classrooms, within schools, within cities, or within other jurisdictions. Indirect access to members of the target population may still be possible by using a technique called multistage sampling. In multistage sampling, a list of coarse units is prepared (such as geographic units or schools in educa-tion surveys), and some of those units are sampled. For each sampled unit, a list of smaller units is prepared (typically, addresses or houses or, in educational surveys, teachers or students). A sample of those smaller units is then selected within each unit selected earlier, and the process continues until the sampling team identifi es the individuals to
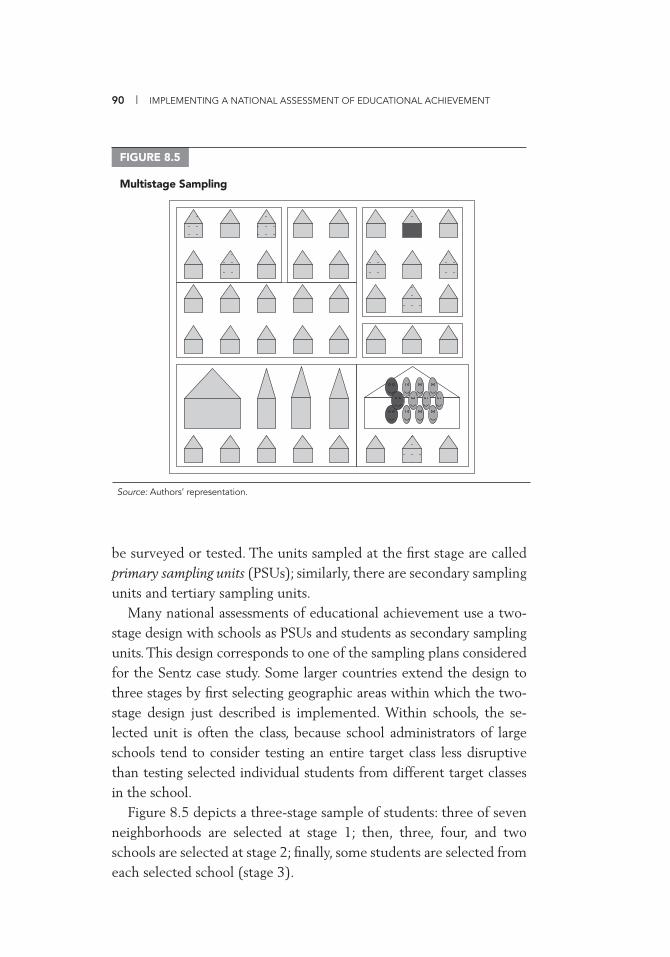
90 | IMPLEMENTING A NATIONAL ASSESSMENT OF EDUCATIONAL ACHIEVEMENT
be surveyed or tested. The units sampled at the fi rst stage are called primary sampling units (PSUs); similarly, there are secondary sampling units and tertiary sampling units.
Many national assessments of educational achievement use a two-stage design with schools as PSUs and students as secondary sampling units. This design corresponds to one of the sampling plans considered for the Sentz case study. Some larger countries extend the design to three stages by fi rst selecting geographic areas within which the two-stage design just described is implemented. Within schools, the se-lected unit is often the class, because school administrators of large schools tend to consider testing an entire target class less disruptive than testing selected individual students from different target classes in the school.
Figure 8.5 depicts a three-stage sample of students: three of seven neighborhoods are selected at stage 1; then, three, four, and two schools are selected at stage 2; fi nally, some students are selected from each selected school (stage 3).
FIGURE 8.5
Multistage Sampling
Source: Authors’ representation.
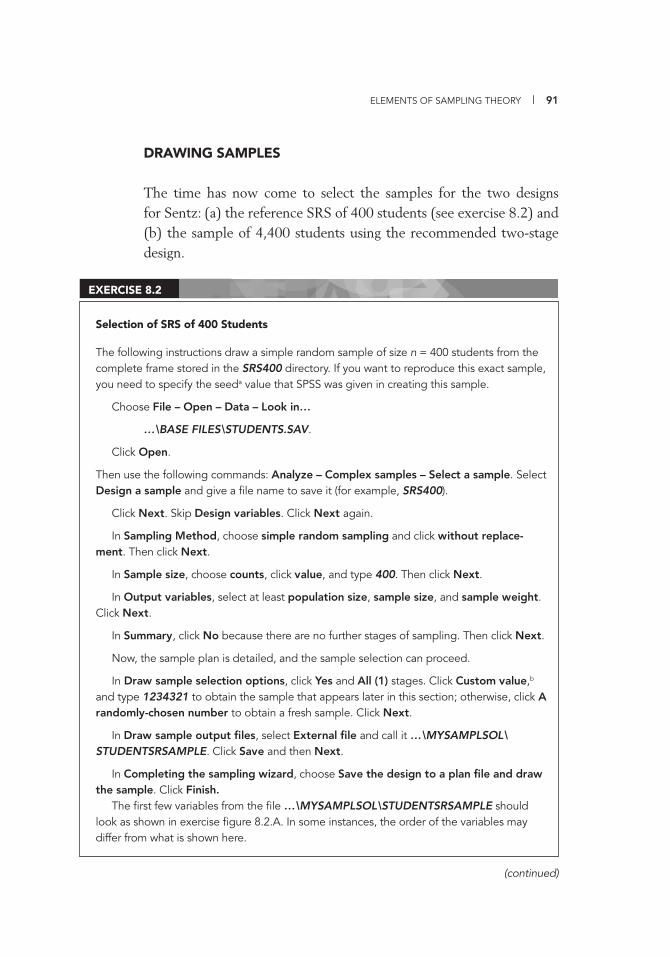
ELEMENTS OF SAMPLING THEORY | 91
Selection of SRS of 400 Students
The following instructions draw a simple random sample of size n = 400 students from the complete frame stored in the SRS400 directory. If you want to reproduce this exact sample, you need to specify the seeda value that SPSS was given in creating this sample.
Choose File – Open – Data – Look in…
…\BASE FILES\STUDENTS.SAV.
Click Open.
Then use the following commands: Analyze – Complex samples – Select a sample. Select Design a sample and give a fi le name to save it (for example, SRS400).
Click Next. Skip Design variables. Click Next again.
In Sampling Method, choose simple random sampling and click without replace-ment. Then click Next.
In Sample size, choose counts, click value, and type 400. Then click Next.
In Output variables, select at least population size, sample size, and sample weight. Click Next.
In Summary, click No because there are no further stages of sampling. Then click Next.
Now, the sample plan is detailed, and the sample selection can proceed.
In Draw sample selection options, click Yes and All (1) stages. Click Custom value,b and type 1234321 to obtain the sample that appears later in this section; otherwise, click A randomly-chosen number to obtain a fresh sample. Click Next.
In Draw sample output fi les, select External fi le and call it …\MYSAMPLSOL\STUDENTSRSAMPLE. Click Save and then Next.
In Completing the sampling wizard, choose Save the design to a plan fi le and draw the sample. Click Finish.
The fi rst few variables from the fi le …\MYSAMPLSOL\STUDENTSRSAMPLE should look as shown in exercise fi gure 8.2.A. In some instances, the order of the variables may differ from what is shown here.
EXERCISE 8.2
(continued)
DRAWING SAMPLES
The time has now come to select the samples for the two designs for Sentz: (a) the reference SRS of 400 students (see exercise 8.2) and (b) the sample of 4,400 students using the recommended two-stage design.
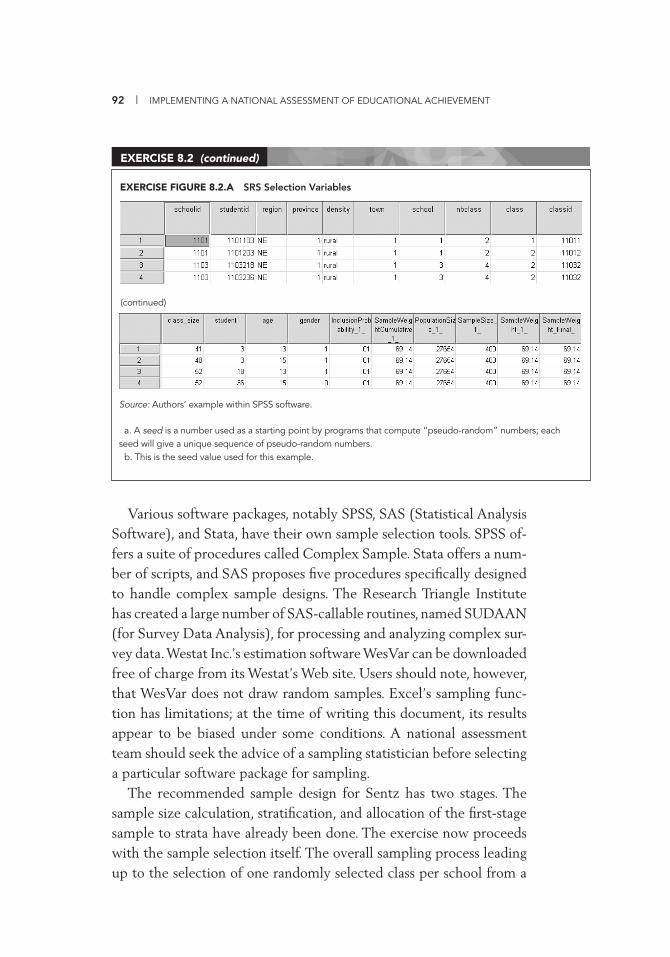
92 | IMPLEMENTING A NATIONAL ASSESSMENT OF EDUCATIONAL ACHIEVEMENT
Various software packages, notably SPSS, SAS (Statistical Analysis Software), and Stata, have their own sample selection tools. SPSS of-fers a suite of procedures called Complex Sample. Stata offers a num-ber of scripts, and SAS proposes fi ve procedures specifi cally designed to handle complex sample designs. The Research Triangle Institute has created a large number of SAS-callable routines, named SUDAAN (for Survey Data Analysis), for processing and analyzing complex sur-vey data. Westat Inc.’s estimation software WesVar can be downloaded free of charge from its Westat’s Web site. Users should note, however, that WesVar does not draw random samples. Excel’s sampling func-tion has limitations; at the time of writing this document, its results appear to be biased under some conditions. A national assessment team should seek the advice of a sampling statistician before selecting a particular software package for sampling.
The recommended sample design for Sentz has two stages. The sample size calculation, stratifi cation, and allocation of the fi rst-stage sample to strata have already been done. The exercise now proceeds with the sample selection itself. The overall sampling process leading up to the selection of one randomly selected class per school from a
a. A seed is a number used as a starting point by programs that compute “pseudo-random” numbers; each seed will give a unique sequence of pseudo-random numbers.
b. This is the seed value used for this example.
EXERCISE 8.2 (continued)
EXERCISE FIGURE 8.2.A SRS Selection Variables
Source: Authors’ example within SPSS software.
(continued)
ELEMENTS OF SAMPLING THEORY | 93
randomly selected sample of schools is outlined in exercise 8.3. Be-cause it involves several steps, for ease of reading, the exercise is di-vided into a number of steps (exercises 8.3 to 8.8).
The school frame and school allocation fi les are merged in exercise 8.4. Once merging the school and school allocation fi les is completed, the fi rst stage of sample selection can begin. This requires selection of 120 schools (see exercise 8.1) from a total of 227 schools (exer-cise 8.5).
If the sample just selected does not readily appear on the screen, open the fi le …\MYSAMPLSOL\PPS_SAMPLE_OF_SCHOOLS. Figure 8.6 presents an excerpt from the fi rst few lines of the data from …\MYSAMPLSOL\PPS_SAMPLE_OF_SCHOOLS that should be on your screen.
Now that the sample of schools is selected, the next step is to se-lect one classroom per selected school. This step is similar to the sim-ple random sample that was drawn earlier, selecting one secondary
Stratifi ed PPS without Replacement, Selection of Schools: Reading School and School Allocation Files
The sample selection must be done independently in each stratum (in this case, within each province). Some answer fi les have been placed in the folder 2STG4400 to facilitate this task. A sample allocation has already been computed and stored that must be specifi ed here. You have already com pleted the sample allocation task (exercise 8.1) and you will use these data in the following task. This allocation will be attached to the sampling frame before selection of schools can proceed. Start by sorting the fi les by province. Again, to reproduce the sampling result you will see later, you must use the seed given to SPSS. The sample is stored in a fi le named …2STG4400\PPS_SAMPLE_OF_SCHOOLS.
First, read and sort the school frame using the following commands:
File – Open – Data – Look in
…BASE FILES\SCHOOLS.SAV
Click Open, and select Data – Sort cases. Move PROVINCE to Sort by and click OK.
Next, read and sort the school allocation fi le using the following commands:
File – Open – Data – Look in
…\MYSAMPLSOL\SCHOOLALLOC.SAV
Click Open. Select Data – Sort cases. Move PROVINCE to Sort by and click OK.
EXERCISE 8.3

94 | IMPLEMENTING A NATIONAL ASSESSMENT OF EDUCATIONAL ACHIEVEMENT
Stratifi ed PPS without Replacement, Selection of Schools: Merging School and School Allocation Files
In SPSS, the order in which the fi les are manipulated is important: the larger fi le (school frame) should be on the screen while the command menus are clicked.
Bring the SCHOOLS fi le to the screen; select the fi le as follows: Data – Merge fi les – Add variables. Choose SCHOOLALLOC from Open dataset, and click Continue.
Click Match cases on key variables. Move PROVINCE from the Excluded variables to the Key variables.
Move COUNTRY, PROV_TOT, and COUNTRY_TOT from the New active dataset to the Excluded variables.
Click Non-active dataset is keyed table and, fi nally, click OK. Click OK if the following warning message appears: “Warning: Keyed match will fail if data are not sorted in ascending order of key variables.”
The variable ALLOC should now appear as the last variable of the SCHOOLS data set. For safety, at this point you may want to save this SCHOOLS fi le in your fi le …\MYSAMPLSOL\SCHOOLS.
EXERCISE 8.4
Stratifi ed PPS without Replacement, Selection of Schools: Selecting Schools
Verify that your SCHOOLS fi le is on the view screen. Then use the following commands:
Analyze – Complex samples – Select a sample
Select Design sample and give a fi le name to save it (for example, 2STAGE_1). If SPSS will not readily accept a name, click Browse and select the MYSAMPLSOL subdirectory on your drive before you type in the fi le name. Click Next.
In Design variables, take the following actions: Move PROVINCE to Stratify by. Move SCHOOLID to Clusters. Type a name in Stage Label, for example, STAGE1. Click Next.
In Sampling Method take the following actions: Select PPS Systematic. Move SCHOOL_SIZE to Measure of size – Read from variable. Click Next.
In Sample size take the following actions: Choose Read values from variable. Move ALLOC to that selection box. Click Next.
In Output variables, select population size, sample size, and sample weight. Click Next.
EXERCISE 8.5
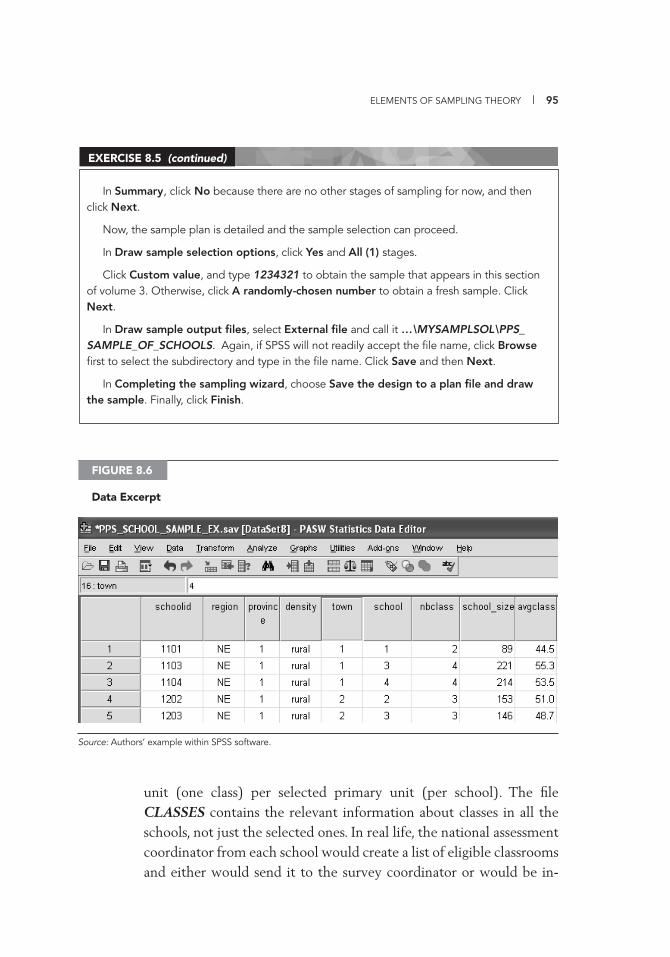
ELEMENTS OF SAMPLING THEORY | 95
unit (one class) per selected primary unit (per school). The fi le CLASSES contains the relevant information about classes in all the schools, not just the selected ones. In real life, the national assessment coordinator from each school would create a list of eligible classrooms and either would send it to the survey coordinator or would be in-
In Summary, click No because there are no other stages of sampling for now, and then click Next.
Now, the sample plan is detailed and the sample selection can proceed.
In Draw sample selection options, click Yes and All (1) stages.
Click Custom value, and type 1234321 to obtain the sample that appears in this section of volume 3. Otherwise, click A randomly-chosen number to obtain a fresh sample. Click Next.
In Draw sample output fi les, select External fi le and call it …\MYSAMPLSOL\PPS_SAMPLE_OF_SCHOOLS. Again, if SPSS will not readily accept the fi le name, click Browse fi rst to select the subdirectory and type in the fi le name. Click Save and then Next.
In Completing the sampling wizard, choose Save the design to a plan fi le and draw the sample. Finally, click Finish.
EXERCISE 8.5 (continued)
FIGURE 8.6
Data Excerpt
Source: Authors’ example within SPSS software.
96 | IMPLEMENTING A NATIONAL ASSESSMENT OF EDUCATIONAL ACHIEVEMENT
Stratifi ed PPS without Replacement, Selection of Schools: Identifying Eligible Classes
Read the school sample and sort by SCHOOLID using the following commands:
File – Open – Data – Look in
…\MYSAMPLSOL\PPS_SAMPLE_OF_SCHOOLS.SAV
Then, click Open. Select Data – Sort cases. Move SCHOOLID to Sort by. Click OK.Read the list of classrooms and sort by SCHOOLID using the following commands:
File – Open – Data – Look in
…\BASE FILES\CLASSES.SAV
Click Open. Note: School 1101 has two classes, one with 41 students and the second with 48 students.
Select Data – Sort cases. Move SCHOOLID to Sort by. Click OK.
Merge the school frame and the school allocation fi le; again, which fi le is visible on screen and which is the “keyed table” (see instructions below) are important to SPSS.
Bring the PPS_SAMPLE_OF_SCHOOLS fi le to the screen. Then use the following commands:
Data – Merge fi les – Add variables
Choose CLASSES from the Open dataset. Click Continue. Then click Match cases on key variables.
Move SCHOOLID from the Excluded variables to the Key variables. Click Active dataset is keyed table. Click OK and then click OK again.
These steps will modify the PPS_SAMPLE_OF_SCHOOLS and add classroom-level information, even for schools that were not selected. Those records must be removed.
To remove the unnecessary records, use the Filter and retain those cases where PROVINCE has a numerical value, as follows:
Data – Select Cases – Use fi lter variable
EXERCISE 8.6
structed to draw a sample of one eligible class at random, according to a prescribed series of national assessment procedures.
In the following steps, SPSS is used to select one class in each school. First the sample of 120 schools must be merged to the class fi le to get a list of all eligible classrooms for each selected school (exercise 8.6). The procedure is similar to that of attaching the sample allocation to the school frame that was carried out earlier (see exercise 8.4).
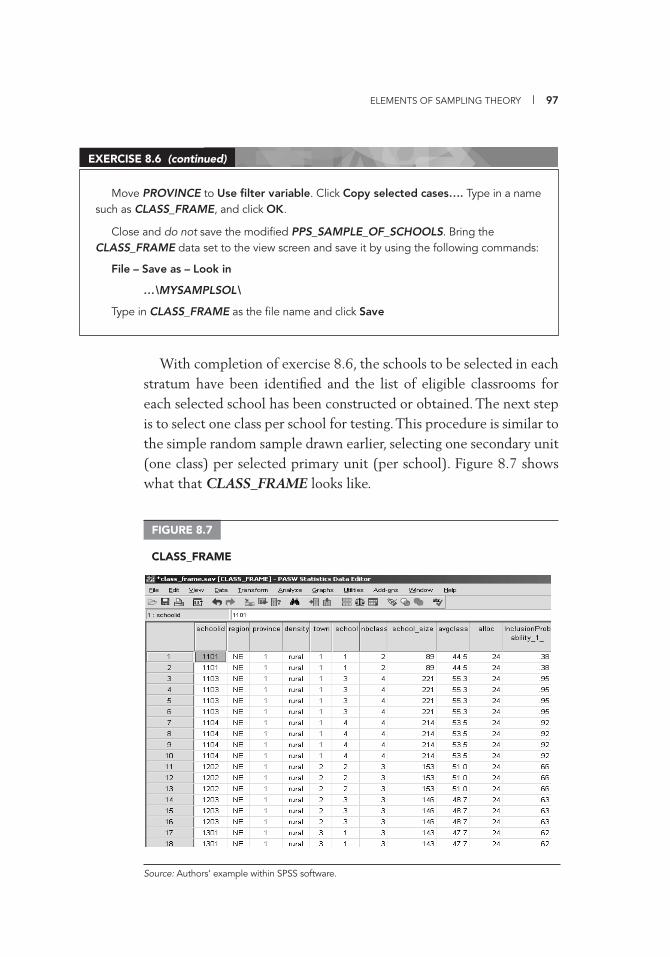
ELEMENTS OF SAMPLING THEORY | 97
Move PROVINCE to Use fi lter variable. Click Copy selected cases…. Type in a name such as CLASS_FRAME, and click OK.
Close and do not save the modifi ed PPS_SAMPLE_OF_SCHOOLS. Bring the CLASS_FRAME data set to the view screen and save it by using the following commands:
File – Save as – Look in
…\MYSAMPLSOL\
Type in CLASS_FRAME as the fi le name and click Save
EXERCISE 8.6 (continued)
FIGURE 8.7
CLASS_FRAME
With completion of exercise 8.6, the schools to be selected in each stratum have been identifi ed and the list of eligible classrooms for each selected school has been constructed or obtained. The next step is to select one class per school for testing. This procedure is similar to the simple random sample drawn earlier, selecting one secondary unit (one class) per selected primary unit (per school). Figure 8.7 shows what that CLASS_FRAME looks like.
Source: Authors’ example within SPSS software.
98 | IMPLEMENTING A NATIONAL ASSESSMENT OF EDUCATIONAL ACHIEVEMENT
Stratifi ed PPS without Replacement, Selection of Schools: Cleaning the Sampling Frame
Now the class frame can be submitted to the Complex Samples software to draw one class at random from each selected school by using the following commands:
File – Open – Data – Look in
…\MYSAMPLSOL\CLASS_FRAME.SAV
Click Open.
To clean the class frame, fi rst, click on the Variable View tab on the left lower corner of the SPSS screen.
Highlight the avgclass line and delete the variable (right click and Clear).
Highlight the InclusionProbability_1_ line and delete the variable.
Highlight the SampleWeightCumulative_1_ line and delete the variable.
EXERCISE 8.7
Before drawing the sample, however, the class frame has to be cleaned. Some variables inherited from the school sampling step will interfere with the design variables that SPSS will automatically create as the sample of classrooms is created (exercise 8.7).
After data cleaning, the class frame can be submitted to the Com-plex Samples software to draw one class at random from each se-lected school (exercise 8.8).
In the case of Sentz, all students of the selected classes are surveyed because the classes are of moderate size. In a country where classes would be much larger (for example, more than 50 students), one might need to select a sample of students from each selected class (perhaps 25 to 30 per class). The sample design would then become a three-stage design. In Sentz, the third stage (sampling students from the sampled classes) is “invisible” for now. It will become apparent when student nonresponse arises (see part IV of this volume). The next steps in the assessment process are to contact schools and make the admin-istrative and material arrangements with each participating school so that the assessment instruments can be administered to the selected students. Following administration of the survey, the national assess-ment data will be scored and cleaned (see part III of this volume).
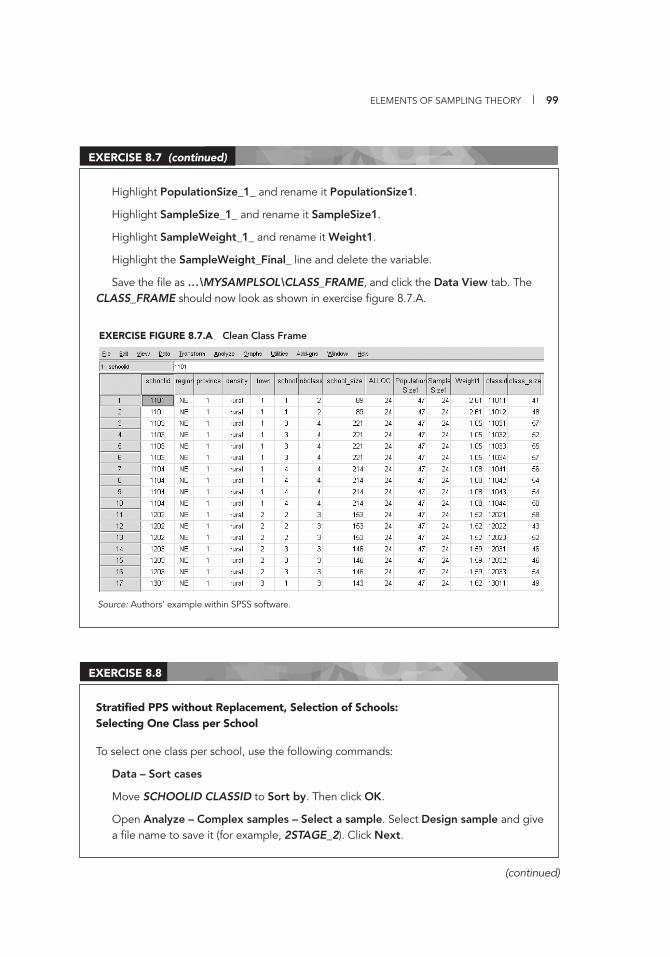
ELEMENTS OF SAMPLING THEORY | 99
Stratifi ed PPS without Replacement, Selection of Schools: Selecting One Class per School
To select one class per school, use the following commands:
Data – Sort cases
Move SCHOOLID CLASSID to Sort by. Then click OK.
Open Analyze – Complex samples – Select a sample. Select Design sample and give a fi le name to save it (for example, 2STAGE_2). Click Next.
EXERCISE 8.8
(continued)
Highlight PopulationSize_1_ and rename it PopulationSize1.
Highlight SampleSize_1_ and rename it SampleSize1.
Highlight SampleWeight_1_ and rename it Weight1.
Highlight the SampleWeight_Final_ line and delete the variable.
Save the fi le as …\MYSAMPLSOL\CLASS_FRAME, and click the Data View tab. The CLASS_FRAME should now look as shown in exercise fi gure 8.7.A.
EXERCISE 8.7 (continued)
EXERCISE FIGURE 8.7.A Clean Class Frame
Source: Authors’ example within SPSS software.
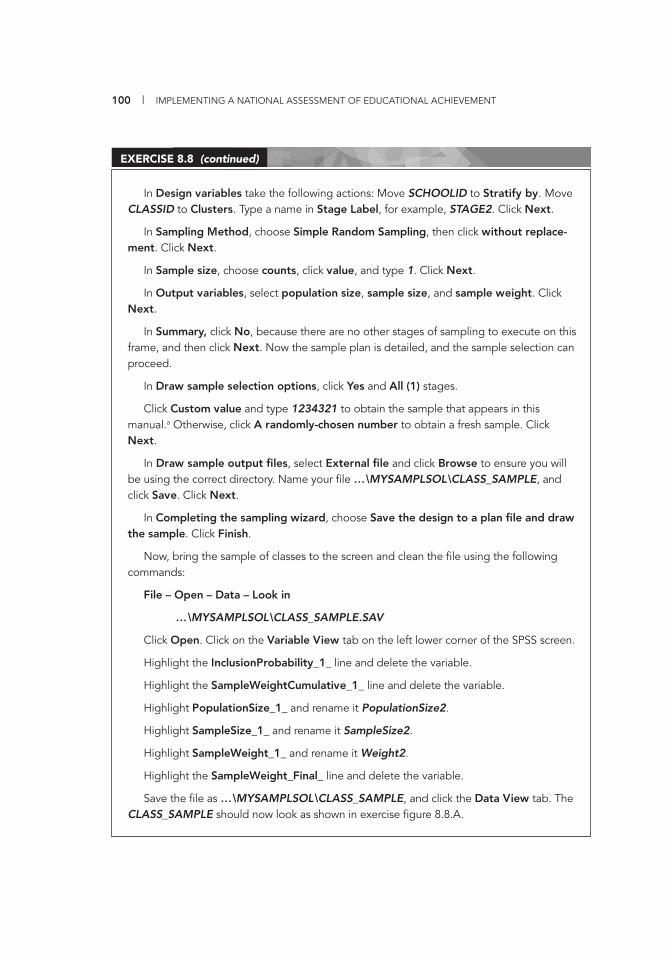
100 | IMPLEMENTING A NATIONAL ASSESSMENT OF EDUCATIONAL ACHIEVEMENT
In Design variables take the following actions: Move SCHOOLID to Stratify by. Move CLASSID to Clusters. Type a name in Stage Label, for example, STAGE2. Click Next.
In Sampling Method, choose Simple Random Sampling, then click without replace-ment. Click Next.
In Sample size, choose counts, click value, and type 1. Click Next.
In Output variables, select population size, sample size, and sample weight. Click Next.
In Summary, click No, because there are no other stages of sampling to execute on this frame, and then click Next. Now the sample plan is detailed, and the sample selection can proceed.
In Draw sample selection options, click Yes and All (1) stages.
Click Custom value and type 1234321 to obtain the sample that appears in this manual.a Otherwise, click A randomly-chosen number to obtain a fresh sample. Click Next.
In Draw sample output fi les, select External fi le and click Browse to ensure you will be using the correct directory. Name your fi le …\MYSAMPLSOL\CLASS_SAMPLE, and click Save. Click Next.
In Completing the sampling wizard, choose Save the design to a plan fi le and draw the sample. Click Finish.
Now, bring the sample of classes to the screen and clean the fi le using the following commands:
File – Open – Data – Look in
…\MYSAMPLSOL\CLASS_SAMPLE.SAV
Click Open. Click on the Variable View tab on the left lower corner of the SPSS screen.
Highlight the InclusionProbability_1_ line and delete the variable.
Highlight the SampleWeightCumulative_1_ line and delete the variable.
Highlight PopulationSize_1_ and rename it PopulationSize2.
Highlight SampleSize_1_ and rename it SampleSize2.
Highlight SampleWeight_1_ and rename it Weight2.
Highlight the SampleWeight_Final_ line and delete the variable.
Save the fi le as …\MYSAMPLSOL\CLASS_SAMPLE, and click the Data View tab. The CLASS_SAMPLE should now look as shown in exercise fi gure 8.8.A.
EXERCISE 8.8 (continued)
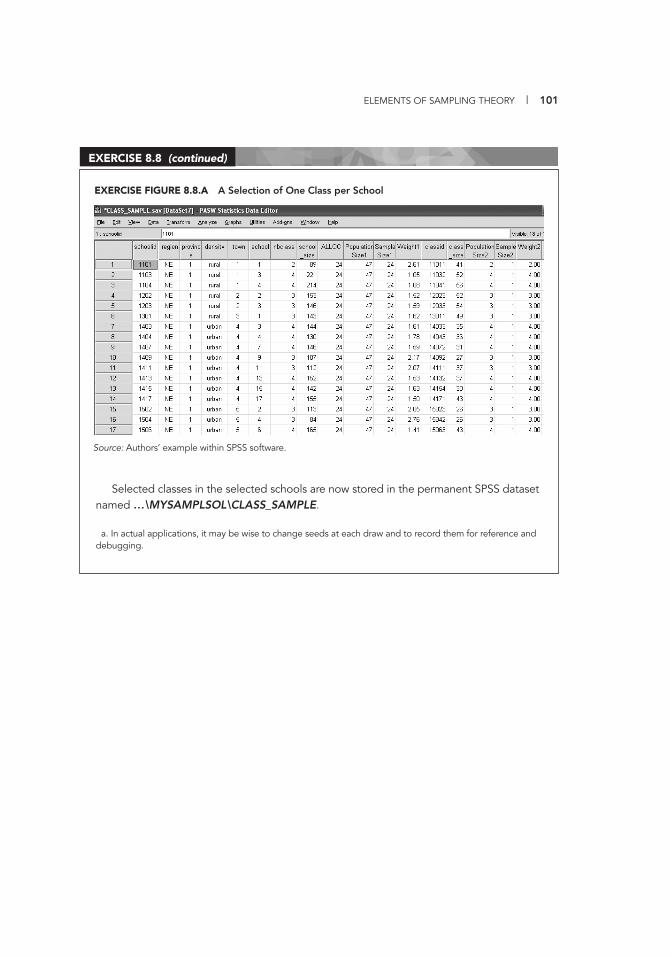
ELEMENTS OF SAMPLING THEORY | 101
EXERCISE FIGURE 8.8.A A Selection of One Class per School
Source: Authors’ example within SPSS software.
Selected classes in the selected schools are now stored in the permanent SPSS dataset named …\MYSAMPLSOL\CLASS_SAMPLE.
a. In actual applications, it may be wise to change seeds at each draw and to record them for reference and debugging.
EXERCISE 8.8 (continued)


SAMPLING:
FOLDERS
AND FILESII.A
ANNEX
103
The CD accompanying this manual contains a number of fi les with the necessary frame and sample data for the case study of Sentz. A summary description of the fi les can be found in table II.A.1. Figure II.A.1 shows the sampling fi le directory structure.
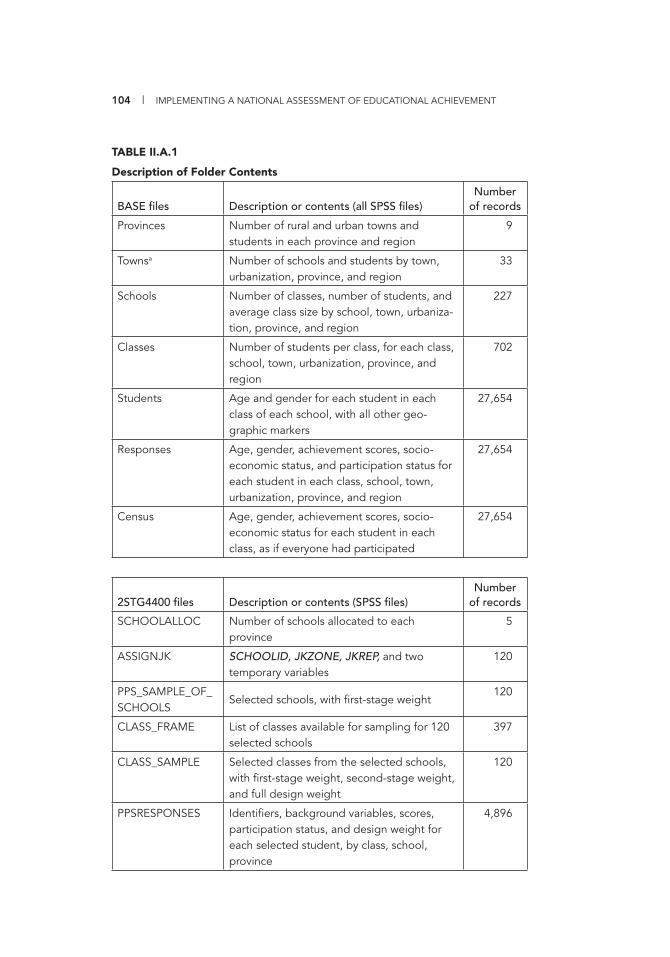
104 | IMPLEMENTING A NATIONAL ASSESSMENT OF EDUCATIONAL ACHIEVEMENT
TABLE II.A.1
Description of Folder Contents
BASE fi les Description or contents (all SPSS fi les)Number
of records
Provinces Number of rural and urban towns and students in each province and region
9
Townsa Number of schools and students by town, urbanization, province, and region
33
Schools Number of classes, number of students, and average class size by school, town, urbaniza-tion, province, and region
227
Classes Number of students per class, for each class, school, town, urbanization, province, and region
702
Students Age and gender for each student in each class of each school, with all other geo-graphic markers
27,654
Responses Age, gender, achievement scores, socio-economic status, and participation status for each student in each class, school, town, urbanization, province, and region
27,654
Census Age, gender, achievement scores, socio-economic status for each student in each class, as if everyone had participated
27,654
2STG4400 fi les Description or contents (SPSS fi les)Number
of records
SCHOOLALLOC Number of schools allocated to each province
5
ASSIGNJK SCHOOLID, JKZONE, JKREP, and two temporary variables
120
PPS_SAMPLE_OF_SCHOOLS
Selected schools, with fi rst-stage weight120
CLASS_FRAME List of classes available for sampling for 120 selected schools
397
CLASS_SAMPLE Selected classes from the selected schools, with fi rst-stage weight, second-stage weight, and full design weight
120
PPSRESPONSES Identifi ers, background variables, scores, participation status, and design weight for each selected student, by class, school, province
4,896
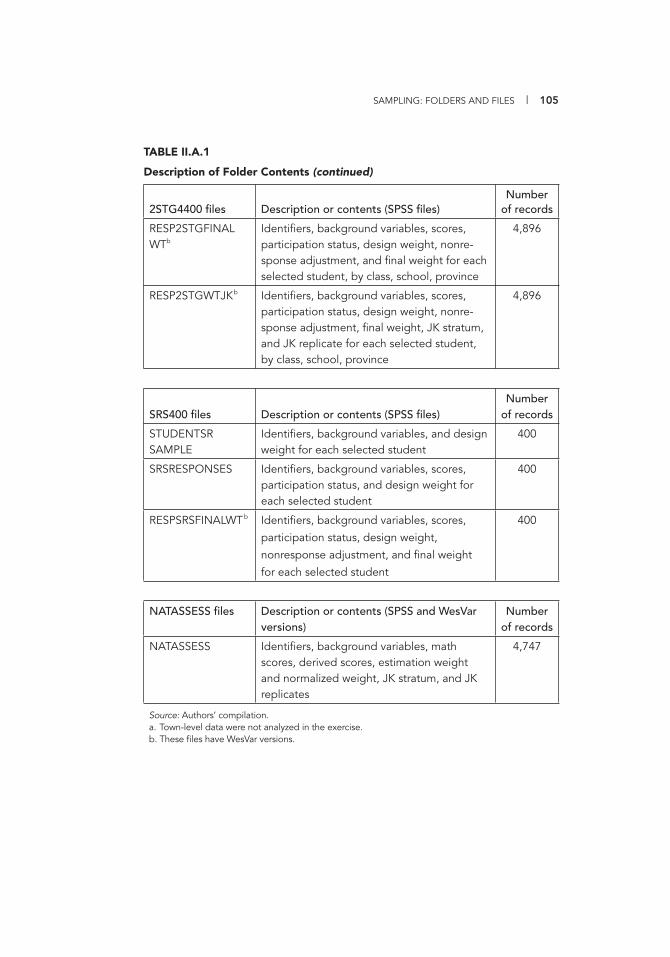
SAMPLING: FOLDERS AND FILES | 105
2STG4400 fi les Description or contents (SPSS fi les)Number
of records
RESP2STGFINAL WTb
Identifi ers, background variables, scores, participation status, design weight, nonre-sponse adjustment, and fi nal weight for each selected student, by class, school, province
4,896
RESP2STGWTJKb Identifi ers, background variables, scores, participation status, design weight, nonre-sponse adjustment, fi nal weight, JK stratum, and JK replicate for each selected student, by class, school, province
4,896
SRS400 fi les Description or contents (SPSS fi les)Number
of records
STUDENTSR SAMPLE
Identifi ers, background variables, and design weight for each selected student
400
SRSRESPONSES Identifi ers, background variables, scores, participation status, and design weight for each selected student
400
RESPSRSFINALWTb Identifi ers, background variables, scores,
participation status, design weight,
nonresponse adjustment, and fi nal weight
for each selected student
400
NATASSESS fi les Description or contents (SPSS and WesVar versions)
Number of records
NATASSESS Identifi ers, background variables, math scores, derived scores, estimation weight and normalized weight, JK stratum, and JK replicates
4,747
Source: Authors’ compilation.a. Town-level data were not analyzed in the exercise.b. These fi les have WesVar versions.
TABLE II.A.1
Description of Folder Contents (continued)
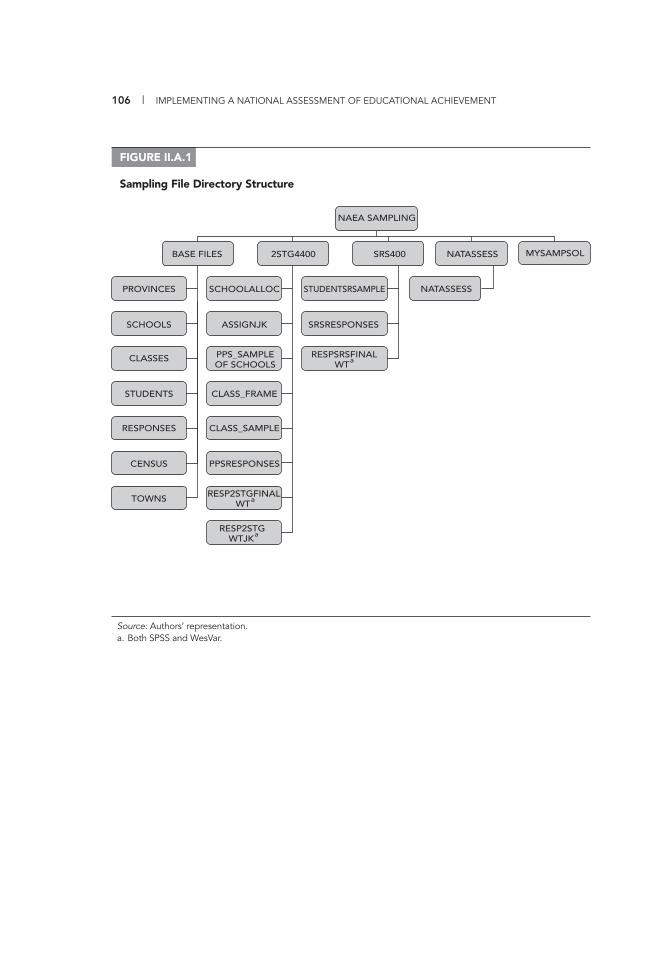
106 | IMPLEMENTING A NATIONAL ASSESSMENT OF EDUCATIONAL ACHIEVEMENT
FIGURE II.A.1
Sampling File Directory Structure
Source: Authors’ representation.a. Both SPSS and WesVar.
MYSAMPSOL
RESPSRSFINALWTa
PPS_SAMPLEOF SCHOOLS
2STG4400
RESP2STGFINAL WTa
NAEA SAMPLING
BASE FILES
PROVINCES
SCHOOLS
SCHOOLALLOC
ASSIGNJK
STUDENTSRSAMPLE
SRSRESPONSES
CLASSES
STUDENTS
RESPONSES
CENSUS
TOWNS
CLASS_FRAME
CLASS_SAMPLE
PPSRESPONSES
NATASSESS
NATASSESS
SRS400
RESP2STG WTJKa
IIPART
DATA PREPARATION,
VALIDATION, AND
MANAGEMENT
Chris Freeman and Kate O’Malley
IIIPART
107
Part III focuses on the typical tasks analysts involved in data cleaning perform in a national assessment, using examples and exercises to demonstrate the processes undertaken. The primary objective is to enable the national assessment team to develop and implement a sys-tematic set of procedures that will help ensure that the assessment data are reliable and accurate. The accompanying CD contains exam-ples of fi les containing typical data collection errors that allow the reader to practice the procedures described. Solutions for each of the exercise data, together with the cleaned fi les containing the test data, are provided to allow the reader to compare and verify the outcomes or results of the exercises.
The Microsoft application Access 2007 is used throughout this sec-tion for data entry and data validation, while SPSS (Statistical Package for the Social Sciences)1 and to a lesser extent Excel 2007 are used for data verifi cation. Alternatively, an SPSS Data Entry specialized mod-ule can be used to perform the data entry functions for which this section uses Access. Whichever approach is used, data, when captured, should be imported into SPSS for cleaning and verifi cation procedures. The three applications referred to in this section are used to limit the dangers inherent in transposing data from program to program. Never-theless, transposing the data inevitably introduces potential avenues
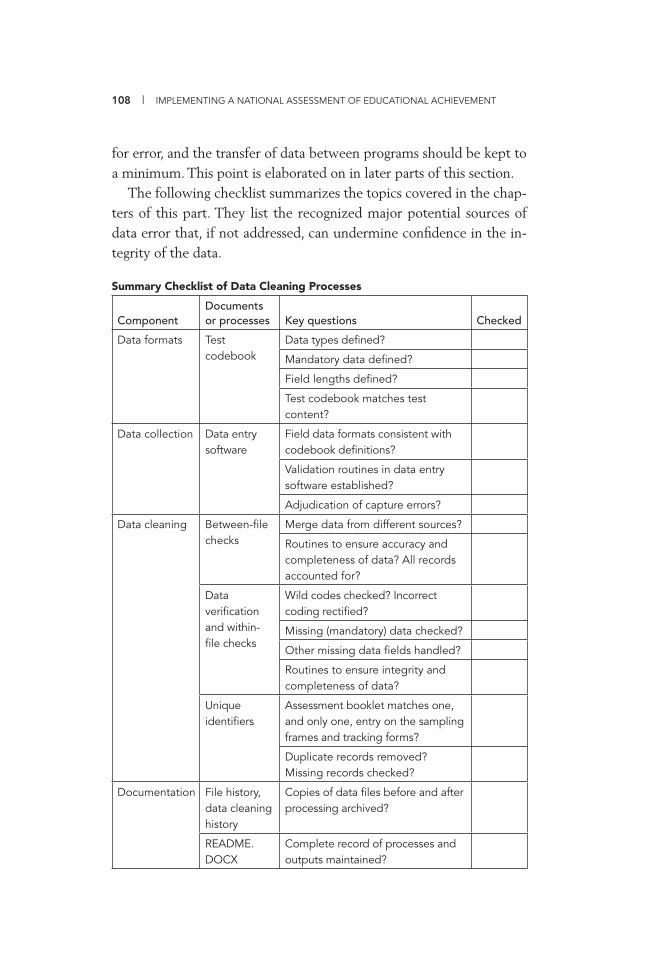
108 | IMPLEMENTING A NATIONAL ASSESSMENT OF EDUCATIONAL ACHIEVEMENT
for error, and the transfer of data between programs should be kept to a minimum. This point is elaborated on in later parts of this section.
The following checklist summarizes the topics covered in the chap-ters of this part. They list the recognized major potential sources of data error that, if not addressed, can undermine confi dence in the in-tegrity of the data.
Summary Checklist of Data Cleaning Processes
ComponentDocuments or processes Key questions Checked
Data formats Test codebook
Data types defi ned?
Mandatory data defi ned?
Field lengths defi ned?
Test codebook matches test content?
Data collection Data entry software
Field data formats consistent with codebook defi nitions?
Validation routines in data entry software established?
Adjudication of capture errors?
Data cleaning Between-fi le checks
Merge data from different sources?
Routines to ensure accuracy and completeness of data? All records accounted for?
Data verifi cation and within-fi le checks
Wild codes checked? Incorrect coding rectifi ed?
Missing (mandatory) data checked?
Other missing data fi elds handled?
Routines to ensure integrity and completeness of data?
Unique identifi ers
Assessment booklet matches one, and only one, entry on the sampling frames and tracking forms?
Duplicate records removed? Missing records checked?
Documentation File history, data cleaning history
Copies of data fi les before and after processing archived?
README.DOCX
Complete record of processes and outputs maintained?
DATA PREPARATION, VALIDATION, AND MANAGEMENT | 109
The routines described in this section are supported by practical exercises, presented in fi les in the folder Exercises in the accompany-ing CD. The solutions or corrected fi les can be examined in the folder Exercise Solutions. To help master the key data cleaning skills, the reader must set up the following easy-to-follow fi ling system.
Important Step: Saving the CD Files to Your Hard Drive or Server
On your local hard drive or server, create a folder called NAEA DATA CLEANING (or similar) and copy the fi les from the accompanying CD into this folder. Create a new subfolder called MY SOLUTIONS, which you will use to save all of your exercise solutions for comparison with the fi les located in the EXERCISE SOLUTIONS folders. You should now have three folders within the NAEA Data Cleaning folder: EXERCISES, EXERCISE SOLUTIONS, and MY SOLUTIONS.From this point on, you should be working from the fi les located on your hard drive or server.
Annex III.A contains a brief summary of the various fi les and a dia-gram of the structure of the fi le used in part III. Note that Microsoft Offi ce 2007 was used to prepare the fi les. The fi les can be run in Micro soft Offi ce 2010. Although the ribbons at the top of some pages will appear to be slightly different from those in the 2007 version, the working sections of each program are virtually identical.
The following four admonitions, if heeded, will help ensure the accuracy of the data used in analyses.
1. Be suspicious. Even the most sophisticated assessment systems are likely to have wild codes and duplicate records after the data have been fi rst entered. Assume some of the data are incorrect and must be changed.
2. Be systematic. Have a plan (a checklist) to work through the most probable sources of error. Check for duplicate records and out-of-range responses. These will often provide indicators of potential problem areas and also give insights into the quality of the data col-lection and data entry processes.
3. Be active in the data collection process. One of the best ways of ensuring that the national assessment data are clean is to insist that
110 | IMPLEMENTING A NATIONAL ASSESSMENT OF EDUCATIONAL ACHIEVEMENT
effective practices are implemented at the collection phase. The per-son in charge of data entry should be a member of the group that designs the codebook because it will have a major impact on the qual-ity of the data entry processes. Checking that correct procedures and processes are implemented at the data entry stage can greatly reduce the time and cost needed to correct faulty data.
4. Document all changes and versions. Be absolutely thorough in recording all the changes that are made in the data during the data cleaning process, and keep an accurate record of the versions that are created and which version contains the fi nal clean data fi les for analysis.
NOTE
1. This version 17 of SPSS is also referred to as Predictive Analytic Software, or PASW 17, during 2009 and 2010.
CODEBOOKS 9CHAPTER
111
In undertaking data cleaning and analysis, one must be sensitive to—and guided by—the information needs of the national assessment team members who will draft the fi nal reports. People involved in data preparation have a specifi c responsibility to ensure that the data formats will provide the necessary level of detail the analysts require. Those involved in data preparation should also be very familiar with the contents of the test and questionnaire book-lets and codebooks.
The starting point for any analysis of an assessment instrument is planning. The national assessment team should plan to ensure that the way in which data are collected produces the required informa-tion and that data are available in an accessible format. The test code-book defi nes the way the data collected in the assessment are re-corded for analysis. The codebook defi nes the information about each component of the test and helps data entry personnel and analysts understand what they should expect in each data fi eld. The codebook should be prepared jointly by the test developers and the person with overall responsibility for data entry.
Similarly, the student questionnaire codebook defi nes how the questionnaire data are recorded. Typically, questionnaire data refer to demographic items (such as gender, language background, or parental
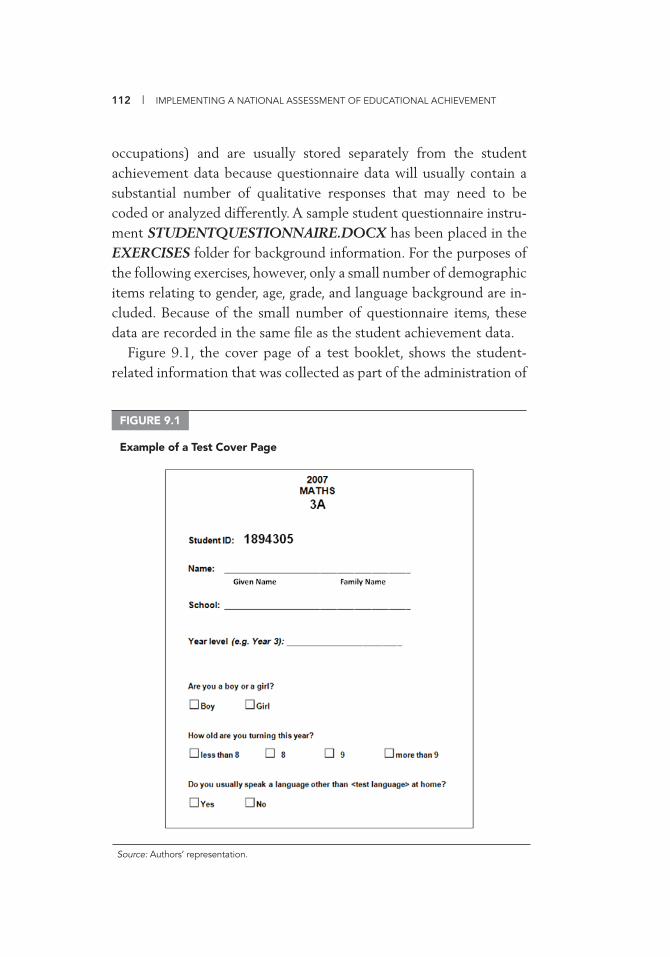
112 | IMPLEMENTING A NATIONAL ASSESSMENT OF EDUCATIONAL ACHIEVEMENT
occupations) and are usually stored separately from the student achievement data because questionnaire data will usually contain a substantial number of qualitative responses that may need to be coded or analyzed differently. A sample student questionnaire instru-ment STUDENTQUESTIONNAIRE.DOCX has been placed in the EXERCISES folder for background information. For the purposes of the following exercises, however, only a small number of demographic items relating to gender, age, grade, and language background are in-cluded. Because of the small number of questionnaire items, these data are recorded in the same fi le as the student achievement data.
Figure 9.1, the cover page of a test booklet, shows the student-related information that was collected as part of the administration of
FIGURE 9.1
Example of a Test Cover Page
Source: Authors’ representation.
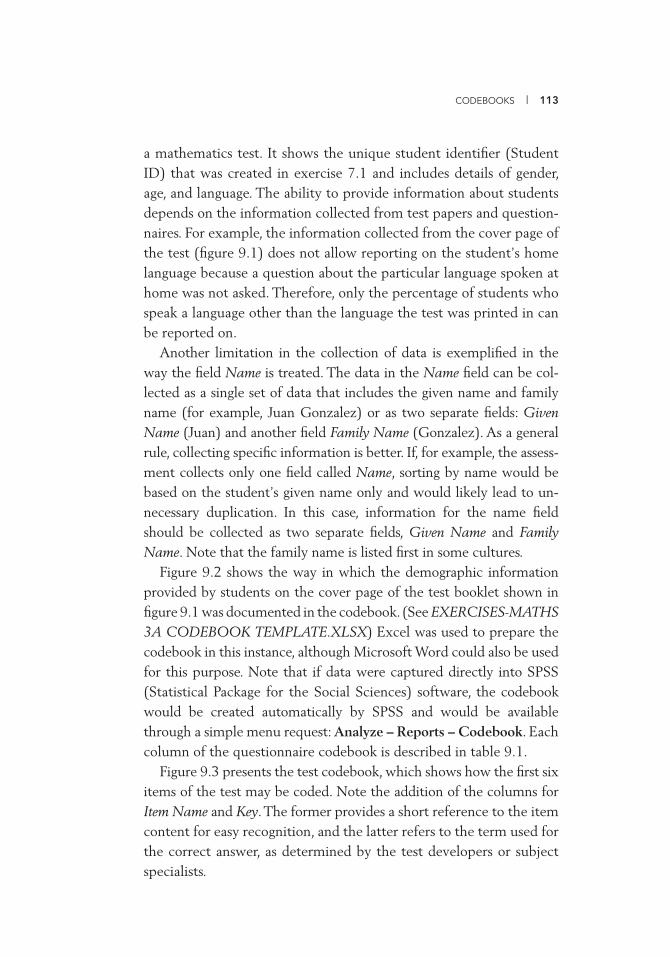
CODEBOOKS | 113
a mathematics test. It shows the unique student identifi er (Student ID) that was created in exercise 7.1 and includes details of gender, age, and language. The ability to provide information about students depends on the information collected from test papers and question-naires. For example, the information collected from the cover page of the test (fi gure 9.1) does not allow reporting on the student’s home language because a question about the particular language spoken at home was not asked. Therefore, only the percentage of students who speak a language other than the language the test was printed in can be reported on.
Another limitation in the collection of data is exemplifi ed in the way the fi eld Name is treated. The data in the Name fi eld can be col-lected as a single set of data that includes the given name and family name (for example, Juan Gonzalez) or as two separate fi elds: Given Name (Juan) and another fi eld Family Name (Gonzalez). As a general rule, collecting specifi c information is better. If, for example, the assess-ment collects only one fi eld called Name, sorting by name would be based on the student’s given name only and would likely lead to un-necessary duplication. In this case, information for the name fi eld should be collected as two separate fi elds, Given Name and Family Name. Note that the family name is listed fi rst in some cultures.
Figure 9.2 shows the way in which the demographic information provided by students on the cover page of the test booklet shown in fi gure 9.1 was documented in the codebook. (See EXERCISES-MATHS 3A CODEBOOK TEMPLATE.XLSX) Excel was used to prepare the codebook in this instance, although Microsoft Word could also be used for this purpose. Note that if data were captured directly into SPSS (Statistical Package for the Social Sciences) software, the codebook would be created automatically by SPSS and would be available through a simple menu request: Analyze – Reports – Codebook. Each column of the questionnaire codebook is described in table 9.1.
Figure 9.3 presents the test codebook, which shows how the fi rst six items of the test may be coded. Note the addition of the columns for Item Name and Key. The former provides a short reference to the item content for easy recognition, and the latter refers to the term used for the correct answer, as determined by the test developers or subject specialists.
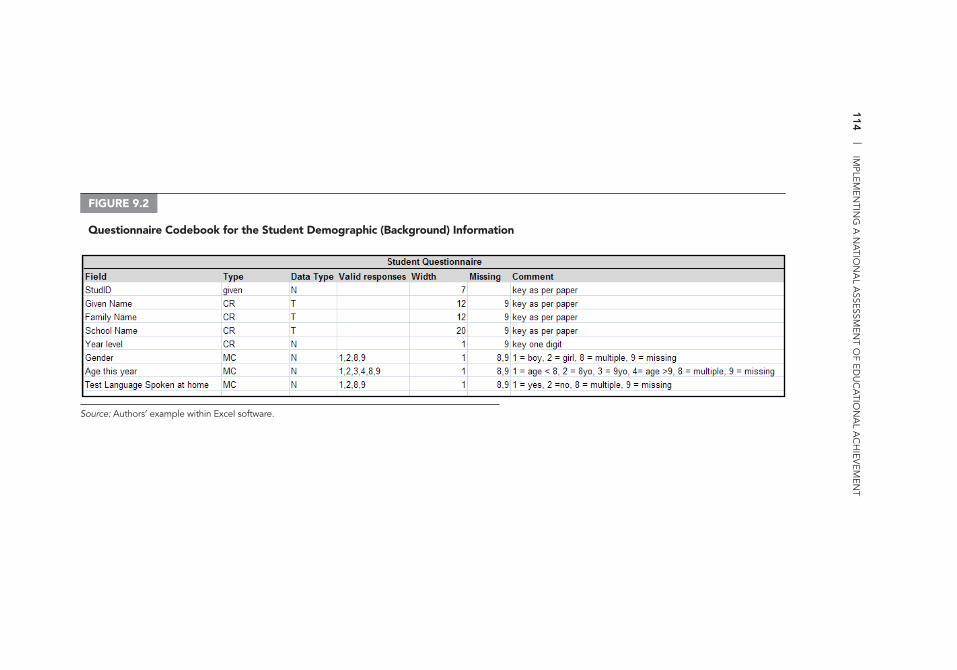
114
| IM
PLEMEN
TING
A N
ATIO
NA
L ASSESSM
ENT O
F EDU
CA
TION
AL A
CH
IEVEM
ENT
FIGURE 9.2
Questionnaire Codebook for the Student Demographic (Background) Information
Source: Authors’ example within Excel software.
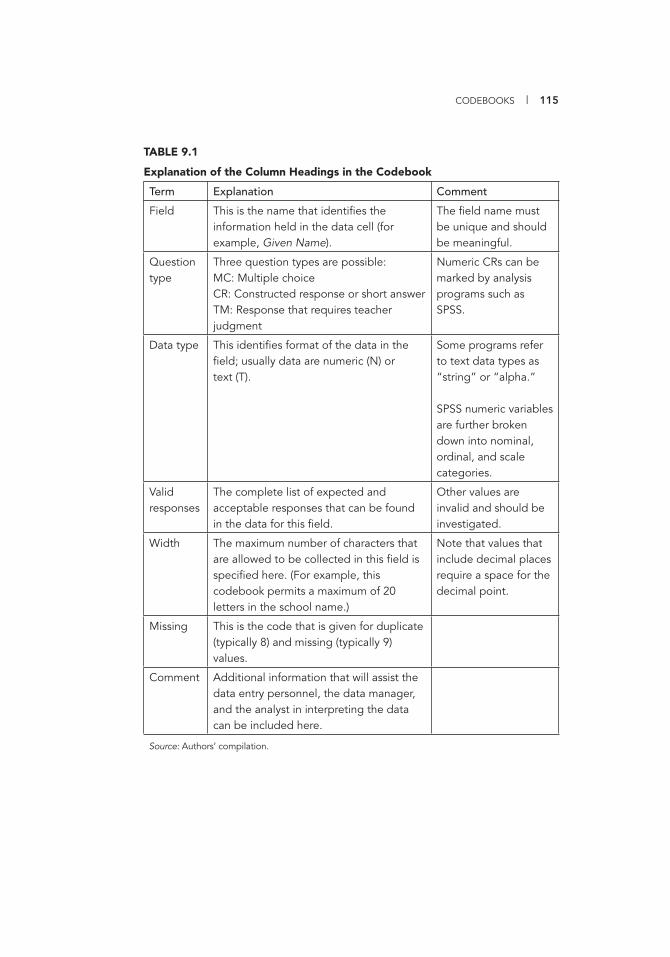
CODEBOOKS | 115
TABLE 9.1
Explanation of the Column Headings in the Codebook
Term Explanation Comment
Field This is the name that identifi es the information held in the data cell (for example, Given Name).
The fi eld name must be unique and should be meaningful.
Question type
Three question types are possible:MC: Multiple choiceCR: Constructed response or short answerTM: Response that requires teacher judgment
Numeric CRs can be marked by analysis programs such as SPSS.
Data type This identifi es format of the data in the fi eld; usually data are numeric (N) or text (T).
Some programs refer to text data types as “string” or “alpha.”
SPSS numeric variables are further broken down into nominal, ordinal, and scale categories.
Valid responses
The complete list of expected and acceptable responses that can be found in the data for this fi eld.
Other values are invalid and should be investigated.
Width The maximum number of characters that are allowed to be collected in this fi eld is specifi ed here. (For example, this codebook permits a maximum of 20 letters in the school name.)
Note that values that include decimal places require a space for the decimal point.
Missing This is the code that is given for duplicate (typically 8) and missing (typically 9) values.
Comment Additional information that will assist the data entry personnel, the data manager, and the analyst in interpreting the data can be included here.
Source: Authors’ compilation.
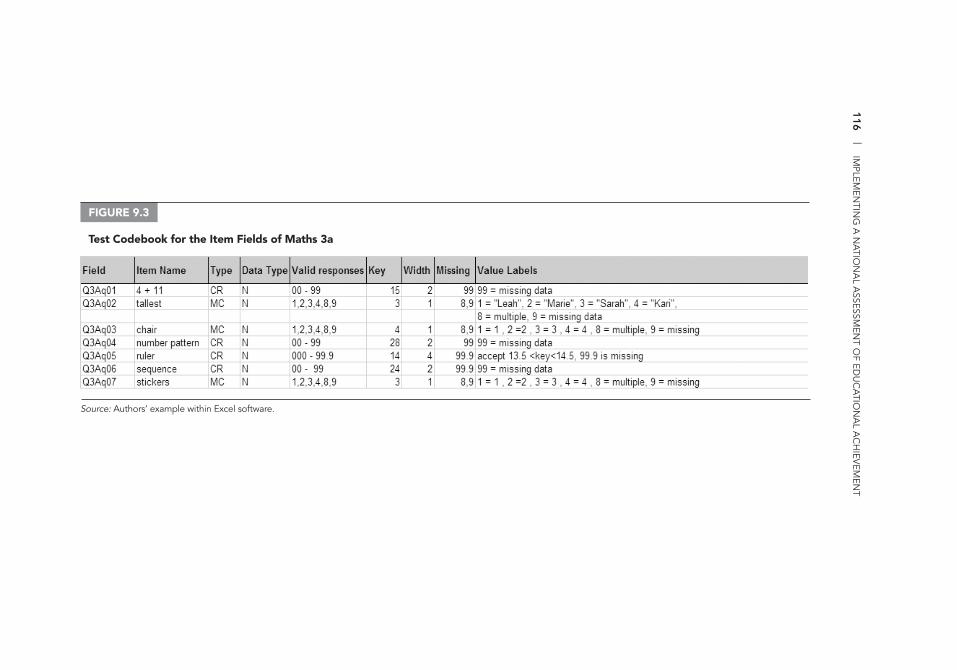
116
| IM
PLEMEN
TING
A N
ATIO
NA
L ASSESSM
ENT O
F EDU
CA
TION
AL A
CH
IEVEM
ENT
FIGURE 9.3
Test Codebook for the Item Fields of Maths 3a
Source: Authors’ example within Excel software.
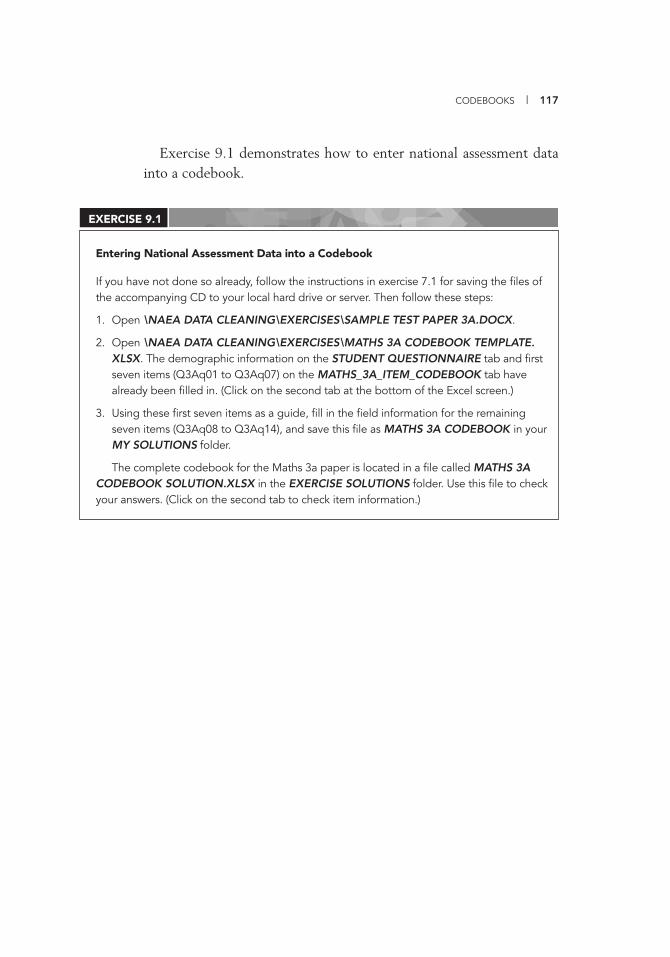
CODEBOOKS | 117
Entering National Assessment Data into a Codebook
If you have not done so already, follow the instructions in exercise 7.1 for saving the fi les of the accompanying CD to your local hard drive or server. Then follow these steps:
1. Open \NAEA DATA CLEANING\EXERCISES\SAMPLE TEST PAPER 3A.DOCX.
2. Open \NAEA DATA CLEANING\EXERCISES\MATHS 3A CODEBOOK TEMPLATE.XLSX. The demographic information on the STUDENT QUESTIONNAIRE tab and fi rst seven items (Q3Aq01 to Q3Aq07) on the MATHS_3A_ITEM_CODEBOOK tab have already been fi lled in. (Click on the second tab at the bottom of the Excel screen.)
3. Using these fi rst seven items as a guide, fi ll in the fi eld information for the remaining seven items (Q3Aq08 to Q3Aq14), and save this fi le as MATHS 3A CODEBOOK in your MY SOLUTIONS folder.
The complete codebook for the Maths 3a paper is located in a fi le called MATHS 3A CODEBOOK SOLUTION.XLSX in the EXERCISE SOLUTIONS folder. Use this fi le to check your answers. (Click on the second tab to check item information.)
EXERCISE 9.1
Exercise 9.1 demonstrates how to enter national assessment data into a codebook.


DATA
MANAGEMENT10CHAPTER
119
DATA ENTRY
Budget and expertise will dictate the method used to collect and re-cord test item data. Available methods include online data collection, scanning of optical mark reader sheets, and manual key punching. Most national assessment systems, especially those with limited resources, use the key-punching approach to enter data. A well-designed tem-plate (fi gure 10.1) can enable key punchers to enter data accurately and quickly. This data entry template has been prepared in Access 2007, and the procedure is described in exercise 10.1. Although set-ting up the data entry procedure takes time, it is generally time well spent because poor procedures are the most common sources of data error.
Single Punching
Single punching involves a keyboard operator transcribing student responses into an electronic database in preparation for analysis. This method is generally the least expensive, but it is also the most risky in terms of data accuracy unless there are sound validation procedures within the program as well as close supervision of operators.
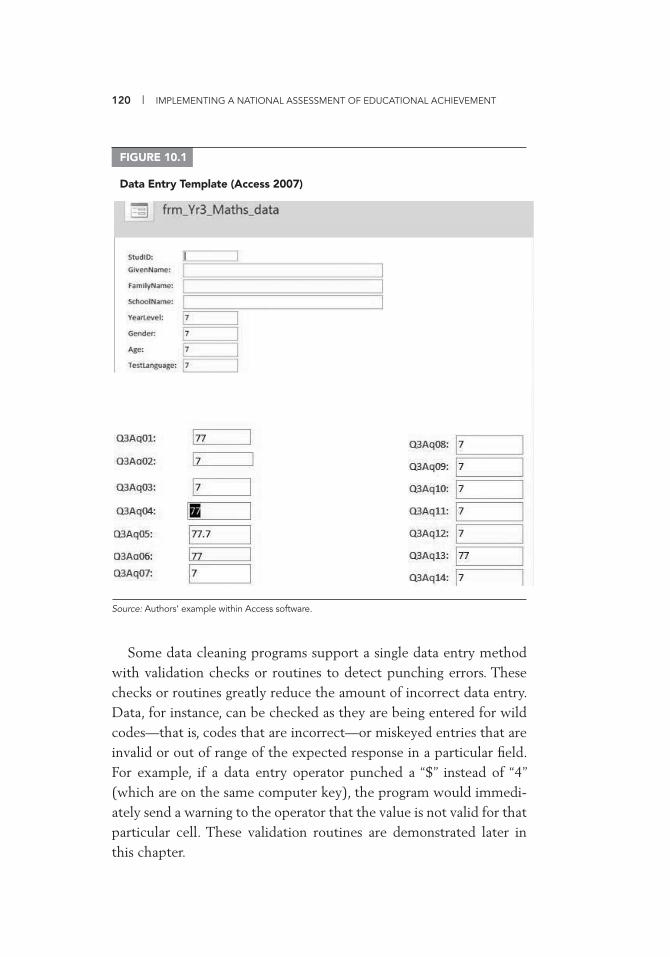
120 | IMPLEMENTING A NATIONAL ASSESSMENT OF EDUCATIONAL ACHIEVEMENT
Some data cleaning programs support a single data entry method with validation checks or routines to detect punching errors. These checks or routines greatly reduce the amount of incorrect data entry. Data, for instance, can be checked as they are being entered for wild codes—that is, codes that are incorrect—or miskeyed entries that are invalid or out of range of the expected response in a particular fi eld. For example, if a data entry operator punched a “$” instead of “4” (which are on the same computer key), the program would immedi-ately send a warning to the operator that the value is not valid for that particular cell. These validation routines are demonstrated later in this chapter.
FIGURE 10.1
Data Entry Template (Access 2007)
Source: Authors’ example within Access software.
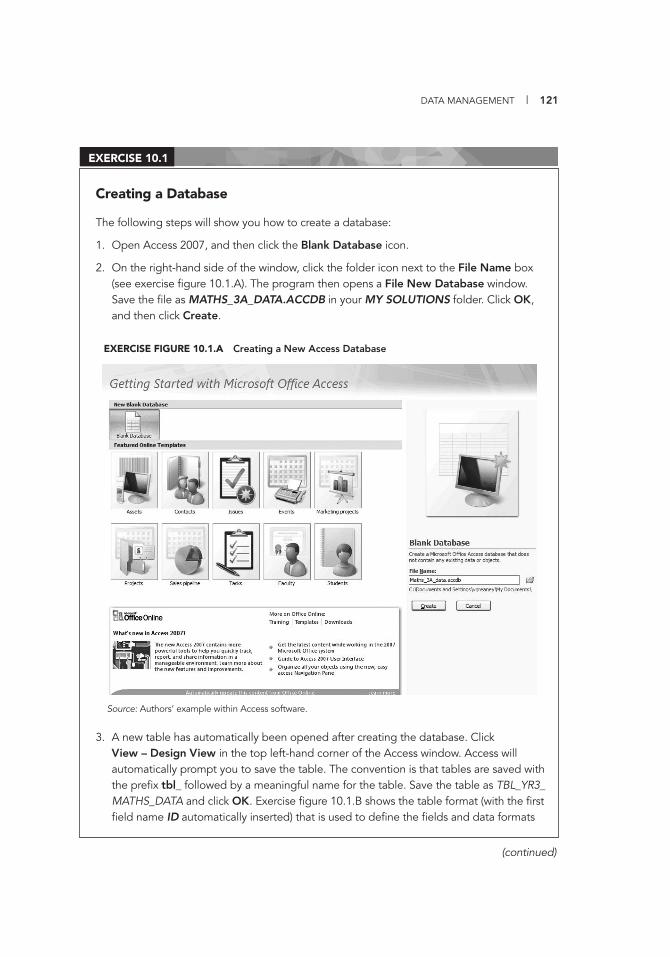
DATA MANAGEMENT | 121
(continued)
Creating a Database
The following steps will show you how to create a database:
1. Open Access 2007, and then click the Blank Database icon.
2. On the right-hand side of the window, click the folder icon next to the File Name box (see exercise fi gure 10.1.A). The program then opens a File New Database window. Save the fi le as MATHS_3A_DATA.ACCDB in your MY SOLUTIONS folder. Click OK, and then click Create.
3. A new table has automatically been opened after creating the database. Click View – Design View in the top left-hand corner of the Access window. Access will automatically prompt you to save the table. The convention is that tables are saved with the prefi x tbl_ followed by a meaningful name for the table. Save the table as TBL_YR3_MATHS_DATA and click OK. Exercise fi gure 10.1.B shows the table format (with the fi rst fi eld name ID automatically inserted) that is used to defi ne the fi elds and data formats
EXERCISE 10.1
EXERCISE FIGURE 10.1.A Creating a New Access Database
Source: Authors’ example within Access software.
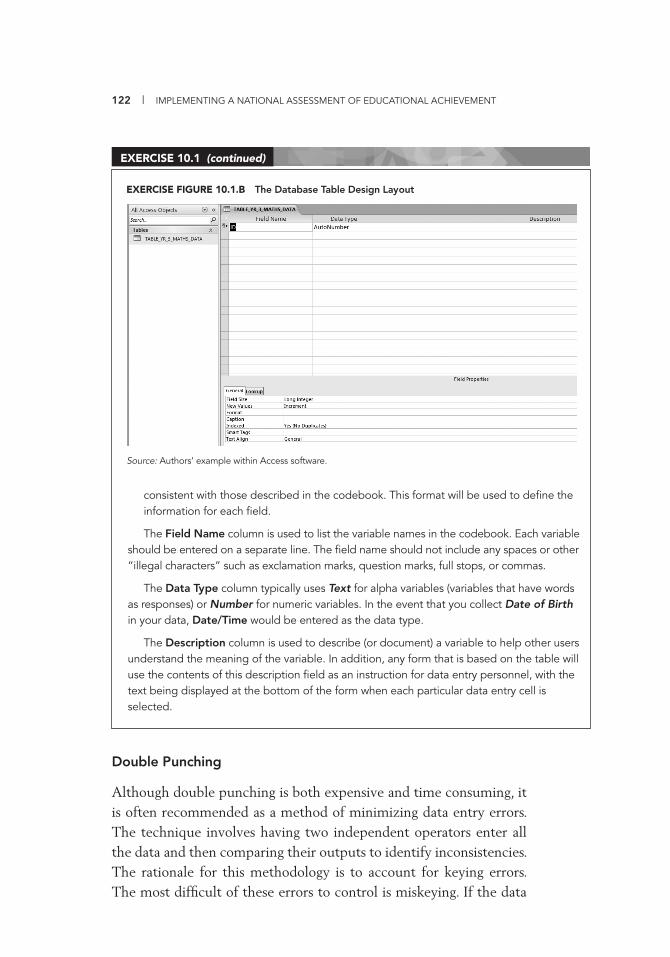
122 | IMPLEMENTING A NATIONAL ASSESSMENT OF EDUCATIONAL ACHIEVEMENT
Double Punching
Although double punching is both expensive and time consuming, it is often recommended as a method of minimizing data entry errors. The technique involves having two independent operators enter all the data and then comparing their outputs to identify inconsistencies. The rationale for this methodology is to account for keying errors. The most diffi cult of these errors to control is miskeying. If the data
consistent with those described in the codebook. This format will be used to defi ne the information for each fi eld.
The Field Name column is used to list the variable names in the codebook. Each variable should be entered on a separate line. The fi eld name should not include any spaces or other “illegal characters” such as exclamation marks, question marks, full stops, or commas.
The Data Type column typically uses Text for alpha variables (variables that have words as responses) or Number for numeric variables. In the event that you collect Date of Birth in your data, Date/Time would be entered as the data type.
The Description column is used to describe (or document) a variable to help other users understand the meaning of the variable. In addition, any form that is based on the table will use the contents of this description fi eld as an instruction for data entry personnel, with the text being displayed at the bottom of the form when each particular data entry cell is selected.
EXERCISE 10.1 (continued)
EXERCISE FIGURE 10.1.B The Database Table Design Layout
Source: Authors’ example within Access software.
DATA MANAGEMENT | 123
entry operator of a single-key methodology has typed, say, a “2” in-stead of a “3” when both are valid responses, there is no simple way to detect this error. If neither operator makes a mistake, the fi les will be identical. However, if one operator miskeys a response, a discrepancy will exist between the data. Between-fi le data verifi cation can be undertaken using software programs such as SPSS (Data Entry mod-ule), UltraEdit (with UltraCompare capabilities), WinDem, and Ex-cel. The fi rst three of these programs present easy-to-use, reliable solutions to the issue of between-fi le consistency, but they are all ex-pensive additions to the suite of software already used in this volume. For this reason, the section on verifying data in chapter 11 describes how to use Excel to detect punching errors.
Data Validation
Data validation is a process that helps prevent errors occurring as the data are entered into the national assessment database. Most common data entry applications (including WinDem, Access, and Excel) at-tach validation routines to each data entry cell to help minimize er-rors. These routines automatically warn the data entry person when they detect a problem with a particular value that is being entered. SPSS basic modules do not seem to offer quite this level of control over data entry.
Common errors in data punching include omission (missing a re-sponse), “sliding” the responses by missing one response and then en-tering the data from all the other responses in the wrong columns, miskeying (typing in a different response from the one indicated by the student), and duplicating a student’s records by error or because the student has completed multiple test booklets. Error identifi cation methods are described in chapter 11.
PREPARING A DATA ENTRY TEMPLATE USING MICROSOFT ACCESS
This section demonstrates the use of Access as a tool to minimize data entry errors and shows how to prepare a template to enter data. It covers validation rules to minimize incorrect coding and data entry.
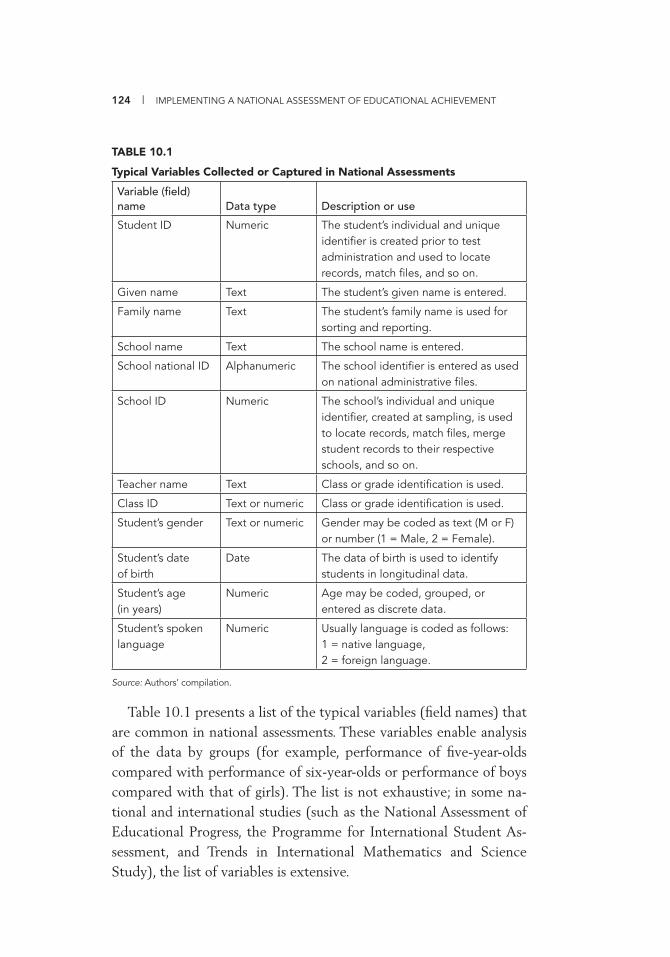
124 | IMPLEMENTING A NATIONAL ASSESSMENT OF EDUCATIONAL ACHIEVEMENT
Table 10.1 presents a list of the typical variables (fi eld names) that are common in national assessments. These variables enable analysis of the data by groups (for example, performance of fi ve-year-olds compared with performance of six-year-olds or performance of boys compared with that of girls). The list is not exhaustive; in some na-tional and international studies (such as the National Assessment of Educational Progress, the Programme for International Student As-sessment, and Trends in International Mathematics and Science Study), the list of variables is extensive.
TABLE 10.1
Typical Variables Collected or Captured in National Assessments
Variable (fi eld) name Data type Description or use
Student ID Numeric The student’s individual and unique identifi er is created prior to test administration and used to locate records, match fi les, and so on.
Given name Text The student’s given name is entered.
Family name Text The student’s family name is used for sorting and reporting.
School name Text The school name is entered.
School national ID Alphanumeric The school identifi er is entered as used on national administrative fi les.
School ID Numeric The school’s individual and unique identifi er, created at sampling, is used to locate records, match fi les, merge student records to their respective schools, and so on.
Teacher name Text Class or grade identifi cation is used.
Class ID Text or numeric Class or grade identifi cation is used.
Student’s gender Text or numeric Gender may be coded as text (M or F) or number (1 = Male, 2 = Female).
Student’s date of birth
Date The data of birth is used to identify students in longitudinal data.
Student’s age (in years)
Numeric Age may be coded, grouped, or entered as discrete data.
Student’s spoken language
Numeric Usually language is coded as follows: 1 = native language, 2 = foreign language.
Source: Authors’ compilation.
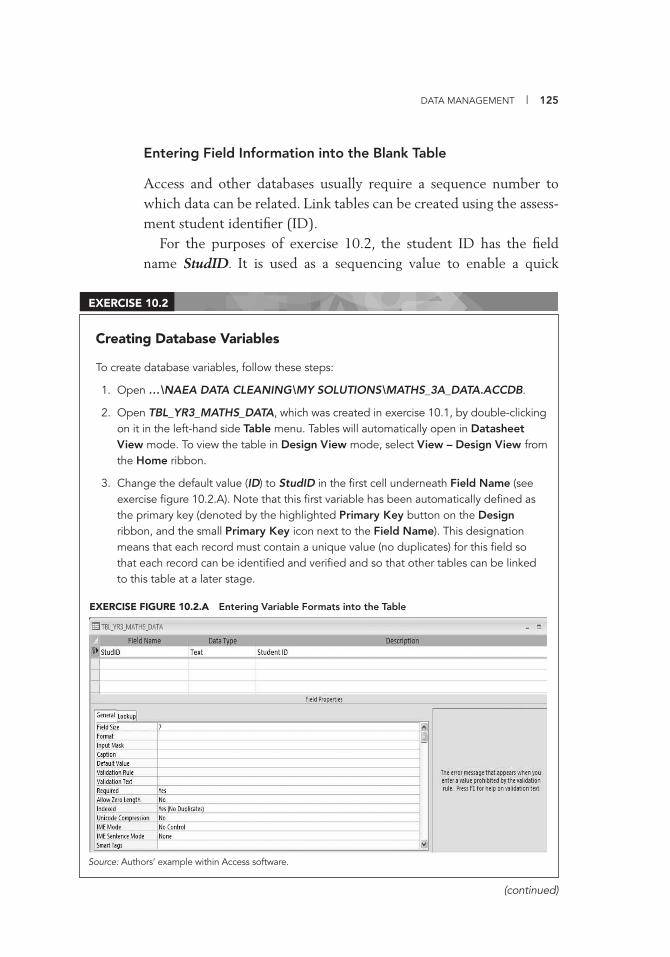
DATA MANAGEMENT | 125
Entering Field Information into the Blank Table
Access and other databases usually require a sequence number to which data can be related. Link tables can be created using the assess-ment student identifi er (ID).
For the purposes of exercise 10.2, the student ID has the fi eld name StudID. It is used as a sequencing value to enable a quick
(continued)
Creating Database Variables
To create database variables, follow these steps:
1. Open …\NAEA DATA CLEANING\MY SOLUTIONS\MATHS_3A_DATA.ACCDB.
2. Open TBL_YR3_MATHS_DATA, which was created in exercise 10.1, by double-clicking on it in the left-hand side Table menu. Tables will automatically open in Datasheet View mode. To view the table in Design View mode, select View – Design View from the Home ribbon.
3. Change the default value (ID) to StudID in the fi rst cell underneath Field Name (see exercise fi gure 10.2.A). Note that this fi rst variable has been automatically defi ned as the primary key (denoted by the highlighted Primary Key button on the Design ribbon, and the small Primary Key icon next to the Field Name). This designation means that each record must contain a unique value (no duplicates) for this fi eld so that each record can be identifi ed and verifi ed and so that other tables can be linked to this table at a later stage.
EXERCISE 10.2
EXERCISE FIGURE 10.2.A Entering Variable Formats into the Table
Source: Authors’ example within Access software.

126 | IMPLEMENTING A NATIONAL ASSESSMENT OF EDUCATIONAL ACHIEVEMENT
4. Tab across to the Data Type fi eld. This should bring up the Field Properties dialogue box below the table. (Note: Some of the items listed under Field Properties have drop-down arrows. Click the right side of the box associated with each item to get the drop-down arrow.)
5. Click the drop-down arrow at the right of the Data Type cell in the StudID row. The data type options available in Access are now revealed.
6. Select Text from the drop-down menu using either the mouse or the arrow keys on the keyboard. Note that although the actual ID is in numeric format, it should really act like text so that the cell contents appear exactly as entered. Thus, for instance, an ID number with an initial digit of 0 will remain as such. The format shown in the Field Properties area is the default assigned by Access for an automatically assigned primary key of this data type (exercise fi gure 10.2.A).
7. Tab across to the Description Column and type Student ID in the cell.
8. As stated in step 6, Access will have defaulted to a set of values in the Field Properties area once Text was selected from the Data Type menu. In the Field Size fi eld, enter the digit 7, which is the length of the student ID in this instance. Set the Required fi eld to Yes, and the Allow Zero Length fi eld to No. The remaining fi elds can be left unchanged.
9. Select Offi ce button – Save.
10. At any time, you can close the table using the icon in the top right-hand corner of the table, just above the vertical scroll bar. (Note: This icon is distinct from the close button in the top right-hand corner of the entire window. Clicking that icon will close the entire database.) Click the table’s close button now to close the table. The table now appears as an icon in the Tables menu on the left-hand side of the window (exercise fi gure 10.2.B).
EXERCISE 10.2 (continued)
EXERCISE FIGURE 10.2.B Table Menu with Saved Table, tbl_Yr3_Maths_Data
Source: Authors’ example within Access software.
DATA MANAGEMENT | 127
reference for searching the database in some of the cleaning routines. StudID is a numeric variable that will identify a student in the Access database. The student ID was created on the sampling frames before the assessment was administered.
Entering Additional Fields
To create additional fi elds in the database, fi rst reopen the table created in exercise 10.1 in Design View mode. Exercise 10.3 takes the reader through entering student demographic data.
Creating Additional Database Fields
This exercise describes the steps for creating additional database fi elds:
1. Open …\NAEA DATA CLEANING\MY SOLUTIONS\MATHS_3A_DATA.ACCDB.
2. Open TBL_YR3_MATHS_DATA in Design View mode.
3. Enter the variables GivenName and FamilyName in the second and third rows in the Field Name column. The program will default to data type Text, and the Field Properties dialogue box will open automatically so that you can enter the data entry rules. You can move between all areas on this screen either by using the Tab key (moves cursor to the next cell) or by using the mouse to select the relevant fi eld.
4. Enter information about the fi eld name in the Description area to inform other users about the contents of the fi eld, including those who carry out data entry (see exercise fi gure 10.3.A).
EXERCISE 10.3
(continued)
EXERCISE FIGURE 10.3.A Adding the Student Data Field
Source: Authors’ example within Access software.
128 | IMPLEMENTING A NATIONAL ASSESSMENT OF EDUCATIONAL ACHIEVEMENT
Default Values
Including a default value is advisable to indicate when the data entry operator has not made a change. The default could be the expected value when the test is restricted to a particular group (such as Year 3, in this case). For example, one might have a fi eld to indicate that the student has a textbook. If most of the students have a science text-book, the default value could be set to 1 to indicate “has a science textbook.” In this case, one would enter data in this fi eld only if the
5. Change the Field Size in Field Properties to 20 characters for both variables (see exercise fi gure 10.3.A). The fi eld length will be defi ned by the Width fi eld used in the data capture program and the codebook. (Note: You may want to increase the fi eld width and variable length if names longer than 20 characters are common in the country of administration.)
6. For the GivenName variable, leave all remaining fi eld properties with their default values.
7. For the FamilyName variable, change the Required property to Yes in the drop-down box to indicate that a family name must be recorded.
8. For the Allow Zero Length fi eld, if the data are optional, the default of Yes is allowed. However, some fi elds should have this property set to No to indicate that having no entry recorded is not allowable. In this case, set the value to No. The last fi ve proper-ties—Indexed, Unicode Compression, IME Mode, IME Sentences, and Smart Tags—can be left untouched with default values.
9. Enter the SchoolName variable using the same procedures. Consider the fi eld properties that are required, and make sure they are consistent with the information in your codebook. All data fi elds have been set to text data types. The section titled “Default Values” deals with entering and defi ning numeric data types. The next variable is YearLevel. This is numeric data with a valid value of 3.
10. Enter the fi eld name YearLevel; then tab to the Data Type fi eld and select Number from the drop-down menu. The variable YearLevel is an indicator of the year level of the student taking the assessment. Sometimes classes are “mixed” when not all students are in Year 3 (that is, classes comprise both Years 2 and 3 or both Years 3 and 4), and you want to be able to fi lter for these data. We will address how to treat fi eld properties for YearLevel in Exercise 10.5
11. Select Offi ce Button – Save or (CTRL+S) to save the table.
EXERCISE 10.3 (continued)
DATA MANAGEMENT | 129
student does not have a science textbook. Alternatively, one could set the default to be an invalid code (outside the range of responses) to ensure that an entry is forced. In such a case, the default value is au-tomatically entered for all new records, and the value is then replaced as the data are entered. If, however, a student or respondent did not provide an answer, this is considered “missing data,” and the value for missing data is inserted. In exercise 10.4, the default value is set to 7, which is outside the valid range of responses, to indicate where the data entry operator has made a change and where he or she has not. If an entry for a certain fi eld is required, the data entry operator will need to enter a code that is within the valid response range (for ex-ample, 1 = A; 2 = B; 3 = C; 4 = D; 8 = duplicate; 9 = missing).
Validation
Validation is the process of ensuring that only plausible data can be entered into a fi eld. In the interests of effi ciency, setting up validation rules for this data source is advisable to minimize the amount of cor-rections to be done in the verifi cation stage.
Setting Default Values
Follow these steps to set default values:
1. Open …\NAEA DATA CLEANING\MY SOLUTIONS\MATHS_3A_DATA.ACCDB.2. Open TBL_YR3_MATHS_DATA in Design View mode.
3. Enter the variable Gender after the YearLevel variable, and set Data Type to Number.
4. In the Description column, enter Gender: 1 = Boy; 2 = Girl; 8 = multiple response; 9 = missing.
5. In the Field Properties area, set Default value to 7 (exercise fi gure 10.5.B in the next exercise).
By setting the default value outside the valid response range, an entry for the Gender variable becomes mandatory, meaning that the data entry operator cannot skip this variable. If the test booklet gives no datum, the data entry operator will be required to enter a 9 to represent missing data. Setting the valid response range is outlined in the “Validation” section.
EXERCISE 10.4
130 | IMPLEMENTING A NATIONAL ASSESSMENT OF EDUCATIONAL ACHIEVEMENT
A four-option multiple-choice question should have only the val-ues 1, 2, 3, or 4; 8 (for multiple responses); or 9 (for no response). These values make up the valid response range. There should be no value of 6, for example, because it does not represent a possible response.
Validation rules involve inserting codes into the data entry applica-tion to ensure that only valid responses are entered. If a key operator miskeys and attempts to enter an out-of-range value (a wild code), the program will not accept the value; it will prompt the key operator to enter a value within the valid range. In Access, validation rules are set within the fi eld properties. Exercise 10.5 shows how to use these properties.
Using the Validation Rule and Validation Text Properties
The following exercise describes how to use the validation rule:
1. Open …\NAEA DATA CLEANING\MY SOLUTIONS\MATHS_3A_DATA.ACCDB.
2. Open tbl_Yr3_Maths_Data in Design View mode.
3. For the YearLevel variable, set the Default Value to 7. Click on the Validation Rule fi eld, and in the Field Properties area enter the following: > 1 AND < 5. This value allows for mixed-level classes. If classes have students in multiple grades (for example, one class with Year 2 and Year 3 students being taught concurrently), you may want all students to take the same test to compare performance of the two cohorts. Setting the validation rule to values between 1 and 5 will enable you to do so. Validation Text is the next fi eld in the Field Properties window. It allows the database creator to alert the data entry operator to any incidence of invalid codes or values being entered at the time of data entry.
4. Click on the Validation Text fi eld and enter the following: Must be in Year 3 or mixed Year 3 class (see exercise fi gure 10.5.A). This is the error message that will appear if the data entry operator attempts to enter a value outside the valid range.
5. Complete the Validation Rule and the Validation Text for the Gender variable. Here, gender is coded as 1 for Boy, 2 for Girl, 8 for multiple response, and 9 for missing (see exercise fi gure 10.5.B). The test booklet records Age in four categories. Code 1 represents “Age is less than 8”; code 2 represents “Age is 8”; code 3 represents “Age is 9”; and code 4 represents “Age is greater than 9.” Exercise fi gure 10.5.C shows how these data will be entered.
EXERCISE 10.5
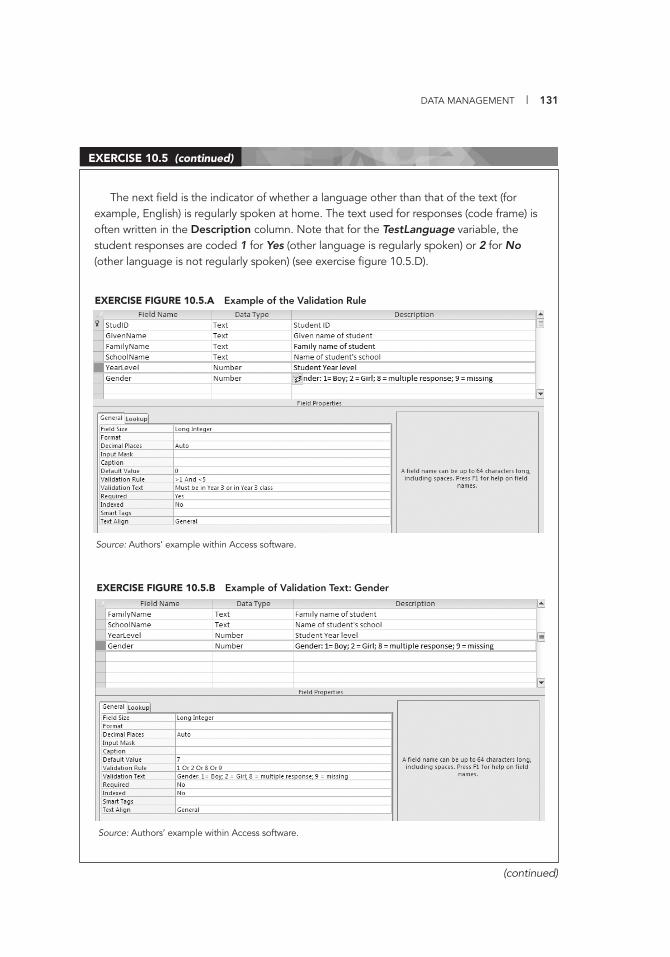
DATA MANAGEMENT | 131
EXERCISE 10.5 (continued)
(continued)
The next fi eld is the indicator of whether a language other than that of the text (for example, English) is regularly spoken at home. The text used for responses (code frame) is often written in the Description column. Note that for the TestLanguage variable, the student responses are coded 1 for Yes (other language is regularly spoken) or 2 for No (other language is not regularly spoken) (see exercise fi gure 10.5.D).
EXERCISE FIGURE 10.5.A Example of the Validation Rule
Source: Authors’ example within Access software.
EXERCISE FIGURE 10.5.B Example of Validation Text: Gender
Source: Authors’ example within Access software.
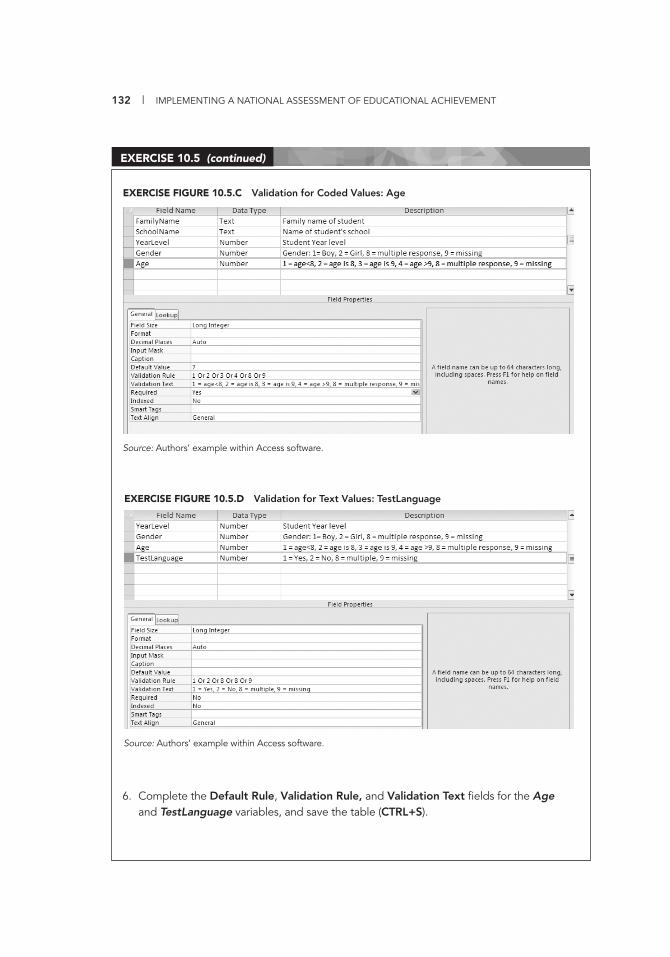
132 | IMPLEMENTING A NATIONAL ASSESSMENT OF EDUCATIONAL ACHIEVEMENT
EXERCISE 10.5 (continued)
6. Complete the Default Rule, Validation Rule, and Validation Text fi elds for the Age and TestLanguage variables, and save the table (CTRL+S).
Source: Authors’ example within Access software.
EXERCISE FIGURE 10.5.C Validation for Coded Values: Age
Source: Authors’ example within Access software.
EXERCISE FIGURE 10.5.D Validation for Text Values: TestLanguage
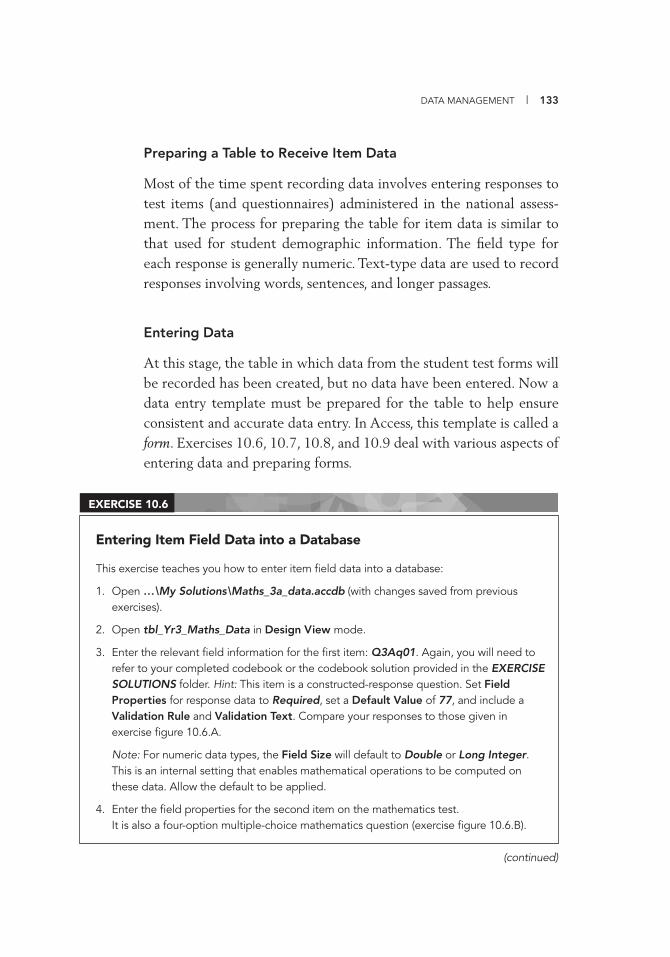
DATA MANAGEMENT | 133
Preparing a Table to Receive Item Data
Most of the time spent recording data involves entering responses to test items (and questionnaires) administered in the national assess-ment. The process for preparing the table for item data is similar to that used for student demographic information. The fi eld type for each response is generally numeric. Text-type data are used to record responses involving words, sentences, and longer passages.
Entering Data
At this stage, the table in which data from the student test forms will be recorded has been created, but no data have been entered. Now a data entry template must be prepared for the table to help ensure consistent and accurate data entry. In Access, this template is called a form. Exercises 10.6, 10.7, 10.8, and 10.9 deal with various aspects of entering data and preparing forms.
(continued)
Entering Item Field Data into a Database
This exercise teaches you how to enter item fi eld data into a database:
1. Open …\My Solutions\Maths_3a_data.accdb (with changes saved from previous exercises).
2. Open tbl_Yr3_Maths_Data in Design View mode.
3. Enter the relevant fi eld information for the fi rst item: Q3Aq01. Again, you will need to refer to your completed codebook or the codebook solution provided in the EXERCISE SOLUTIONS folder. Hint: This item is a constructed-response question. Set Field Properties for response data to Required, set a Default Value of 77, and include a Validation Rule and Validation Text. Compare your responses to those given in exercise fi gure 10.6.A.
Note: For numeric data types, the Field Size will default to Double or Long Integer. This is an internal setting that enables mathematical operations to be computed on these data. Allow the default to be applied.
4. Enter the fi eld properties for the second item on the mathematics test. It is also a four-option multiple-choice mathematics question (exercise fi gure 10.6.B).
EXERCISE 10.6
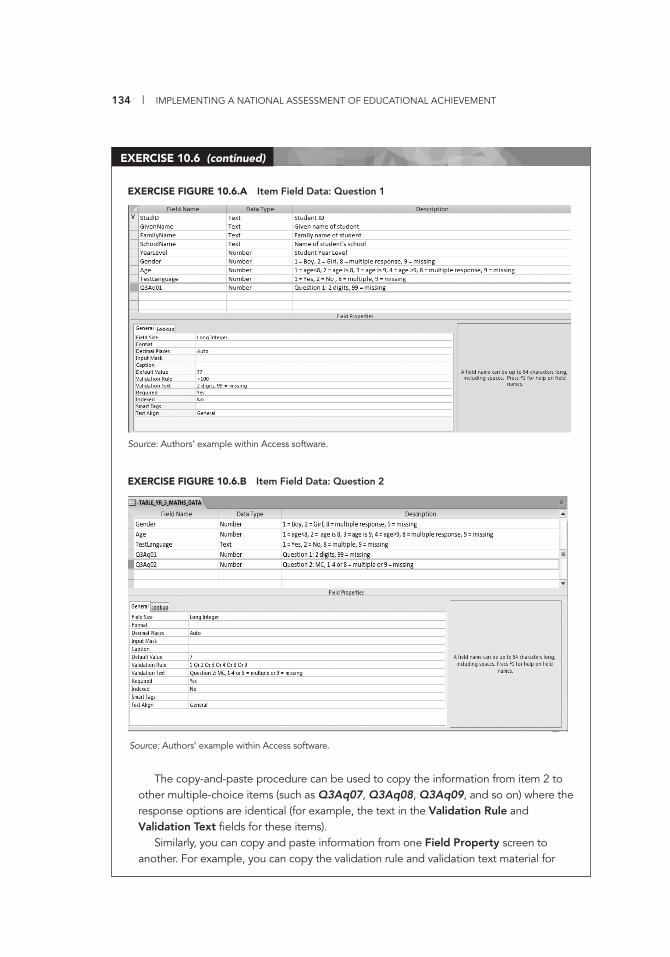
134 | IMPLEMENTING A NATIONAL ASSESSMENT OF EDUCATIONAL ACHIEVEMENT
The copy-and-paste procedure can be used to copy the information from item 2 to other multiple-choice items (such as Q3Aq07, Q3Aq08, Q3Aq09, and so on) where the response options are identical (for example, the text in the Validation Rule and Validation Text fi elds for these items).
Similarly, you can copy and paste information from one Field Property screen to another. For example, you can copy the validation rule and validation text material for
EXERCISE 10.6 (continued)
EXERCISE FIGURE 10.6.B Item Field Data: Question 2
Source: Authors’ example within Access software.
EXERCISE FIGURE 10.6.A Item Field Data: Question 1
Source: Authors’ example within Access software.
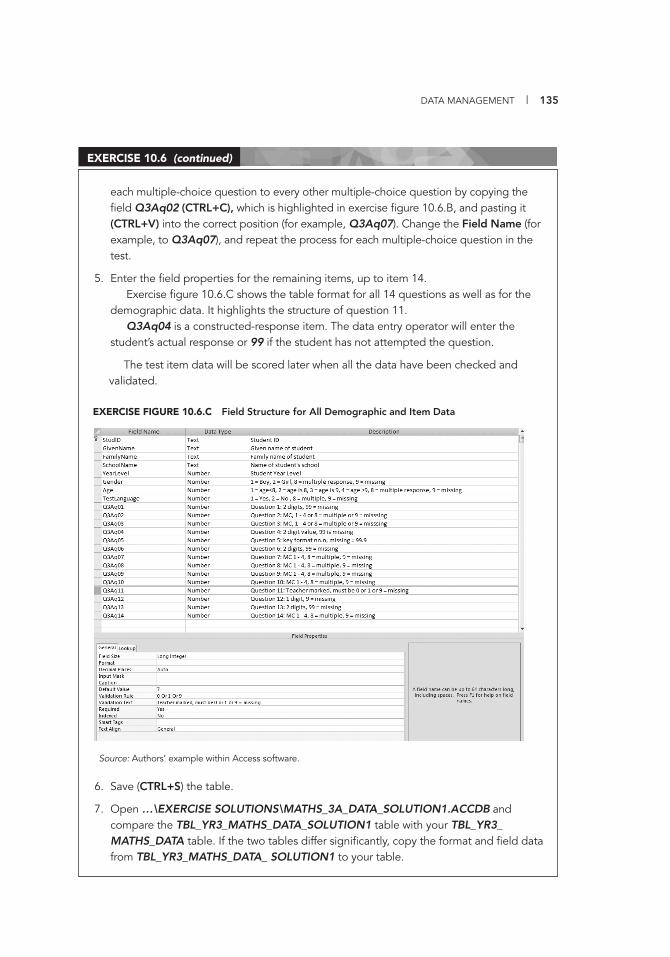
DATA MANAGEMENT | 135
each multiple-choice question to every other multiple-choice question by copying the fi eld Q3Aq02 (CTRL+C), which is highlighted in exercise fi gure 10.6.B, and pasting it (CTRL+V) into the correct position (for example, Q3Aq07). Change the Field Name (for example, to Q3Aq07), and repeat the process for each multiple-choice question in the test.
5. Enter the fi eld properties for the remaining items, up to item 14.Exercise fi gure 10.6.C shows the table format for all 14 questions as well as for the
demographic data. It highlights the structure of question 11.Q3Aq04 is a constructed-response item. The data entry operator will enter the
student’s actual response or 99 if the student has not attempted the question.
The test item data will be scored later when all the data have been checked and validated.
6. Save (CTRL+S) the table.
7. Open …\EXERCISE SOLUTIONS\MATHS_3A_DATA_SOLUTION1.ACCDB and compare the TBL_YR3_MATHS_DATA_SOLUTION1 table with your TBL_YR3_MATHS_DATA table. If the two tables differ signifi cantly, copy the format and fi eld data from TBL_YR3_MATHS_DATA_ SOLUTION1 to your table.
EXERCISE 10.6 (continued)
EXERCISE FIGURE 10.6.C Field Structure for All Demographic and Item Data
Source: Authors’ example within Access software.
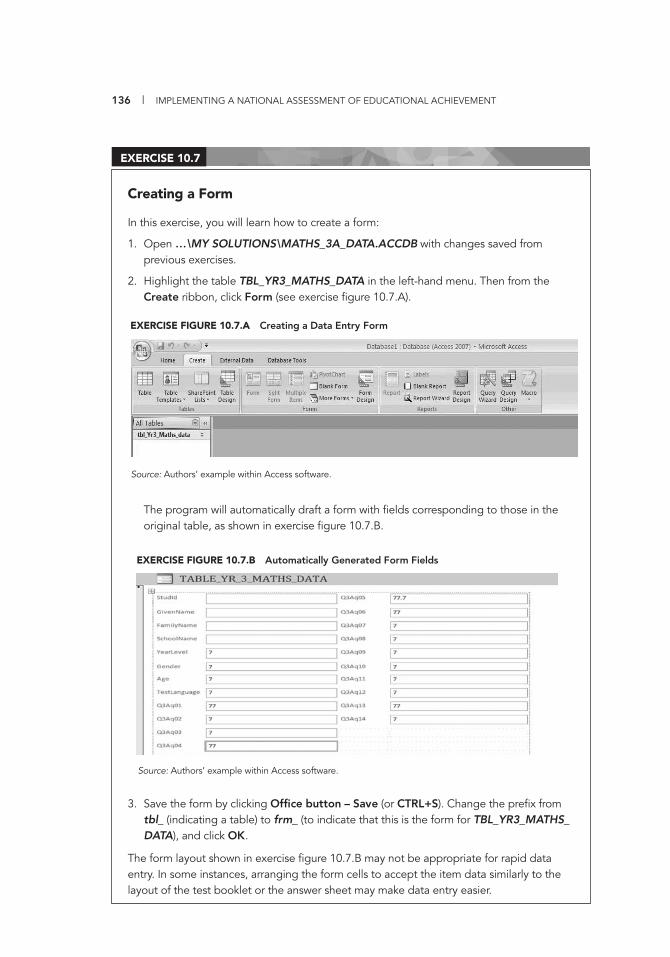
136 | IMPLEMENTING A NATIONAL ASSESSMENT OF EDUCATIONAL ACHIEVEMENT
Creating a Form
In this exercise, you will learn how to create a form:
1. Open …\MY SOLUTIONS\MATHS_3A_DATA.ACCDB with changes saved from previous exercises.
2. Highlight the table TBL_YR3_MATHS_DATA in the left-hand menu. Then from the Create ribbon, click Form (see exercise fi gure 10.7.A).
The program will automatically draft a form with fi elds corresponding to those in the original table, as shown in exercise fi gure 10.7.B.
3. Save the form by clicking Offi ce button – Save (or CTRL+S). Change the prefi x from tbl_ (indicating a table) to frm_ (to indicate that this is the form for TBL_YR3_MATHS_DATA), and click OK.
The form layout shown in exercise fi gure 10.7.B may not be appropriate for rapid data entry. In some instances, arranging the form cells to accept the item data similarly to the layout of the test booklet or the answer sheet may make data entry easier.
EXERCISE 10.7
Source: Authors’ example within Access software.
EXERCISE FIGURE 10.7.A Creating a Data Entry Form
EXERCISE FIGURE 10.7.B Automatically Generated Form Fields
Source: Authors’ example within Access software.
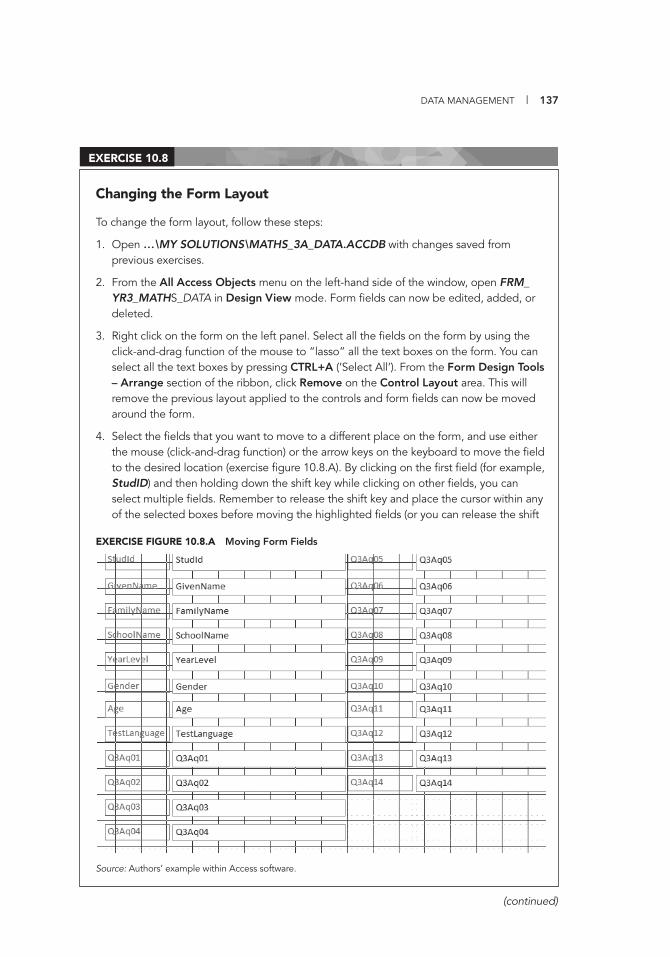
DATA MANAGEMENT | 137
Changing the Form Layout
To change the form layout, follow these steps:
1. Open …\MY SOLUTIONS\MATHS_3A_DATA.ACCDB with changes saved from previous exercises.
2. From the All Access Objects menu on the left-hand side of the window, open FRM_YR3_MATHS_DATA in Design View mode. Form fi elds can now be edited, added, or deleted.
3. Right click on the form on the left panel. Select all the fi elds on the form by using the click-and-drag function of the mouse to “lasso” all the text boxes on the form. You can select all the text boxes by pressing CTRL+A (‘Select All’). From the Form Design Tools – Arrange section of the ribbon, click Remove on the Control Layout area. This will remove the previous layout applied to the controls and form fi elds can now be moved around the form.
4. Select the fi elds that you want to move to a different place on the form, and use either the mouse (click-and-drag function) or the arrow keys on the keyboard to move the fi eld to the desired location (exercise fi gure 10.8.A). By clicking on the fi rst fi eld (for example, StudID) and then holding down the shift key while clicking on other fi elds, you can select multiple fi elds. Remember to release the shift key and place the cursor within any of the selected boxes before moving the highlighted fi elds (or you can release the shift
EXERCISE 10.8
(continued)
EXERCISE FIGURE 10.8.A Moving Form Fields
Source: Authors’ example within Access software.
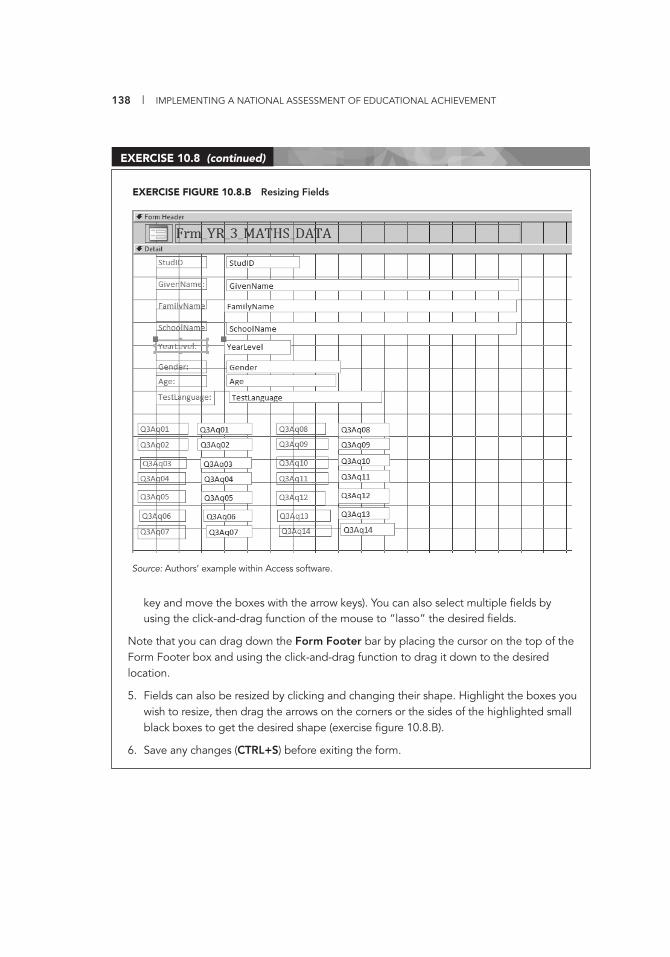
138 | IMPLEMENTING A NATIONAL ASSESSMENT OF EDUCATIONAL ACHIEVEMENT
EXERCISE 10.8 (continued)
Source: Authors’ example within Access software.
EXERCISE FIGURE 10.8.B Resizing Fields
key and move the boxes with the arrow keys). You can also select multiple fi elds by using the click-and-drag function of the mouse to “lasso” the desired fi elds.
Note that you can drag down the Form Footer bar by placing the cursor on the top of the Form Footer box and using the click-and-drag function to drag it down to the desired location.
5. Fields can also be resized by clicking and changing their shape. Highlight the boxes you wish to resize, then drag the arrows on the corners or the sides of the highlighted small black boxes to get the desired shape (exercise fi gure 10.8.B).
6. Save any changes (CTRL+S) before exiting the form.
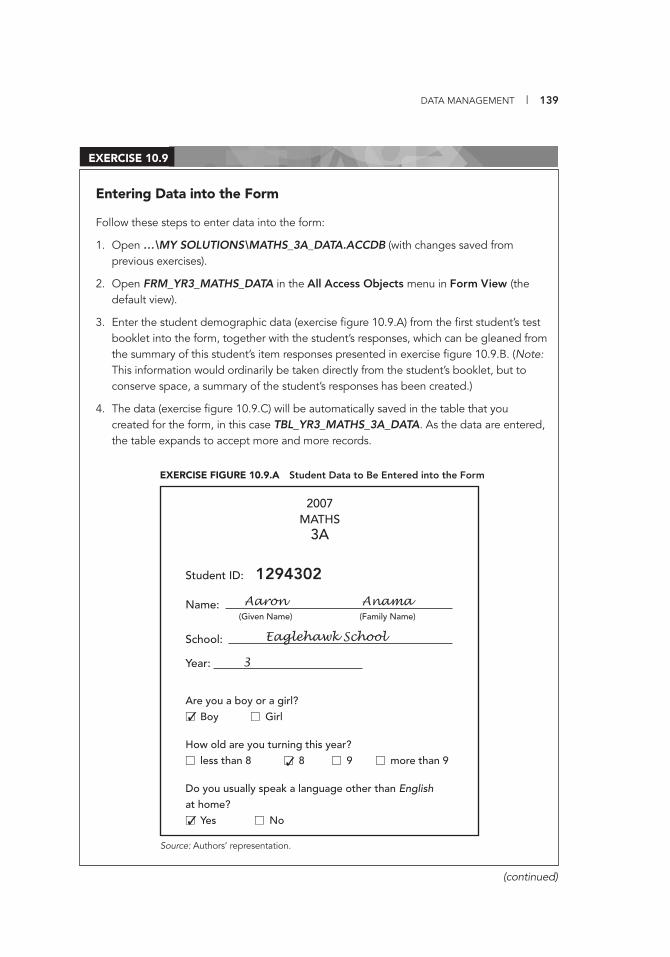
DATA MANAGEMENT | 139
Entering Data into the Form
Follow these steps to enter data into the form:
1. Open …\MY SOLUTIONS\MATHS_3A_DATA.ACCDB (with changes saved from previous exercises).
2. Open FRM_YR3_MATHS_DATA in the All Access Objects menu in Form View (the default view).
3. Enter the student demographic data (exercise fi gure 10.9.A) from the fi rst student’s test booklet into the form, together with the student’s responses, which can be gleaned from the summary of this student’s item responses presented in exercise fi gure 10.9.B. (Note: This information would ordinarily be taken directly from the student’s booklet, but to conserve space, a summary of the student’s responses has been created.)
4. The data (exercise fi gure 10.9.C) will be automatically saved in the table that you created for the form, in this case TBL_YR3_MATHS_3A_DATA. As the data are entered, the table expands to accept more and more records.
EXERCISE 10.9
(continued)
2007MATHS
3A
Student ID: 1294302
Name:
School:
Year:
Are you a boy or a girl?� Boy � Girl
How old are you turning this year?� less than 8 � 8 � 9 � more than 9
Do you usually speak a language other than Englishat home?� Yes � No
(Given Name) (Family Name)
EXERCISE FIGURE 10.9.A Student Data to Be Entered into the Form
Source: Authors’ representation.
✓
✓
✓
Aaron Anama
3
Eaglehawk School
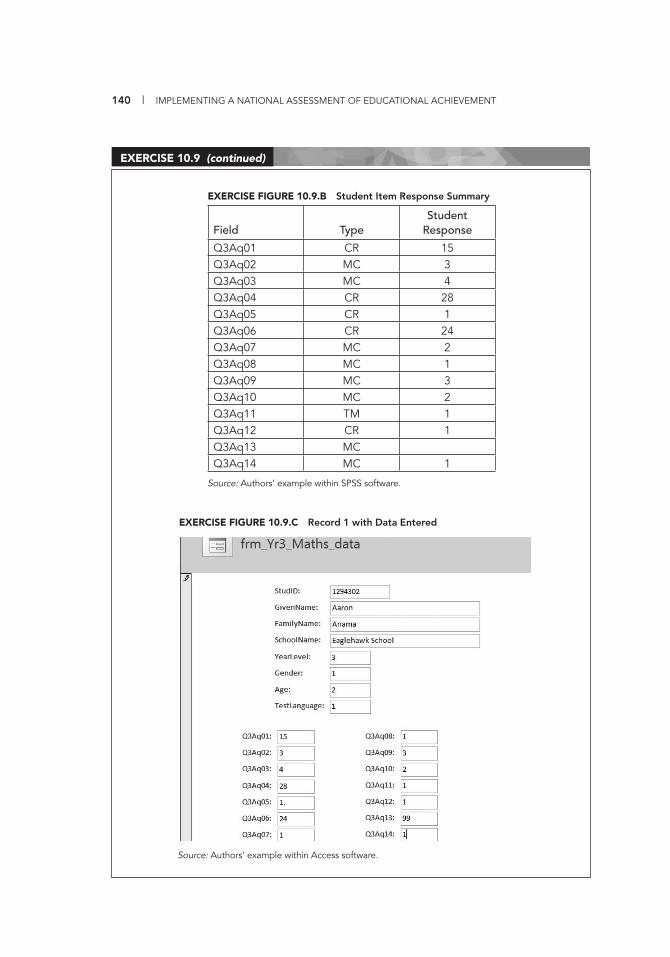
140 | IMPLEMENTING A NATIONAL ASSESSMENT OF EDUCATIONAL ACHIEVEMENT
EXERCISE 10.9 (continued)
EXERCISE FIGURE 10.9.B Student Item Response Summary
Field TypeStudent
Response
Q3Aq01 CR 15Q3Aq02 MC 3Q3Aq03 MC 4Q3Aq04 CR 28Q3Aq05 CR 1Q3Aq06 CR 24Q3Aq07 MC 2Q3Aq08 MC 1Q3Aq09 MC 3Q3Aq10 MC 2Q3Aq11 TM 1Q3Aq12 CR 1Q3Aq13 MC Q3Aq14 MC 1
Source: Authors’ example within SPSS software.
EXERCISE FIGURE 10.9.C Record 1 with Data Entered
Source: Authors’ example within Access software.
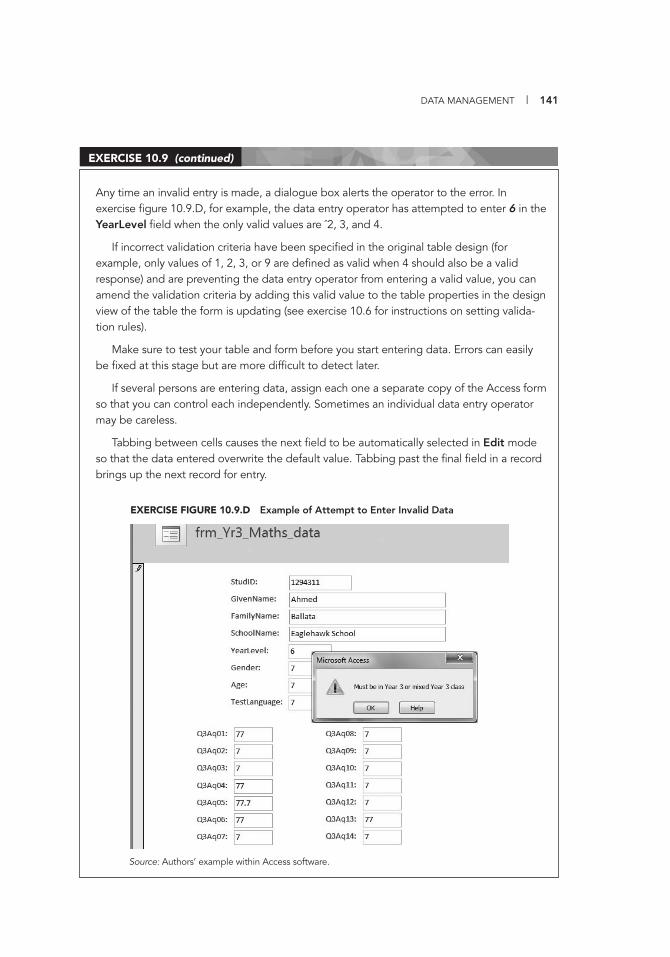
DATA MANAGEMENT | 141
Any time an invalid entry is made, a dialogue box alerts the operator to the error. In exercise fi gure 10.9.D, for example, the data entry operator has attempted to enter 6 in the YearLevel fi eld when the only valid values are ˆ2, 3, and 4.
If incorrect validation criteria have been specifi ed in the original table design (for example, only values of 1, 2, 3, or 9 are defi ned as valid when 4 should also be a valid response) and are preventing the data entry operator from entering a valid value, you can amend the validation criteria by adding this valid value to the table properties in the design view of the table the form is updating (see exercise 10.6 for instructions on setting valida-tion rules).
Make sure to test your table and form before you start entering data. Errors can easily be fi xed at this stage but are more diffi cult to detect later.
If several persons are entering data, assign each one a separate copy of the Access form so that you can control each independently. Sometimes an individual data entry operator may be careless.
Tabbing between cells causes the next fi eld to be automatically selected in Edit mode so that the data entered overwrite the default value. Tabbing past the fi nal fi eld in a record brings up the next record for entry.
EXERCISE 10.9 (continued)
EXERCISE FIGURE 10.9.D Example of Attempt to Enter Invalid Data
Source: Authors’ example within Access software.
142 | IMPLEMENTING A NATIONAL ASSESSMENT OF EDUCATIONAL ACHIEVEMENT
Inserting New Fields or Adding Fields to the Template
More fi elds must sometimes be created (for example, if the template was created with 12 items and the test has 30 items). New fi elds can be added in one of two ways. The fi rst involves clicking on the ab| icon on the toolbar on the Form Design Tools – Design ribbon and clicking on the area of the form where the fi eld is to be added. (Note: If the icon is not visible, depress the hammer and wrench button on the toolbar, and it will appear.) The size and shape of the label and text box (as well as the properties of the fi elds) will be set to default values. They must be resized (or changed) manually if they are to be identical to the labels and text boxes already on the form. Then, set the control source for the text box by right-clicking on the text box (the box on the right), selecting Property Sheet from the Design rib-bon, selecting the Data tab, and then choosing the relevant source from the Control Source drop-down menu. These steps will change the text box contents from Unbound to the relevant source.
The second (and faster) way to add another fi eld involves copying (CTRL+C) a label and text box, and then pasting (CTRL+V) them onto the form. This copy will be identical in all respects to the origi-nal data and can be added by selecting and pasting groups (rather than just single sets) of labels and text boxes. Then, the text name and the variable data can be changed to the required values. The labels and text boxes will automatically be pasted into the top right-hand corner of the page and can be moved by clicking and dragging or by using the arrow keys.
Exporting Data
When all the data have been entered, you can review the completed data entry in the original table that is now linked to the form. The data entered into an Access form or table can be exported as an .xls or .txt fi le by opening the table to be exported and then clicking on either the Excel or Text fi le icon from the Export section of the External Data ribbon. The destination of the fi le can be edited by clicking on the Browse button and navigating to the desired location; the fi le name can be changed by editing the text in the FileName text box. Note that none of the exercises uses Excel export as a data source; it is used as a checking mechanism as described in exercise 11.1. Data cannot be
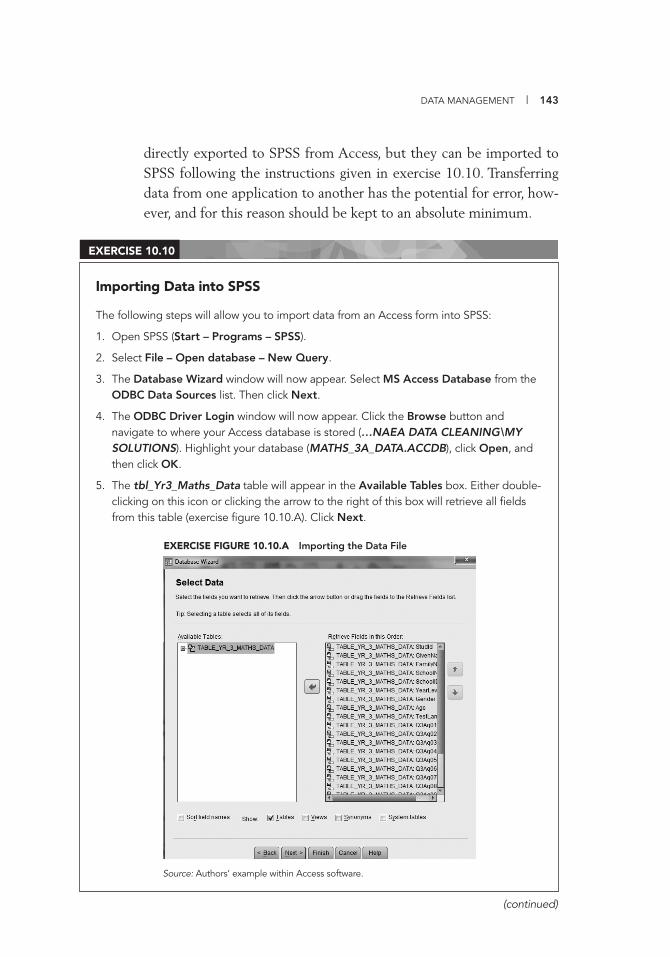
DATA MANAGEMENT | 143
Importing Data into SPSS
The following steps will allow you to import data from an Access form into SPSS:
1. Open SPSS (Start – Programs – SPSS).
2. Select File – Open database – New Query.
3. The Database Wizard window will now appear. Select MS Access Database from the ODBC Data Sources list. Then click Next.
4. The ODBC Driver Login window will now appear. Click the Browse button and navigate to where your Access database is stored (…NAEA DATA CLEANING\MY SOLUTIONS). Highlight your database (MATHS_3A_DATA.ACCDB), click Open, and then click OK.
5. The tbl_Yr3_Maths_Data table will appear in the Available Tables box. Either double-clicking on this icon or clicking the arrow to the right of this box will retrieve all fi elds from this table (exercise fi gure 10.10.A). Click Next.
EXERCISE 10.10
(continued)
EXERCISE FIGURE 10.10.A Importing the Data File
Source: Authors’ example within Access software.
directly exported to SPSS from Access, but they can be imported to SPSS following the instructions given in exercise 10.10. Transferring data from one application to another has the potential for error, how-ever, and for this reason should be kept to an absolute minimum.
144 | IMPLEMENTING A NATIONAL ASSESSMENT OF EDUCATIONAL ACHIEVEMENT
6. The next screen allows you to limit the number of cases retrieved by specifying selection criteria. You want to import all cases, so simply click Next.
7. The next screen allows you to edit variable names and properties. For the purposes of this exercise, you will leave the default values in place and click Next.
8. The fi nal screen shows the SPSS syntax that can be used to perform this particular import. If identical imports (or similar imports with small amendments made) will be performed in the future, you will want to paste the syntax for future use or modifi cation. For now, leave the Retrieve the data I have selected option selected. Click Finish. (Note that in the Variable View, the Label, Values, and Missing columns are blank. These columns should ideally be fi lled out before analysis of the data is undertaken.)
EXERCISE 10.10 (continued)
The Access table imported into SPSS in exercise 10.10 will contain only the data manually entered in the previous exercises. To save time, a data set has been created and imported into SPSS. It is called DATA_SET_1.SAV in the EXERCISES folder. This SPSS fi le contains 297 records and contains some deliberate errors that have been added and that will be addressed in the exercises that follow. Data for the Label, Values, and Missing columns in Variable View have been added as well. Note also that a SchoolID column has been added for this data set. Parts 1 and 2 of this volume have covered how to create and use school identifi cation numbers when conducting national assess-ments (see pp 22 and 67). Instructions on how to create derived vari-ables are provided in parts II and IV of this volume.
DATA
VERIFICATION11CHAPTER
145
Data verifi cation is the process of ensuring that the data received from the various sources are free from error. Data entry processes that are well planned, documented, and supervised help reduce errors when student test and questionnaire responses are transferred to electronic data formats. However, sources of error re-main, including miskeyed responses, omitted data, and errors in ma-nipulating and merging data from different sources.
DOCUMENTATION
Given that national assessments involve teams working on different aspects of data, sometimes over a considerable time period, the na-tional assessment agency must have a record of all changes made to data. This record will be especially helpful to those who carry out follow-up national assessments and to those who conduct secondary analyses of data.
For this reason, a ReadMe fi le should be created to record any changes made to the data fi le by the key operators during data entry. The fi le should also document the source and the fi le name of the cleaned data fi le. This record should help prevent confusion over the version of the data that should be analyzed. Although some programs,
146 | IMPLEMENTING A NATIONAL ASSESSMENT OF EDUCATIONAL ACHIEVEMENT
such as SPSS (Statistical Package for the Social Sciences), automati-cally record changes made to the data while using the program, keep-ing a ReadMe fi le throughout the duration of the project is still im-portant so that a record of all changes from all programs and operations is stored in one place.
The ReadMe fi le called README.DOCX in the EXERCISE SOLUTIONS folder is an example of the documentation that sup-ports the data cleaning processes (see annex III.A).
CONSISTENCY BETWEEN FILES
Many national assessments enter each data record twice. The purpose of double punching is to have two data sets that can be checked against each other to fi nd miskeyed cases. If the national assessment requires a double-punch methodology, the accuracy of each fi le has to be checked and the original data corrected.
Exercise 11.1 contains the responses of six students taken from a much larger data set that were punched twice and compared for ac-curacy. For the sake of economy and practicality, Excel was used to compare responses for this exercise. Ordinarily, less readily available programs, such as WinDem, or more expensive programs, such as SPSS Data Entry module, would be used for between-fi le consistency checks. Crucially, using Excel in this way does not require that the data im-ported into Excel be used for any further analysis. Excel is merely used as a tool to highlight possible errors in the Access data, and these data are then updated manually in the Access database. This method, there-fore, limits the potential avenues for error that exist when transferring data from one application to another. Note: During a real-life national assessment, a backup copy of the original (preedited) database should be created. This initial record can serve as an invaluable resource, es-pecially if questions about possible erroneous changes arise.
WITHIN-FILE CONSISTENCY
Within-fi le consistency pertains to the checking processes to determine whether data are as accurate as possible. Even with a comprehensive
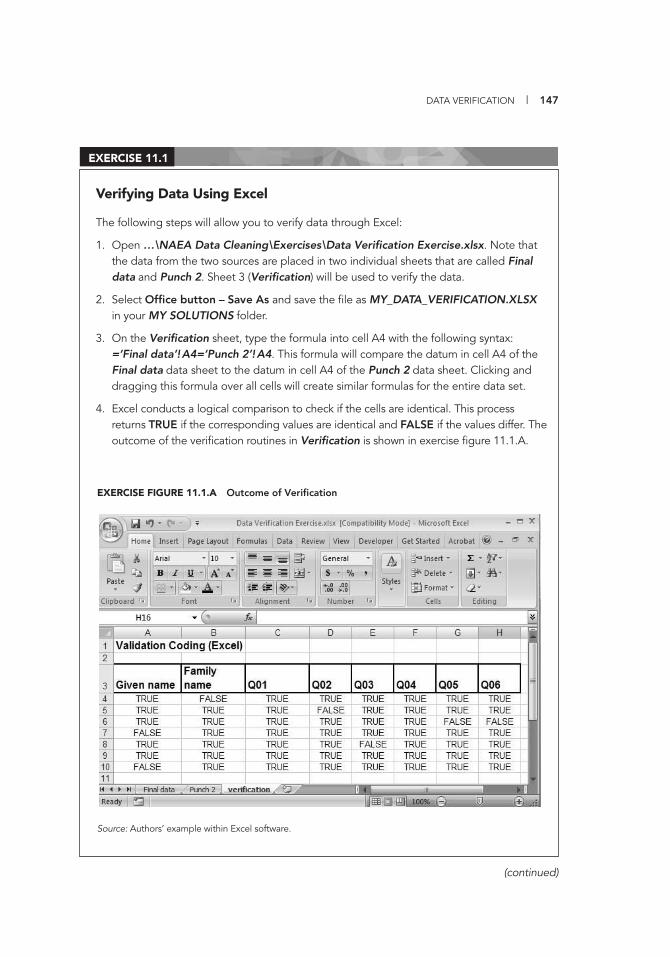
DATA VERIFICATION | 147
Verifying Data Using Excel
The following steps will allow you to verify data through Excel:
1. Open …\NAEA Data Cleaning\Exercises\Data Verifi cation Exercise.xlsx. Note that the data from the two sources are placed in two individual sheets that are called Final data and Punch 2. Sheet 3 (Verifi cation) will be used to verify the data.
2. Select Offi ce button – Save As and save the fi le as MY_DATA_VERIFICATION.XLSX in your MY SOLUTIONS folder.
3. On the Verifi cation sheet, type the formula into cell A4 with the following syntax: =‘Final data’!A4=‘Punch 2’!A4. This formula will compare the datum in cell A4 of the Final data data sheet to the datum in cell A4 of the Punch 2 data sheet. Clicking and dragging this formula over all cells will create similar formulas for the entire data set.
4. Excel conducts a logical comparison to check if the cells are identical. This process returns TRUE if the corresponding values are identical and FALSE if the values differ. The outcome of the verifi cation routines in Verifi cation is shown in exercise fi gure 11.1.A.
EXERCISE 11.1
EXERCISE FIGURE 11.1.A Outcome of Verifi cation
Source: Authors’ example within Excel software.
(continued)
148 | IMPLEMENTING A NATIONAL ASSESSMENT OF EDUCATIONAL ACHIEVEMENT
data entry template, errors or incomplete data are still possible. For example, a national assessment may have been implemented in grades 3 and 7, but classes mixed with these year levels may have also partici-pated. The valid responses to the fi eld Year level should be only 2, 3, 4, 6, 7, and 8. If the validation rule specifi ed that only numeric values between 2 and 8 (inclusive) are valid, an incorrect value of 5 could be miskeyed and would not be trapped by the validation rule.
Typically, when data inconsistencies are found, the only option is to extract the original source document (the student’s test paper) and correct the error. This need for cross-checking is the main reason for ensuring that data entry personnel have easy access to the original tests and questionnaires.
SPSS is widely available and has therefore been used in the follow-ing section to verify within-fi le consistency. Other programs that can carry out this task effi ciently include WinDem, STATISTICA, and SAS (Statistical Analysis Software).
Demographic Data (School Name) Consistency
Spelling mistakes on test booklets and questionnaires are not unusual and can cause data management problems. A common source of error is when a student misspells or abbreviates a school name and the data entry operator copies this error exactly from the student test booklet. (This type of error is not an issue when student identifi ers, or IDs, that include a school code are assigned before tests and questionnaires are sent to schools.) Not uncommonly, the student booklets may have
EXERCISE 11.1 (continued)
5. Save the spreadsheet (CTRL+S). The worked solution for this exercise is located here:…\NAEA DATA CLEANING\EXERCISE SOLUTIONS\DATA_VERIFICATION_EXERCISE_SOLUTION.XLXS.
The validation output in exercise fi gure 11.1.A shows two FALSE comparisons in the Given name fi eld, indicating keying errors in the given names. Five more errors in the other data fi elds have to be checked by referring back to the original test booklets.
Corrections to the data should be made to the relevant table in the Access database, with all corrections recorded in the README.DOCX fi le as outlined in the “Documentation” section of this chapter.
DATA VERIFICATION | 149
several variations of the same school name. For this reason, matching and merging fi les are best done by using the school ID (kept from the sampling frame) rather than the name (provided by the responding students).
For reporting purposes, it is best to create a separate table in the Ac-cess database that contains all the correctly spelled school names with their corresponding school IDs. This table can then be linked to the stu-dent data table and used for all offi cial reporting purposes (for example, printing the school name on a student’s test certifi cate in rare cases in which students get results). Linking a school name table with the stu-dent response data table in this way is demonstrated in chapter 16.
The Frequency Command
The Frequency command in SPSS allows one to observe all the values that are present in each selected variable. If out-of-range values (in-valid values) are present, they can be corrected after cross-checking with the original test booklet. The frequency output table can also be used to highlight the occurrence of implausible values. For example, if the national assessment was administered in all schools across the country at a particular year level, one may reasonably expect a rela-tively even 50:50 split of males and females in the gender variable. If the frequency table shows a 70:30 split, one would need to investigate why this might be the case and rectify the problem, if warranted.
The Frequency procedure is suitable for most noncontinuous vari-ables in a data set. Checking all fi elds for anomalies is advisable as a matter of course, regardless of the data validation rules that may have been in place at the time of data entry. Note: The invalid value of 13 for the Q3Aq02 fi eld presented in exercise 11.2 theoretically should not be possible with the data validation rules set up in Access at the data entry stage; nonetheless, it is presented as an example of an in-valid value for the sake of the exercise.
System-Missing Cells
As a general rule, the data set should have no blank spaces. The code frame and validation procedures should allow for all possible re-sponses, including a nonresponse (usually a 9, 99, or 999, depending
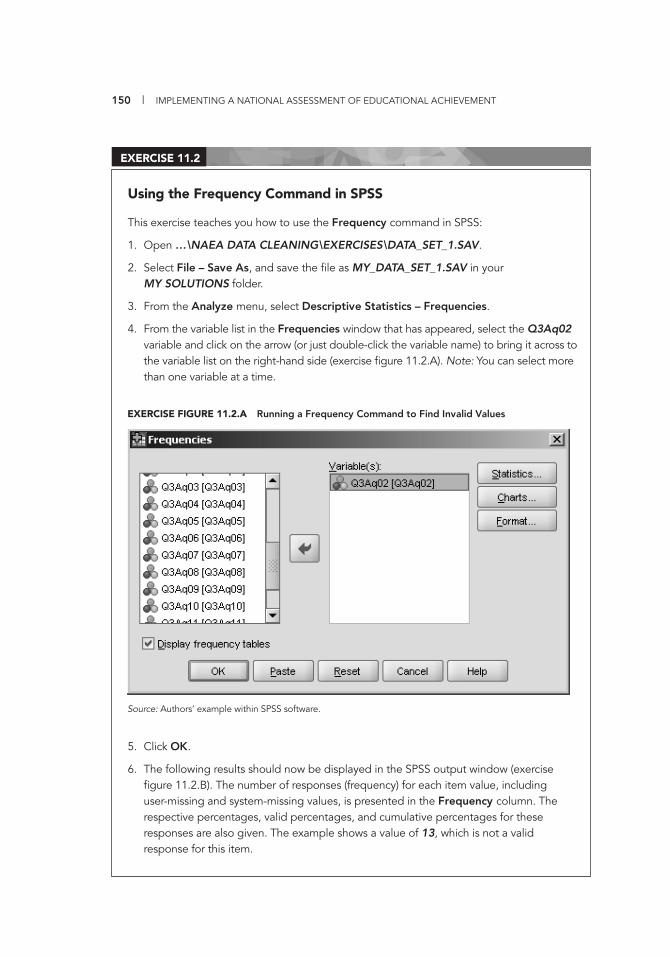
150 | IMPLEMENTING A NATIONAL ASSESSMENT OF EDUCATIONAL ACHIEVEMENT
Using the Frequency Command in SPSS
This exercise teaches you how to use the Frequency command in SPSS:
1. Open …\NAEA DATA CLEANING\EXERCISES\DATA_SET_1.SAV.
2. Select File – Save As, and save the fi le as MY_DATA_SET_1.SAV in your MY SOLUTIONS folder.
3. From the Analyze menu, select Descriptive Statistics – Frequencies.
4. From the variable list in the Frequencies window that has appeared, select the Q3Aq02 variable and click on the arrow (or just double-click the variable name) to bring it across to the variable list on the right-hand side (exercise fi gure 11.2.A). Note: You can select more than one variable at a time.
EXERCISE 11.2
EXERCISE FIGURE 11.2.A Running a Frequency Command to Find Invalid Values
Source: Authors’ example within SPSS software.
5. Click OK.
6. The following results should now be displayed in the SPSS output window (exercise fi gure 11.2.B). The number of responses (frequency) for each item value, including user-missing and system-missing values, is presented in the Frequency column. The respective percentages, valid percentages, and cumulative percentages for these responses are also given. The example shows a value of 13, which is not a valid response for this item.
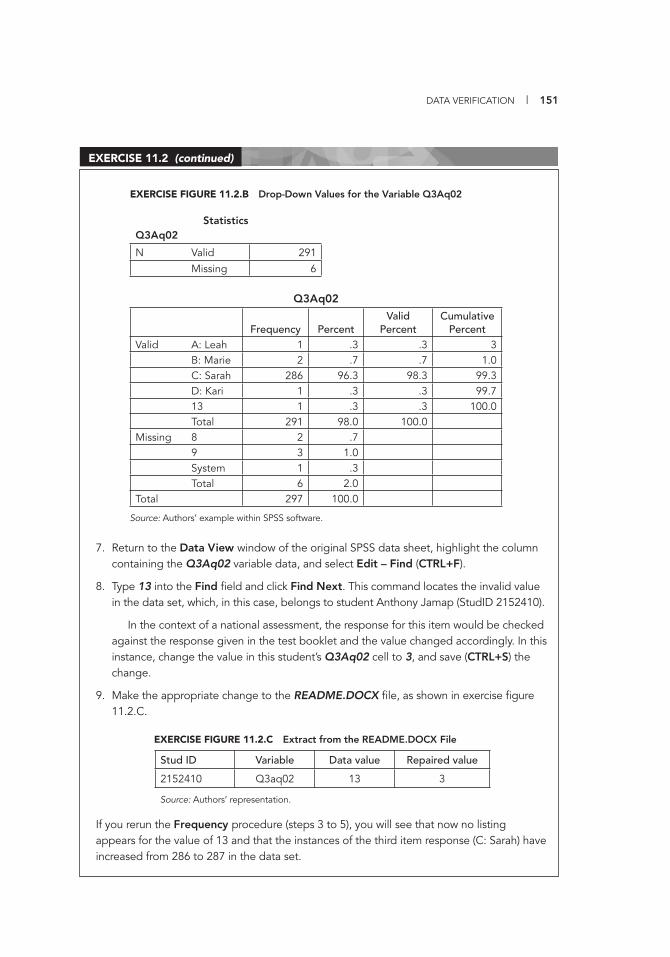
DATA VERIFICATION | 151
7. Return to the Data View window of the original SPSS data sheet, highlight the column containing the Q3Aq02 variable data, and select Edit – Find (CTRL+F).
8. Type 13 into the Find fi eld and click Find Next. This command locates the invalid value in the data set, which, in this case, belongs to student Anthony Jamap (StudID 2152410).
In the context of a national assessment, the response for this item would be checked against the response given in the test booklet and the value changed accordingly. In this instance, change the value in this student’s Q3Aq02 cell to 3, and save (CTRL+S) the change.
9. Make the appropriate change to the README.DOCX fi le, as shown in exercise fi gure 11.2.C.
If you rerun the Frequency procedure (steps 3 to 5), you will see that now no listing appears for the value of 13 and that the instances of the third item response (C: Sarah) have increased from 286 to 287 in the data set.
EXERCISE 11.2 (continued)
EXERCISE FIGURE 11.2.B Drop-Down Values for the Variable Q3Aq02
StatisticsQ3Aq02
N Valid 291
Missing 6
Q3Aq02
Frequency PercentValid
PercentCumulative
PercentValid A: Leah 1 .3 .3 3
B: Marie 2 .7 .7 1.0C: Sarah 286 96.3 98.3 99.3D: Kari 1 .3 .3 99.713 1 .3 .3 100.0Total 291 98.0 100.0
Missing 8 2 .79 3 1.0System 1 .3Total 6 2.0
Total 297 100.0
Source: Authors’ example within SPSS software.
Stud ID Variable Data value Repaired value
2152410 Q3aq02 13 3
Source: Authors’ representation.
EXERCISE FIGURE 11.2.C Extract from the README.DOCX File
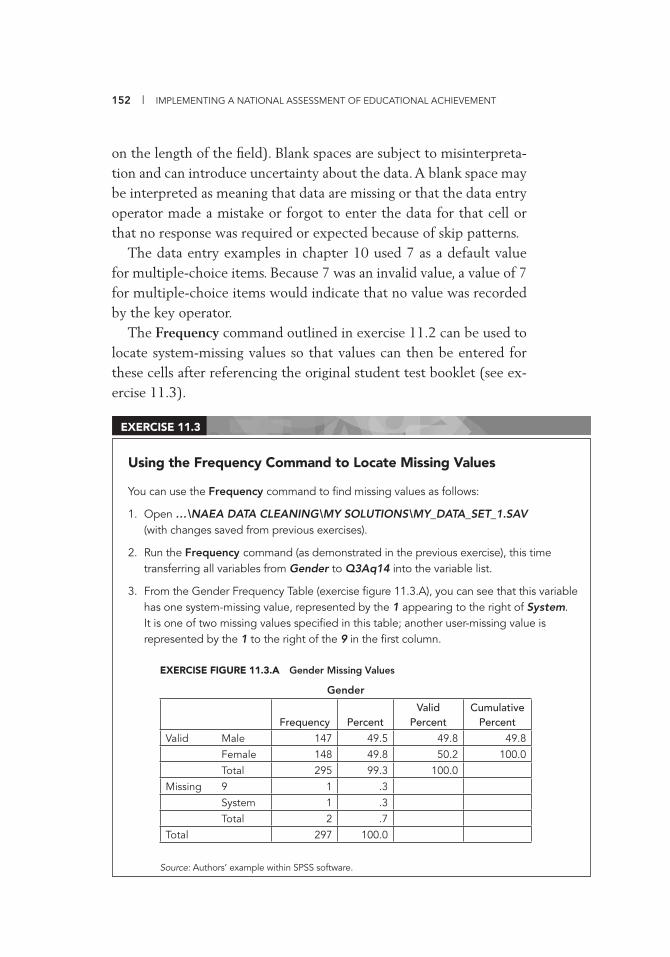
152 | IMPLEMENTING A NATIONAL ASSESSMENT OF EDUCATIONAL ACHIEVEMENT
on the length of the fi eld). Blank spaces are subject to misinterpreta-tion and can introduce uncertainty about the data. A blank space may be interpreted as meaning that data are missing or that the data entry operator made a mistake or forgot to enter the data for that cell or that no response was required or expected because of skip patterns.
The data entry examples in chapter 10 used 7 as a default value for multiple-choice items. Because 7 was an invalid value, a value of 7 for multiple-choice items would indicate that no value was recorded by the key operator.
The Frequency command outlined in exercise 11.2 can be used to locate system-missing values so that values can then be entered for these cells after referencing the original student test booklet (see ex-ercise 11.3).
Using the Frequency Command to Locate Missing Values
You can use the Frequency command to fi nd missing values as follows:
1. Open …\NAEA DATA CLEANING\MY SOLUTIONS\MY_DATA_SET_1.SAV (with changes saved from previous exercises).
2. Run the Frequency command (as demonstrated in the previous exercise), this time transferring all variables from Gender to Q3Aq14 into the variable list.
3. From the Gender Frequency Table (exercise fi gure 11.3.A), you can see that this variable has one system-missing value, represented by the 1 appearing to the right of System. It is one of two missing values specifi ed in this table; another user-missing value is represented by the 1 to the right of the 9 in the fi rst column.
EXERCISE 11.3
EXERCISE FIGURE 11.3.A Gender Missing Values
Gender
Frequency PercentValid
PercentCumulative
Percent
Valid Male 147 49.5 49.8 49.8
Female 148 49.8 50.2 100.0
Total 295 99.3 100.0
Missing 9 1 .3
System 1 .3
Total 2 .7
Total 297 100.0
Source: Authors’ example within SPSS software.
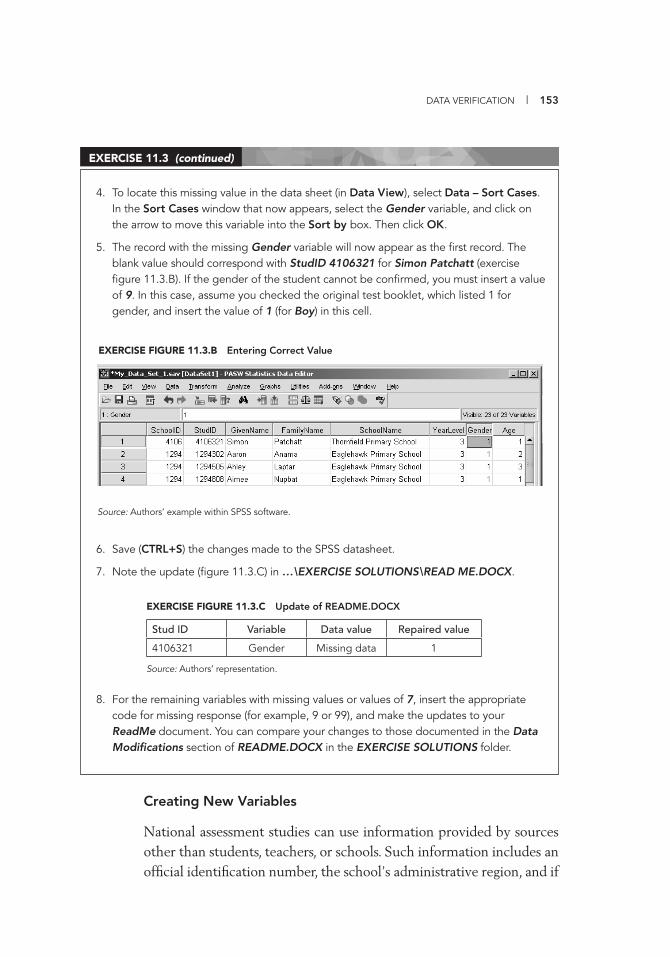
DATA VERIFICATION | 153
4. To locate this missing value in the data sheet (in Data View), select Data – Sort Cases. In the Sort Cases window that now appears, select the Gender variable, and click on the arrow to move this variable into the Sort by box. Then click OK.
5. The record with the missing Gender variable will now appear as the fi rst record. The blank value should correspond with StudID 4106321 for Simon Patchatt (exercise fi gure 11.3.B). If the gender of the student cannot be confi rmed, you must insert a value of 9. In this case, assume you checked the original test booklet, which listed 1 for gender, and insert the value of 1 (for Boy) in this cell.
6. Save (CTRL+S) the changes made to the SPSS datasheet.
7. Note the update (fi gure 11.3.C) in …\EXERCISE SOLUTIONS\READ ME.DOCX.
8. For the remaining variables with missing values or values of 7, insert the appropriate code for missing response (for example, 9 or 99), and make the updates to your ReadMe document. You can compare your changes to those documented in the Data Modifi cations section of README.DOCX in the EXERCISE SOLUTIONS folder.
EXERCISE 11.3 (continued)
EXERCISE FIGURE 11.3.B Entering Correct Value
Source: Authors’ example within SPSS software.
Stud ID Variable Data value Repaired value
4106321 Gender Missing data 1
Source: Authors’ representation.
EXERCISE FIGURE 11.3.C Update of README.DOCX
Creating New Variables
National assessment studies can use information provided by sources other than students, teachers, or schools. Such information includes an offi cial identifi cation number, the school’s administrative region, and if
154 | IMPLEMENTING A NATIONAL ASSESSMENT OF EDUCATIONAL ACHIEVEMENT
the school was in a specifi c pilot initiative. Some of this information could be provided by the ministry of education, notably by an educa-tion management information system. Other variables of interest to the assessment team may be derived variables, not directly collected from the students, their teachers, or their schools, but obtained as a combination of data elements readily available in the booklets.
Even if the data set is created with Access, the derived variables can be computed in SPSS. Parts II and IV of this volume give several ex-amples of variable creation in SPSS, using the menu commands Transform – Compute Variable ... , that can easily be adapted to meet particular needs, such as creating a parental education level index that is based on the highest levels of education attained by the mother and father.
Creating new variables can lead to errors. It is best to avoid ma-nipulating many fi les and records. When derived variables are created using SPSS, considerable time can be saved by applying one com-mand (which can be reversed) to many records.
IMPORTING
AND MERGING
DATA
12CHAPTER
155
In chapter 10, routines were addressed to mini-mize data entry errors using Access. Part II looked at the creation of derived variables using the menu commands Transform – Compute Variable in SPSS (Statistical Package for the Social Sciences). With these routines completed, if the additional variables have been cre-ated outside Access, it is useful to import the fi les back into Access to enable effi cient merging of data. This chapter describes the process for exporting data from SPSS into Access and provides some useful verifi cation routines.
THE DANGERS OF TRANSFERRING DATA BETWEEN PROGRAMS
Care should always be taken when transferring data between fi les or joining data from different sources because errors can occur. Such er-rors can be implicit or explicit. Implicit errors arise because programs store or code data in different ways, which may result in some data being irrevocably lost or changed during the transfer process. A com-mon error arises when the item type for a data fi eld in one application differs from that in another application. For example, one may choose
156 | IMPLEMENTING A NATIONAL ASSESSMENT OF EDUCATIONAL ACHIEVEMENT
to store certain numeric data as text, so that the digits will be stored exactly as entered. This method is commonplace to maintain the in-tegrity of an identifi er (ID) number beginning with a 0. However, the application to which these data are exported may register the digits in the fi elds and store the ID numbers as numeric data. Consequently, the data are stored as numbers and the 0 digit from the beginning of the ID number is deleted.
Data may also be lost on transfer if the fi eld length for data items differs between programs. For example, if the original application has a fi eld width of 15 characters and the application receiving the data has a fi eld width of only 5 characters, any data in excess of 5 charac-ters will be lost. Issues relating to consistency of fi eld names, applica-tions not accepting certain characters in fi eld names, and consistency of coding (such as how missing values are stored) are also possible avenues for an error to be introduced in the data.
Errors of an explicit nature typically result from human error. Ac-cidentally deleting data, “slipping” records, and partially transferring data are all examples of explicit data errors, and the more times data are transferred between programs, the more likely such errors will occur. For these reasons, importing and exporting routines should be performed with caution and only when absolutely necessary.
EXPORTING DATA FROM SPSS INTO ACCESS
SPSS has a function that can export data to an Access database. For the purposes of exercise 12.1, an SPSS fi le has been created with all the necessary corrections made to the errors in the raw data that were dis-covered in chapter 11. This corrected fi le is located in …\NAEA DATA CLEANING\EXERCISE SOLUTIONS\DATA_SET_1_SOLUTION.SAV.
Note: If importing data into Access from another source, one should ensure that the fi eld names do not contain any spaces or special char-acters (for example, *, &, $). If such spaces or special characters do exist, they should be replaced with the underscore character (_), which is allowed. Because SPSS does not allow these characters in its

IMPORTING AND MERGING DATA | 157
Exporting Data from SPSS into Access
The following exercise will demonstrate how to export data from SPSS into Access:
1. Open …\NAEA DATA CLEANING\EXERCISE SOLUTIONS\DATA_SET_1_ SOLUTION.SAV.
2. From the toolbar, select File – Export to Database.
3. From the ODBC Data Sources box, highlight MS Access Database, and click Next (or simply double-click on MS Access Database).
4. From the ODBC Driver Login screen, browse for the database you created earlier (…\MY SOLUTIONS\MATHS_3A_DATA.ACCDB). Click Open, and then click OK.
5. From the Choose how to export the data screen, check the last box: Create a new table.
6. In the Name textbox, type in TBL_MATHS_3A_DATA_CLEANED. Then click Next.
7. From the Select variables to store in new table screen, highlight all variables in the left-hand box (CTRL+A). Then click one of the arrows in the right-hand table to bring all vari-ables over to the Table: TBL_MATHS_3A_DATA_CLEANED box (exercise fi gure 12.1.A).
8. Click Next and then Finish.
SPSS has exported the data into Access and created the new table, TBL_MATHS_3A_DATA_CLEANED, as evidenced by this table being listed in the All Access Objects menu in your Access database.
EXERCISE 12.1
Source: Authors’ example within SPSS software.
EXERCISE FIGURE 12.1.A Selecting Variables to Export
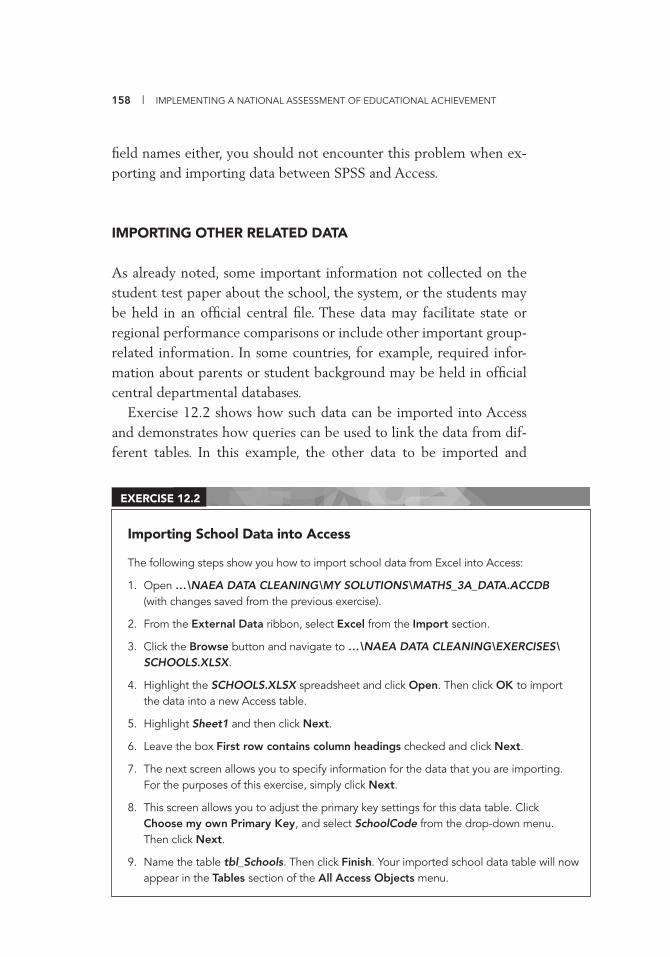
158 | IMPLEMENTING A NATIONAL ASSESSMENT OF EDUCATIONAL ACHIEVEMENT
fi eld names either, you should not encounter this problem when ex-porting and importing data between SPSS and Access.
IMPORTING OTHER RELATED DATA
As already noted, some important information not collected on the student test paper about the school, the system, or the students may be held in an offi cial central fi le. These data may facilitate state or regional performance comparisons or include other important group-related information. In some countries, for example, required infor-mation about parents or student background may be held in offi cial central departmental databases.
Exercise 12.2 shows how such data can be imported into Access and demonstrates how queries can be used to link the data from dif-ferent tables. In this example, the other data to be imported and
Importing School Data into Access
The following steps show you how to import school data from Excel into Access:
1. Open …\NAEA DATA CLEANING\MY SOLUTIONS\MATHS_3A_DATA.ACCDB (with changes saved from the previous exercise).
2. From the External Data ribbon, select Excel from the Import section.
3. Click the Browse button and navigate to …\NAEA DATA CLEANING\EXERCISES\SCHOOLS.XLSX.
4. Highlight the SCHOOLS.XLSX spreadsheet and click Open. Then click OK to import the data into a new Access table.
5. Highlight Sheet1 and then click Next.
6. Leave the box First row contains column headings checked and click Next.
7. The next screen allows you to specify information for the data that you are importing. For the purposes of this exercise, simply click Next.
8. This screen allows you to adjust the primary key settings for this data table. Click Choose my own Primary Key, and select SchoolCode from the drop-down menu. Then click Next.
9. Name the table tbl_Schools. Then click Finish. Your imported school data table will now appear in the Tables section of the All Access Objects menu.
EXERCISE 12.2
IMPORTING AND MERGING DATA | 159
linked relate to schools and are held in a central Excel fi le called SCHOOLS.XLSX. The SchoolName fi eld from this fi le can also be used for all offi cial reporting purposes that require the school name to be spelled correctly (for example, printing the school name on a student’s test certifi cate), rather than the SchoolName fi eld in the student response data table, which may often be misspelled by the student and should consequently be used for cross-referencing pur-poses only.
After all the data to be merged or interrogated are imported in table format to Access, queries can be created to search for informa-tion, to create new tables with specifi c information, or to perform other investigations of the data to check the contents and quality. The following section describes two key data cleaning processes. The fi rst describes merging data from two fi les, which is a process that can be very time-consuming and error prone using other software programs such as Excel. Therefore, creating a single fi le to serve as the sole data source for all national assessment analyses is very important. The sec-ond section describes how to use Access to search for duplicate re-cords. Key operators (and sometimes scanner operators) sometimes become distracted and accidentally enter the same information twice. Unless a specifi c routine is used to check for duplicates, this form of data cleaning problem is often hard to detect.
MERGING DATA FROM DIFFERENT TABLES USING THE ACCESS QUERIES
Because student test papers or answer sheets contain relatively little background information that could be of use to policy makers inter-ested in the results of a national assessment, having recourse to other sources of information about schools and students may be necessary.
Previous exercises described the process for importing two tables into Access: (a) the modifi ed data table of student responses follow-ing data cleaning (TBL_MATHS_3A_DATA_CLEANED) and (b) a table that includes school information (tbl_Schools). These tables share a common fi eld: the unique school identifi er, which is labeled SchoolID in the fi rst table and SchoolCode in the second table. Exer-cise 12.3 now shows how to join these fi les.
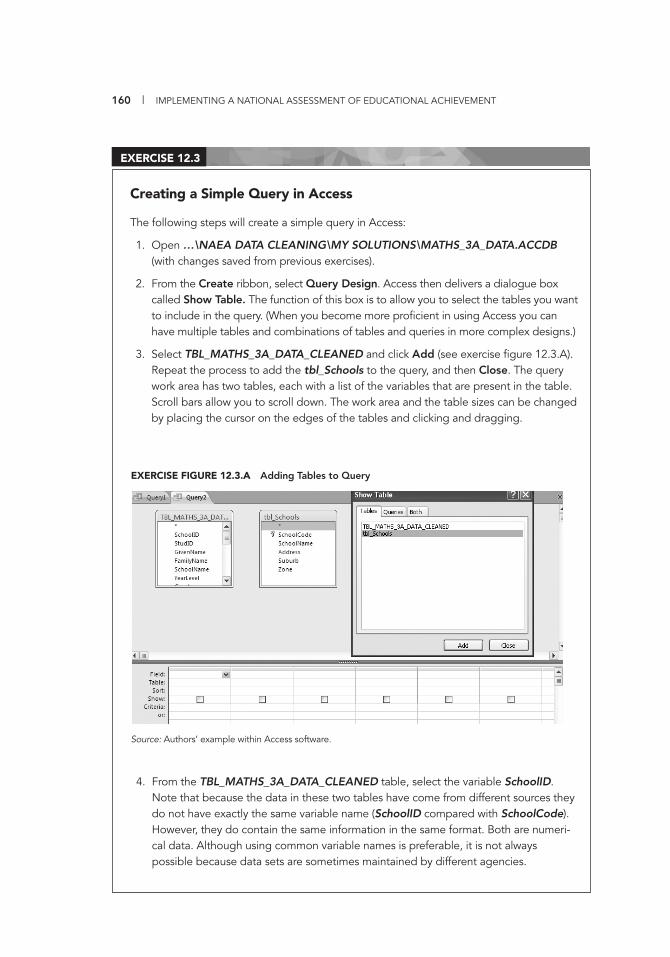
160 | IMPLEMENTING A NATIONAL ASSESSMENT OF EDUCATIONAL ACHIEVEMENT
4. From the TBL_MATHS_3A_DATA_CLEANED table, select the variable SchoolID. Note that because the data in these two tables have come from different sources they do not have exactly the same variable name (SchoolID compared with SchoolCode). However, they do contain the same information in the same format. Both are numeri-cal data. Although using common variable names is preferable, it is not always possible because data sets are sometimes maintained by different agencies.
Creating a Simple Query in Access
The following steps will create a simple query in Access:
1. Open …\NAEA DATA CLEANING\MY SOLUTIONS\MATHS_3A_DATA.ACCDB (with changes saved from previous exercises).
2. From the Create ribbon, select Query Design. Access then delivers a dialogue box called Show Table. The function of this box is to allow you to select the tables you want to include in the query. (When you become more profi cient in using Access you can have multiple tables and combinations of tables and queries in more complex designs.)
3. Select TBL_MATHS_3A_DATA_CLEANED and click Add (see exercise fi gure 12.3.A). Repeat the process to add the tbl_Schools to the query, and then Close. The query work area has two tables, each with a list of the variables that are present in the table. Scroll bars allow you to scroll down. The work area and the table sizes can be changed by placing the cursor on the edges of the tables and clicking and dragging.
EXERCISE 12.3
EXERCISE FIGURE 12.3.A Adding Tables to Query
Source: Authors’ example within Access software.
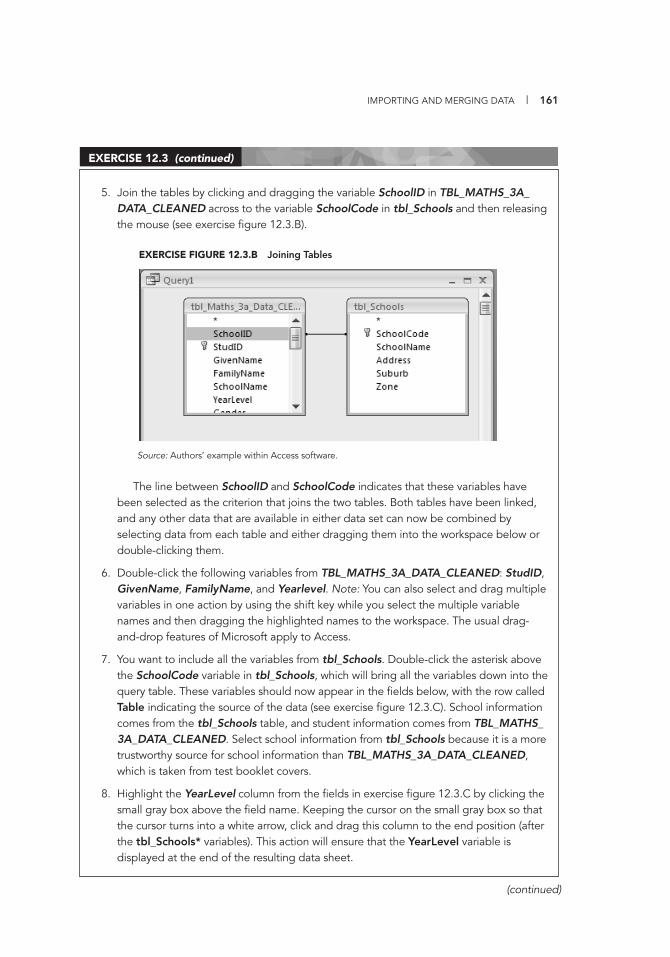
IMPORTING AND MERGING DATA | 161
(continued)
5. Join the tables by clicking and dragging the variable SchoolID in TBL_MATHS_3A_DATA_CLEANED across to the variable SchoolCode in tbl_Schools and then releasing the mouse (see exercise fi gure 12.3.B).
The line between SchoolID and SchoolCode indicates that these variables have been selected as the criterion that joins the two tables. Both tables have been linked, and any other data that are available in either data set can now be combined by selecting data from each table and either dragging them into the workspace below or double-clicking them.
6. Double-click the following variables from TBL_MATHS_3A_DATA_CLEANED: StudID, GivenName, FamilyName, and Yearlevel. Note: You can also select and drag multiple variables in one action by using the shift key while you select the multiple variable names and then dragging the highlighted names to the workspace. The usual drag-and-drop features of Microsoft apply to Access.
7. You want to include all the variables from tbl_Schools. Double-click the asterisk above the SchoolCode variable in tbl_Schools, which will bring all the variables down into the query table. These variables should now appear in the fi elds below, with the row called Table indicating the source of the data (see exercise fi gure 12.3.C). School information comes from the tbl_Schools table, and student information comes from TBL_MATHS_ 3A_DATA_CLEANED. Select school information from tbl_Schools because it is a more trust worthy source for school information than TBL_MATHS_3A_DATA_CLEANED, which is taken from test booklet covers.
8. Highlight the YearLevel column from the fi elds in exercise fi gure 12.3.C by clicking the small gray box above the fi eld name. Keeping the cursor on the small gray box so that the cursor turns into a white arrow, click and drag this column to the end position (after the tbl_Schools* variables). This action will ensure that the YearLevel variable is displayed at the end of the resulting data sheet.
EXERCISE 12.3 (continued)
EXERCISE FIGURE 12.3.B Joining Tables
Source: Authors’ example within Access software.
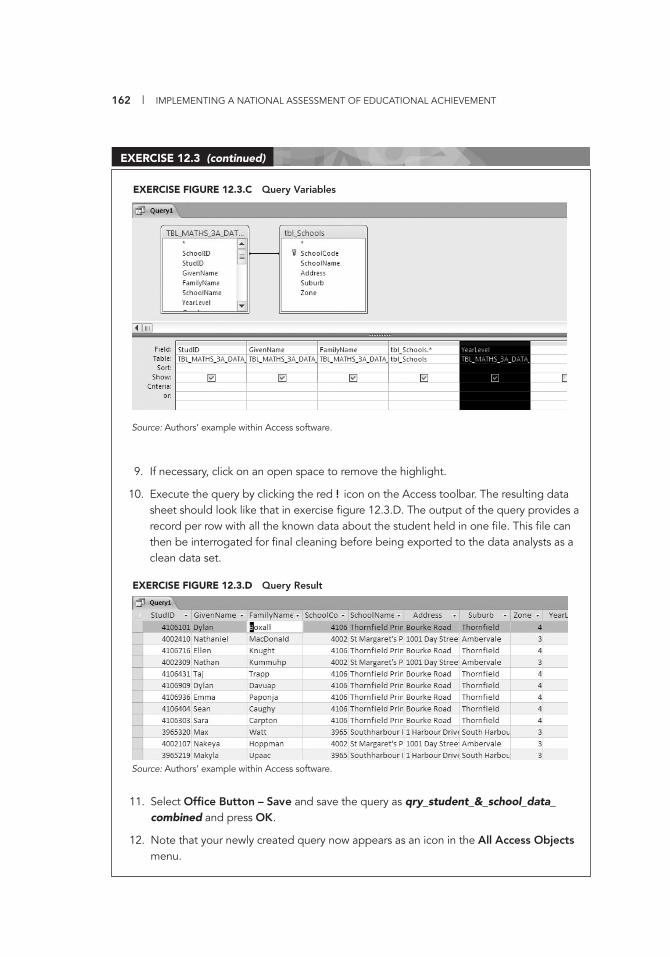
162 | IMPLEMENTING A NATIONAL ASSESSMENT OF EDUCATIONAL ACHIEVEMENT
9. If necessary, click on an open space to remove the highlight.
10. Execute the query by clicking the red ! icon on the Access toolbar. The resulting data sheet should look like that in exercise fi gure 12.3.D. The output of the query provides a record per row with all the known data about the student held in one fi le. This fi le can then be interrogated for fi nal cleaning before being exported to the data analysts as a clean data set.
EXERCISE 12.3 (continued)
EXERCISE FIGURE 12.3.C Query Variables
Source: Authors’ example within Access software.
11. Select Offi ce Button – Save and save the query as qry_student_&_school_data_combined and press OK.
12. Note that your newly created query now appears as an icon in the All Access Objects menu.
EXERCISE FIGURE 12.3.D Query Result
Source: Authors’ example within Access software.
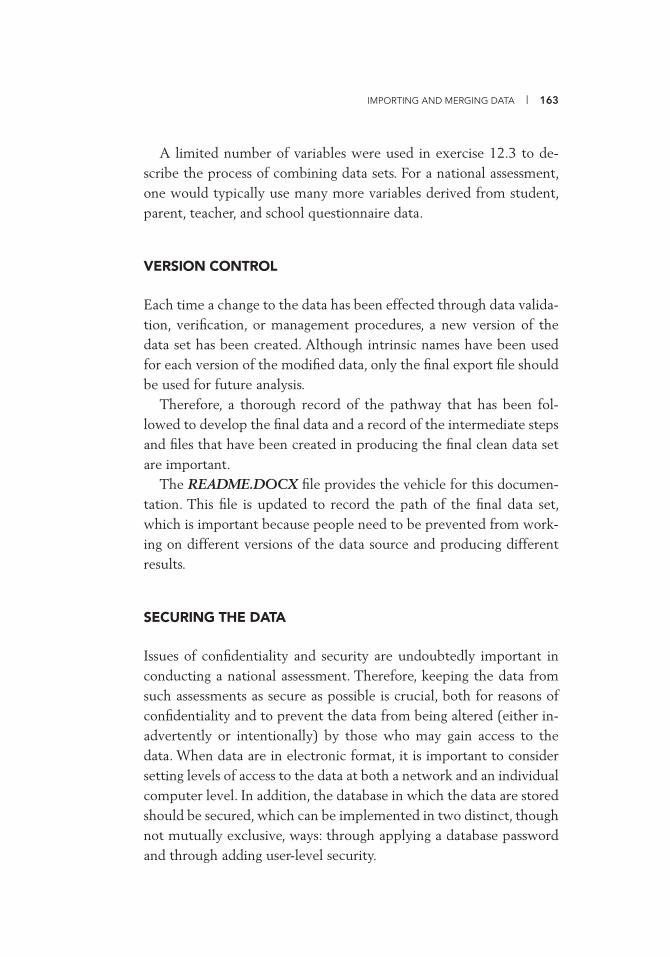
IMPORTING AND MERGING DATA | 163
A limited number of variables were used in exercise 12.3 to de-scribe the process of combining data sets. For a national assessment, one would typically use many more variables derived from student, parent, teacher, and school questionnaire data.
VERSION CONTROL
Each time a change to the data has been effected through data valida-tion, verifi cation, or management procedures, a new version of the data set has been created. Although intrinsic names have been used for each version of the modifi ed data, only the fi nal export fi le should be used for future analysis.
Therefore, a thorough record of the pathway that has been fol-lowed to develop the fi nal data and a record of the intermediate steps and fi les that have been created in producing the fi nal clean data set are important.
The README.DOCX fi le provides the vehicle for this documen-tation. This fi le is updated to record the path of the fi nal data set, which is important because people need to be prevented from work-ing on different versions of the data source and producing different results.
SECURING THE DATA
Issues of confi dentiality and security are undoubtedly important in conducting a national assessment. Therefore, keeping the data from such assessments as secure as possible is crucial, both for reasons of confi dentiality and to prevent the data from being altered (either in-advertently or intentionally) by those who may gain access to the data. When data are in electronic format, it is important to consider setting levels of access to the data at both a network and an individual computer level. In addition, the database in which the data are stored should be secured, which can be implemented in two distinct, though not mutually exclusive, ways: through applying a database password and through adding user-level security.
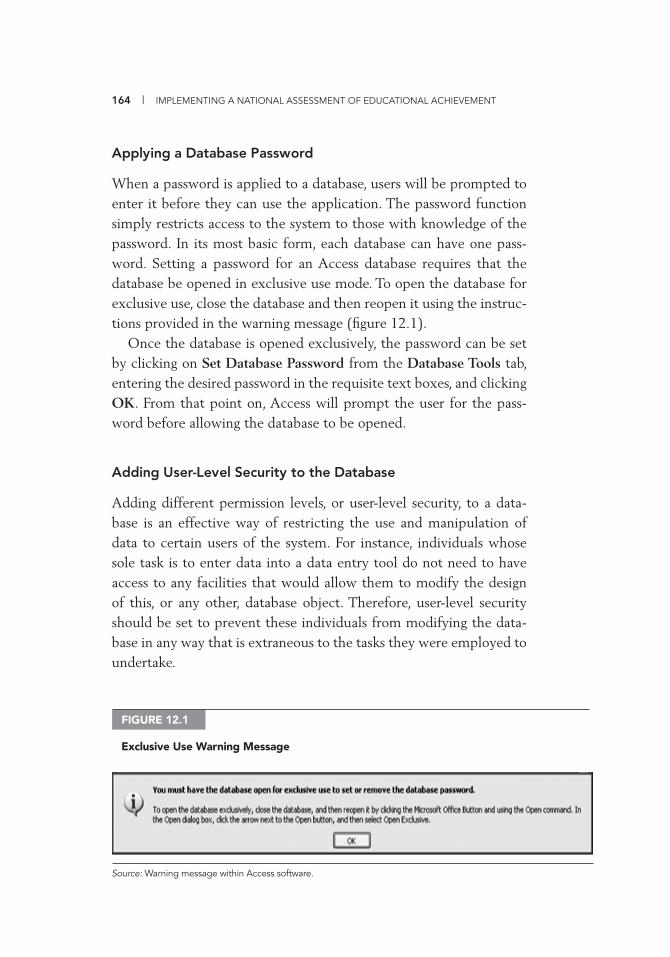
164 | IMPLEMENTING A NATIONAL ASSESSMENT OF EDUCATIONAL ACHIEVEMENT
Applying a Database Password
When a password is applied to a database, users will be prompted to enter it before they can use the application. The password function simply restricts access to the system to those with knowledge of the password. In its most basic form, each database can have one pass-word. Setting a password for an Access database requires that the database be opened in exclusive use mode. To open the database for exclusive use, close the database and then reopen it using the instruc-tions provided in the warning message (fi gure 12.1).
Once the database is opened exclusively, the password can be set by clicking on Set Database Password from the Database Tools tab, entering the desired password in the requisite text boxes, and clicking OK. From that point on, Access will prompt the user for the pass-word before allowing the database to be opened.
Adding User-Level Security to the Database
Adding different permission levels, or user-level security, to a data-base is an effective way of restricting the use and manipulation of data to certain users of the system. For instance, individuals whose sole task is to enter data into a data entry tool do not need to have access to any facilities that would allow them to modify the design of this, or any other, database object. Therefore, user-level security should be set to prevent these individuals from modifying the data-base in any way that is extraneous to the tasks they were employed to undertake.
FIGURE 12.1
Exclusive Use Warning Message
Source: Warning message within Access software.
IMPORTING AND MERGING DATA | 165
Defi ning user-level security should be one of the last actions to take place when designing a database because, after it is applied, mak-ing further modifi cations to the system can be diffi cult, and users will need to be given access to the new objects created. Applying this type of security should be done in an ordered manner, because one can easily become locked out of the system while defi ning user levels. This problem may be avoided by creating an unsecured backup copy of the database before beginning this process. The backup should be stored separately until the addition of user-level security to the origi-nal database has been successfully applied. At that stage, the unse-cured backup copy should be deleted.
In Access, user-level security can be added to a database by clicking Users and Permissions – User Level Security Wizard from the Data-base Tools tab and following the step-by-step process the Wizard sets out. As an extra measure, an effective way to keep track of the changes being made during the security setup process is to press CTRL+Print Scrn at each stage of the setup. This action will copy the current win-dow, which can then be pasted into a Word document.

DUPLICATE
DATA13CHAPTER
167
This chapter addresses the issue of duplicate data—in particular, how to check for duplicate identifi ers (IDs) and duplicate records.
USING ACCESS TO CHECK FOR DUPLICATE IDS
Entering a student’s record twice in a data fi le can easily happen, and if undetected, the extra data will distort the results. Data that include a student ID should be checked to ensure that each student has only one record. This check applies even if the national assessment team created unique IDs, because data entry personnel may have inadver-tently duplicated one or more records. Although the validation rules created in previous exercises for the StudID variable did not allow the creation of duplicate IDs, running through the following proce-dures as a double-checking mechanism is still prudent. Exercise 13.1 shows how to use Access routines to check for duplicate IDs.
INVESTIGATING DUPLICATE RECORDS
Performing a Find duplicates query on a table may return one or more duplicate entries when the data have been incorrectly entered on
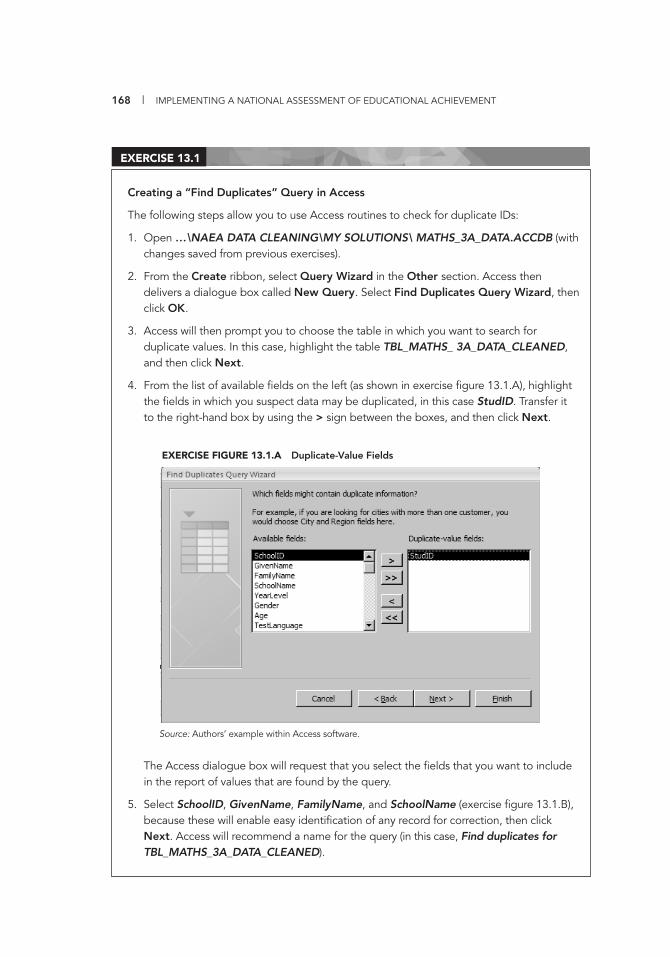
168 | IMPLEMENTING A NATIONAL ASSESSMENT OF EDUCATIONAL ACHIEVEMENT
Creating a “Find Duplicates” Query in Access
The following steps allow you to use Access routines to check for duplicate IDs:
1. Open …\NAEA DATA CLEANING\MY SOLUTIONS\ MATHS_3A_DATA.ACCDB (with changes saved from previous exercises).
2. From the Create ribbon, select Query Wizard in the Other section. Access then delivers a dialogue box called New Query. Select Find Duplicates Query Wizard, then click OK.
3. Access will then prompt you to choose the table in which you want to search for duplicate values. In this case, highlight the table TBL_MATHS_ 3A_DATA_CLEANED, and then click Next.
4. From the list of available fi elds on the left (as shown in exercise fi gure 13.1.A), highlight the fi elds in which you suspect data may be duplicated, in this case StudID. Transfer it to the right-hand box by using the > sign between the boxes, and then click Next.
The Access dialogue box will request that you select the fi elds that you want to include in the report of values that are found by the query.
5. Select SchoolID, GivenName, FamilyName, and SchoolName (exercise fi gure 13.1.B), because these will enable easy identifi cation of any record for correction, then click Next. Access will recommend a name for the query (in this case, Find duplicates for TBL_MATHS_3A_DATA_CLEANED).
EXERCISE 13.1
EXERCISE FIGURE 13.1.A Duplicate-Value Fields
Source: Authors’ example within Access software.
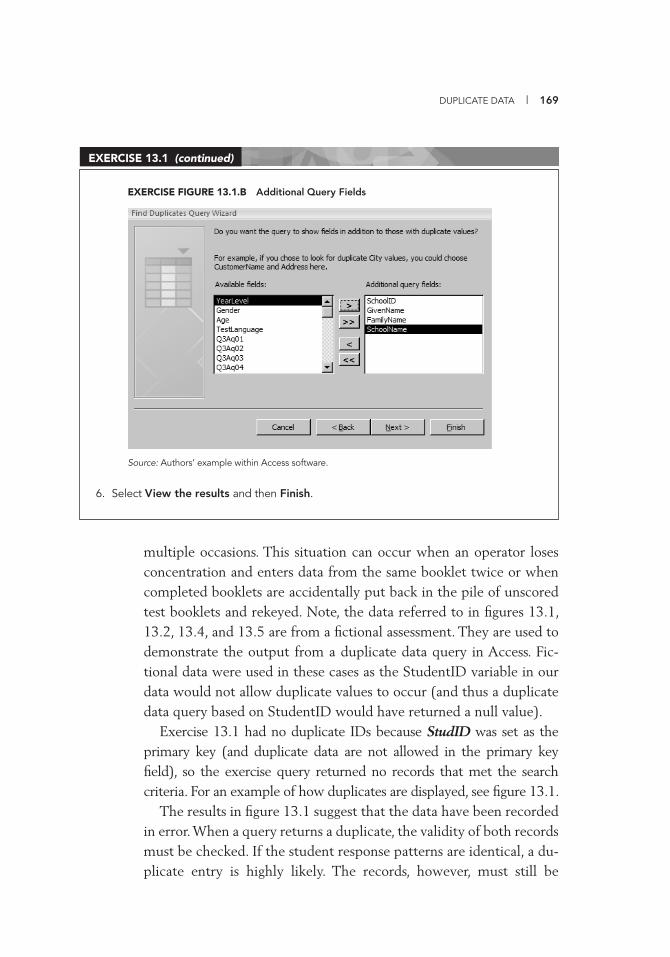
DUPLICATE DATA | 169
multiple occasions. This situation can occur when an operator loses concentration and enters data from the same booklet twice or when completed booklets are accidentally put back in the pile of unscored test booklets and rekeyed. Note, the data referred to in fi gures 13.1, 13.2, 13.4, and 13.5 are from a fi ctional assessment. They are used to demonstrate the output from a duplicate data query in Access. Fic-tional data were used in these cases as the StudentID variable in our data would not allow duplicate values to occur (and thus a duplicate data query based on StudentID would have returned a null value).
Exercise 13.1 had no duplicate IDs because StudID was set as the primary key (and duplicate data are not allowed in the primary key fi eld), so the exercise query returned no records that met the search criteria. For an example of how duplicates are displayed, see fi gure 13.1.
The results in fi gure 13.1 suggest that the data have been recorded in error. When a query returns a duplicate, the validity of both records must be checked. If the student response patterns are identical, a du-plicate entry is highly likely. The records, however, must still be
6. Select View the results and then Finish.
EXERCISE 13.1 (continued)
EXERCISE FIGURE 13.1.B Additional Query Fields
Source: Authors’ example within Access software.
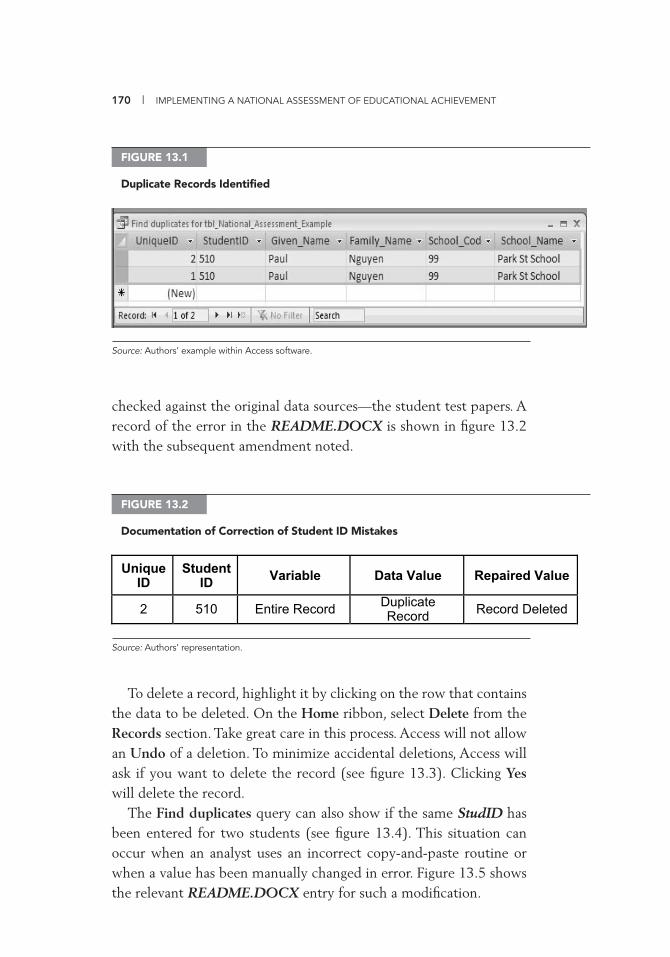
170 | IMPLEMENTING A NATIONAL ASSESSMENT OF EDUCATIONAL ACHIEVEMENT
checked against the original data sources—the student test papers. A record of the error in the README.DOCX is shown in fi gure 13.2 with the subsequent amendment noted.
FIGURE 13.1
Duplicate Records Identifi ed
Source: Authors’ example within Access software.
Source: Authors’ representation.
FIGURE 13.2
Documentation of Correction of Student ID Mistakes
Unique�ID�
Student�ID� Variable� Data�Value� Repaired�Value�
2� 510� Entire�Record� Duplicate�Record� Record�Deleted�
To delete a record, highlight it by clicking on the row that contains the data to be deleted. On the Home ribbon, select Delete from the Records section. Take great care in this process. Access will not allow an Undo of a deletion. To minimize accidental deletions, Access will ask if you want to delete the record (see fi gure 13.3). Clicking Yes will delete the record.
The Find duplicates query can also show if the same StudID has been entered for two students (see fi gure 13.4). This situation can occur when an analyst uses an incorrect copy-and-paste routine or when a value has been manually changed in error. Figure 13.5 shows the relevant README.DOCX entry for such a modifi cation.
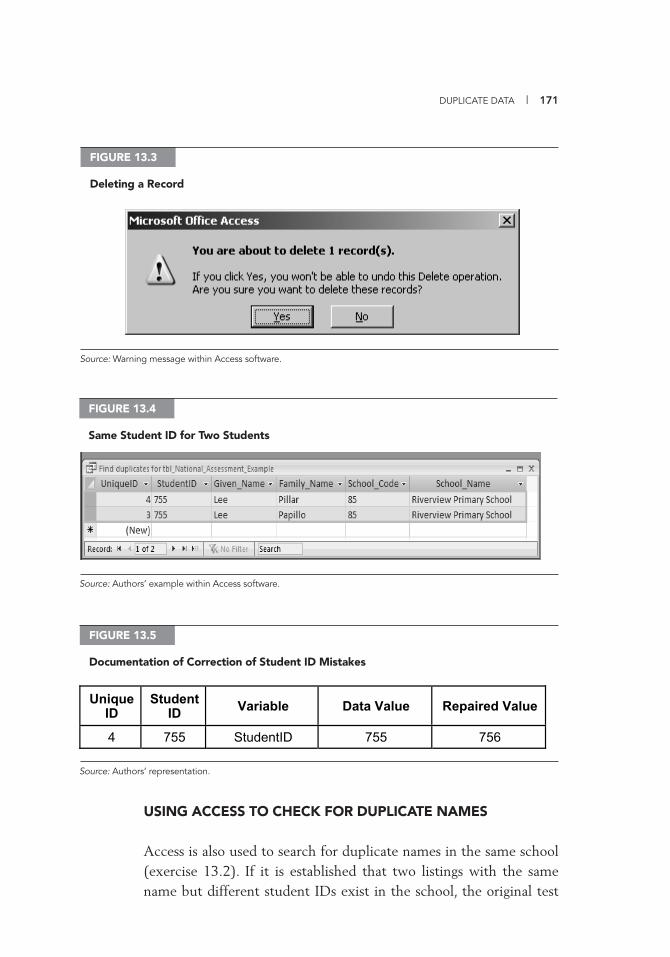
DUPLICATE DATA | 171
USING ACCESS TO CHECK FOR DUPLICATE NAMES
Access is also used to search for duplicate names in the same school (exercise 13.2). If it is established that two listings with the same name but different student IDs exist in the school, the original test
FIGURE 13.3
Deleting a Record
Source: Warning message within Access software.
FIGURE 13.4
Same Student ID for Two Students
Source: Authors’ example within Access software.
Source: Authors’ representation.
FIGURE 13.5
Documentation of Correction of Student ID Mistakes
Unique�ID�
Student�ID� Variable� Data�Value� Repaired�Value�
4� 755� StudentID� 755� 756�
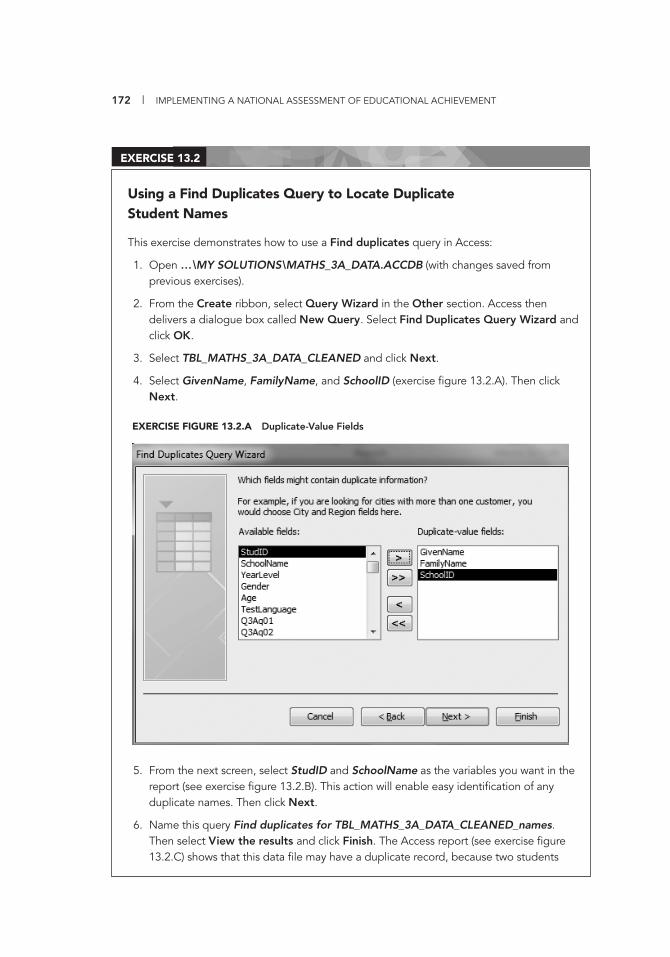
172 | IMPLEMENTING A NATIONAL ASSESSMENT OF EDUCATIONAL ACHIEVEMENT
Using a Find Duplicates Query to Locate Duplicate Student Names
This exercise demonstrates how to use a Find duplicates query in Access:
1. Open …\MY SOLUTIONS\MATHS_3A_DATA.ACCDB (with changes saved from previous exercises).
2. From the Create ribbon, select Query Wizard in the Other section. Access then delivers a dialogue box called New Query. Select Find Duplicates Query Wizard and click OK.
3. Select TBL_MATHS_3A_DATA_CLEANED and click Next.
4. Select GivenName, FamilyName, and SchoolID (exercise fi gure 13.2.A). Then click Next.
5. From the next screen, select StudID and SchoolName as the variables you want in the report (see exercise fi gure 13.2.B). This action will enable easy identifi cation of any duplicate names. Then click Next.
6. Name this query Find duplicates for TBL_MATHS_3A_DATA_CLEANED_names. Then select View the results and click Finish. The Access report (see exercise fi gure 13.2.C) shows that this data fi le may have a duplicate record, because two students
EXERCISE 13.2
EXERCISE FIGURE 13.2.A Duplicate-Value Fields
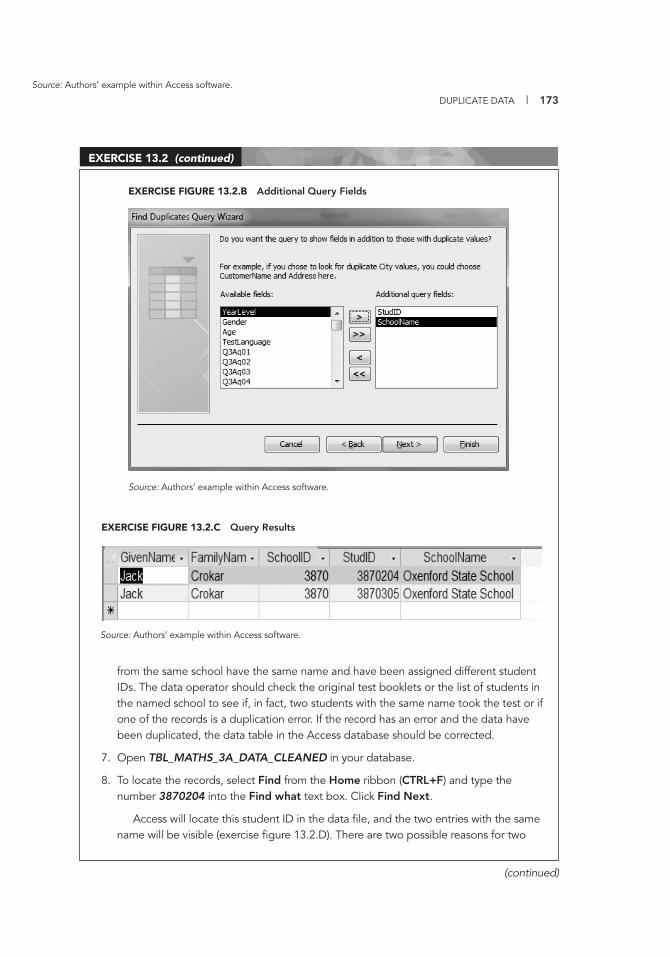
DUPLICATE DATA | 173
(continued)
from the same school have the same name and have been assigned different student IDs. The data operator should check the original test booklets or the list of students in the named school to see if, in fact, two students with the same name took the test or if one of the records is a duplication error. If the record has an error and the data have been duplicated, the data table in the Access database should be corrected.
7. Open TBL_MATHS_3A_DATA_CLEANED in your database.
8. To locate the records, select Find from the Home ribbon (CTRL+F) and type the number 3870204 into the Find what text box. Click Find Next.
Access will locate this student ID in the data fi le, and the two entries with the same name will be visible (exercise fi gure 13.2.D). There are two possible reasons for two
EXERCISE 13.2 (continued)
EXERCISE FIGURE 13.2.B Additional Query Fields
Source: Authors’ example within Access software.
Source: Authors’ example within Access software.
EXERCISE FIGURE 13.2.C Query Results
Source: Authors’ example within Access software.
174 | IMPLEMENTING A NATIONAL ASSESSMENT OF EDUCATIONAL ACHIEVEMENT
10. Record the two changes in the README.DOCX (exercise fi gure 13.2.F).
11. Rerun the query to check that Jack Crokar’s error has been fi xed. It should return no entries. (Note: To rerun the query, double-click on the Find duplicates TBL_MATHS_3A_FINAL_NAMES query in the All Access Objects – Queries menu.)
students with the same name at the same school: either two students in the national assessment sample have the same name, or a data entry error has occurred and the student’s data have been entered twice.
The data operator must check the school records or the original test booklets. If two students are found to have the same name, each must be easily identifi able. You can distinguish between the two students by adding an initial corresponding to a student’s second name (such as JohnC for John Charles) or by adding a number to each fi rst name. The correction must be made in the table. It should not be made in the query.
9. In TBL_MATHS_3A_DATA_CLEANED, key in the number 1 after k in Jack for the fi rst record. Do the same with 2 to the second record (see exercise fi gure 13.2.E).
EXERCISE 13.2 (continued)
EXERCISE FIGURE 13.2.D Duplicate Names Observed
Source: Authors’ example within Access software.
EXERCISE FIGURE 13.2.F Duplicates in README.DOCX
Stud ID Variable Data value Repaired value
3870204 GivenName Jack Jack1
3870305 GivenName Jack Jack2
Source: Authors’ representation.
EXERCISE FIGURE 13.2.E Making Duplicate Names Unique
Source: Authors’ example within Access software.
DUPLICATE DATA | 175
booklets should be checked to see if, in fact, the school has two iden-tically named students. The need to perform such checks is the main reason test booklets should be carefully fi led after scoring for easy retrieval in the event of a query.
The process is similar to that described in the previous section. A query must be created that uses the variables for the student name and the school ID and that checks to identify any other student in the school with identical names. Access joins the variables to create a search variable to fi nd any match in the data. If, for example, one chooses GivenName John, FamilyName Smith, and SchoolID 1294, then the temporary search variable created within Access is 1294. Access does not attempt to fi nd all the students named John or all the students named Smith but limits its search to all the students in school 1294 who are named John Smith.
The reader can check his or her progress in exercises 13.1 and 13.2 against the database at …\NAEA DATA CLEANING\EXERCISE SOLUTIONS\MATHS_3A_DATA_ SOLUTION2.ACCDB.
To carry out analyses, the user will need access to a fi le that con-tains the test data results. In this case, a total score can be calculated for each student using SPSS, which can be exported into Access with the rest of the cleaned data as shown in exercise 12.1. Through the steps outlined in exercise 12.3, a query can be created from the im-ported table that isolates students’ item responses and total score data, along with the student background and school data.
Many of the actions taken here when merging two fi les are aimed at ensuring that the correct number of records was retained, that the records from one fi le were matched to the correct record on the sec-ond fi le, and that duplicates were identifi ed and removed if necessary. Those tasks were performed in part II of this volume when creating the sampling frames for the probability proportional to size sample of students. SPSS will routinely ask what to do with duplicates found during a fi le match. Please refer to those exercises and note how the match is set up and executed.


177
DATA
CLEANING AND
MANAGEMENT:
FOLDERS AND FILES
III.AANNEX
This annex describes the fi les to be used to per-form the exercises in part III. These fi les can be found on the CD that accompanies this manual. Annex table III.A.1 describes the contents of the Exercises folder. Annex fi gure III.A.2 shows the contents of the Exercise Solutions folder. The data cleaning and management fi le di-rectory structure is shown in annex fi gure III.A.1.
178 | IMPLEMENTING A NATIONAL ASSESSMENT OF EDUCATIONAL ACHIEVEMENT
TABLE III.A.1
Exercises
File Name Program Explanation
DATA VERIFICATION EXERCISE.XLSX
Excel 2007 Perform logical compari-sons to check whether the cells are identical.
DATA_SET_1.SAV SPSS Run frequency commands and correct fi le records with errors.
MATHS 3A CODEBOOK TEMPLATE.XLSX
Excel 2007 Add all the codebook values for the last 7 items.
SAMPLE TEST PAPER 3A.DOCX Word 2007 Use as a reference tool for codebook creation.
SCHOOLS.XLSX Excel 2007 Import school list into Access database.
STUDENTQUESTIONNAIRE.DOCX Word 2007 Use as an example of a student questionnaire for a national assessment.
Source: Authors’ compilation.
TABLE III.A.2
Exercise Solutions
File Name Program Explanation
DATA VERIFICATION EXERCISE_ SOLUTION.XLSX
Excel 2007 Solution to logical comparison check
DATA_SET_1_SOLUTION.SAV SPSS Solution to correction of data errors task
MATHS 3A CODEBOOK SOLUTION.XLSX
Excel 2007 Solution to codebook creation task
MATHS_3A_DATA_SOLUTION1.ACCDB
Access 2007 Solution to table and form creation task
MATHS_3A_DATA_SOLUTION2.ACCDB
Access 2007 Solution to data export and query creation tasks
README.DOCX Word 2007 Record of corrections made to data fi les
Source: Authors’ compilation.
DATA CLEANING AND MANAGEMENT FILES | 179
FIGURE III.A.1
Data Cleaning and Management File Directory Structure
Source: Authors’ representation.
NAEA DATA CLEANING
EXERCISE SOLUTIONSEXERCISES
DATA VERIFICATION EXERCISE.XLSX
DATA VERIFICATIONEXERCISE_SOLUTION.XLSX
DATA_SET_1_SOLUTION.SAV
MATHS_3A_CODEBOOKTEMPLATE.XLSX
MATHS_3A_CODEBOOKSOLUTION.XLSX
MATHS_3A_ DATA_SOLUTION1.ACCDB
MATHS_3A_DATA_SOLUTION2.ACCDB
DATA_SET_1.SAV
SAMPLE TEST PAPER 3A.DOCX
SCHOOLS.XLSX
STUDENTQUESTONNAIRE.DOCX README.DOCX
MY SOLUTIONS

WEIGHTING,
ESTIMATION, AND
SAMPLING ERROR
Jean Dumais and J. Heward Gough
IVPART
181
Part IV focuses on preparing data for analysis, which takes place after sampling, test administration, data entry, and cleaning. The exercises build on the earlier work that should have been carried out in part II on the Sentz data set. This part covers a series of important preanaly-sis steps, including computing and using survey weights and comput-ing estimates and their sampling errors. Finally, a range of special top-ics, including nonresponse and issues relating to oversize and undersize schools, is addressed.

COMPUTING
SURVEY
WEIGHTS
14CHAPTER
183
This chapter describes estimation weights, includ-ing how to compute them, how to adjust for nonresponses, and how to use auxiliary up-to-date information to adjust estimation weights to compute national totals.
DESIGN WEIGHTS
Estimation is a technique for producing information about a popula-tion of interest based on data gathered from a sample of that popula-tion. The fi rst step in estimation is to assign a weight to each sampled unit or to each of the responding sampled units. The design weight can be thought of as the average number of units in the survey population that each sampled unit represents and is determined by the sample design. The design weight, wd (where d stands for design), for a unit in the sample is the inverse of its inclusion probability π. It was noted earlier that in probability sampling, each unit has a known probabil-ity, π, of being sampled. If the inclusion probability is, for example, 1 in 50, then each selected unit represents, on average, 50 units of the survey population; hence, the design weight is wd = 50.
184 | IMPLEMENTING A NATIONAL ASSESSMENT OF EDUCATIONAL ACHIEVEMENT
Note that for a multistage design (which is frequently used in a national assessment of educational achievement), a unit’s probability of selection is the combined probability of selection at each stage.
Simple random samples and systematic random samples are equal probability designs because each unit has an equal chance of being included in the sample. Stated in statistical terms, in the case of sim-ple random sampling (SRS), the inclusion probability is π = n/N for each unit, and the design weight is wd = 1/π = N/n. In the case of sys-tematic random sampling, the inclusion probability, π = 1/k, where the integer k = [n/N], is the sampling step; thus, for each unit, the design weight is wd = 1/π = k.
Exercise 14.1 shows how to calculate the design weight for a sim-ple random sample (SRS).
When stratifi cation is a feature of the sample design, the strata are considered as distinct populations, each providing its own part of the full sample. Hence, the design weights are computed independently for each stratum according to the sampling design used in each stratum.
Suppose that a population of N = 1,000 schools is divided into two strata, urban and rural, on the survey frame. The urban stratum is com-posed of N1 = 400 schools and the rural one of N2 = 600 schools. Table 14.1 shows that the total sample of size n = 200, across both strata, was allocated equally to each stratum. The inclusion probability, or
Design Weight for a Simple Random Sample of 400 Students
Recall that the fi rst sample selected for Sentz assumed a perfect list frame of all 27,654 eligible students, from which a simple random sample of 400 students was drawn. Thus, the inclusion probability for each student is π = n/N = 400/27,654, and the design weight is wd = 1/π = 27,654/400 = 69.135. This weight was added to the sample fi le by SPSS (Statistical Package for the Social Sciences) as the sample was selected. You can see this by accessing the folder SRS400 and opening the fi le STUDENTSRSAMPLE using the following commands:
File – Open – Data – Look in
…\MYSAMPLSOL\STUDENTSRSAMPLE.SAV
Open
EXERCISE 14.1
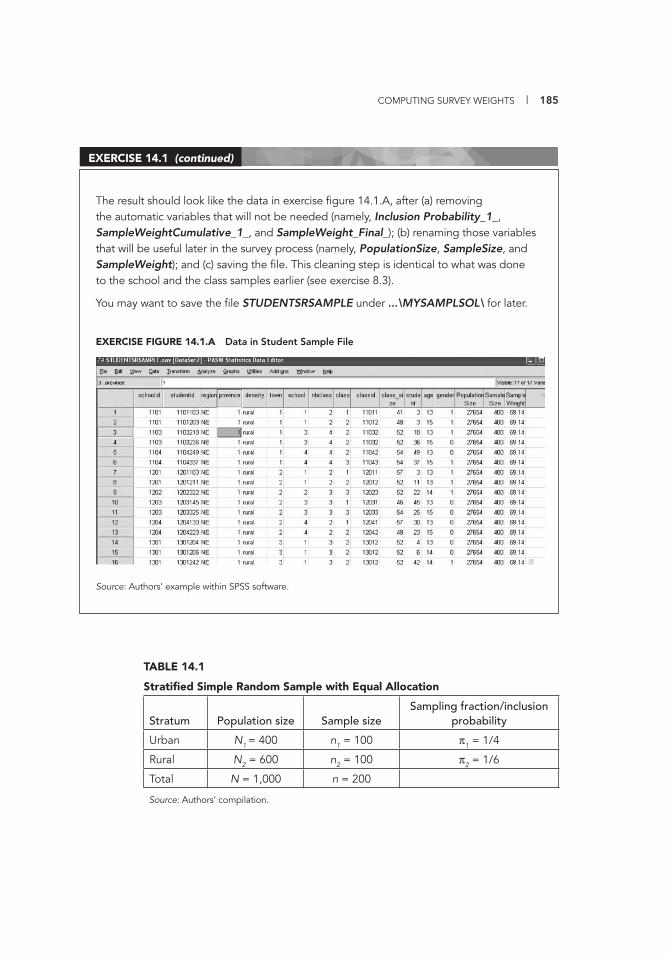
COMPUTING SURVEY WEIGHTS | 185
The result should look like the data in exercise fi gure 14.1.A, after (a) removing the automatic variables that will not be needed (namely, Inclusion Probability_1_, SampleWeightCumulative_1_, and SampleWeight_Final_); (b) renaming those variables that will be useful later in the survey process (namely, PopulationSize, SampleSize, and SampleWeight); and (c) saving the fi le. This cleaning step is identical to what was done to the school and the class samples earlier (see exercise 8.3).
You may want to save the fi le STUDENTSRSAMPLE under ...\MYSAMPLSOL\ for later.
EXERCISE 14.1 (continued)
TABLE 14.1
Stratifi ed Simple Random Sample with Equal Allocation
Stratum Population size Sample sizeSampling fraction/inclusion
probability
Urban N1 = 400 n1 = 100 π1 = 1/4
Rural N2 = 600 n2 = 100 π2 = 1/6
Total N = 1,000 n = 200
Source: Authors’ compilation.
Source: Authors’ example within SPSS software.
EXERCISE FIGURE 14.1.A Data in Student Sample File
186 | IMPLEMENTING A NATIONAL ASSESSMENT OF EDUCATIONAL ACHIEVEMENT
sampling fraction in this case, for the urban stratum is thus equal to n/N = 100/400 = 1/4 = 0.25. The sampling fraction for the rural stra-tum is equal to n/N = 100/600 = 1/6 = 0.167. On the sample fi le, each school in the urban stratum has a design weight of wd,1 = 4, and each school in the rural stratum has a design weight of wd,2 = 6.
For multistage sampling, the overall design weight is calculated by taking the inverse of the probability of selection at each stage or phase and then multiplying them. Suppose a two-stage cluster sample se-lects a simple random sample of n1 = 10 out of N1 = 100 schools at the fi rst stage and a simple random sample of n2 = 30 students within each school (cluster) at the second stage, where the number of units within each cluster is N2 = 60. The probability of selection at the fi rst stage is
10
1
100
101
11 ===
N
nπ ,
and the probability of selection at the second stage is
2
1
60
302
22 ===
N
nπ .
So the design weight for each selected student is
20.21011
=×=×= π2π1
wd
For the three-stage sampling design used in the Sentz case study (schools, classes, and eventually students by virtue of nonresponse), where the probability of selection for student i is πki at the kth stage, the design weight for that student is
.1weight_classweight_school
weight_studentweight_classweight_school
111
××=
××=
××=wdi π3iπ2iπ1i
Note that the sample, as initially designed for Sentz, selected all stu-dents in selected classes, so that student_weight = 1. Thus, the design
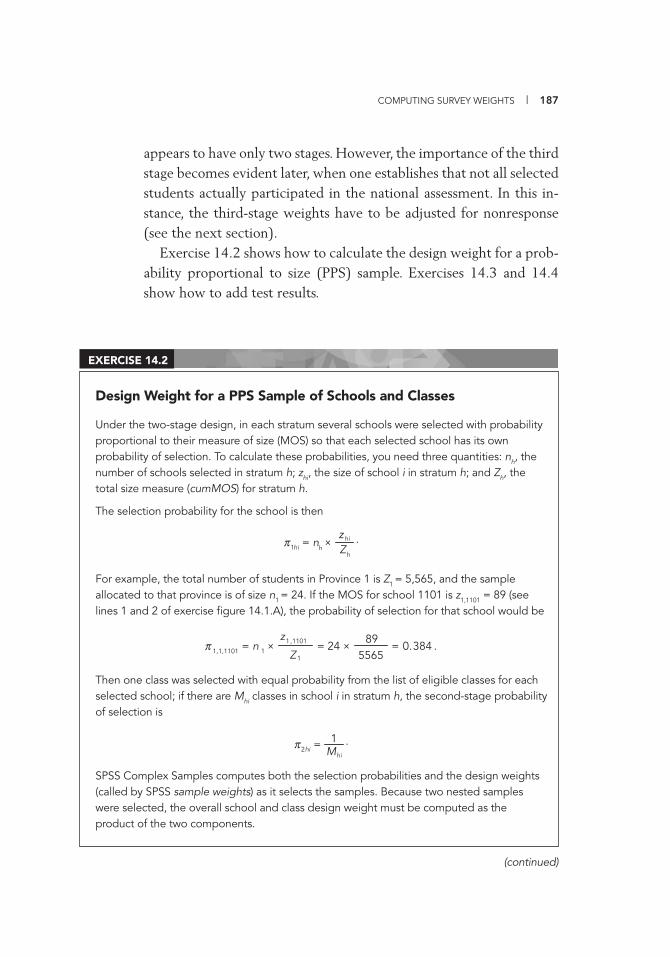
COMPUTING SURVEY WEIGHTS | 187
Design Weight for a PPS Sample of Schools and Classes
Under the two-stage design, in each stratum several schools were selected with probability proportional to their measure of size (MOS) so that each selected school has its own probability of selection. To calculate these probabilities, you need three quantities: nh, the number of schools selected in stratum h; zhi, the size of school i in stratum h; and Zh, the total size measure (cumMOS) for stratum h.
The selection probability for the school is then
.h
h Zz
n ×=1hihiπ
For example, the total number of students in Province 1 is Z1 = 5,565, and the sample allocated to that province is of size n1 = 24. If the MOS for school 1101 is z1,1101 = 89 (see lines 1 and 2 of exercise fi gure 14.1.A), the probability of selection for that school would be
.384.05565
8924
1
1101,1
11101,1,1 =×=×=Z
znπ
Then one class was selected with equal probability from the list of eligible classes for each selected school; if there are Mhi classes in school i in stratum h, the second-stage probability of selection is
.M1=2hi
hiπ
SPSS Complex Samples computes both the selection probabilities and the design weights (called by SPSS sample weights) as it selects the samples. Because two nested samples were selected, the overall school and class design weight must be computed as the product of the two components.
EXERCISE 14.2
(continued)
appears to have only two stages. However, the importance of the third stage becomes evident later, when one establishes that not all selected students actually participated in the national assessment. In this in-stance, the third-stage weights have to be adjusted for nonresponse (see the next section).
Exercise 14.2 shows how to calculate the design weight for a prob-ability proportional to size (PPS) sample. Exercises 14.3 and 14.4 show how to add test results.
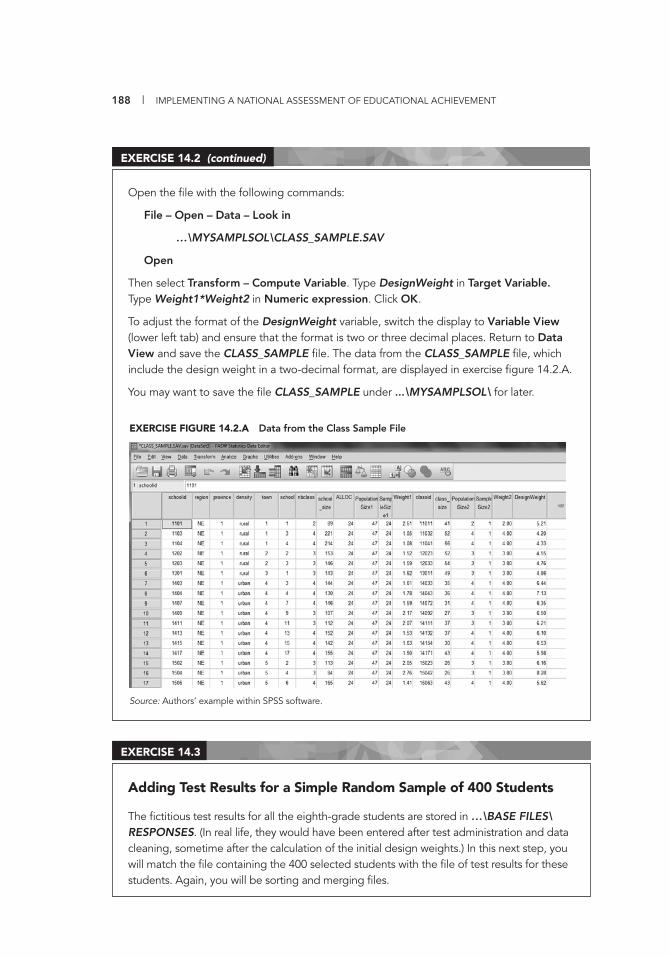
188 | IMPLEMENTING A NATIONAL ASSESSMENT OF EDUCATIONAL ACHIEVEMENT
Open the fi le with the following commands:
File – Open – Data – Look in
…\MYSAMPLSOL\CLASS_SAMPLE.SAV
Open
Then select Transform – Compute Variable. Type DesignWeight in Target Variable. Type Weight1*Weight2 in Numeric expression. Click OK.
To adjust the format of the DesignWeight variable, switch the display to Variable View (lower left tab) and ensure that the format is two or three decimal places. Return to Data View and save the CLASS_SAMPLE fi le. The data from the CLASS_SAMPLE fi le, which include the design weight in a two-decimal format, are displayed in exercise fi gure 14.2.A.
You may want to save the fi le CLASS_SAMPLE under ...\MYSAMPLSOL\ for later.
EXERCISE 14.2 (continued)
Adding Test Results for a Simple Random Sample of 400 Students
The fi ctitious test results for all the eighth-grade students are stored in …\BASE FILES\RESPONSES. (In real life, they would have been entered after test administration and data cleaning, sometime after the calculation of the initial design weights.) In this next step, you will match the fi le containing the 400 selected students with the fi le of test results for these students. Again, you will be sorting and merging fi les.
EXERCISE 14.3
EXERCISE FIGURE 14.2.A Data from the Class Sample File
Source: Authors’ example within SPSS software.
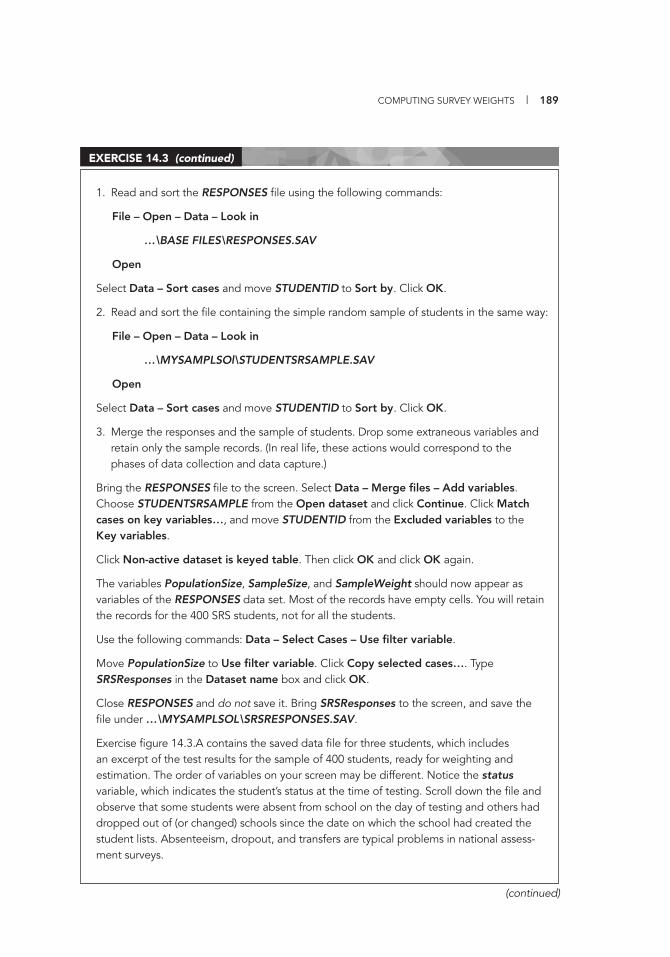
COMPUTING SURVEY WEIGHTS | 189
1. Read and sort the RESPONSES fi le using the following commands:
File – Open – Data – Look in
…\BASE FILES\RESPONSES.SAV
Open
Select Data – Sort cases and move STUDENTID to Sort by. Click OK.
2. R ead and sort the fi le containing the simple random sample of students in the same way:
File – Open – Data – Look in
…\MYSAMPLSOl\STUDENTSRSAMPLE.SAV
Open
Select Data – Sort cases and move STUDENTID to Sort by. Click OK.
3. Merge the responses and the sample of students. Drop some extraneous variables and retain only the sample records. (In real life, these actions would correspond to the phases of data collection and data capture.)
Bring the RESPONSES fi le to the screen. Select Data – Merge fi les – Add variables. Choose STUDENTSRSAMPLE from the Open dataset and click Continue. Click Match cases on key variables…, and move STUDENTID from the Excluded variables to the Key variables.
Click Non-active dataset is keyed table. Then click OK and click OK again.
The variables PopulationSize, SampleSize, and SampleWeight should now appear as variables of the RESPONSES data set. Most of the records have empty cells. You will retain the records for the 400 SRS students, not for all the students.
Use the following commands: Data – Select Cases – Use fi lter variable.
Move PopulationSize to Use fi lter variable. Click Copy selected cases…. Type SRSResponses in the Dataset name box and click OK.
Close RESPONSES and do not save it. Bring SRSResponses to the screen, and save the fi le under …\MYSAMPLSOL\SRSRESPONSES.SAV.
Exercise fi gure 14.3.A contains the saved data fi le for three students, which includes an excerpt of the test results for the sample of 400 students, ready for weighting and estimation. The order of variables on your screen may be different. Notice the status variable, which indicates the student’s status at the time of testing. Scroll down the fi le and observe that some students were absent from school on the day of testing and others had dropped out of (or changed) schools since the date on which the school had created the student lists. Absenteeism, dropout, and transfers are typical problems in national assess-ment surveys.
EXERCISE 14.3 (continued)
(continued)
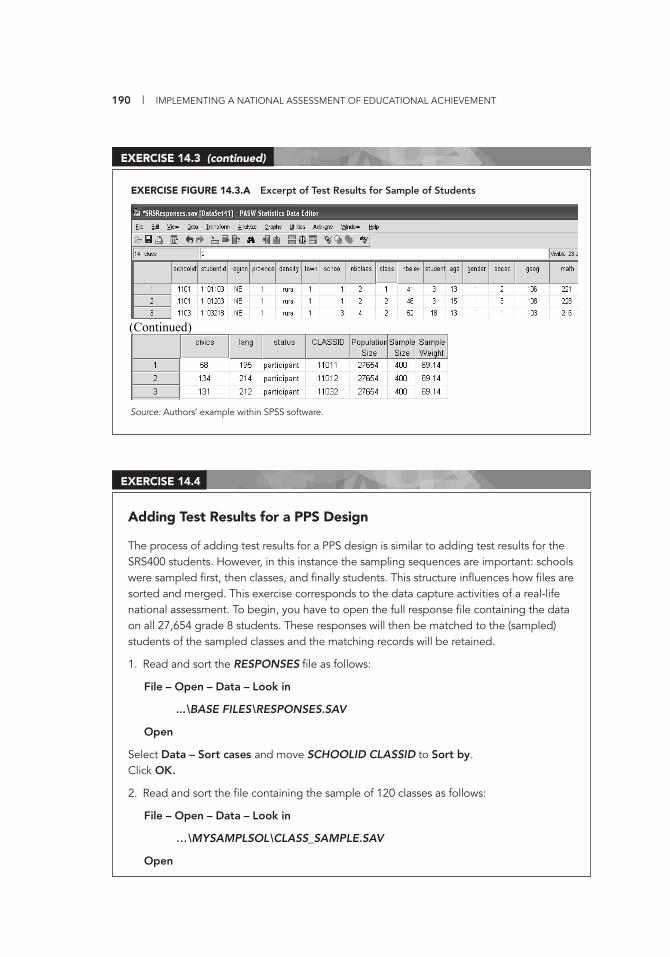
190 | IMPLEMENTING A NATIONAL ASSESSMENT OF EDUCATIONAL ACHIEVEMENT
EXERCISE 14.3 (continued)
Adding Test Results for a PPS Design
The process of adding test results for a PPS design is similar to adding test results for the SRS400 students. However, in this instance the sampling sequences are important: schools were sampled fi rst, then classes, and fi nally students. This structure infl uences how fi les are sorted and merged. This exercise corresponds to the data capture activities of a real-life national assessment. To begin, you have to open the full response fi le containing the data on all 27,654 grade 8 students. These responses will then be matched to the (sampled) students of the sampled classes and the matching records will be retained.
1. Read and sort the RESPONSES fi le as follows:
File – Open – Data – Look in
...\BASE FILES\RESPONSES.SAV
Open
Select Data – Sort cases and move SCHOOLID CLASSID to Sort by. Click OK.
2. Read and sort the fi le containing the sample of 120 classes as follows:
File – Open – Data – Look in
…\MYSAMPLSOL\CLASS_SAMPLE.SAV
Open
EXERCISE 14.4
EXERCISE FIGURE 14.3.A Excerpt of Test Results for Sample of Students
Source: Authors’ example within SPSS software.
(Continued)
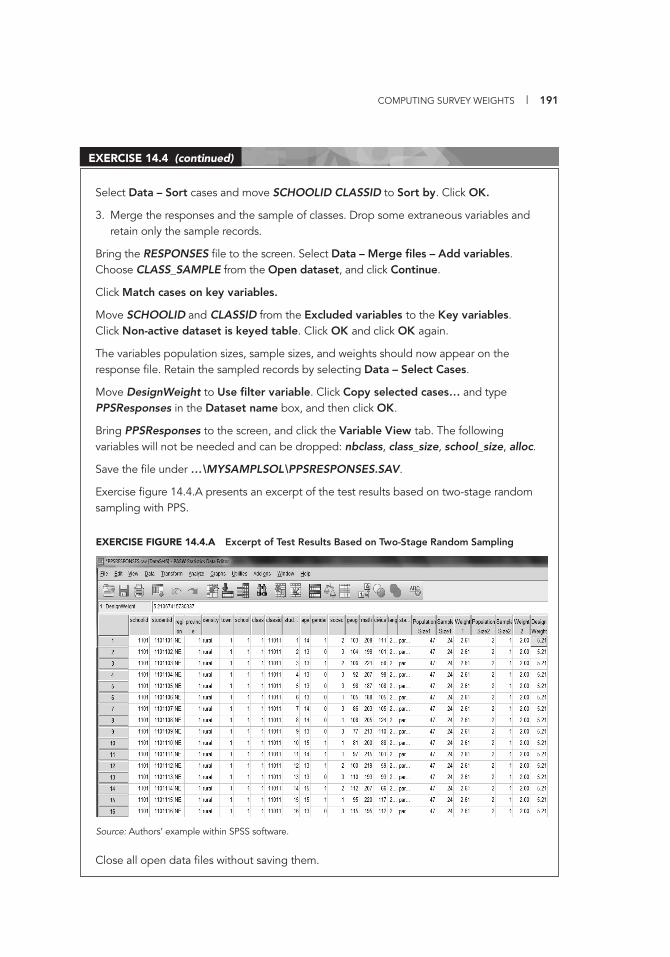
COMPUTING SURVEY WEIGHTS | 191
Select Data – Sort cases and move SCHOOLID CLASSID to Sort by. Click OK.
3. Merge the responses and the sample of classes. Drop some extraneous variables and retain only the sample records.
Bring the RESPONSES fi le to the screen. Select Data – Merge fi les – Add variables. Choose CLASS_SAMPLE from the Open dataset, and click Continue.
Click Match cases on key variables.
Move SCHOOLID and CLASSID from the Excluded variables to the Key variables. Click Non-active dataset is keyed table. Click OK and click OK again.
The variables population sizes, sample sizes, and weights should now appear on the response fi le. Retain the sampled records by selecting Data – Select Cases.
Move DesignWeight to Use fi lter variable. Click Copy selected cases… and type PPSResponses in the Dataset name box, and then click OK.
Bring PPSResponses to the screen, and click the Variable View tab. The following variables will not be needed and can be dropped: nbclass, class_size, school_size, alloc.
Save the fi le under …\MYSAMPLSOL\PPSRESPONSES.SAV.
Exercise fi gure 14.4.A presents an excerpt of the test results based on two-stage random sampling with PPS.
Close all open data fi les without saving them.
EXERCISE 14.4 (continued)
Source: Authors’ example within SPSS software.
EXERCISE FIGURE 14.4.A Excerpt of Test Results Based on Two-Stage Random Sampling
192 | IMPLEMENTING A NATIONAL ASSESSMENT OF EDUCATIONAL ACHIEVEMENT
WEIGHT ADJUSTMENT FOR NONRESPONSE
All surveys suffer from nonresponse, which occurs when all or some of the information requested from sampled units is unavailable for some reason. Nonresponse can occur when the school or student re-fuses to participate, when the school cannot be located, when stu-dents are absent, or when the information obtained is unusable. The easiest way to deal with such nonresponse is to ignore it. However, not compensating for the nonresponding units leads to bias. It could, for example, result in underestimating or overestimating the mean achievement levels of students, the size of the national enrollment, or the size of the teaching workforce.
The most common way of dealing with total nonresponse is to adjust the design weights on the assumption that the responding units represent both responding and nonresponding units. This adjustment is reasonable under the assumption that, for the characteristics mea-sured in the survey, the nonrespondents are like the respondents. The design weights of the nonrespondents are then redistributed among the respondents. This step is often done using a nonresponse adjust-ment; the factor is multiplied by the design weight to produce a non-response-adjusted weight, as illustrated in the following example.
The nonresponse adjustment factor is usually defi ned as the ratio of the sum of the weights in the original sample to the sum of the weights of the responding units.
The sampling team should consult with those responsible for test administration and establish the number of nonrespondents in each school. Data on nonrespondents should be available in a record such as a student tracking form (see box 4.1). The sampling team can use this information to compute the appropriate adjustment factors.
Suppose a simple random sample of n = 20 students was selected from a class of N = 40 students. The number of respondent units is denoted by nr. Of the original target sample of 20 students, only nr = 16 students completed the assessment. To determine the design weight and the weight adjusted for nonresponse for the responding units, one must take the following steps:
• First, calculate the inclusion probabilities for a simple random sample:
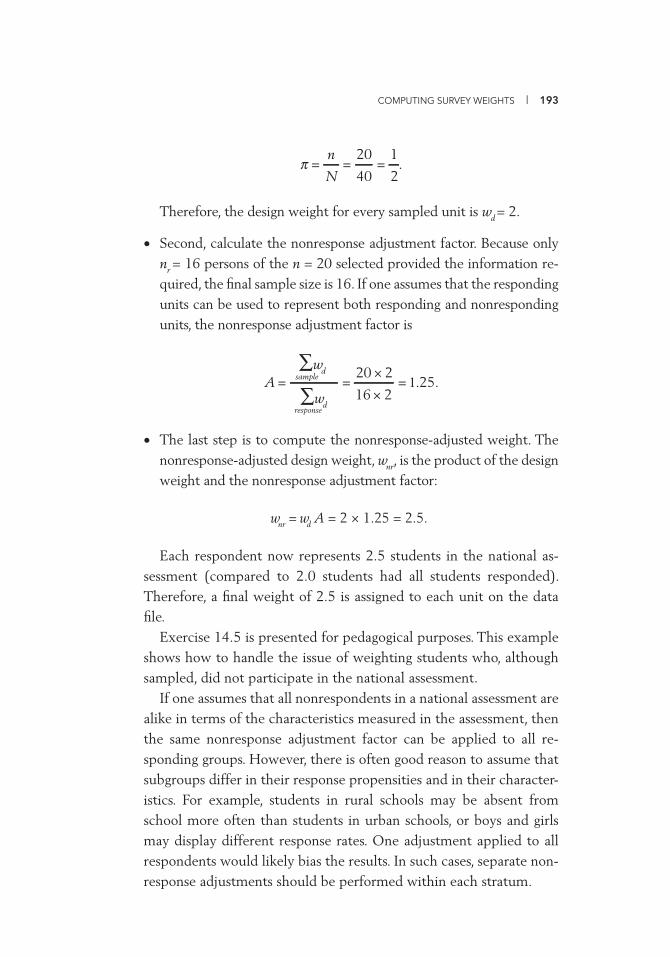
COMPUTING SURVEY WEIGHTS | 193
.2
1
40
20===
N
nπ
Therefore, the design weight for every sampled unit is wd = 2.
• Second, calculate the nonresponse adjustment factor. Because only nr = 16 persons of the n = 20 selected provided the information re-quired, the fi nal sample size is 16. If one assumes that the responding units can be used to represent both responding and nonresponding units, the nonresponse adjustment factor is
1.25.216
220=
×
×==
∑wd
∑wd
response
sampleA
• The last step is to compute the nonresponse-adjusted weight. The nonresponse-adjusted design weight, wnr, is the product of the design weight and the nonresponse adjustment factor:
w = w A = 2 × 1.25 = 2.5.nr d
Each respondent now represents 2.5 students in the national as-sessment (compared to 2.0 students had all students responded). Therefore, a fi nal weight of 2.5 is assigned to each unit on the data fi le.
Exercise 14.5 is presented for pedagogical purposes. This example shows how to handle the issue of weighting students who, although sampled, did not participate in the national assessment.
If one assumes that all nonrespondents in a national assessment are alike in terms of the characteristics measured in the assessment, then the same nonresponse adjustment factor can be applied to all re-sponding groups. However, there is often good reason to assume that subgroups differ in their response propensities and in their character-istics. For example, students in rural schools may be absent from school more often than students in urban schools, or boys and girls may display different response rates. One adjustment applied to all respondents would likely bias the results. In such cases, separate non-response adjustments should be performed within each stratum.
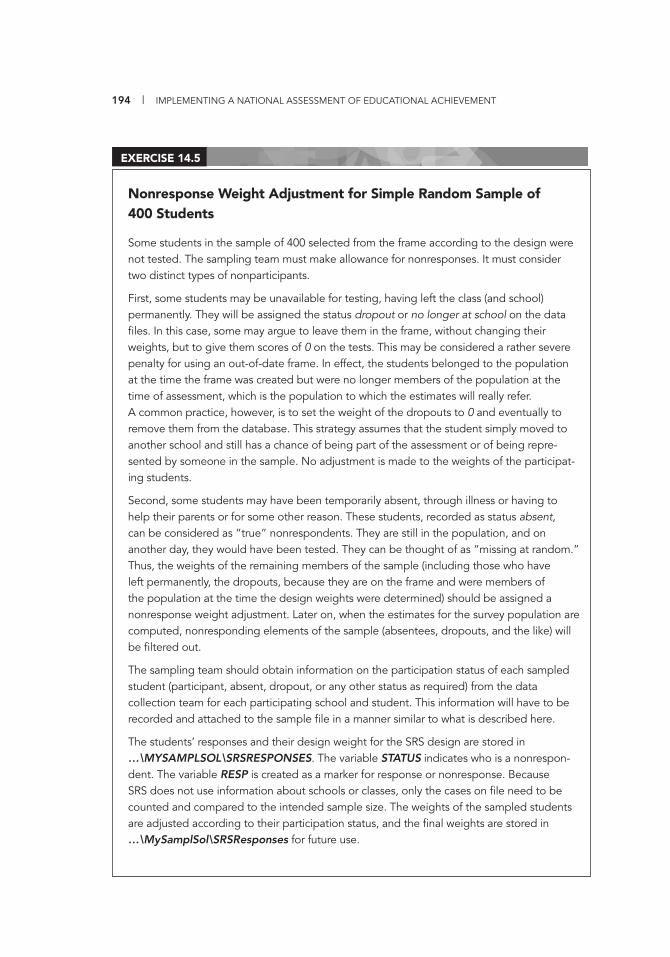
194 | IMPLEMENTING A NATIONAL ASSESSMENT OF EDUCATIONAL ACHIEVEMENT
Nonresponse Weight Adjustment for Simple Random Sample of 400 Students
Some students in the sample of 400 selected from the frame according to the design were not tested. The sampling team must make allowance for nonresponses. It must consider two distinct types of nonparticipants.
First, some students may be unavailable for testing, having left the class (and school) permanently. They will be assigned the status dropout or no longer at school on the data fi les. In this case, some may argue to leave them in the frame, without changing their weights, but to give them scores of 0 on the tests. This may be considered a rather severe penalty for using an out-of-date frame. In effect, the students belonged to the population at the time the frame was created but were no longer members of the population at the time of assessment, which is the population to which the estimates will really refer. A common practice, however, is to set the weight of the dropouts to 0 and eventually to remove them from the database. This strategy assumes that the student simply moved to another school and still has a chance of being part of the assessment or of being repre-sented by someone in the sample. No adjustment is made to the weights of the participat-ing students.
Second, some students may have been temporarily absent, through illness or having to help their parents or for some other reason. These students, recorded as status absent, can be considered as “true” nonrespondents. They are still in the population, and on another day, they would have been tested. They can be thought of as “missing at random.” Thus, the weights of the remaining members of the sample (including those who have left permanently, the dropouts, because they are on the frame and were members of the population at the time the design weights were determined) should be assigned a nonresponse weight adjustment. Later on, when the estimates for the survey population are computed, nonresponding elements of the sample (absentees, dropouts, and the like) will be fi ltered out.
The sampling team should obtain information on the participation status of each sampled student (participant, absent, dropout, or any other status as required) from the data collection team for each participating school and student. This information will have to be recorded and attached to the sample fi le in a manner similar to what is described here.
The students’ responses and their design weight for the SRS design are stored in …\MYSAMPLSOL\SRSRESPONSES. The variable STATUS indicates who is a nonrespon-dent. The variable RESP is created as a marker for response or nonresponse. Because SRS does not use information about schools or classes, only the cases on fi le need to be counted and compared to the intended sample size. The weights of the sampled students are adjusted according to their participation status, and the fi nal weights are stored in …\MySamplSol\SRSResponses for future use.
EXERCISE 14.5
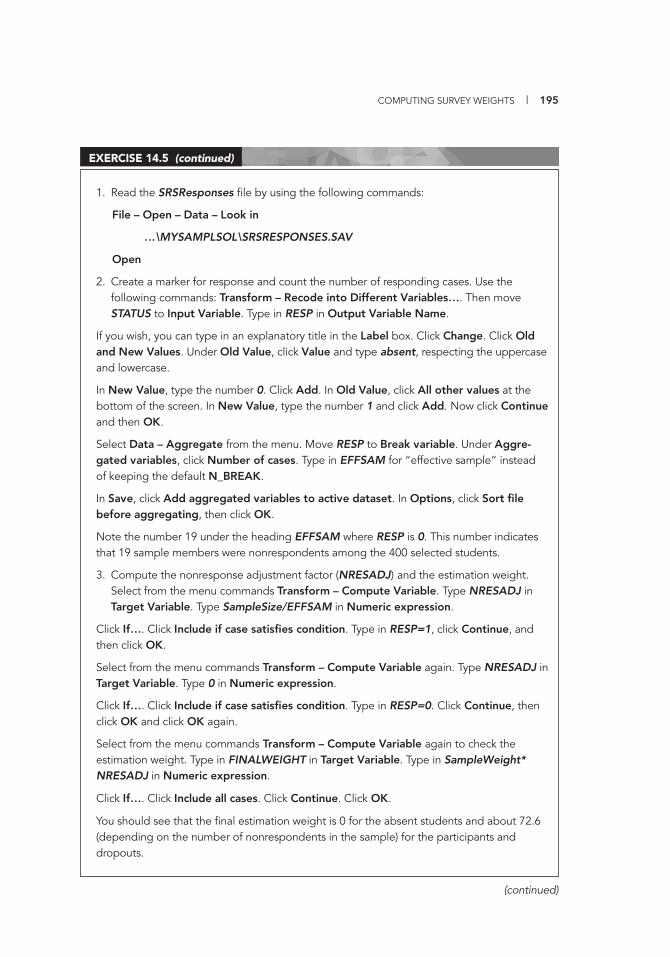
COMPUTING SURVEY WEIGHTS | 195
1. Read the SRSResponses fi le by using the following commands:
File – Open – Data – Look in
…\MYSAMPLSOL\SRSRESPONSES.SAV
Open
2. Create a marker for response and count the number of responding cases. Use the following commands: Transform – Recode into Different Variables…. Then move STATUS to Input Variable. Type in RESP in Output Variable Name.
If you wish, you can type in an explanatory title in the Label box. Click Change. Click Old and New Values. Under Old Value, click Value and type absent, respecting the uppercase and lowercase.
In New Value, type the number 0. Click Add. In Old Value, click All other values at the bottom of the screen. In New Value, type the number 1 and click Add. Now click Continue and then OK.
Select Data – Aggregate from the menu. Move RESP to Break variable. Under Aggre-gated variables, click Number of cases. Type in EFFSAM for “effective sample” instead of keeping the default N_BREAK.
In Save, click Add aggregated variables to active dataset. In Options, click Sort fi le before aggregating, then click OK.
Note the number 19 under the heading EFFSAM where RESP is 0. This number indicates that 19 sample members were nonrespondents among the 400 selected students.
3. Compute the nonresponse adjustment factor (NRESADJ) and the estimation weight. Select from the menu commands Transform – Compute Variable. Type NRESADJ in Target Variable. Type SampleSize/EFFSAM in Numeric expression.
Click If…. Click Include if case satisfi es condition. Type in RESP=1, click Continue, and then click OK.
Select from the menu commands Transform – Compute Variable again. Type NRESADJ in Target Variable. Type 0 in Numeric expression.
Click If…. Click Include if case satisfi es condition. Type in RESP=0. Click Continue, then click OK and click OK again.
Select from the menu commands Transform – Compute Variable again to check the estimation weight. Type in FINALWEIGHT in Target Variable. Type in SampleWeight* NRESADJ in Numeric expression.
Click If…. Click Include all cases. Click Continue. Click OK.
You should see that the fi nal estimation weight is 0 for the absent students and about 72.6 (depending on the number of nonrespondents in the sample) for the participants and dropouts.
EXERCISE 14.5 (continued)
(continued)
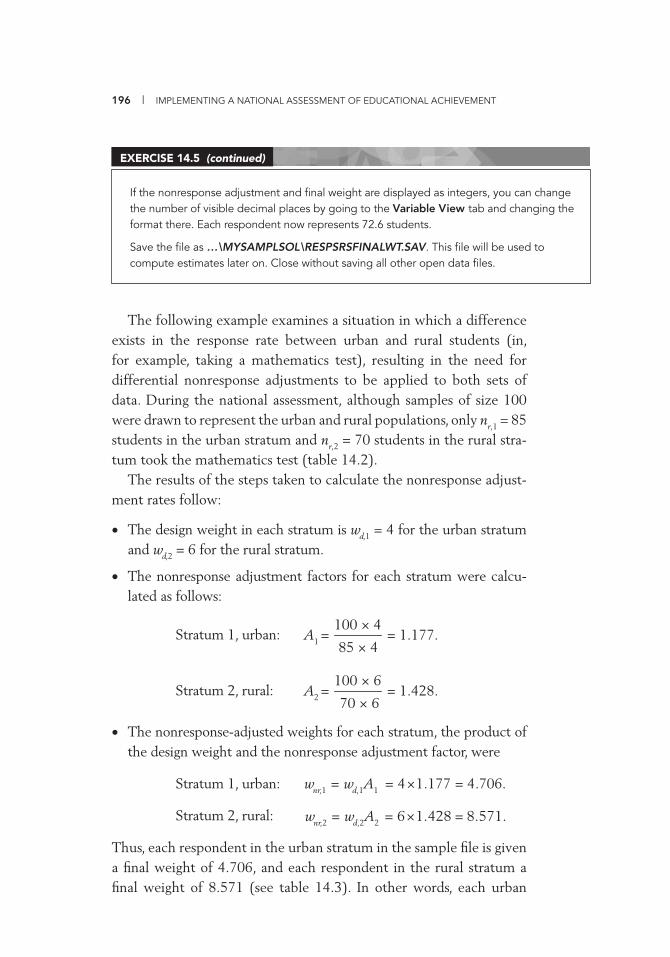
196 | IMPLEMENTING A NATIONAL ASSESSMENT OF EDUCATIONAL ACHIEVEMENT
The following example examines a situation in which a difference exists in the response rate between urban and rural students (in, for example, taking a mathematics test), resulting in the need for differential nonresponse adjustments to be applied to both sets of data. During the national assessment, although samples of size 100 were drawn to represent the urban and rural populations, only nr,1 = 85 students in the urban stratum and nr,2 = 70 students in the rural stra-tum took the mathematics test (table 14.2).
The results of the steps taken to calculate the nonresponse adjust-ment rates follow:
• The design weight in each stratum is wd,1 = 4 for the urban stratum and wd,2 = 6 for the rural stratum.
• The nonresponse adjustment factors for each stratum were calcu-lated as follows:
Stratum 1, urban: = 1.177.85 × 4
100 × 4A1 =
Stratum 2, rural: = 1.428.70 × 6
100 × 6 A2 =
• The nonresponse-adjusted weights for each stratum, the product of the design weight and the nonresponse adjustment factor, were
Stratum 1, urban: 706..4177.14 =×== wd,1A1wnr,1
Stratum 2, rural: 571..8428.16 =×== wd,2A2wnr,2
Thus, each respondent in the urban stratum in the sample fi le is given a fi nal weight of 4.706, and each respondent in the rural stratum a fi nal weight of 8.571 (see table 14.3). In other words, each urban
If the nonresponse adjustment and fi nal weight are displayed as integers, you can change the number of visible decimal places by going to the Variable View tab and changing the format there. Each respondent now represents 72.6 students.
Save the fi le as …\MYSAMPLSOL\RESPSRSFINALWT.SAV. This fi le will be used to compute estimates later on. Close without saving all other open data fi les.
EXERCISE 14.5 (continued)
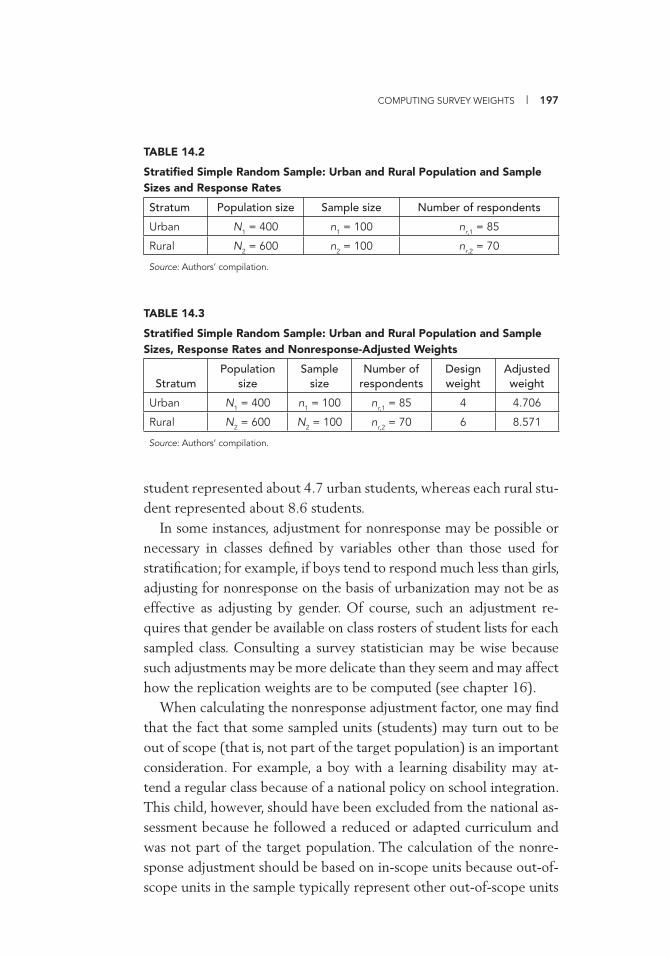
COMPUTING SURVEY WEIGHTS | 197
TABLE 14.2
Stratifi ed Simple Random Sample: Urban and Rural Population and Sample Sizes and Response Rates
Stratum Population size Sample size Number of respondents
Urban N1 = 400 n1 = 100 nr,1 = 85
Rural N2 = 600 n2 = 100 nr,2 = 70
Source: Authors’ compilation.
TABLE 14.3
Stratifi ed Simple Random Sample: Urban and Rural Population and Sample Sizes, Response Rates and Nonresponse-Adjusted Weights
StratumPopulation
sizeSample
sizeNumber of
respondentsDesign weight
Adjusted weight
Urban N1 = 400 n1 = 100 nr,1 = 85 4 4.706
Rural N2 = 600 N2 = 100 nr,2 = 70 6 8.571
Source: Authors’ compilation.
student represented about 4.7 urban students, whereas each rural stu-dent represented about 8.6 students.
In some instances, adjustment for nonresponse may be possible or necessary in classes defi ned by variables other than those used for stratifi cation; for example, if boys tend to respond much less than girls, adjusting for nonresponse on the basis of urbanization may not be as effective as adjusting by gender. Of course, such an adjustment re-quires that gender be available on class rosters of student lists for each sampled class. Consulting a survey statistician may be wise because such adjustments may be more delicate than they seem and may affect how the replication weights are to be computed (see chapter 16).
When calculating the nonresponse adjustment factor, one may fi nd that the fact that some sampled units (students) may turn out to be out of scope (that is, not part of the target population) is an important consideration. For example, a boy with a learning disability may at-tend a regular class because of a national policy on school integration. This child, however, should have been excluded from the national as-sessment because he followed a reduced or adapted curriculum and was not part of the target population. The calculation of the nonre-sponse adjustment should be based on in-scope units because out-of-scope units in the sample typically represent other out-of-scope units

198 | IMPLEMENTING A NATIONAL ASSESSMENT OF EDUCATIONAL ACHIEVEMENT
in the frame. The preceding example assumes that all nonrespondents are in scope.
Nonresponse adjustment should be performed separately for groups of similar respondents, where each group of respondents rep-resents the nonrespondents in that group. The sampling team might be advised to consult with a sampling specialist to help identify the response groups most appropriate for a specifi c assessment.
Exercise 14.6 shows how to calculate weight adjustment for a PPS sample.
Nonresponse Weight Adjustment for a PPS Sample
In calculating the weights for the Sentz national assessment under the two-stage PPS design, assume that all selected schools and classes responded. In practice, this will likely not be the case, and additional weight adjustments will be required so that the participat-ing schools account for the nonresponding schools in the sample.
As in the case of the SRS example, allowance must be made for nonresponse within selected classes. Again, you must distinguish between the dropouts, who remain on the fi le with test scores of 0, and the temporary absentees, who are treated as nonrespondents.
The weights of the remaining members of the class must be adjusted in standard fashion. The adjustment is calculated in the same way as for the SRS case, except that classes must be considered in the computations.
1. Determine the most appropriate response groups for the adjustment. If, for example, test scores or response rates are expected to differ substantially for boys and girls, or for urban and rural areas, these categories might be considered in making the nonre-sponse adjustments. In the present case, a quick examination of the results did not suggest that these factors were particularly important. As a result, adjustments for nonresponse will be made within each class. If, for instance, a class originally had 42 students, of whom 1 left school and 3 were temporarily absent, the original weights are now multiplied by 42/(42 − 3) = 42/39 = 1.0769; the student who left school would keep the original weight, accounting for other students who had left the school.
The fi le …\MYSAMPLSOL\PPSRESPONSES.SAV contains the responses and design weights for the two-stage sample of students. The process for computing the nonresponse adjustment factors is identical to that used earlier for the simple random sample. Re-sponses have to be counted by class and school, so the instructions will convey the hierarchy of the sample. In the absence of any information indicating that nonresponse is completely uniform throughout the population, it may be advisable to make the adjust-ments at the local rather than the global level.
EXERCISE 14.6
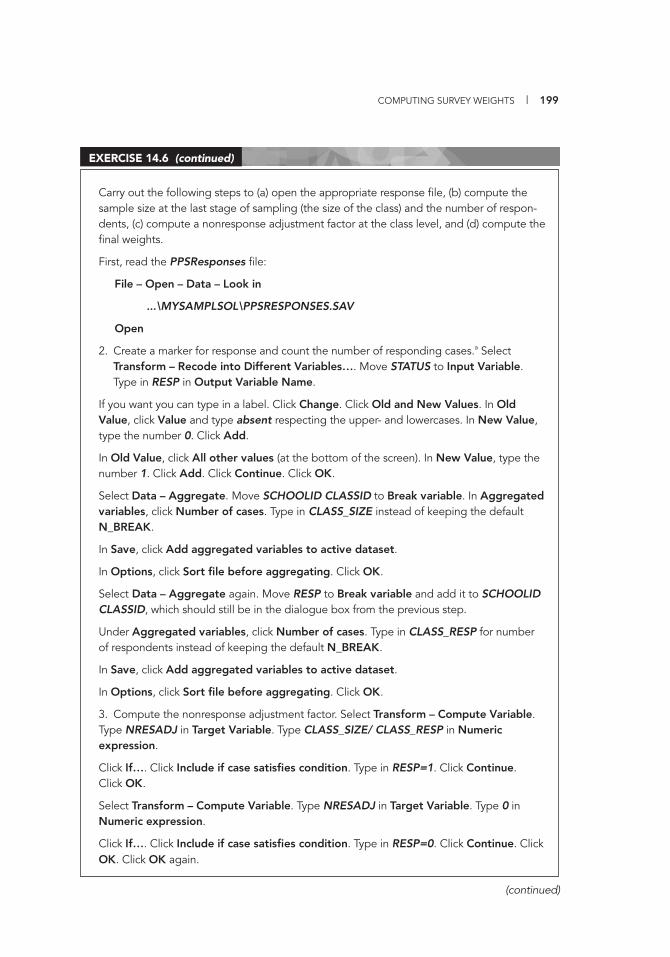
COMPUTING SURVEY WEIGHTS | 199
Carry out the following steps to (a) open the appropriate response fi le, (b) compute the sample size at the last stage of sampling (the size of the class) and the number of respon-dents, (c) compute a nonresponse adjustment factor at the class level, and (d) compute the fi nal weights.
First, read the PPSResponses fi le:
File – Open – Data – Look in
...\MYSAMPLSOL\PPSRESPONSES.SAV
Open
2. Create a marker for response and count the number of responding cases.a Select Transform – Recode into Different Variables…. Move STATUS to Input Variable. Type in RESP in Output Variable Name.
If you want you can type in a label. Click Change. Click Old and New Values. In Old Value, click Value and type absent respecting the upper- and lowercases. In New Value, type the number 0. Click Add.
In Old Value, click All other values (at the bottom of the screen). In New Value, type the number 1. Click Add. Click Continue. Click OK.
Select Data – Aggregate. Move SCHOOLID CLASSID to Break variable. In Aggregated variables, click Number of cases. Type in CLASS_SIZE instead of keeping the default N_BREAK.
In Save, click Add aggregated variables to active dataset.
In Options, click Sort fi le before aggregating. Click OK.
Select Data – Aggregate again. Move RESP to Break variable and add it to SCHOOLID CLASSID, which should still be in the dialogue box from the previous step.
Under Aggregated variables, click Number of cases. Type in CLASS_RESP for number of respondents instead of keeping the default N_BREAK.
In Save, click Add aggregated variables to active dataset.
In Options, click Sort fi le before aggregating. Click OK.
3. Compute the nonresponse adjustment factor. Select Transform – Compute Variable. Type NRESADJ in Target Variable. Type CLASS_SIZE/ CLASS_RESP in Numeric expression.
Click If…. Click Include if case satisfi es condition. Type in RESP=1. Click Continue. Click OK.
Select Transform – Compute Variable. Type NRESADJ in Target Variable. Type 0 in Numeric expression.
Click If…. Click Include if case satisfi es condition. Type in RESP=0. Click Continue. Click OK. Click OK again.
EXERCISE 14.6 (continued)
(continued)
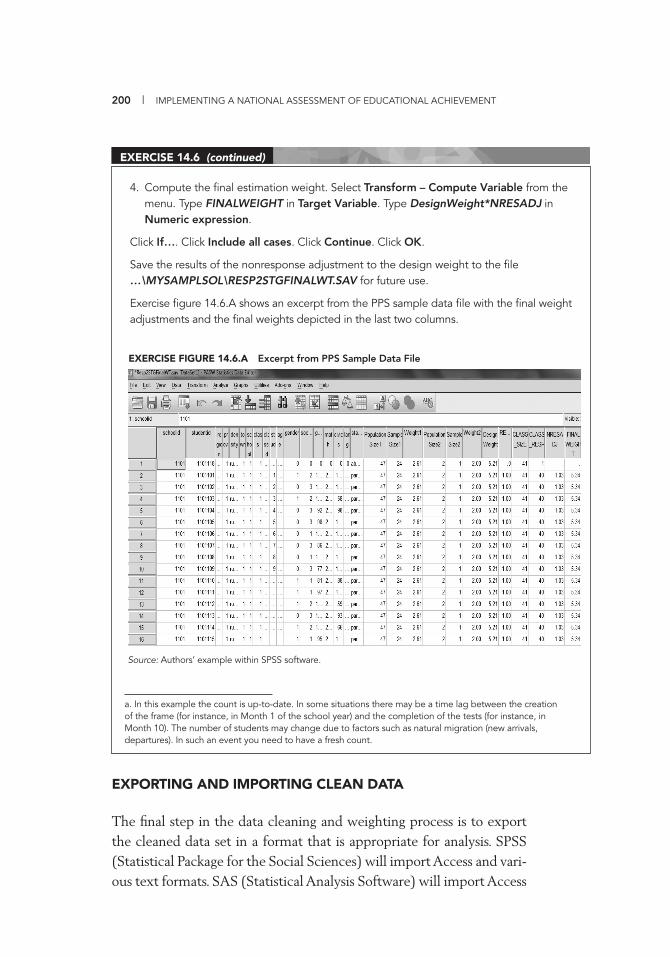
200 | IMPLEMENTING A NATIONAL ASSESSMENT OF EDUCATIONAL ACHIEVEMENT
EXPORTING AND IMPORTING CLEAN DATA
The fi nal step in the data cleaning and weighting process is to export the cleaned data set in a format that is appropriate for analysis. SPSS (Statistical Package for the Social Sciences) will import Access and vari-ous text formats. SAS (Statistical Analysis Software) will import Access
4. Compute the fi nal estimation weight. Select Transform – Compute Variable from the menu. Type FINALWEIGHT in Target Variable. Type DesignWeight*NRESADJ in Numeric expression.
Click If…. Click Include all cases. Click Continue. Click OK.
Save the results of the nonresponse adjustment to the design weight to the fi le …\MYSAMPLSOL\RESP2STGFINALWT.SAV for future use.
Exercise fi gure 14.6.A shows an excerpt from the PPS sample data fi le with the fi nal weight adjustments and the fi nal weights depicted in the last two columns.
EXERCISE 14.6 (continued)
EXERCISE FIGURE 14.6.A Excerpt from PPS Sample Data File
Source: Authors’ example within SPSS software.
a. In this example the count is up-to-date. In some situations there may be a time lag between the creation of the frame (for instance, in Month 1 of the school year) and the completion of the tests (for instance, in Month 10). The number of students may change due to factors such as natural migration (new arrivals, departures). In such an event you need to have a fresh count.
COMPUTING SURVEY WEIGHTS | 201
and SPSS formats as well as many other text formats. WesVar readily accepts fi les from Access, EpiData, Epi Info, SAS, SPSS, and Stata.
POSTSTRATIFICATION: USING AUXILIARY INFORMATION TO IMPROVE ESTIMATES BY ADJUSTING ESTIMATION WEIGHTS
The design weight multiplied by the nonresponse adjustment factor can be used to produce fi nal weights and survey estimates of the de-sired characteristics. However, sometimes information about the sur-vey population is available from other sources (for example, from the latest enrollment statistics). This information can also be incorporated in the weighting process.
Two main reasons exist for using auxiliary data at estimation. First, having the survey estimates match known population totals is often important. For example, having the estimated numbers of male and female students match the offi cial numbers of boys and girls enrolled in school may be desirable.
Second, poststratifi cation can improve the precision of the esti-mates. Recall that an estimator with small sampling variance—a mea-sure of sampling error—is said to be precise. At the design stage, however, auxiliary information must be available for all units on the frame. At estimation, auxiliary data can be used to improve the preci-sion of estimates as long as the values of the auxiliary variables are collected for the surveyed units, and population totals or estimates are available for these auxiliary variables from another reliable source.
Auxiliary information may also be used to further correct for dif-ferent nonresponse rates in subgroups of the population. It may also help adjust for coverage inadequacies that result in the survey popu-lation differing from the target population.
Successful use of auxiliary data at the estimation stage has three basic requirements:
• The auxiliary data must be well correlated with the survey variables.• The external sources of information concerning the population must
be accurate.• The auxiliary information must be collected for all responding sam-
ple units if only population totals are known.
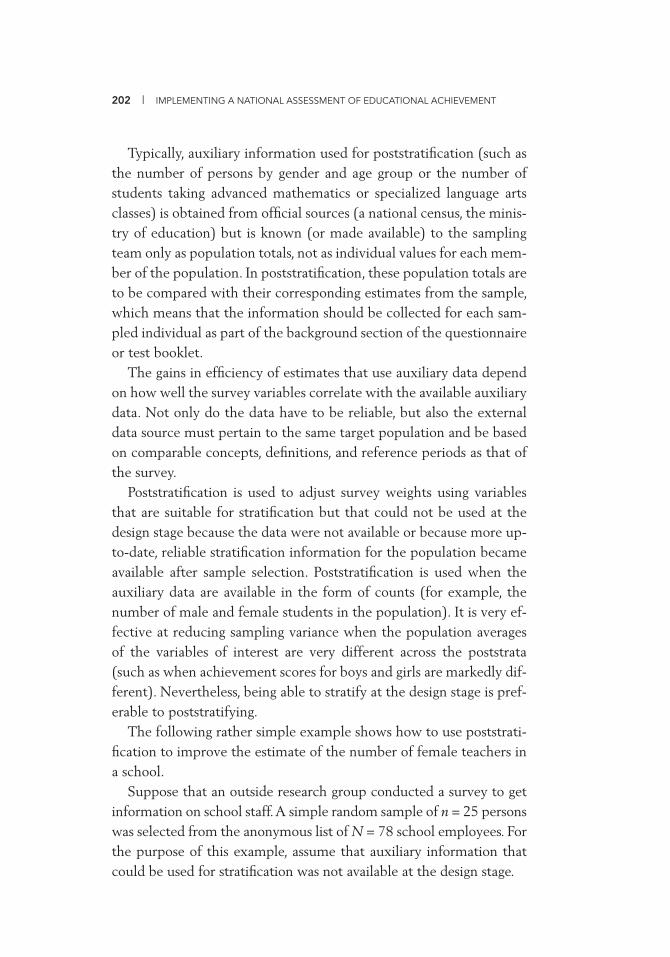
202 | IMPLEMENTING A NATIONAL ASSESSMENT OF EDUCATIONAL ACHIEVEMENT
Typically, auxiliary information used for poststratifi cation (such as the number of persons by gender and age group or the number of students taking advanced mathematics or specialized language arts classes) is obtained from offi cial sources (a national census, the minis-try of education) but is known (or made available) to the sampling team only as population totals, not as individual values for each mem-ber of the population. In poststratifi cation, these population totals are to be compared with their corresponding estimates from the sample, which means that the information should be collected for each sam-pled individual as part of the background section of the questionnaire or test booklet.
The gains in effi ciency of estimates that use auxiliary data depend on how well the survey variables correlate with the available auxiliary data. Not only do the data have to be reliable, but also the external data source must pertain to the same target population and be based on comparable concepts, defi nitions, and reference periods as that of the survey.
Poststratifi cation is used to adjust survey weights using variables that are suitable for stratifi cation but that could not be used at the design stage because the data were not available or because more up-to-date, reliable stratifi cation information for the population became available after sample selection. Poststratifi cation is used when the auxiliary data are available in the form of counts (for example, the number of male and female students in the population). It is very ef-fective at reducing sampling variance when the population averages of the variables of interest are very different across the poststrata (such as when achievement scores for boys and girls are markedly dif-ferent). Nevertheless, being able to stratify at the design stage is pref-erable to poststratifying.
The following rather simple example shows how to use poststrati-fi cation to improve the estimate of the number of female teachers in a school.
Suppose that an outside research group conducted a survey to get information on school staff. A simple random sample of n = 25 persons was selected from the anonymous list of N = 78 school employees. For the purpose of this example, assume that auxiliary information that could be used for stratifi cation was not available at the design stage.
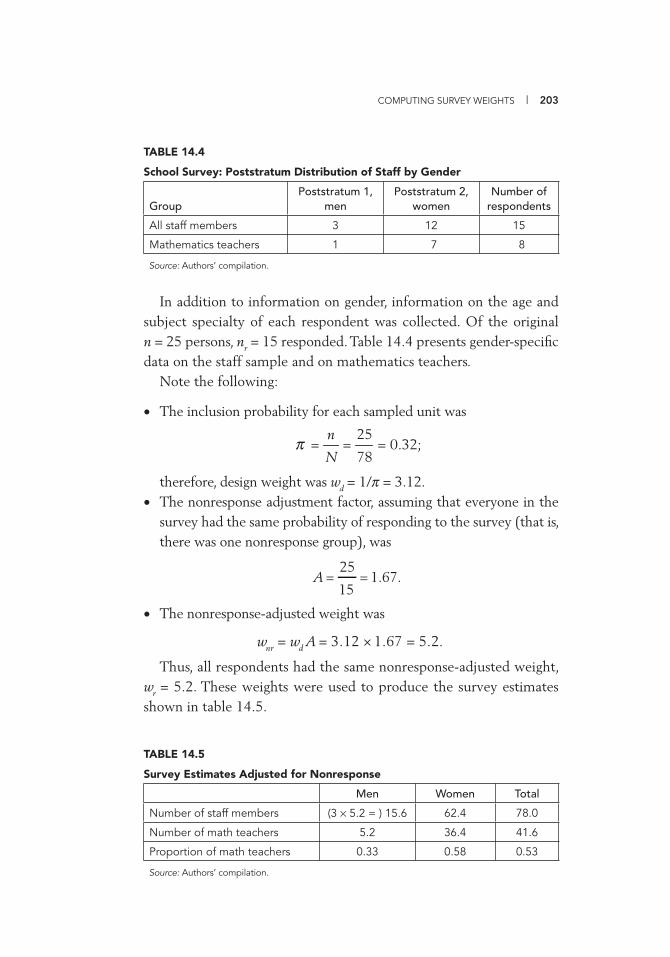
COMPUTING SURVEY WEIGHTS | 203
In addition to information on gender, information on the age and subject specialty of each respondent was collected. Of the original n = 25 persons, nr = 15 responded. Table 14.4 presents gender-specifi c data on the staff sample and on mathematics teachers.
Note the following:
• The inclusion probability for each sampled unit was
32;.0
78
25===
N
nπ
therefore, design weight was wd = 1/π = 3.12.• The nonresponse adjustment factor, assuming that everyone in the
survey had the same probability of responding to the survey (that is, there was one nonresponse group), was
67..115
25==A
• The nonresponse-adjusted weight was
2..567.112.3 =×== Awdwnr
Thus, all respondents had the same nonresponse-adjusted weight, wr = 5.2. These weights were used to produce the survey estimates shown in table 14.5.
TABLE 14.4
School Survey: Poststratum Distribution of Staff by Gender
GroupPoststratum 1,
menPoststratum 2,
womenNumber of
respondents
All staff members 3 12 15
Mathematics teachers 1 7 8
Source: Authors’ compilation.
TABLE 14.5
Survey Estimates Adjusted for Nonresponse
Men Women Total
Number of staff members (3 × 5.2 = ) 15.6 62.4 78.0
Number of math teachers 5.2 36.4 41.6
Proportion of math teachers 0.33 0.58 0.53
Source: Authors’ compilation.
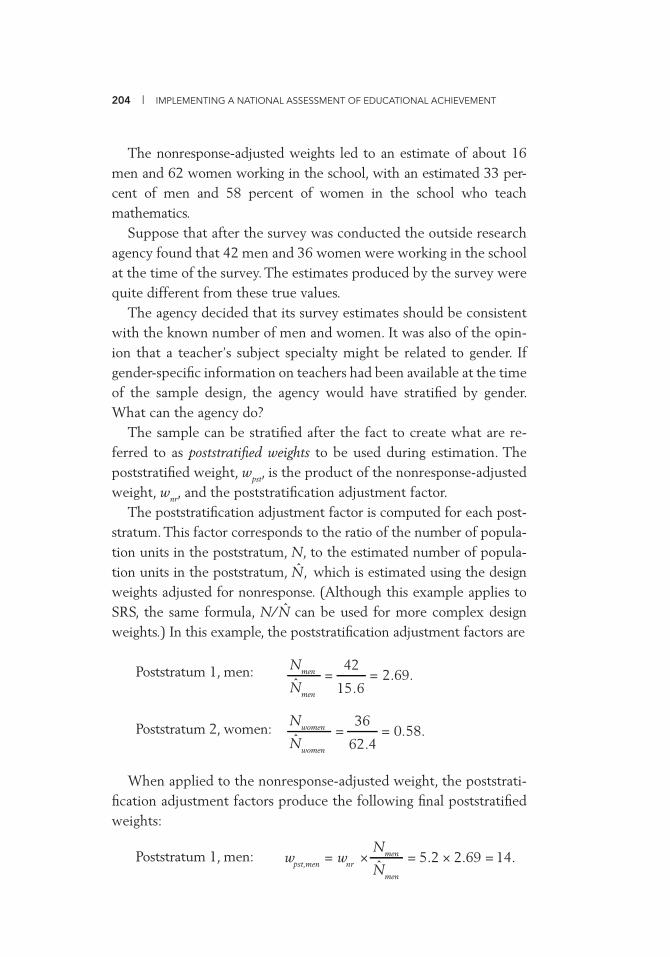
204 | IMPLEMENTING A NATIONAL ASSESSMENT OF EDUCATIONAL ACHIEVEMENT
The nonresponse-adjusted weights led to an estimate of about 16 men and 62 women working in the school, with an estimated 33 per-cent of men and 58 percent of women in the school who teach mathematics.
Suppose that after the survey was conducted the outside research agency found that 42 men and 36 women were working in the school at the time of the survey. The estimates produced by the survey were quite different from these true values.
The agency decided that its survey estimates should be consistent with the known number of men and women. It was also of the opin-ion that a teacher’s subject specialty might be related to gender. If gender-specifi c information on teachers had been available at the time of the sample design, the agency would have stratifi ed by gender. What can the agency do?
The sample can be stratifi ed after the fact to create what are re-ferred to as poststratifi ed weights to be used during estimation. The poststratifi ed weight, wpst, is the product of the nonresponse-adjusted weight, wnr, and the poststratifi cation adjustment factor.
The poststratifi cation adjustment factor is computed for each post-stratum. This factor corresponds to the ratio of the number of popula-tion units in the poststratum, N, to the estimated number of popula-tion units in the poststratum, N , which is estimated using the design weights adjusted for nonresponse. (Although this example applies to SRS, the same formula, N/N can be used for more complex design weights.) In this example, the poststratifi cation adjustment factors are
Poststratum 1, men: 69..26.15
42ˆ ==
Nmen
Nmen
Poststratum 2, women: 58..04.62
36ˆ ==
Nwomen
Nwomen
When applied to the nonresponse-adjusted weight, the poststrati-fi cation adjustment factors produce the following fi nal poststratifi ed weights:
Poststratum 1, men: 14.69.22.5ˆ =×=×=Nmen
Nmenwnrwpst,men
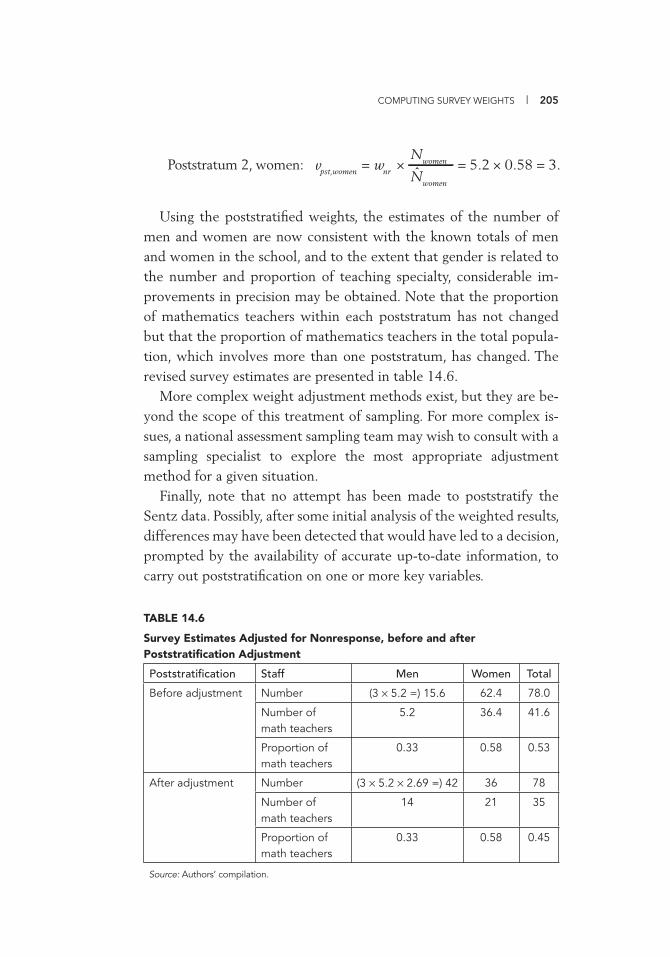
COMPUTING SURVEY WEIGHTS | 205
Poststratum 2, women: 3.58.02.5ˆ =×=×=Nwomen
Nwomenwnrwpst,women
Using the poststratifi ed weights, the estimates of the number of men and women are now consistent with the known totals of men and women in the school, and to the extent that gender is related to the number and proportion of teaching specialty, considerable im-provements in precision may be obtained. Note that the proportion of mathematics teachers within each poststratum has not changed but that the proportion of mathematics teachers in the total popula-tion, which involves more than one poststratum, has changed. The revised survey estimates are presented in table 14.6.
More complex weight adjustment methods exist, but they are be-yond the scope of this treatment of sampling. For more complex is-sues, a national assessment sampling team may wish to consult with a sampling specialist to explore the most appropriate adjustment method for a given situation.
Finally, note that no attempt has been made to poststratify the Sentz data. Possibly, after some initial analysis of the weighted results, differences may have been detected that would have led to a decision, prompted by the availability of accurate up-to-date information, to carry out poststratifi cation on one or more key variables.
TABLE 14.6
Survey Estimates Adjusted for Nonresponse, before and after Poststratifi cation Adjustment
Poststratifi cation Staff Men Women Total
Before adjustment Number (3 × 5.2 =) 15.6 62.4 78.0
Number of math teachers
5.2 36.4 41.6
Proportion of math teachers
0.33 0.58 0.53
After adjustment Number (3 × 5.2 × 2.69 =) 42 36 78
Number of math teachers
14 21 35
Proportion of math teachers
0.33 0.58 0.45
Source: Authors’ compilation.

COMPUTING
ESTIMATES AND
THEIR SAMPLING
ERRORS FROM
SIMPLE RANDOM
SAMPLES
15CHAPTER
207
The purpose of the examples and computations up to this point was to calculate design weights and adjust them where necessary for nonresponse and auxiliary data (poststratifi ed weights). These computations have resulted in a set of fi nal estima-tion weights, which will be used to compute population estimates for the national assessment.
Simple descriptive statistics such as totals, averages, and proportions are produced for virtually every survey. Different types of estimators are appropriate for these different types of variables. Proportions and total counts are typically produced for qualitative variables, whereas averages and totals are estimated for quantitative variables. Having shown how estimation weights are computed in chapter 14, we show how to use those estimation weights to obtain estimates for some basic population characteristics, such as totals, means, and proportions. It also shows how to obtain estimates of precision (often called sampling error) for those estimates. This chapter concentrates on sim-ple random samples. How to obtain estimates of sampling error under complex sample designs is described in chapter 16.
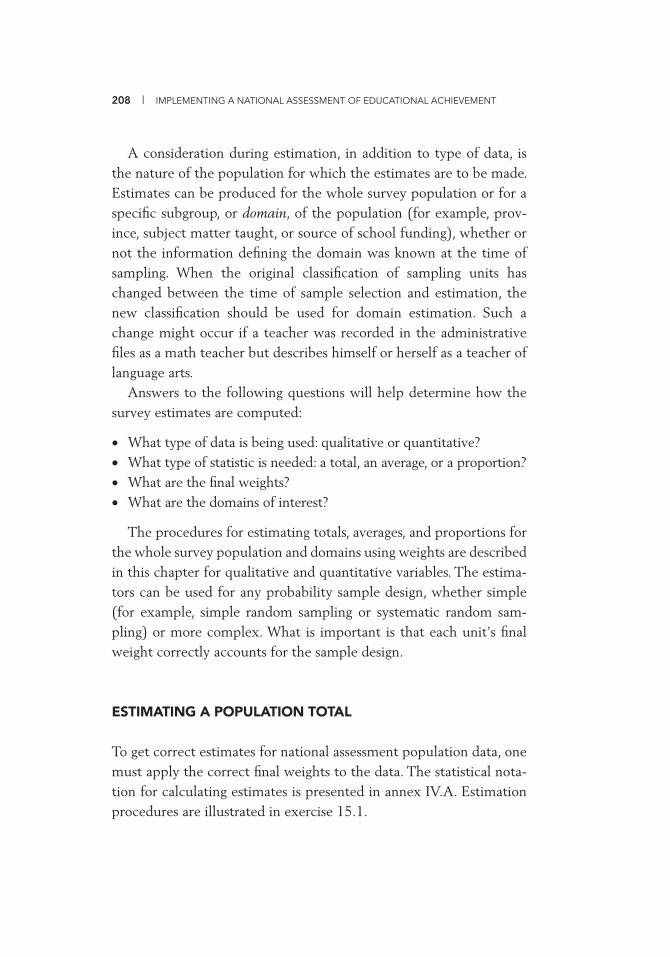
208 | IMPLEMENTING A NATIONAL ASSESSMENT OF EDUCATIONAL ACHIEVEMENT
A consideration during estimation, in addition to type of data, is the nature of the population for which the estimates are to be made. Estimates can be produced for the whole survey population or for a specifi c subgroup, or domain, of the population (for example, prov-ince, subject matter taught, or source of school funding), whether or not the information defi ning the domain was known at the time of sampling. When the original classifi cation of sampling units has changed between the time of sample selection and estimation, the new classifi cation should be used for domain estimation. Such a change might occur if a teacher was recorded in the administrative fi les as a math teacher but describes himself or herself as a teacher of language arts.
Answers to the following questions will help determine how the survey estimates are computed:
• What type of data is being used: qualitative or quantitative?• What type of statistic is needed: a total, an average, or a proportion?• What are the fi nal weights? • What are the domains of interest?
The procedures for estimating totals, averages, and proportions for the whole survey population and domains using weights are described in this chapter for qualitative and quantitative variables. The estima-tors can be used for any probability sample design, whether simple (for example, simple random sampling or systematic random sam-pling) or more complex. What is important is that each unit’s fi nal weight correctly accounts for the sample design.
ESTIMATING A POPULATION TOTAL
To get correct estimates for national assessment population data, one must apply the correct fi nal weights to the data. The statistical nota-tion for calculating estimates is presented in annex IV.A. Estimation procedures are illustrated in exercise 15.1.

COMPUTING ESTIMATES AND SAMPLING ERRORS FROM SIMPLE RANDOM SAMPLES | 209
Estimation for SRS400
This exercise involves constructing three estimates of interest to policy makers for the entire population of a simple randomized sample, SRS400: (a) the total number of students, (b) their average age, and (c) the proportion scoring 230 or better in mathematics. Then three estimates will be made for the subpopulation “boys” (gen-der = 1): the total number of boys, their average age, and their average math score.
The required data have been stored in …\MYSAMPLSOL\RESPSRSFINALWT.SAV.
The estimates must refer to the population at the time of assessment. Consequently, although the dropouts remain in the fi le and have fi nal weights because they belonged to the initial frame, they do not contribute to the estimates; at the time of assessment, all their characteristics have a value of zero, including a conceptual dummy variable, belongs to the population being assessed, which is equal to zero. Assigning their characteristics a value of zero is equivalent to thinking of the assessed population as an estimation domain within the population defi ned by the frame. Records of the dropouts should therefore be excluded from the fi nal fi le that will be used to compute the fi nal estimates.
The only direct contributors to the estimates are thus the students who were actually assessed, who also represent the absentees through the adjustments that led to their fi nal weights. In compiling estimates, one must take into consideration the status (participant or absentee) of each student and use the variable STATUS as a fi lter. A dummy variable, MAT230, must also be created because policy makers are interested in getting informa-tion on students who scored at least 230 on the mathematics test.
1. To begin the exercise, open SPSS, retrieve the data set, and create MAT230. Details of how to create MAT230 under WesVar are presented in steps 8 to 12 in annex IV.D. Follow these commands:
File – Open – Data
…\MYSAMPLSOL\RESPSRSFINALWT
Open
Transform – Recode into Different Variables…
2. Move MATH to Input Variable. Type MAT230 in Output Variable Name. If you choose, you can also type in a label. Click Change.
3. Click Old and New Values. In Old Value, click Range, value through HIGHEST and type 230. In New Value, type the number 1. Click Add. In Old Value, click All Other Values (at the bottom of the screen). In New Value, type the number 0. Click Add, Continue, and OK.
Before you can produce estimates, you need to fi lter out nonparticipants and use the estimation weight. Use the following commands:
Data – Select Casesa – If condition is satisfi ed… – If…
EXERCISE 15.1
(continued)
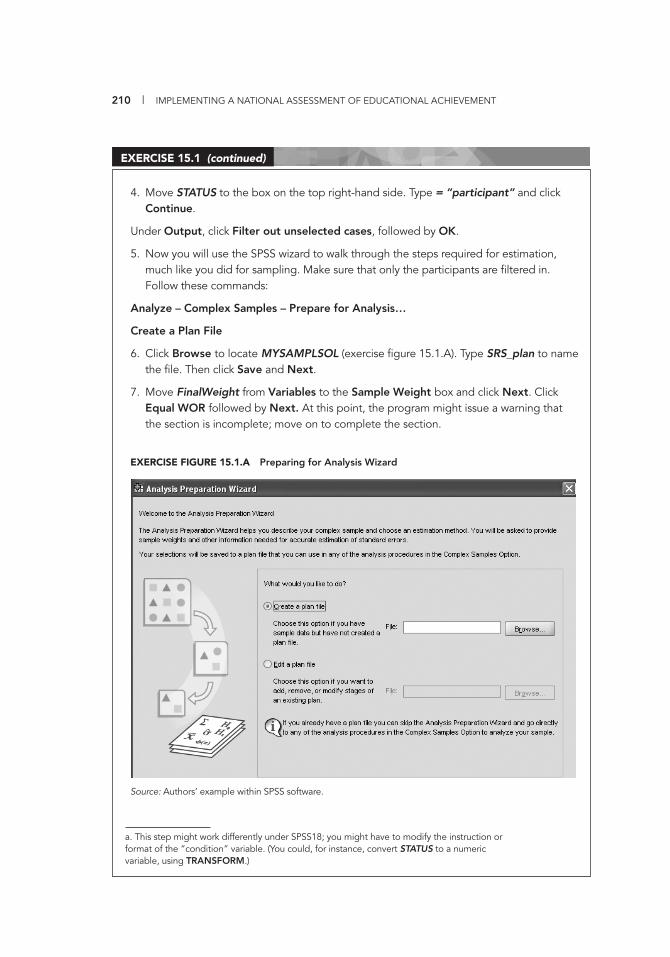
210 | IMPLEMENTING A NATIONAL ASSESSMENT OF EDUCATIONAL ACHIEVEMENT
4. Move STATUS to the box on the top right-hand side. Type = “participant” and click Continue.
Under Output, click Filter out unselected cases, followed by OK.
5. Now you will use the SPSS wizard to walk through the steps required for estimation, much like you did for sampling. Make sure that only the participants are fi ltered in. Follow these commands:
Analyze – Complex Samples – Prepare for Analysis…
Create a Plan File
6. Click Browse to locate MYSAMPLSOL (exercise fi gure 15.1.A). Type SRS_plan to name the fi le. Then click Save and Next.
7. Move FinalWeight from Variables to the Sample Weight box and click Next. Click Equal WOR followed by Next. At this point, the program might issue a warning that the section is incomplete; move on to complete the section.
EXERCISE 15.1 (continued)
a. This step might work differently under SPSS18; you might have to modify the instruction or format of the “condition” variable. (You could, for instance, convert STATUS to a numeric variable, using TRANSFORM.)
EXERCISE FIGURE 15.1.A Preparing for Analysis Wizard
Source: Authors’ example within SPSS software.
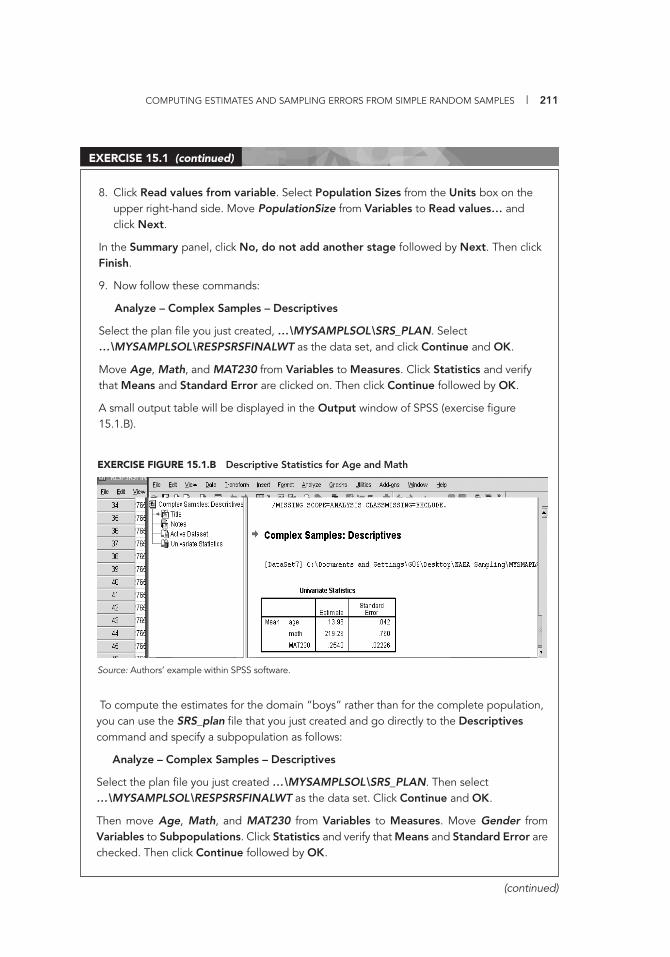
COMPUTING ESTIMATES AND SAMPLING ERRORS FROM SIMPLE RANDOM SAMPLES | 211
To compute the estimates for the domain “boys” rather than for the complete population, you can use the SRS_plan fi le that you just created and go directly to the Descriptives command and specify a subpopulation as follows:
Analyze – Complex Samples – Descriptives
Select the plan fi le you just created …\MYSAMPLSOL\SRS_PLAN. Then select …\MYSAMPLSOL\RESPSRSFINALWT as the data set. Click Continue and OK.
Then move Age, Math, and MAT230 from Variables to Measures. Move Gender from Variables to Subpopulations. Click Statistics and verify that Means and Standard Error are checked. Then click Continue followed by OK.
8. Click Read values from variable. Select Population Sizes from the Units box on the upper right-hand side. Move PopulationSize from Variables to Read values… and click Next.
In the Summary panel, click No, do not add another stage followed by Next. Then click Finish.
9. Now follow these commands:
Analyze – Complex Samples – Descriptives
Select the plan fi le you just created, …\MYSAMPLSOL\SRS_PLAN. Select …\MYSAMPLSOL\RESPSRSFINALWT as the data set, and click Continue and OK.
Move Age, Math, and MAT230 from Variables to Measures. Click Statistics and verify that Means and Standard Error are clicked on. Then click Continue followed by OK.
A small output table will be displayed in the Output window of SPSS (exercise fi gure 15.1.B).
EXERCISE 15.1 (continued)
(continued)
EXERCISE FIGURE 15.1.B Descriptive Statistics for Age and Math
Source: Authors’ example within SPSS software.
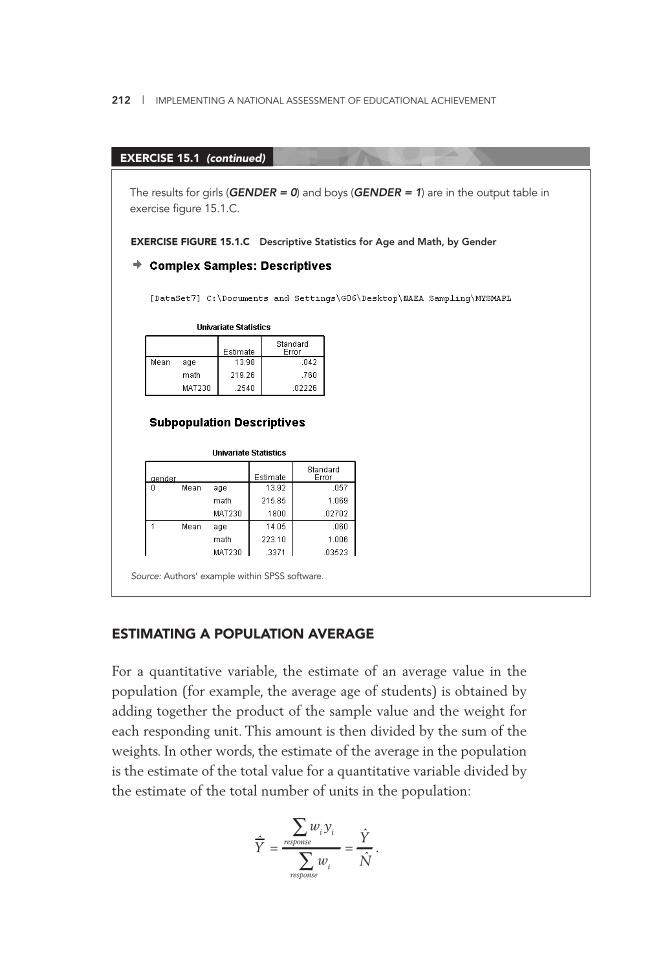
212 | IMPLEMENTING A NATIONAL ASSESSMENT OF EDUCATIONAL ACHIEVEMENT
ESTIMATING A POPULATION AVERAGE
For a quantitative variable, the estimate of an average value in the population (for example, the average age of students) is obtained by adding together the product of the sample value and the weight for each responding unit. This amount is then divided by the sum of the weights. In other words, the estimate of the average in the population is the estimate of the total value for a quantitative variable divided by the estimate of the total number of units in the population:
N
Y
wi
wi yi
Y
response
response
ˆ
ˆˆ ==∑
∑.
The results for girls (GENDER = 0) and boys (GENDER = 1) are in the output table in exercise fi gure 15.1.C.
EXERCISE 15.1 (continued)
EXERCISE FIGURE 15.1.C Descriptive Statistics for Age and Math, by Gender
Source: Authors’ example within SPSS software.
COMPUTING ESTIMATES AND SAMPLING ERRORS FROM SIMPLE RANDOM SAMPLES | 213
ESTIMATING A POPULATION PROPORTION
For qualitative data, the estimate of the proportion of units in the survey population having a given characteristic C is obtained by add-ing together the weights for the units having that characteristic and dividing that total by the sum of the weights for all respondents. A dummy variable, ϕi, can be used to indicate whether the ith unit has (ϕi = 1) or has not (ϕi = 0) the characteristic of interest. In other words, the estimate of the proportion in the population is the estimate of the total number of units possessing the given characteristic divided by the estimate of the total number of units in the population:
N
Nc
wi
wiϕi
Pc
response
response
ˆ
ˆˆ ==
∑
∑.
ESTIMATING FOR SUBGROUPS OF THE POPULATION
Estimates may be required for subgroups, which are often referred to as domains in the sampling literature. Such domains may include age group, source of school funding, and socioeconomic status of students. In such estimates, wi indicates the fi nal weights adjusted for nonre-sponse; the dummy variable δi indicates whether the ith unit is (δi = 1) or is not (δi = 0) in the subpopulation of interest; and the dummy variable ϕi indicates whether the ith unit has (ϕi = 1) or has not (ϕI = 0) the characteristic of interest. The size of the population for a subpopulation of interest for either qualitative or quantitative data is estimated as
ˆ Nsubpopulation = wiδiresponse∑ .
The estimate of a subpopulation total for quantitative data is
ˆ Y subpopulation = wiδi yiresponse∑ .
The estimates of a subpopulation average for a quantitative or quali-tative variable are, respectively,
214 | IMPLEMENTING A NATIONAL ASSESSMENT OF EDUCATIONAL ACHIEVEMENT
ˆ Ysubpopulation =response
wiδi yi∑wiδi
response∑
=ˆ Ysubpopulation
ˆ Nsubpopulation
and
ˆ Psubpopulation =wiδi ϕi
=ˆ Nsubpopulation ∩Cresponse
∑ˆ Nsubpopulationwiδi
response∑
.
The appropriate fi nal weight must be used to produce estimates. If the sampling weights are ignored (as has been the case in at least one national assessment), the estimates will be incorrect.
Having completed exercise 15.1, the interested reader may wish to see a comparison of SRS400 data and census data based on the entire population of 27,654 students. This comparison can be examined in annex IV.B.
CONCLUSION
This chapter was limited to estimation under simple random sam-pling. SPSS Complex Samples can be used to compute the estimates and their sampling errors under complex designs. However this soft-ware can be diffi cult to apply in this particular situation and would require a relatively deep understanding of survey sampling. An alter-native approach and software are proposed in chapter 16 (see also annex IV.C).
COMPUTING
ESTIMATES AND
THEIR SAMPLING
ERRORS FROM
COMPLEX SAMPLES
16CHAPTER
215
Estimates produced from a survey are subject to errors of two basic types: sampling errors and nonsampling errors. Nonsampling errors include measurement errors, trend errors, re-sponse errors, and the like. When these errors are systematic, they often cause bias and are diffi cult to measure. When they are random, they can be estimated with work and generous resources. In national assessments, nonsampling errors are caused by human factors, such as inadequate supervision during test administration, mistakes made during data cleaning and entry, lack of effort in answering tests or questionnaires, or false responses to questionnaire items. Sampling errors, in contrast, are not attributable to human factors. Sampling error is a measure of the extent to which an estimate from different possible samples of the same size and design, using the same estima-tor, differ from one another.
In a sample-based national assessment, sampling errors must be calculated. The purpose of this chapter is to illustrate how sampling variance (sampling error) is estimated in most assessment surveys and the importance of correctly incorporating the sample design into that estimation. The chapter explains how estimates of sampling error can be obtained rather easily using replication, in which, instead of select-ing one sample of size n, k independent samples of the size n/k are
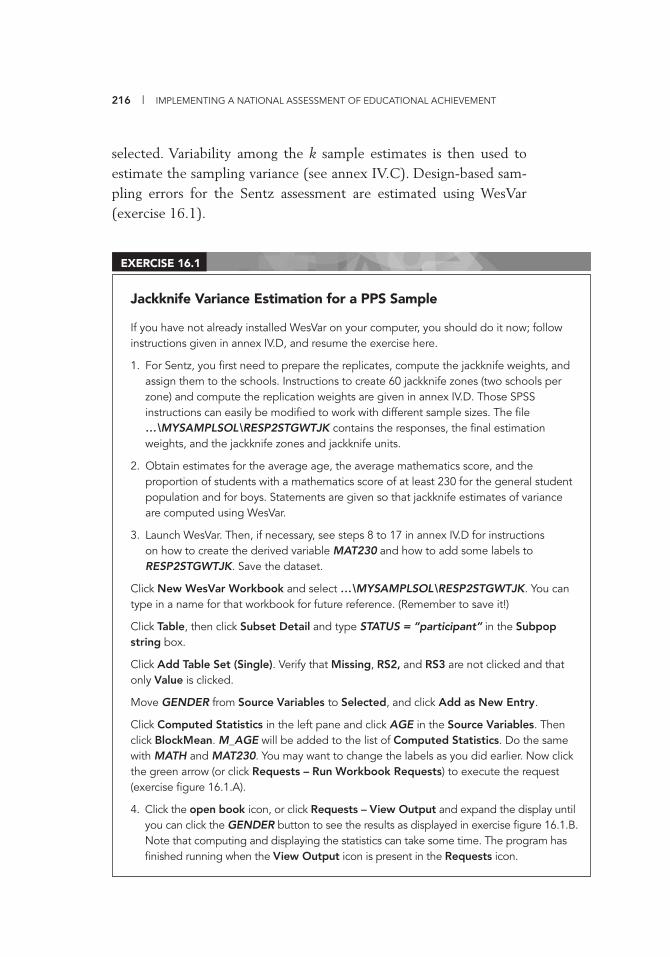
216 | IMPLEMENTING A NATIONAL ASSESSMENT OF EDUCATIONAL ACHIEVEMENT
selected. Variability among the k sample estimates is then used to estimate the sampling variance (see annex IV.C). Design-based sam-pling errors for the Sentz assessment are estimated using WesVar (exercise 16.1).
Jackknife Variance Estimation for a PPS Sample
If you have not already installed WesVar on your computer, you should do it now; follow instructions given in annex IV.D, and resume the exercise here.
1. For Sentz, you fi rst need to prepare the replicates, compute the jackknife weights, and assign them to the schools. Instructions to create 60 jackknife zones (two schools per zone) and compute the replication weights are given in annex IV.D. Those SPSS instructions can easily be modifi ed to work with different sample sizes. The fi le …\MYSAMPLSOL\RESP2STGWTJK contains the responses, the fi nal estimation weights, and the jackknife zones and jackknife units.
2. Obtain estimates for the average age, the average mathematics score, and the proportion of students with a mathematics score of at least 230 for the general student population and for boys. Statements are given so that jackknife estimates of variance are computed using WesVar.
3. Launch WesVar. Then, if necessary, see steps 8 to 17 in annex IV.D for instructions on how to create the derived variable MAT230 and how to add some labels to RESP2STGWTJK. Save the dataset.
Click New WesVar Workbook and select …\MYSAMPLSOL\RESP2STGWTJK. You can type in a name for that workbook for future reference. (Remember to save it!)
Click Table, then click Subset Detail and type STATUS = “participant” in the Subpop string box.
Click Add Table Set (Single). Verify that Missing, RS2, and RS3 are not clicked and that only Value is clicked.
Move GENDER from Source Variables to Selected, and click Add as New Entry.
Click Computed Statistics in the left pane and click AGE in the Source Variables. Then click BlockMean. M_AGE will be added to the list of Computed Statistics. Do the same with MATH and MAT230. You may want to change the labels as you did earlier. Now click the green arrow (or click Requests – Run Workbook Requests) to execute the request (exercise fi gure 16.1.A).
4. Click the open book icon, or click Requests – View Output and expand the display until you can click the GENDER button to see the results as displayed in exercise fi gure 16.1.B. Note that computing and displaying the statistics can take some time. The program has fi nished running when the View Output icon is present in the Requests icon.
EXERCISE 16.1
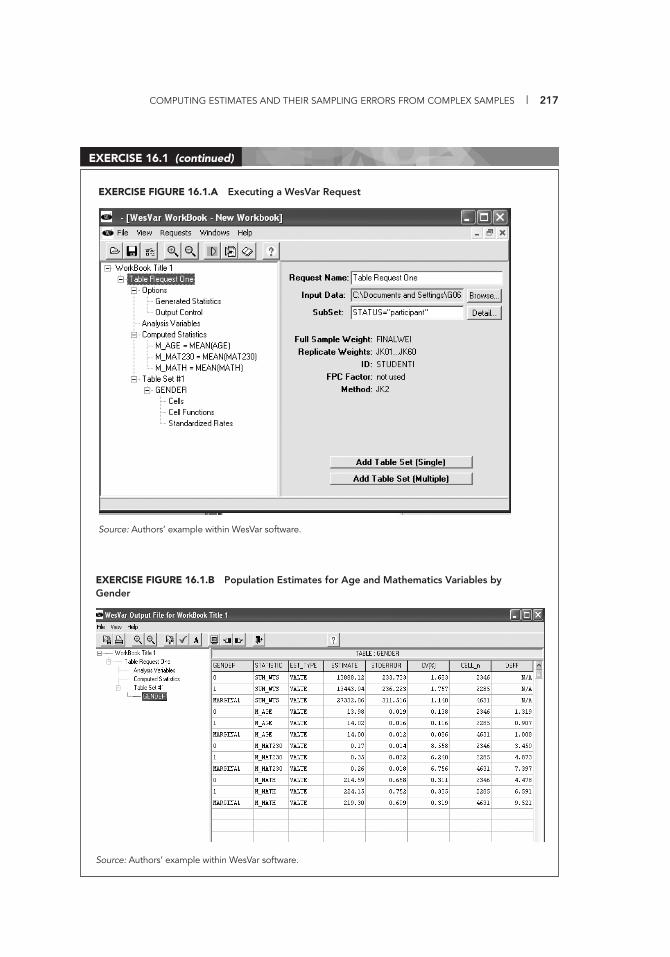
COMPUTING ESTIMATES AND THEIR SAMPLING ERRORS FROM COMPLEX SAMPLES | 217
EXERCISE 16.1 (continued)
EXERCISE FIGURE 16.1.A Executing a WesVar Request
Source: Authors’ example within WesVar software.
EXERCISE FIGURE 16.1.B Population Estimates for Age and Mathematics Variables by Gender
Source: Authors’ example within WesVar software.
218 | IMPLEMENTING A NATIONAL ASSESSMENT OF EDUCATIONAL ACHIEVEMENT
The theory that supports the estimation of sampling error is be-yond the scope of this chapter, but the interested reader can turn to textbooks on sampling theory (see, for example, Lohr 1999) for a detailed account of the exact design-based estimation methods or to textbooks devoted to the analysis of data from complex surveys (see, for example, Lehtonen and Pahkinen 1995). The procedure to calcu-late jackknife weights is described in annex IV.D. Other methods (such as bootstrapping and balanced repeated replication) exist but will not be covered here.
When the sample is large enough and the number of strata is mod-erate, alternative jackknifi ng strategies are available. In many interna-tional assessment programs, the estimates are computed by a central service in a standardized manner, and the method used may be differ-ent from what is described here. When participating countries are expected to produce their own estimates, the strategy described in exercise 16.1 is often adopted because of its appealing simplicity. There are limitations, however, to what jackknifi ng can accomplish. Jackknifi ng is quite effi cient at estimating variances for totals and continuous functions of totals (for example, ratios, proportions, or correlation coeffi cients). It is not as good with respect to discontinu-ous nonlinear or order statistics (for example, Gini coeffi cients or me-dians). If such statistics are of interest, a sampling specialist should be consulted to determine the best replication approach.
The examples in exercise 16.2 were devised using the national assessment data fi le available as the SPSS fi le …NATASSESS\NATASSESS.SAV. This data fi le is also the source of the data used in the fi rst part of volume 4, Analyzing Data from a National Assessment of Educational Achievement.
A closing note of caution: The software market offers a wide array of personal computer data processing and statistical software prod-ucts. A considerable number of these products, including ones that claim to specialize in survey processing, give inaccurate results if they fail to take into account that a survey was based on a complex sample design. The interested user is advised to consult professional reviews of statistical software (see, for example, http://www.fas.harvard.edu/~stats/survey-soft/survey-soft.html).
COMPUTING ESTIMATES AND THEIR SAMPLING ERRORS FROM COMPLEX SAMPLES | 219
Calculating Gender Differences on a Mathematics Test
In this exercise, as you did with the demonstration fi le in exercise 16.1, you need to create a WesVar version of the fi le and compute jackknife replication weights for it before doing anything else.
Launch WesVar, click New WesVar Data File, and select …\NATASSESS\ NATASSESS.SAV. Scroll down the Source Variables to locate and move the design weight WGTPOP to the Full Sample box and STUDID to the ID box. Move all remaining variables to the Variables box. Save the fi le as …\NATASSESS\NATASSESS.var.
Click the scale button to create the replication weights. Because these assessment data were collected under a complex sampling plan, as described earlier, use two jackknife units per jackknife stratum. Click JK2 as the Method; you may also want to change the prefi x of the replicate weights to JK. Move JKINDIC to the VarUnit box (this is what NATASSESS calls the jackknife unit), and move JKZONE (that is, the jackknife stratum) to the VarStrat box. Click OK to create the weights and save the fi le. Neither recoding nor labeling is required at this stage. Close the screen and return to the WesVar fi le and WesVar work-book creation screen.
Alternatively you can open a New WesVar Workbook and select …\NATASSESS\NATASSESS.var as the WesVar data fi le. Click Open and then click Descriptive Statistics. Click Analysis Variables in the left pane and move the three variables of interest (in this instance)—MATHPC (math percent correct), MATHRS (math raw score), and MATHSS (math scale score)—from Source Variables to Selected. Click the green arrow button to execute the request (exercise fi gure 16.2.A) and the open book icon (or click on Requests – View Output) to view the output. Expand by clicking the +. To get the data for MATHPC, click the + and Statistics (exercise fi gure 16.2.B).
This request produces a large number of univariate statistics for MATHPC (mean, percen-tile, population variance, and other basic weighted statistics) along with their estimated sampling errors, where appropriate, as displayed in exercise fi gure 16.2.C. Note that WesVar does not compute a mode.
Close the output window. Highlight WorkBook Title 1 in the left pane, and click Table followed by Add Table Set (Single). In the left pane, click Computed Statistics, highlight MATHSS under Source Variables, and click Block Mean; the mean math score will now be computed. Highlight Table Set #1, move GENDER from Source Variables to Select-ed, and click Add as New Entry. If needed, click + to expand Table Set. Click on the Cells node in the left pane. The right pane will display all cells that will be produced for that table under Cell Defi nition; highlight 1, type Boys in the Label pane, and click Add as New Entry. Do the same for cell 2, which will refer to the Girls (exercise fi gure 16.2.C).
Click Cell Functions (left pane), type Diff = Boys – Girls in the Function Statistic box, and
EXERCISE 16.2
(continued)
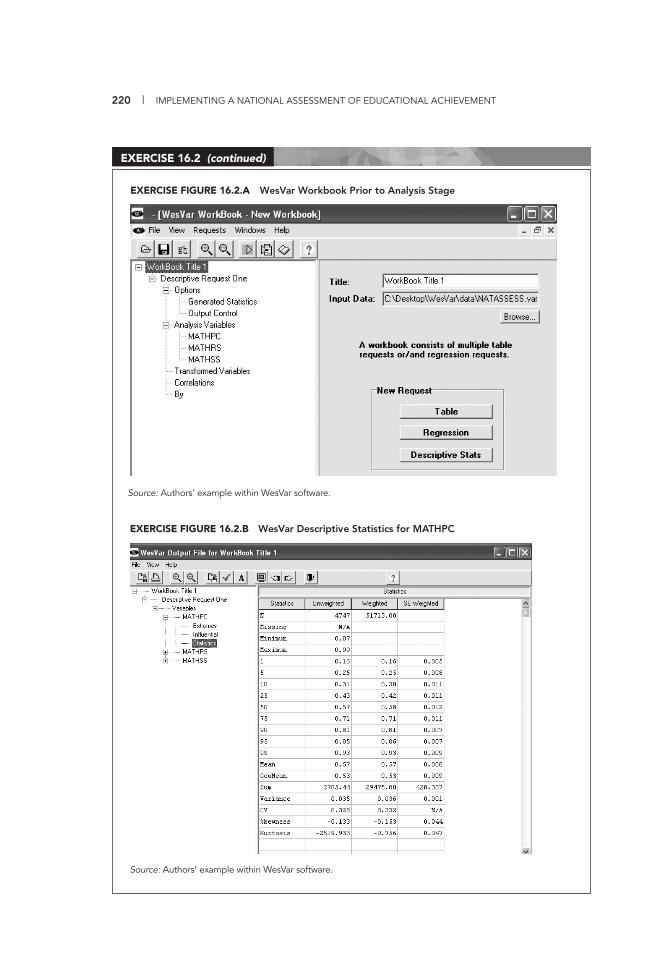
220 | IMPLEMENTING A NATIONAL ASSESSMENT OF EDUCATIONAL ACHIEVEMENT
EXERCISE 16.2 (continued)
EXERCISE FIGURE 16.2.A WesVar Workbook Prior to Analysis Stage
Source: Authors’ example within WesVar software.
EXERCISE FIGURE 16.2.B WesVar Descriptive Statistics for MATHPC
Source: Authors’ example within WesVar software.
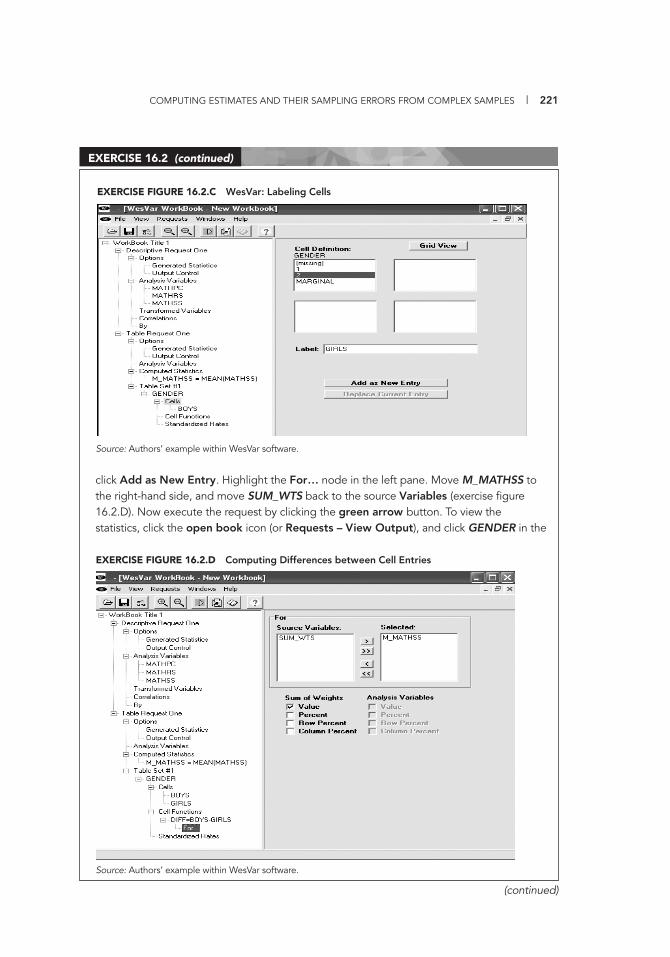
COMPUTING ESTIMATES AND THEIR SAMPLING ERRORS FROM COMPLEX SAMPLES | 221
click Add as New Entry. Highlight the For… node in the left pane. Move M_MATHSS to the right-hand side, and move SUM_WTS back to the source Variables (exercise fi gure 16.2.D). Now execute the request by clicking the green arrow button. To view the statistics, click the open book icon (or Requests – View Output), and click GENDER in the
EXERCISE 16.2 (continued)
(continued)
EXERCISE FIGURE 16.2.C WesVar: Labeling Cells
Source: Authors’ example within WesVar software.
EXERCISE FIGURE 16.2.D Computing Differences between Cell Entries
Source: Authors’ example within WesVar software.
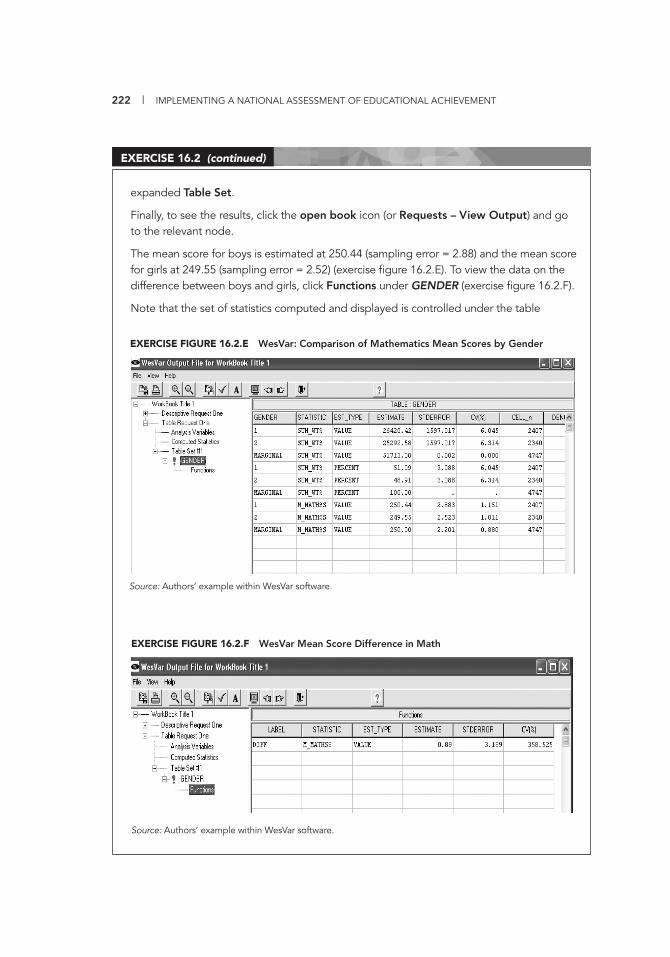
222 | IMPLEMENTING A NATIONAL ASSESSMENT OF EDUCATIONAL ACHIEVEMENT
expanded Table Set.
Finally, to see the results, click the open book icon (or Requests – View Output) and go to the relevant node.
The mean score for boys is estimated at 250.44 (sampling error = 2.88) and the mean score for girls at 249.55 (sampling error = 2.52) (exercise fi gure 16.2.E). To view the data on the difference between boys and girls, click Functions under GENDER (exercise fi gure 16.2.F).
Note that the set of statistics computed and displayed is controlled under the table
EXERCISE 16.2 (continued)
EXERCISE FIGURE 16.2.E WesVar: Comparison of Mathematics Mean Scores by Gender
Source: Authors’ example within WesVar software.
EXERCISE FIGURE 16.2.F WesVar Mean Score Difference in Math
Source: Authors’ example within WesVar software.
COMPUTING ESTIMATES AND THEIR SAMPLING ERRORS FROM COMPLEX SAMPLES | 223
options node. The data displayed may differ from those presented in exercise fi gure 16.2.F because they will depend on the options selected.
The estimated difference is very small (diff = 0.89), and the associated t-value is 0.89/3.189 = 0.279, which makes the difference not statistically signifi cant (p-value = 0.781 > 0.05).
EXERCISE 16.2 (continued)


SPECIAL
TOPICS17CHAPTER
225
This chapter focuses on a number of additional sampling issues related to concerns, problems, and errors commonly encountered in national assessment studies. These topics include treat-ment of nonresponses, stratifi cation, frame sorting, and sample selec-tion; treatment of oversize and undersize schools; and standards for judging the adequacy of the response rates in a national assessment.
NONRESPONSE
There is no universal or uniform best way to deal with nonresponse. In a general social survey, reasons for nonresponse in one part of the country (for example, school closures on account of weather) may be different from those in another part of the country (for example, gen-eral dissatisfaction with local authorities). The magnitude, the source, and the impact of nonresponse are almost impossible to predict, mak-ing a global strategy to guard against it very diffi cult to devise. Over time, however, survey statisticians have developed a number of prac-tices that are more or less accepted to deal with nonresponse.
One strategy is to augment the sample size to compensate for ex-pected nonresponse. This method is valid as long as the reasons for
226 | IMPLEMENTING A NATIONAL ASSESSMENT OF EDUCATIONAL ACHIEVEMENT
nonresponse are not related to the survey subject matter. The aug-mentation can be over the complete sample, or it can be restricted to some strata or some groups of respondents for whom response has been low in the past. In the context of a national assessment of edu-cational achievement, if a sample of 100 responding schools are needed, and 25 percent, for example, are expected to refuse to par-ticipate, 134 schools (75 percent of 134 = 100.5) should be selected and contacted. A better-than-expected response rate will add a little to data collection and processing costs. For this reason, allowing for potential additional costs in the initial budget is advisable.
A second strategy that is common among assessment studies is to use proxy responses, or replacement schools. Typically, for each sam-pled school, one replacement school is also selected. A replacement school should be as similar as possible to the selected school. If a sorted fi le exists (for implicit stratifi cation), one technique is to use the school immediately after or immediately before the selected school on the sorted listing, assuming that school is available as a re-placement. This strategy does not eliminate nonresponse bias but may keep it to a minimum, if the sorting is in fact related to out-comes. A school selected for the main sample can never be used as a replacement for another selected but nonresponding school. A re-placement school may be tagged as a replacement for two consecu-tive selected schools (for example, when the sampling rate is very high in a stratum and the number of schools available for replacement is insuffi cient). In this situation, the replacement school can be used only once.
Replacement schools can be a reassuring fallback. However, na-tional assessment teams can help limit the use of replacement schools by taking steps to encourage all originally selected schools to participate.
STRATIFICATION, FRAME SORTING, AND SAMPLE SELECTION
Most national assessment studies use a stratifi ed multistage design. Such a design was illustrated in chapter 8. As indicated earlier, one may want to use strata to ensure that certain types of schools are se-lected in the sample (for example, by province) and that a given sam-
SPECIAL TOPICS | 227
ple size is allocated to each group (for example, 75 schools per prov-ince). These strata are called explicit. One may also want to use other criteria for which the same level of precision is not required or for which proportional representation is suffi cient (for example, towns within a province or funding within a province). These strata are called implicit. In practice, implicit strata are sorting variables within explicit strata. Finally, regardless of the sample selection technique used (such as simple random sampling, systematic random sampling, or probability proportional to size), the sampling frame should be sorted by school size before sample selection. Sorting by size will improve the selection of replacement schools.
One common feature of the selection process is the use of system-atic random sampling. Some countries use it with equal probability, whereas others use it with probability proportional to school size.
Clearly, sorting of the frame should be done within each explicit stratum, because this corresponds to implicit stratifi cation. One use-ful way to sort the sampling frame prior to sample selection is to al-ternate the order of sorting by size from one implicit stratum to the next. Table 17.1 shows how this type of sorting is accomplished.
TABLE 17.1
Sampling Frame with Different Measure of Size Order within Strata
Explicit stratum
Implicit stratum
Measureof size
SchoolID
Mailing address
Name of principal
Otherframe
variable
1 1 Small 1 ... ... ...
1 ... ... ... … … …
1 1 LARGE … … … …
1 2 LARGE … … … …
1 ... ... … … … …
1 2 Small … … … …
1 3 Small … … … …
1 ... ... … … … …
1 3 LARGE … … … …
2 1 Small … … … …
... ... … … … …
H 3 ... N ... ... ...
Source: Authors’ compilation. Note: In column 3, all the schools in the country in the fi rst stratum (the fi rst three rows of data) are
ranked in order of size from the smallest to the largest. It is not possible to list all the schools in each stratum in this fi gure; the symbol “…” represents the schools between the smallest and the largest.
228 | IMPLEMENTING A NATIONAL ASSESSMENT OF EDUCATIONAL ACHIEVEMENT
TABLE 17.2
Sampling Frame for 10 Schools and Associated Design Weights If Selected
School IDSchool measure
of sizeCumulative
measure of size Design weight
1 500 500 830/(3 × 500) = 0.5533
2 50 550 830/(3 × 50) = 5.5333
3 50 600 830/(3 × 50) = 5.5333
4 40 640 830/(3 × 40) = 6.9167
5 40 680 830/(3 × 40) = 6.9167
6 35 715 830/(3 × 35) = 7.9048
7 35 750 830/(3 × 35) = 7.9048
8 30 780 830/(3 × 30) = 9.2222
9 30 810 830/(3 × 30) = 9.2222
10 20 830 830/(3 × 20) = 13.8333
Source: Authors’ compilation.
Sorting the frame in this manner is not obligatory, but it improves the similarity of replacement and selected schools and should reduce nonresponse bias. This sorting by size also improves the chances of selecting schools of every size from each explicit stratum, minimizing stratum-to-stratum variation, and thus improving the precision of estimates.
OVERSIZE SCHOOLS
When using sampling with probability proportional to size, the de-sign weight is directly affected by the size of the sampling unit. Very small units will have very large weights, and, conversely, very large units will have very small weights. Some units may even end up with weights of less than one. In this situation, the common practice is to choose the unit “with certainty” and redo the sampling for the rest of the sampling frame.
For example, consider the stratum of Nh = 10 schools in table 17.2, from which a sample of nh = 3 schools is needed and the design weight each school would have if selected. If school 1 (which accounts for more than 50 percent of the students in the sampling frame) were selected, its design weight would be less than one. To address the
SPECIAL TOPICS | 229
problem, one could decide that this school is selected and that it will represent only itself. School 1 is called a self-representing unit. Then, one would need to select two schools from the remaining nine, as shown in table 17.3.
If an expert on sampling suggests this strategy, he or she may also recommend that two classes be selected from school 1. Note that this selection will have the effect of bringing the weights for the remain-ing units closer to one another, which will result in smaller sampling error. If, after removing school 1, school 2 proved to cause a similar problem, it would also be removed, and the frame and sample would be amended in the manner illustrated previously. Of course, the sam-ple would increase to four units (two self-representing units and two from the remaining eight).
UNDERSIZE SCHOOLS
Many countries with substantial rural populations have a relatively large number of small schools. Suppose that the smallest schools on the frame have so few in-scope students (say, fewer than 10 each)
TABLE 17.3
Adjusted Sampling Frame
School ID
School measure of size
Cumulative measure of size Design weight
1 500 500 500/500 = 1.0000
2 50 50 330/(2 × 50) = 3.3000
3 50 100 330/(2 × 50) = 3.3000
4 40 140 330/(2 × 40) = 4.1250
5 40 180 330/(2 × 40) = 4.1250
6 35 215 330/(2 × 35) = 4.7143
7 35 250 330/(2 × 35) = 4.7143
8 30 280 330/(2 × 30) = 5.5000
9 30 310 330/(2 × 30) = 5.5000
10 20 330 330/(2 × 20) = 8.2500
Source: Authors’ compilation.
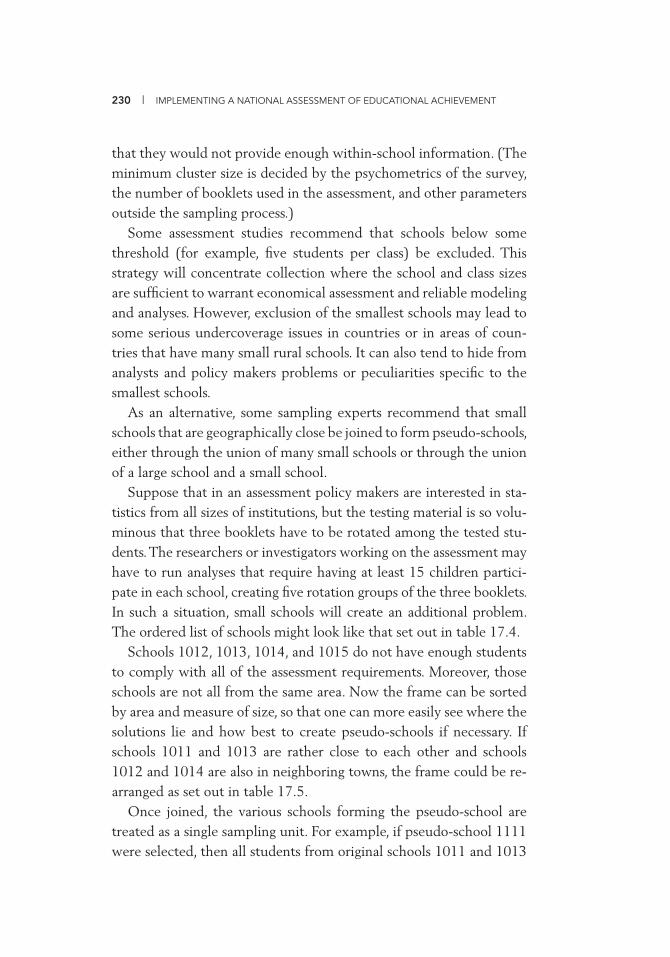
230 | IMPLEMENTING A NATIONAL ASSESSMENT OF EDUCATIONAL ACHIEVEMENT
that they would not provide enough within-school information. (The minimum cluster size is decided by the psychometrics of the survey, the number of booklets used in the assessment, and other parameters outside the sampling process.)
Some assessment studies recommend that schools below some threshold (for example, fi ve students per class) be excluded. This strategy will concentrate collection where the school and class sizes are suffi cient to warrant economical assessment and reliable modeling and analyses. However, exclusion of the smallest schools may lead to some serious undercoverage issues in countries or in areas of coun-tries that have many small rural schools. It can also tend to hide from analysts and policy makers problems or peculiarities specifi c to the smallest schools.
As an alternative, some sampling experts recommend that small schools that are geographically close be joined to form pseudo-schools, either through the union of many small schools or through the union of a large school and a small school.
Suppose that in an assessment policy makers are interested in sta-tistics from all sizes of institutions, but the testing material is so volu-minous that three booklets have to be rotated among the tested stu-dents. The researchers or investigators working on the assessment may have to run analyses that require having at least 15 children partici-pate in each school, creating fi ve rotation groups of the three booklets. In such a situation, small schools will create an additional problem. The ordered list of schools might look like that set out in table 17.4.
Schools 1012, 1013, 1014, and 1015 do not have enough students to comply with all of the assessment requirements. Moreover, those schools are not all from the same area. Now the frame can be sorted by area and measure of size, so that one can more easily see where the solutions lie and how best to create pseudo-schools if necessary. If schools 1011 and 1013 are rather close to each other and schools 1012 and 1014 are also in neighboring towns, the frame could be re-arranged as set out in table 17.5.
Once joined, the various schools forming the pseudo-school are treated as a single sampling unit. For example, if pseudo-school 1111 were selected, then all students from original schools 1011 and 1013
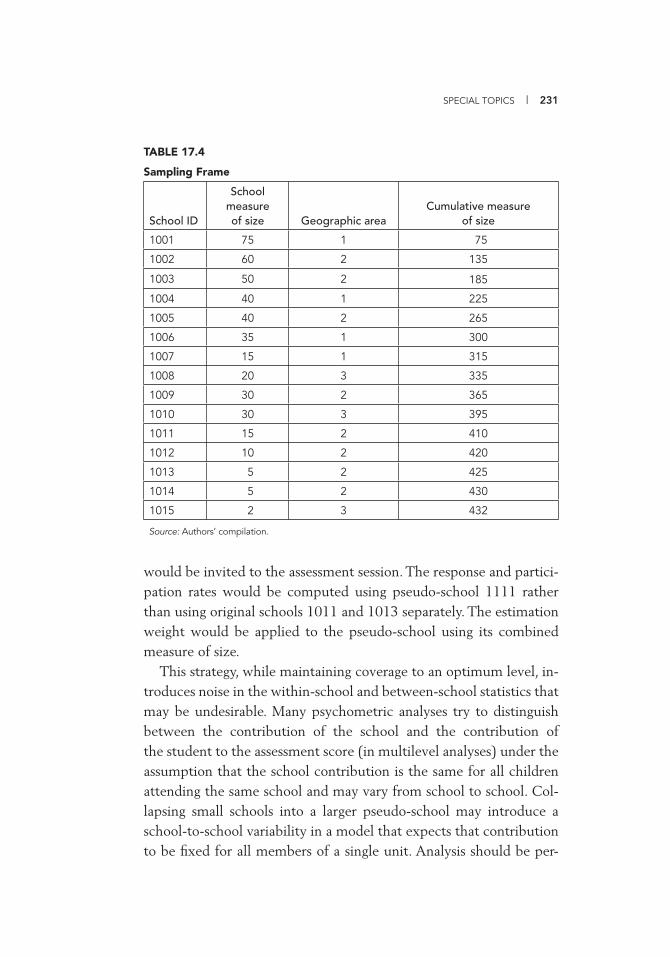
SPECIAL TOPICS | 231
would be invited to the assessment session. The response and partici-pation rates would be computed using pseudo-school 1111 rather than using original schools 1011 and 1013 separately. The estimation weight would be applied to the pseudo-school using its combined measure of size.
This strategy, while maintaining coverage to an optimum level, in-troduces noise in the within-school and between-school statistics that may be undesirable. Many psychometric analyses try to distinguish between the contribution of the school and the contribution of the student to the assessment score (in multilevel analyses) under the assumption that the school contribution is the same for all children attending the same school and may vary from school to school. Col-lapsing small schools into a larger pseudo-school may introduce a school-to-school variability in a model that expects that contribution to be fi xed for all members of a single unit. Analysis should be per-
TABLE 17.4
Sampling Frame
School ID
School measure of size Geographic area
Cumulative measure of size
1001 75 1 75
1002 60 2 135
1003 50 2 185
1004 40 1 225
1005 40 2 265
1006 35 1 300
1007 15 1 315
1008 20 3 335
1009 30 2 365
1010 30 3 395
1011 15 2 410
1012 10 2 420
1013 5 2 425
1014 5 2 430
1015 2 3 432
Source: Authors’ compilation.
232 | IMPLEMENTING A NATIONAL ASSESSMENT OF EDUCATIONAL ACHIEVEMENT
TABLE 17.5
Modifi ed Sampling Frame
Original schools Pseudo-schools
School ID
School measure of size
Geographicarea
Cumulative measure of
size
Pseudo-School
IDMeasureof size
Cumulative measure of size
1007 15 1 15 1007 15 15
1006 35 1 50 1006 35 65
1004 40 1 90 1004 40 90
1001 75 1 165 1001 75 165
1013 5 2 170 111120 185
1011 15 2 200 1111
1014 5 2 175 111215 200
1012 10 2 185 1112
1009 30 2 230 1009 30 230
1005 40 2 270 1005 40 270
1003 50 2 320 1003 50 320
1002 60 2 380 1002 60 380
1015 2 3 382 111522 402
1008 20 3 402 1115
1010 30 3 432 1010 30 432
Source: Authors’ compilation.
formed on the original school structure. This issue should be discussed by the survey managers, the survey statisticians, and the assessment analysts before the fi nal sampling options are selected.
STANDARDS FOR JUDGING THE ADEQUACY OF RESPONSE RATES
As noted previously, exclusions (such as dropping schools on remote islands or very small schools) are often limited to 5 percent of the desired target population before some form of warning is issued in the publication of results. After schools have participated or have been replaced and sample data have been collected, one can compute various response and participation rates. Although no universal rule
SPECIAL TOPICS | 233
defi nes what is “good” and what is “bad,” a certain standard has come to be recognized and is used in the most important international as-sessment studies.
The International Association for the Evaluation of Educational Achievement uses the following rule in many of its assessments:
• 85 percent (unweighted) of the original sample of schools (that is, before replacement)
and• 85 percent (unweighted) of the student sample from participating
schools (whether original sample or replacements) or• 75 percent (weighted) for the combined participation of schools and
students (that is, school participation multiplied by student partici-pation in participating schools)
Other rules could be devised; however, the lower the participa-tion of either schools or students, the greater the likelihood of bias.

235
STATISTICAL
NOTATION FOR
CALCULATING
ESTIMATES
IV.AANNEX
For qualitative and quantitative data, the estimate of the total number of units in the survey population is calculated by adding together the fi nal adjusted weights of the responding units:
∑=response
wiN ,
where i is the ith responding unit in the sample, wi is its fi nal adjusted weight, and this is summed over all responding units. For quantitative data, the estimate of a total value (such as total expenditure) is the product of the fi nal weight, wi, and the value, yi, for each responding unit, summed over all responding units:
response
yi .wiY = ∑ˆ
One can defi ne a dummy variable yi =
and the sum of the estimation weights (adjusted for nonresponse) over all responding units is then
( ) = wi =wi × 1wiwi yi =responseresponsesamplesample
N,ˆY == ∑∑∑∑ δi
which is an estimate of N, the size of the population.
= 0, for all nonresponding units,
= 1, for all responding units
⎩⎨⎧
δi
δi

237
A COMPARISON
OF SRS400
DATA AND
CENSUS DATA
IV.BANNEX
The comparison of SRS400 data and census data uses a fi le called …\BASE FILES\CENSUS.SAV. This fi le contains data for each of the 27,654 students in Sentz. It is an ideal fi le that would not exist in real life. All students have assessment results ex-cept those who are considered dropouts, as indicated in the response status fi eld. Thus, this fi le represents the results that would have been obtained by a perfect census. Using the CENSUS fi le and the Data – Aggregate menu, SPSS produced the results set out in table IV.B.1.
The estimates from the simple random sample and the census data will now be compared. Because this is a simple random sample, the unweighted estimates (right-most column in table IV.B.2) and the weighted estimates (middle column) of means and proportions
TABLE IV.B.1
Sentz Data Based on Census
DomainAverage age
(years)Average
math scoreProportion over 230
Complete population 14.00 216.83 0.25
Girls 13.99 211.99 0.16
Boys 14.01 221.69 0.35
Source: Authors’ compilation.
238 | IMPLEMENTING A NATIONAL ASSESSMENT OF EDUCATIONAL ACHIEVEMENT
are equal; this result is expected for means and proportions but not for totals. The population that was created for this book contains nearly equal proportions of boys and girls. The data were arranged so that boys scored higher at mathematics than girls, girls scored higher on other topics, and urban dwellers scored higher than rural dwellers. This sample happens to have a rather large proportion of urban boys, which would help explain the difference between the census data and sample estimates for the relatively high proportion of boys scor-ing over 230 in math.
Moreover, the “true” value is computed for the population as it was known, say, at the beginning of the school year. Therefore, there are records on the “census” fi le for which no information is available (namely, the dropouts) and for which all the scores are zero. These null values bring the average score down.
If the statistics about the population could be updated to represent the population at the time of the assessment (which could be done by removing the students with a mathematics score of zero from the census fi le), the comparisons would show that the survey results come much closer to the “true” values, well within the margins of error. This result is shown in table IV.B.3.
Such a luxury of information is hardly ever available to survey planners, managers, or analysts.
TABLE IV.B.2
Comparing Estimates Calculated with and without the Weights to Census Values, Beginning of School Year, Simple Random Sample
Variable of interest
“True” value (beginning of school
year)
Correct estimate,
using weights (± sampling
error)
Incorrect estimate,
ignoring weights (± sampling error)
N 27,654 27,437 ± 331 378
Average age (all) 14.00 13.98 ± 0.04 13.98 ± 0.04
Proportion ≥ 230 in math 0.25 0.25 ± 0.02 0.25 ± 0.02
Nboys 13,807 12,920 ± 722 178
Average age (boys) 14.01 14.05 ± 0.06 14.05 ± 0.06
Average math score (boys) 221.69 223.1 ± 1.0 223.1 ± 1.0
Source: Authors’ compilation.
A COMPARISON OF SRS400 DATA AND CENSUS DATA | 239
TABLE IV.B.3
Comparing Estimates Calculated with and without the Weights to Census Values, Time of Assessment, Simple Random Sample
Variable of interest
“True” value (time of
assessment)
Correct estimate,
using weights (± sampling
error)
Incorrect estimate,
ignoring weights (± sampling error)
N 27,368 27,437 ± 331 378
Average age (all) 14.00 13.98 ± 0.04 13.98 ± 0.04
Proportion ≥ 230 in math 0.26 0.25 ± 0.02 0.25 ± 0.02
Nboys 13,665 12,920 ± 722 178
Average age (boys) 14.01 14.05 ± 0.06 14.05 ± 0.06
Average math score (boys) 224.00 223.1 ± 1.0 223.1 ± 1.0
Source: Authors’ compilation.

241
ESTIMATING
SAMPLING
ERROR WITH
RESAMPLING
TECHNIQUES
IV.CANNEX
In most complex designs (designs other than sim-ple random sampling or systematic random sampling), the exact vari-ance formula is diffi cult to derive, let alone program. In many in-stances, the practical implementation of the sampling design has created situations that render the use of the exact variance formula impossible. Approximate—yet sound and reliable—methods of esti-mating the sampling variance are needed. One class of such methods is called replicated sampling, or resampling. Random groups, balanced repeated replication, jackknifi ng, and bootstrapping are among the bet-ter known resampling variance estimation methods. A particularly clever variance approximation method was derived in the late 1950s (Keyfi tz 1957) and later adapted to become jackknife estimation. Jackknife estimation is often used in large-scale international educa-tional assessment surveys.
USING REPLICATED SAMPLING
In replicated sampling, the survey statistician selects k independent samples of size n/k, rather than one sample of size n. For each of these
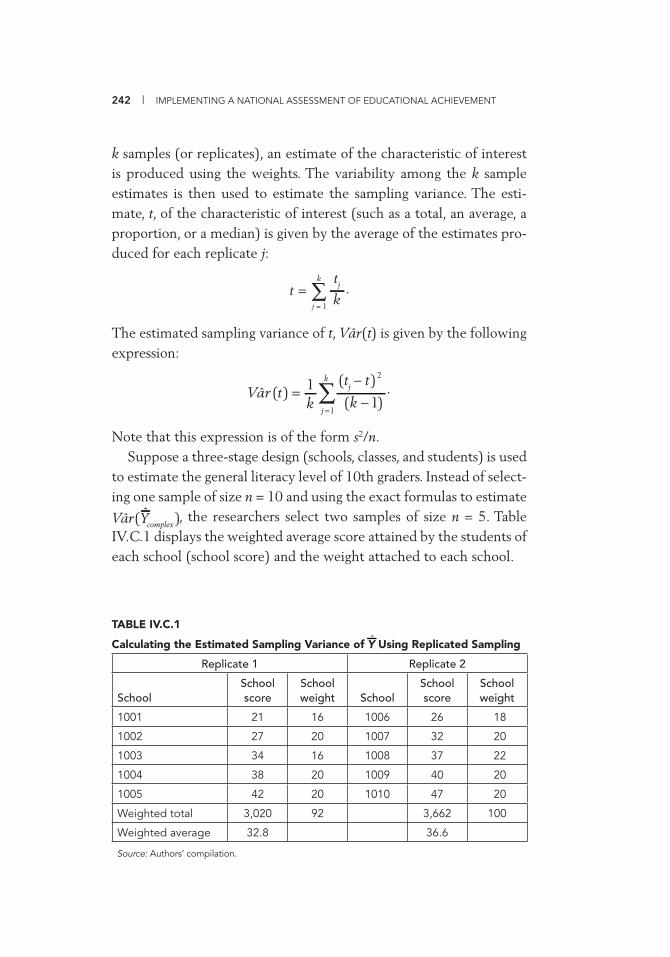
242 | IMPLEMENTING A NATIONAL ASSESSMENT OF EDUCATIONAL ACHIEVEMENT
k samples (or replicates), an estimate of the characteristic of interest is produced using the weights. The variability among the k sample estimates is then used to estimate the sampling variance. The esti-mate, t, of the characteristic of interest (such as a total, an average, a proportion, or a median) is given by the average of the estimates pro-duced for each replicate j:
∑=k
j = 1k
tjt .
The estimated sampling variance of t, Vâr (t) is given by the following expression:
∑=
−−
=k
jk
ttj
ktraV
1
2
)1(
)(1)(ˆ .
Note that this expression is of the form s2/n.Suppose a three-stage design (schools, classes, and students) is used
to estimate the general literacy level of 10th graders. Instead of select-ing one sample of size n = 10 and using the exact formulas to estimate
complexYVâr( ), the researchers select two samples of size n = 5. Table IV.C.1 displays the weighted average score attained by the students of each school (school score) and the weight attached to each school.
TABLE IV.C.1
Calculating the Estimated Sampling Variance of Using Replicated Sampling
Replicate 1 Replicate 2
SchoolSchool score
School weight School
School score
School weight
1001 21 16 1006 26 18
1002 27 20 1007 32 20
1003 34 16 1008 37 22
1004 38 20 1009 40 20
1005 42 20 1010 47 20
Weighted total 3,020 92 3,662 100
Weighted average 32.8 36.6
Source: Authors’ compilation.
Y
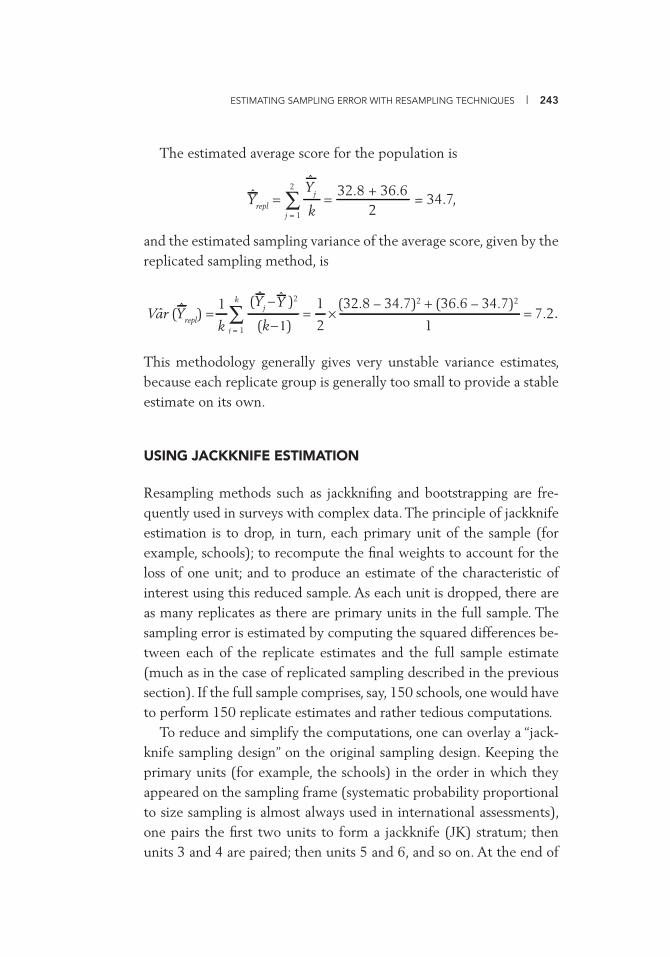
ESTIMATING SAMPLING ERROR WITH RESAMPLING TECHNIQUES | 243
The estimated average score for the population is
= 34.7,2
32.8 + 36.6ˆ
2
== ∑j = 1 k
YjYrepl
and the estimated sampling variance of the average score, given by the replicated sampling method, is
1
(32.8 – 34.7)2 + (36.6 – 34.7)2)2ˆˆ(1ˆ(ˆ = 7.22
1×=
−∑
k
j = 1 (k−1)
YYj
kYrepl) =Var .
This methodology generally gives very unstable variance estimates, because each replicate group is generally too small to provide a stable estimate on its own.
USING JACKKNIFE ESTIMATION
Resampling methods such as jackknifi ng and bootstrapping are fre-quently used in surveys with complex data. The principle of jackknife estimation is to drop, in turn, each primary unit of the sample (for example, schools); to recompute the fi nal weights to account for the loss of one unit; and to produce an estimate of the characteristic of interest using this reduced sample. As each unit is dropped, there are as many replicates as there are primary units in the full sample. The sampling error is estimated by computing the squared differences be-tween each of the replicate estimates and the full sample estimate (much as in the case of replicated sampling described in the previous section). If the full sample comprises, say, 150 schools, one would have to perform 150 replicate estimates and rather tedious computations.
To reduce and simplify the computations, one can overlay a “jack-knife sampling design” on the original sampling design. Keeping the primary units (for example, the schools) in the order in which they appeared on the sampling frame (systematic probability proportional to size sampling is almost always used in international assessments), one pairs the fi rst two units to form a jackknife (JK) stratum; then units 3 and 4 are paired; then units 5 and 6, and so on. At the end of
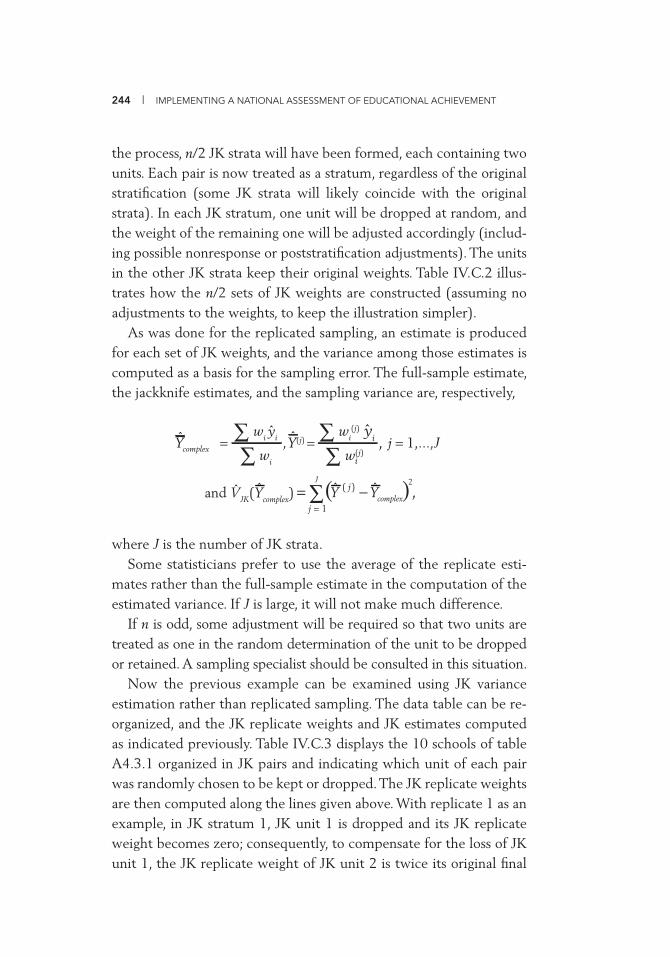
244 | IMPLEMENTING A NATIONAL ASSESSMENT OF EDUCATIONAL ACHIEVEMENT
the process, n/2 JK strata will have been formed, each containing two units. Each pair is now treated as a stratum, regardless of the original stratifi cation (some JK strata will likely coincide with the original strata). In each JK stratum, one unit will be dropped at random, and the weight of the remaining one will be adjusted accordingly (includ-ing possible nonresponse or poststratifi cation adjustments). The units in the other JK strata keep their original weights. Table IV.C.2 illus-trates how the n/2 sets of JK weights are constructed (assuming no adjustments to the weights, to keep the illustration simpler).
As was done for the replicated sampling, an estimate is produced for each set of JK weights, and the variance among those estimates is computed as a basis for the sampling error. The full-sample estimate, the jackknife estimates, and the sampling variance are, respectively,
∑∑=complex wi
yiwiYˆˆ , j = 1,...,J
w(j)
yiwi(j)
i
,ˆ
Y(j) =ˆ
∑∑
( )∑ −=J
j = 1complex
j YY2)( ˆˆand VJK(Ycomplex)
ˆˆ ,
where J is the number of JK strata.Some statisticians prefer to use the average of the replicate esti-
mates rather than the full-sample estimate in the computation of the estimated variance. If J is large, it will not make much difference.
If n is odd, some adjustment will be required so that two units are treated as one in the random determination of the unit to be dropped or retained. A sampling specialist should be consulted in this situation.
Now the previous example can be examined using JK variance estimation rather than replicated sampling. The data table can be re-organized, and the JK replicate weights and JK estimates computed as indicated previously. Table IV.C.3 displays the 10 schools of table A4.3.1 organized in JK pairs and indicating which unit of each pair was randomly chosen to be kept or dropped. The JK replicate weights are then computed along the lines given above. With replicate 1 as an example, in JK stratum 1, JK unit 1 is dropped and its JK replicate weight becomes zero; consequently, to compensate for the loss of JK unit 1, the JK replicate weight of JK unit 2 is twice its original fi nal
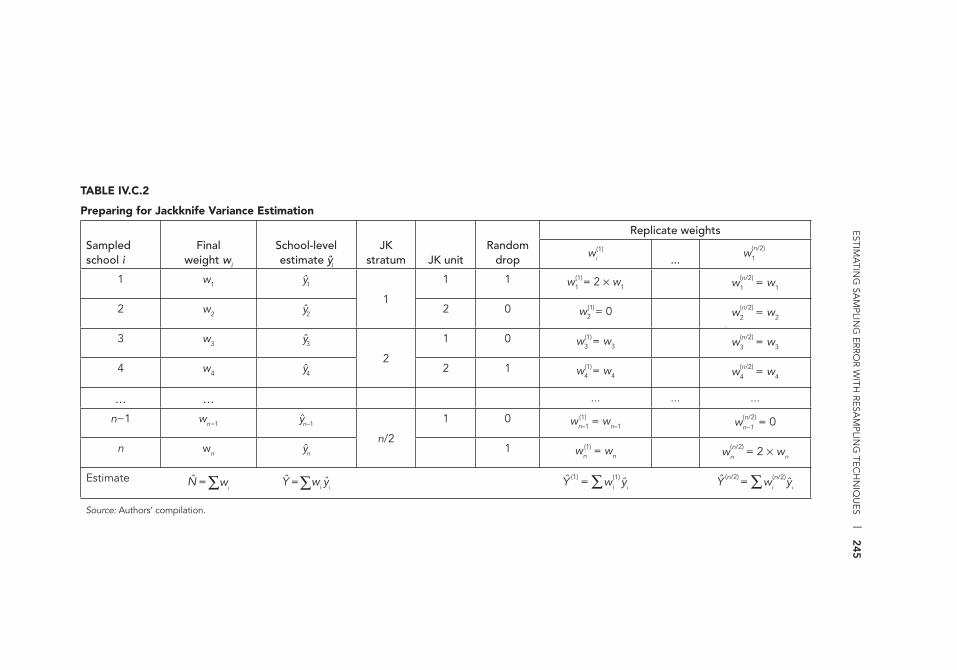
ESTIMA
TING
SAM
PLING
ERROR W
ITH RESA
MPLIN
G TEC
HN
IQU
ES |
245
TABLE IV.C.2
Preparing for Jackknife Variance Estimation
Sampled school i
Finalweight wi
School-level estimate yi
JK stratum JK unit
Random drop
Replicate weights
wi(1)
...w1
(n/2)
1 w1 y1
1
1 1 w1 = 2 × w1(1) = w1w1
(n/2)
2 w2 y2 2 0 w2 = 0(1) = w2w2
(n/2)
3 w3 y3
2
1 0 w3 = w3(1) = w3w3
(n/2)
4 w4 y4 2 1 w4 = w4(1) = w4w4
(n/2)
... ... ... ... ...
n−1 wn−1 yn–1
n/2
1 0 wn–1 = wn–1(1) = 0wn–1
(n/2)
n wn yn 1 wn = wn(1) = 2 × wnwn
(n/2)
Estimate ∑= wiN ∑= yiwiY ˆˆ ∑= yiwiY ˆˆ (1) (1) ∑= yiwiY ˆˆ (n/2) (n/2)
Source: Authors’ compilation.
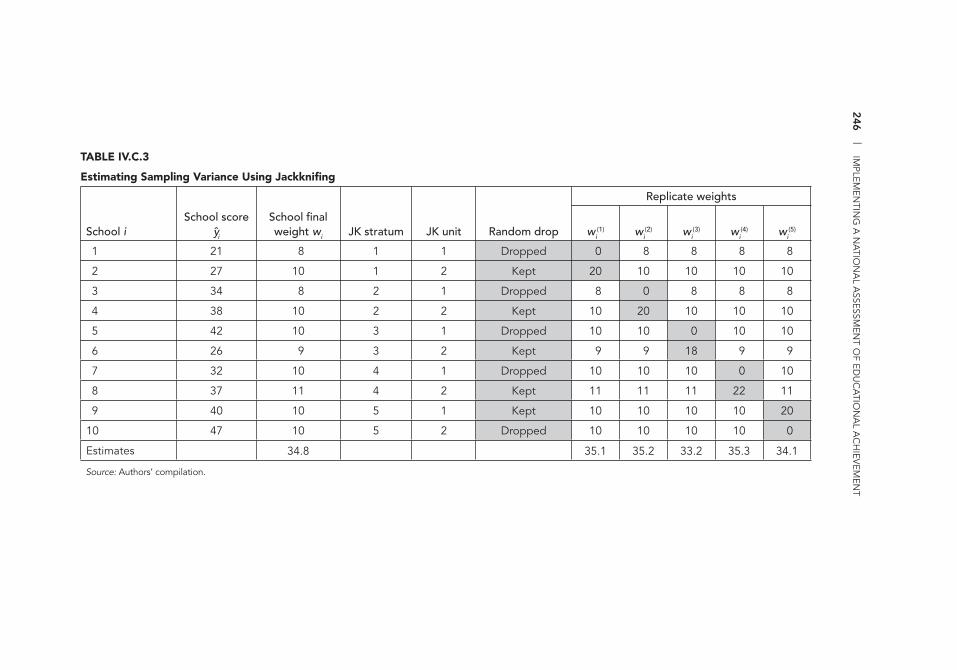
246
| IM
PLEMEN
TING
A N
ATIO
NA
L ASSESSM
ENT O
F EDU
CA
TION
AL A
CH
IEVEM
ENT
TABLE IV.C.3
Estimating Sampling Variance Using Jackknifi ng
School iSchool score
yi
School fi nal weight wi JK stratum JK unit Random drop
Replicate weights
wi(1) wi
(2) wi(3) wi
(4) wi(5)
1 21 8 1 1 Dropped 0 8 8 8 8
2 27 10 1 2 Kept 20 10 10 10 10
3 34 8 2 1 Dropped 8 0 8 8 8
4 38 10 2 2 Kept 10 20 10 10 10
5 42 10 3 1 Dropped 10 10 0 10 10
6 26 9 3 2 Kept 9 9 18 9 9
7 32 10 4 1 Dropped 10 10 10 0 10
8 37 11 4 2 Kept 11 11 11 22 11
9 40 10 5 1 Kept 10 10 10 10 20
10 47 10 5 2 Dropped 10 10 10 10 0
Estimates 34.8 35.1 35.2 33.2 35.3 34.1
Source: Authors’ compilation.
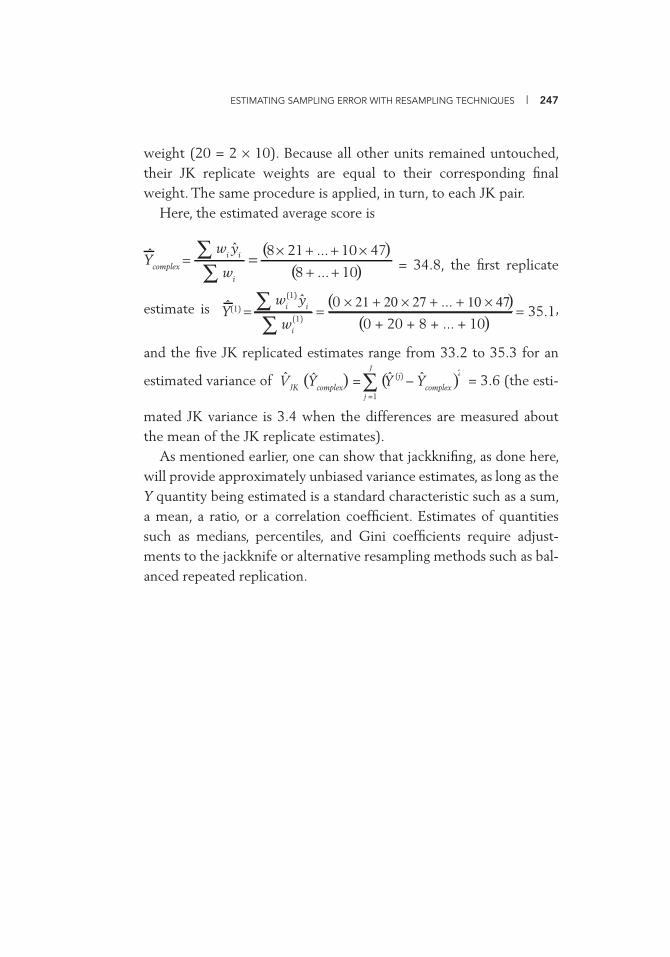
ESTIMATING SAMPLING ERROR WITH RESAMPLING TECHNIQUES | 247
weight (20 = 2 × 10). Because all other units remained untouched, their JK replicate weights are equal to their corresponding fi nal weight. The same procedure is applied, in turn, to each JK pair.
Here, the estimated average score is
( )( )10...8
4710...218ˆ
++×++×==
∑∑
wi
yiwiYcomplex = 34.8, the fi rst replicate
estimate is 35.1( )0 + 20 + 8 + ... + 10
( )0 × 21 + 20 × 27 + ... + 10 × 47ˆˆ(1)
(1)
===∑
∑wi
yiwiY(1) ,
and the fi ve JK replicated estimates range from 33.2 to 35.3 for an
estimated variance of ( )∑ −J
j =1
YcomplexYYcomplex) =VJK
2(j) ˆˆˆ(ˆ = 3.6 (the esti-
mated JK variance is 3.4 when the differences are measured about the mean of the JK replicate estimates).
As mentioned earlier, one can show that jackknifi ng, as done here, will provide approximately unbiased variance estimates, as long as the Y quantity being estimated is a standard characteristic such as a sum, a mean, a ratio, or a correlation coeffi cient. Estimates of quantities such as medians, percentiles, and Gini coeffi cients require adjust-ments to the jackknife or alternative resampling methods such as bal-anced repeated replication.


249
CREATING
JACKKNIFE ZONES
AND REPLICATES
AND COMPUTING
JACKKNIFE WEIGHTS
IV.DANNEX
WesVar is used with a wide range of complex sample designs where simple random sampling would produce biased estimates. You must have a data fi le with replicate weights before you can create a new workbook. Start by transferring data from an SPSS fi le to a new WesVar fi le. Your SPSS fi le should include the variables you require to conduct analyses in WesVar. You must have a data fi le with replicate weights before you can create a new workbook. The program can calculate these weights.
The following set of instructions guides you through the creation of jackknife weights for the two-stage survey design from the response fi le. Note that SPSS has been used to create the important sampling information that WesVar uses to create the replicate weights for the analysis of the national assessment data.
1. Read the SPSS response fi le containing the weights by follow-ing these commands:
File – Open – Data – Look in
…\MYSAMPLSOL\RESP2STGFINALWT.SAV
Open

250 | IMPLEMENTING A NATIONAL ASSESSMENT OF EDUCATIONAL ACHIEVEMENT
2. Because the replicate weights are created for schools, the list of participating schools can be derived from the response fi le. All that is required is to keep one record for each participating school.
Open Data – Identify Duplicate Cases, and then move SCHOOLID to Defi ne matching cases by. In Variables to Create, click First case in each group is primary, and then click OK.
Then, open Data – Select Cases and click If Condition is satisfi ed. Click If... and move Indicator of each fi rst matching case (PrimaryFirst) to the right-hand-side box (blue arrow). Type =1. Then click Continue. Under Output, click Copy Selected to New Dataset and type in a name, for example, RespondingSchools, and click OK.
3. Bring this RespondingSchools to the viewing screen. Click the Variable View tab at the bottom of the screen, and delete all variables but SCHOOLID. Return to the Data View; only one variable will be displayed (SCHOOLID), starting at 1101 and ending with 5603 as the 120th and last entry.
Now assign the JK zones and JK replicate numbers to the schools. Because 120 schools are participating, there will be 60 JK zones.
Select the commands Transform – Compute Variable and type JKZONE under Target Variable. Then type RND ($Casenum/2) under Numeric Expression and click OK.
Next, select Transform – Compute Variable again, and type RANDOMPICK under Target Variable and rv.Uniform(0,1) under Numeric Expression. Click OK.
At this point, you should see 120 schools, in 60 pairs num-bered from 1 to 60, each school also bearing a random number between 0 and 1. If the random numbers are displayed as 0s and 1s, increase the number of decimal places from the Vari-able View tab. Now you can create the JK replicates.
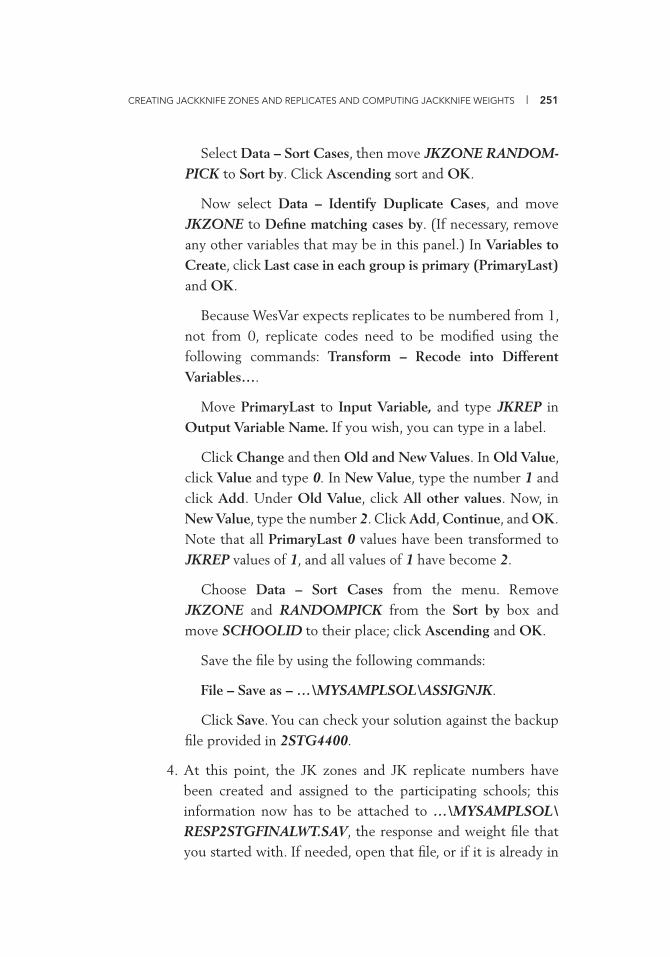
CREATING JACKKNIFE ZONES AND REPLICATES AND COMPUTING JACKKNIFE WEIGHTS | 251
Select Data – Sort Cases, then move JKZONE RANDOM-
PICK to Sort by. Click Ascending sort and OK.
Now select Data – Identify Duplicate Cases, and move JKZONE to Defi ne matching cases by. (If necessary, remove any other variables that may be in this panel.) In Variables to
Create, click Last case in each group is primary (PrimaryLast)
and OK.
Because WesVar expects replicates to be numbered from 1, not from 0, replicate codes need to be modifi ed using the following commands: Transform – Recode into Different
Variables….
Move PrimaryLast to Input Variable, and type JKREP in Output Variable Name. If you wish, you can type in a label.
Click Change and then Old and New Values. In Old Value, click Value and type 0. In New Value, type the number 1 and click Add. Under Old Value, click All other values. Now, in New Value, type the number 2. Click Add, Continue, and OK. Note that all PrimaryLast 0 values have been transformed to JKREP values of 1, and all values of 1 have become 2.
Choose Data – Sort Cases from the menu. Remove JKZONE and RANDOMPICK from the Sort by box and move SCHOOLID to their place; click Ascending and OK.
Save the fi le by using the following commands:
File – Save as – …\MYSAMPLSOL\ASSIGNJK.
Click Save. You can check your solution against the backup fi le provided in 2STG4400.
4. At this point, the JK zones and JK replicate numbers have been created and assigned to the participating schools; this information now has to be attached to …\MYSAMPLSOL\RESP2STGFINALWT.SAV, the response and weight fi le that you started with. If needed, open that fi le, or if it is already in
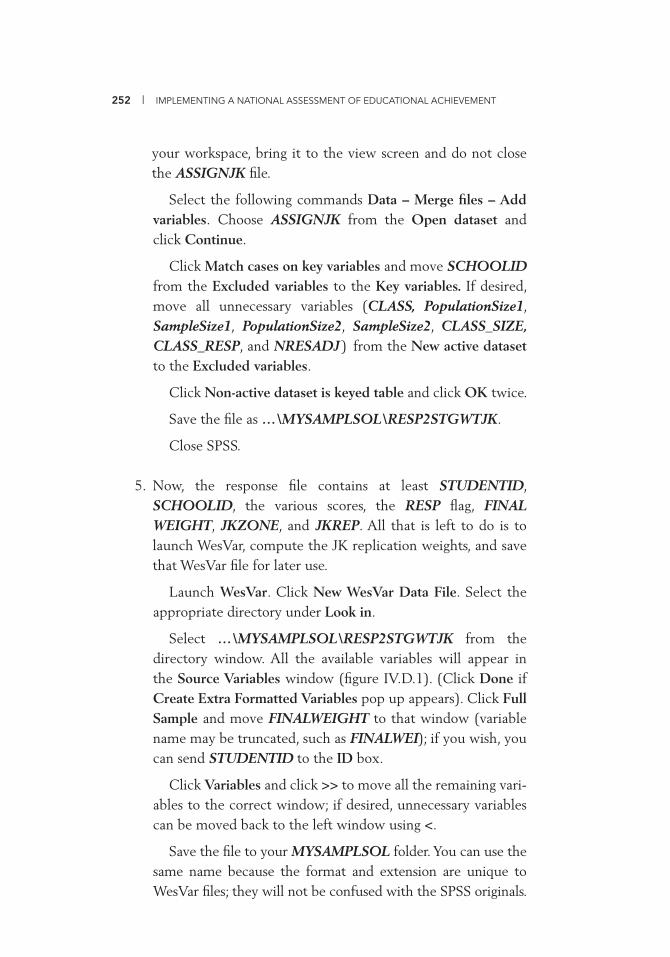
252 | IMPLEMENTING A NATIONAL ASSESSMENT OF EDUCATIONAL ACHIEVEMENT
your workspace, bring it to the view screen and do not close the ASSIGNJK fi le.
Select the following commands Data – Merge fi les – Add variables. Choose ASSIGNJK from the Open dataset and click Continue.
Click Match cases on key variables and move SCHOOLID from the Excluded variables to the Key variables. If desired, move all unnecessary variables (CLASS, PopulationSize1, SampleSize1, PopulationSize2, SampleSize2, CLASS_SIZE, CLASS_RESP, and NRESADJ ) from the New active dataset to the Excluded variables.
Click Non-active dataset is keyed table and click OK twice.
Save the fi le as …\MYSAMPLSOL\RESP2STGWTJK.
Close SPSS.
5. Now, the response fi le contains at least STUDENTID, SCHOOLID, the various scores, the RESP fl ag, FINAL WEIGHT, JKZONE, and JKREP. All that is left to do is to launch WesVar, compute the JK replication weights, and save that WesVar fi le for later use.
Launch WesVar. Click New WesVar Data File. Select the appropriate directory under Look in.
Select …\MYSAMPLSOL\RESP2STGWTJK from the directory window. All the available variables will appear in the Source Variables window (fi gure IV.D.1). (Click Done if Create Extra Formatted Variables pop up appears). Click Full Sample and move FINALWEIGHT to that window (variable name may be truncated, such as FINALWEI); if you wish, you can send STUDENTID to the ID box.
Click Variables and click >> to move all the remaining vari-ables to the correct window; if desired, unnecessary variables can be moved back to the left window using <.
Save the fi le to your MYSAMPLSOL folder. You can use the same name because the format and extension are unique to WesVar fi les; they will not be confused with the SPSS originals.
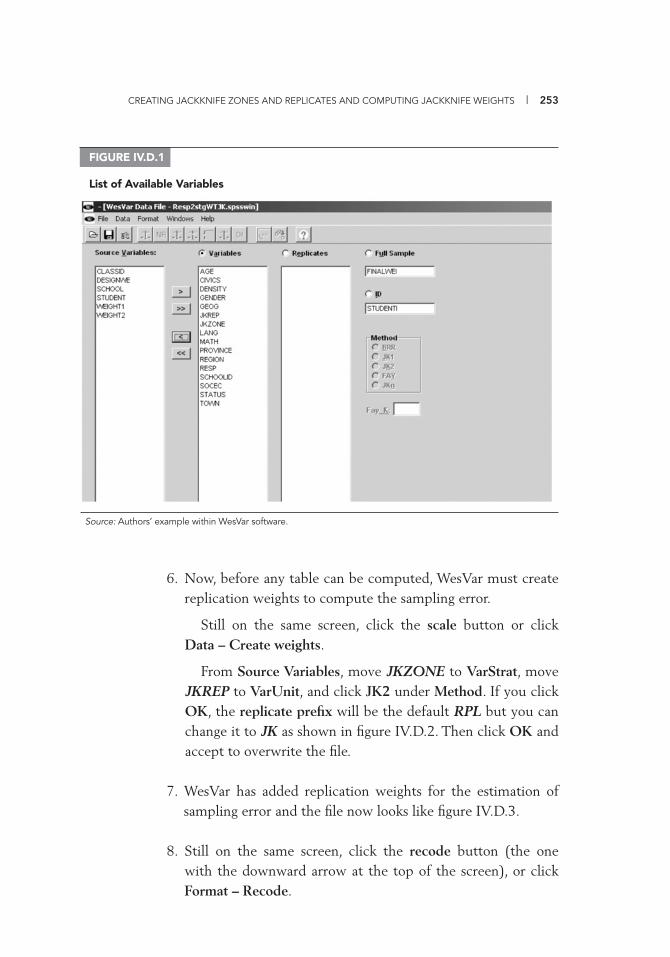
CREATING JACKKNIFE ZONES AND REPLICATES AND COMPUTING JACKKNIFE WEIGHTS | 253
6. Now, before any table can be computed, WesVar must create replication weights to compute the sampling error.
Still on the same screen, click the scale button or click Data – Create weights.
From Source Variables, move JKZONE to VarStrat, move JKREP to VarUnit, and click JK2 under Method. If you click OK, the replicate prefi x will be the default RPL but you can change it to JK as shown in fi gure IV.D.2. Then click OK and accept to overwrite the fi le.
7. WesVar has added replication weights for the estimation of sampling error and the fi le now looks like fi gure IV.D.3.
8. Still on the same screen, click the recode button (the one with the downward arrow at the top of the screen), or click Format – Recode.
FIGURE IV.D.1
List of Available Variables
Source: Authors’ example within WesVar software.
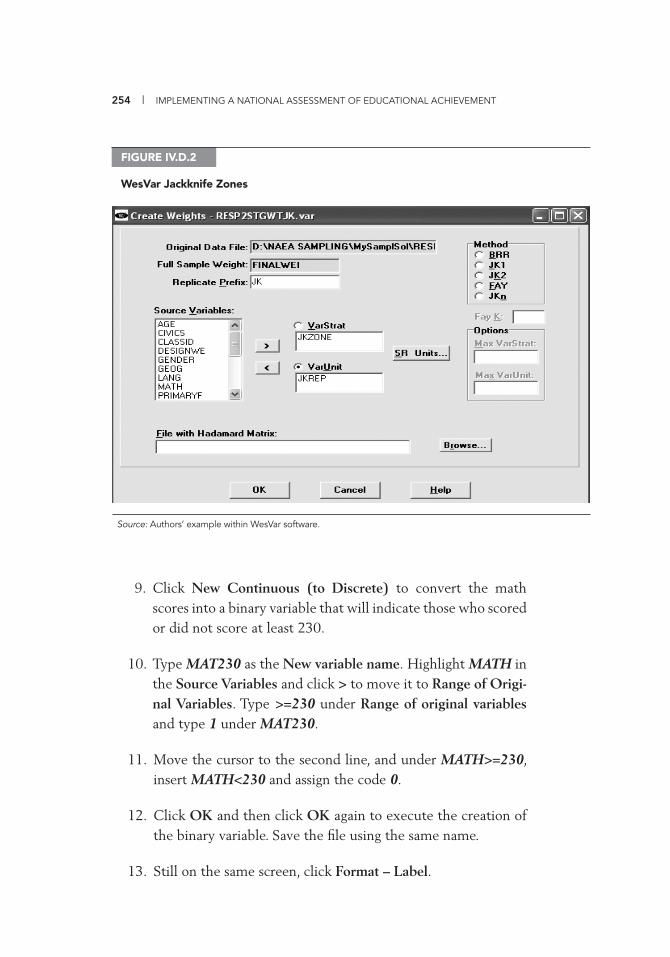
254 | IMPLEMENTING A NATIONAL ASSESSMENT OF EDUCATIONAL ACHIEVEMENT
9. Click New Continuous (to Discrete) to convert the math scores into a binary variable that will indicate those who scored or did not score at least 230.
10. Type MAT230 as the New variable name. Highlight MATH in the Source Variables and click > to move it to Range of Origi-nal Variables. Type >=230 under Range of original variables and type 1 under MAT230.
11. Move the cursor to the second line, and under MATH>=230, insert MATH<230 and assign the code 0.
12. Click OK and then click OK again to execute the creation of the binary variable. Save the fi le using the same name.
13. Still on the same screen, click Format – Label.
FIGURE IV.D.2
WesVar Jackknife Zones
Source: Authors’ example within WesVar software.
CREATING JACKKNIFE ZONES AND REPLICATES AND COMPUTING JACKKNIFE WEIGHTS | 255
FIGURE IV.D.3
WesVar Replication Weights
Source: Authors’ example within WesVar software.
14. Highlight GENDER from the Source Variables. Type Girl as the label for the value 0, and type Boy as the label for the value 1; type Total as the label for the value Marginal (fi gure IV.D.4).
15. Highlight MAT230 from the Source Variables. Type Math score below 230 as the label for the value 0 and type Math score at least 230 as the label for the value 1; type Total as the label for the value Marginal.
16. Highlight RESP from the Source Variables. Type Nonresponse as the label for the value 0, and type Participant as the label for the value 1; type Total as the label for the value Marginal.
17. Click OK and save (overwrite) the fi le under …\MYSAMPLSOL\.
18. Close this window.
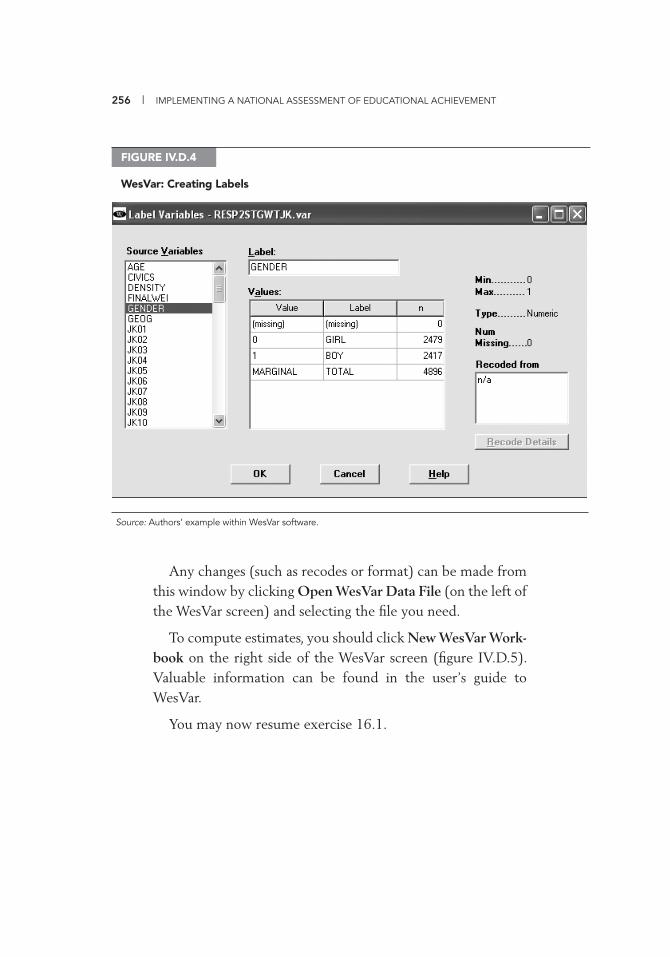
256 | IMPLEMENTING A NATIONAL ASSESSMENT OF EDUCATIONAL ACHIEVEMENT
Any changes (such as recodes or format) can be made from this window by clicking Open WesVar Data File (on the left of the WesVar screen) and selecting the fi le you need.
To compute estimates, you should click New WesVar Work-book on the right side of the WesVar screen (fi gure IV.D.5). Valuable information can be found in the user’s guide to WesVar.
You may now resume exercise 16.1.
FIGURE IV.D.4
WesVar: Creating Labels
Source: Authors’ example within WesVar software.
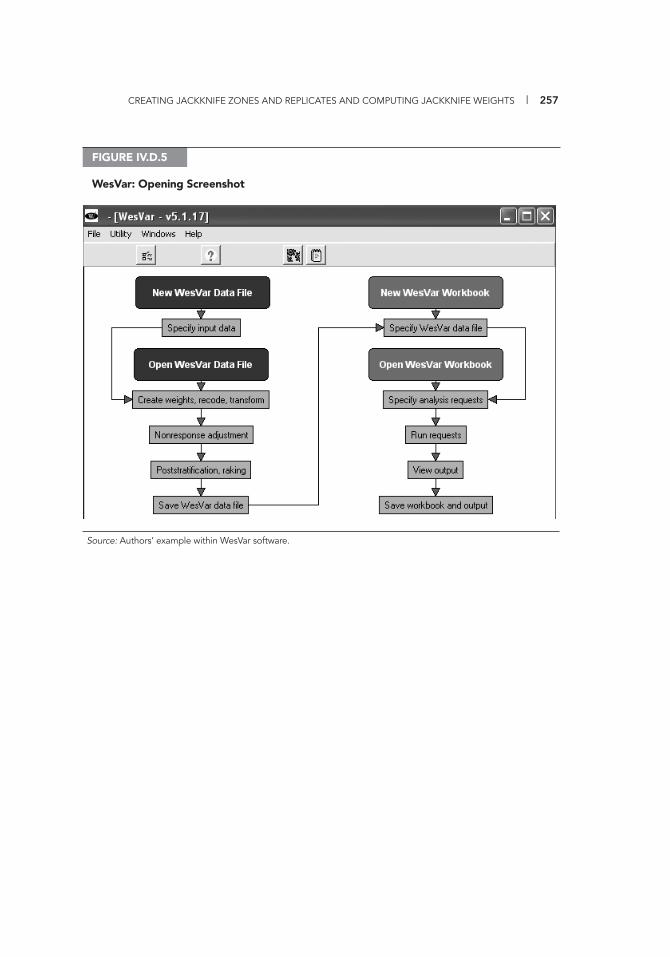
CREATING JACKKNIFE ZONES AND REPLICATES AND COMPUTING JACKKNIFE WEIGHTS | 257
FIGURE IV.D.5
WesVar: Opening Screenshot
Source: Authors’ example within WesVar software.


259
REFERENCES
Anderson, P., and G. Morgan. 2008. Developing Tests and Questionnaires for a National Assessment of Educational Achievement. Washington, DC: World Bank.
Cartwright, F., and G. Shiel. Forthcoming. Analyzing Data from a National Assessment of Educational Achievement. Washington, DC: World Bank.
Cochran, W. G. 1977. Sampling Techniques. 3rd ed. New York: Wiley.
Greaney, V., and T. Kellaghan. 2008. Assessing National Achievement Levels in Education. Washington, DC: World Bank.
Howie, S. J. 2004. “Project Plan.” Unpublished document, Centre for Evalua-tion and Assessment, Pretoria.
Ilon, L. 1996. “Considerations for Costing National Assessments.” In National Assessment: Testing the System, ed. P. Murphy, V. Greaney, M. E. Lockheed, and C. Rojas, 69–88. Washington, DC: World Bank.
Kellaghan, T., V. Greaney, and T. S. Murray. 2009. Using the Results of a National Assessment of Educational Achievement. Washington, DC: World Bank.
Keyfi tz, N. 1957. “Estimates of Sampling Variance Where Two Units Are Selected from Each Stratum.” Journal of the American Statistical Association 52 (280): 503–12.
Kish, L. 1965. Survey Sampling. New York: Wiley.
260 | REFERENCES
Lehtonen, R., and E. J. Pahkinen. 1995. Practical Methods for the Design and Analysis of Complex Surveys. New York: Wiley.
Lohr, S. L. 1999. Sampling: Design and Analysis. Pacifi c Grove, CA: Duxbury Press.
TIMSS (Trends in International Mathematics and Science Study). 1998a. Manual for Entering the TIMSS-R Data (Doc. Ref. No. 98-0028). Chestnut Hill, MA: International Study Center, Boston College.
———. 1998b. Manual for International Quality Control Monitors (Doc. Ref. No. 98-0023). Chestnut Hill, MA: International Study Center, Boston College.
———. 1998c. Sampling Design and Implementation for TIMSS 1999 Coun-tries: Survey Operational Manual (Doc. Ref. No. 98-0026). Chestnut Hill, MA: International Study Center, Boston College.
UNESCO (United Nations Educational, Scientifi c, and Cultural Organiza-tion). 1997. International Standard Classifi cation of Education ISCED. Paris: UNESCO.


E C O - A U D I TEnvironmental Benefits Statement
The World Bank is committed to preserving endangered forests and natural resources. The Office of the Publisher has chosen to print Implementing a National Assessment of Educational Achievement on recycled paper with 50 percent postconsumer fiber in accordance with the recommended stan-dards for paper usage set by the Green Press Initiative, a nonprofit program supporting publishers in using fiber that is not sourced from endangered forests. For more informa-tion, visit www.greenpressinitiative.org.
Saved:• 11 trees• 5 million British
thermal units of total energy
• 1,183 pounds of net greenhouse gases
• 5,331 gallons of waste water
• 338 pounds of solid waste


National Assessments of Educational AchievementEffective assessment of the performance of educational systems is a key component in
developing policies to optimize the development of human capital around the world.
The fi ve books in the National Assessments of Educational Achievement series introduce
key concepts in national assessments of student achievement levels, from policy issues
to address when designing and carrying out assessments through test development,
questionnaire design, sampling, organizing and carrying out data collection, data cleaning,
statistical analysis, report writing, and using results to improve educational quality.
The successful implementation of a national assessment of educational achievement is a complex task that requires considerable knowledge, skill, and resources. The payoff from well-implemented national assessments can be substantial in terms of the quality of the information provided on levels of student achievement and on school and nonschool factors that might help raise those achievement levels. Conversely, the cost of a poorly implement-ed national assessment may be inaccurate information about student achievement levels and related factors. High-quality implementation can increase the confi dence of policy makers and other stakeholders in the validity of assessment fi ndings. It also can increase the likelihood that they will use the results of the national assessment to develop sound plans and programs designed to enhance educational quality and student learning outcomes.
Implementing a National Assessment of Educational Achievement, the third volume in a fi ve-part series, focuses on the practical tasks involved in implementing a large-scale national assessment. This manual includes detailed step-by-step instructions on logistics, sampling, data preparation and management, and analysis. Readers are guided through the various sampling steps by working on a set of concrete tasks presented in the text and using data fi les in the accompanying CD.
This volume is intended primarily for the teams in developing and emerging economies who are responsible for conducting a national assessment.
SKU 18589
ISBN 978-0-8213-8589-0