Embed Size (px)
Citation preview
Importance of spectral line shapes in astrophysics
This article has been downloaded from IOPscience. Please scroll down to see the full text article.
1971 J. Phys. B: At. Mol. Phys. 4 279
(http://iopscience.iop.org/0022-3700/4/3/001)
Download details:
IP Address: 128.83.63.20
The article was downloaded on 17/09/2013 at 21:45
Please note that terms and conditions apply.
View the table of contents for this issue, or go to the journal homepage for more
Home Search Collections Journals About Contact us My IOPscience
J. Phys. B : Atom. ilIolec. Phys., 1971, Vol. 4. Printed in Great Britain
Importance of spectral line shapes in astrophysicst
B. E. J. PAGEL Royal Greenwich Observatory, Herstmonceux, Sussex M S . yeceived 13th October 1970
Abstract. The following applications of spectral line broadening theory to astrophysics are briefly reviewed : (i) understanding qualitative effects visible on spectrograms ; (ii) quantitative understanding of hydrogen-line profiles for the determination of stellar atmospheric parameters ; (iii) effects of line broad- ening on the determination of stellar chemical composition.
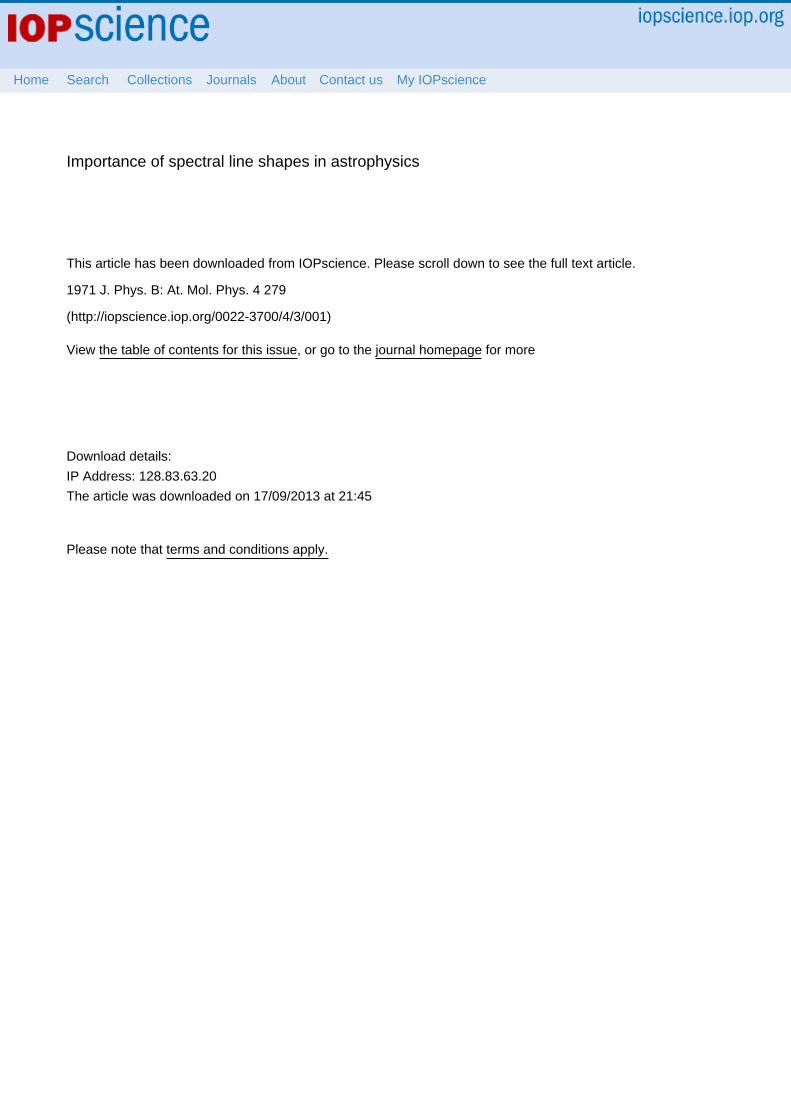
1. Introduction A stellar atmosphere is typically a plasma consisting mainly of hydrogen atoms
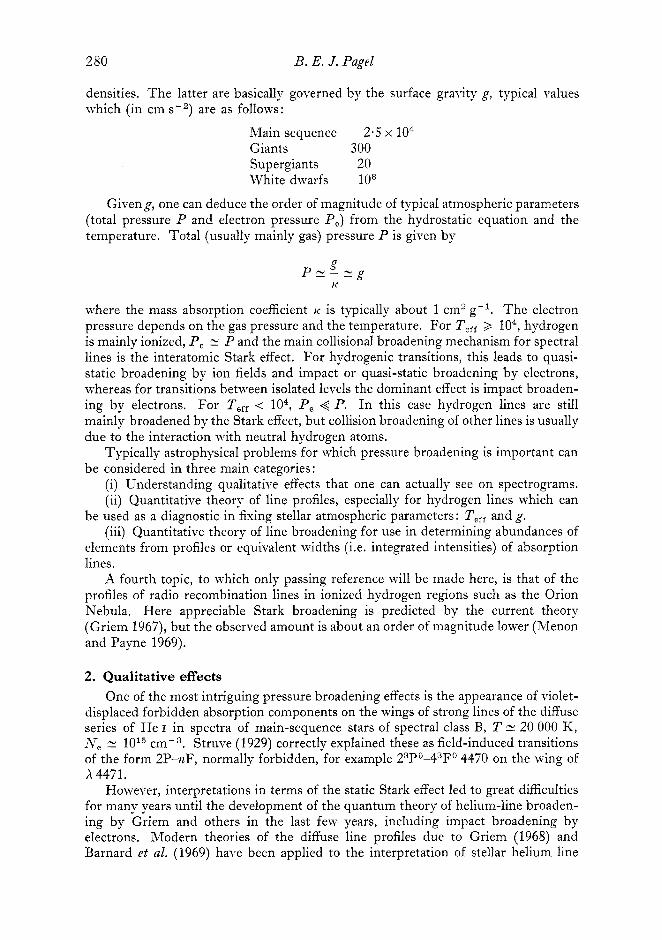
or ions with an admixture of about 10% helium atoms and traces of other elements. The relevant physical parameters are most conveniently expressed in terms of the Hertzsprung-Russell diagram in which luminosity is plotted against effective surface temperature (figure 1). Most stars lie near the lower part of the main sequence, but there are also giants, white dwarfs, etc., which have very different atmospheric
Spectra l type BO A0 FO GO KO MO I I I I I I I I I I
4- Supergiants
3 - Red giants
m s band 2 -
Z e r o -ag e_, m s
I -
- 7 m
- 3 0- 1 - - cn -
- 2
- 3 - -
- 4 - I I I I I I I I I I
l g Teff 4 5 4 0 3 5
re 1. Schematic Hertzsprung-Russell diagram: m.s., main
a talk given at the IPPS Spectroscopy Group meeting on in Gases and Plasmas held a t Imperial College on 6th Feb
279
4- Supergiants
3 - Red giants
m s band 2 -
Z e r o -ag e_, m s
I -
- 7 m
- 3 0- 1 - - cn -
- 2
- 3 - -
- 4 - I I I I I I I I I I
l g Teff 4 5 4 0 3 5
Figure 1. Schematic Hertzsprung-Russell diagram: m.s., main sequence.
t Based on a talk given at the IPPS Spectroscopy Group meeting on The Broadening of Spectral Lines in Gases and Plasmas held a t Imperial College on 6th February 1970.
I B 279
sequence.
The Broadening of ruary 1970.
Figu
t Based on Spectral Lines
IB
280 B. E. J. Pagel
densities. The latter are basically governed by the surface gravity g , typical values which (in cm s - ~ ) are as follows:
Main sequence 2.5 x lo4 Giants 300
White dwarfs lo8 Supergiants 20
Giveng, one can deduce the order of magnitude of typical atmospheric parameters (total pressure P and electron pressure P,) from the hydrostatic equation and the temperature. Total (usually mainly gas) pressure P is given by
where the mass absorption coefficient K is typically about 1 cm2 8-l. The electron pressure depends on the gas pressure and the temperature. For Teff 2 lo4, hydrogen is mainly ionized, P, N P and the main collisional broadening mechanism for spectral lines is the interatomic Stark effect. For hydrogenic transitions, this leads to quasi- static broadening by ion fields and impact or quasi-static broadening by electrons, whereas for transitions between isolated levels the dominant effect is impact broaden- ing by electrons. For Teff < lo4, P, < P. I n this case hydrogen lines are still mainly broadened by the Stark effect, but collision broadening of other lines is usually due to the interaction with neutral hydrogen atoms.
Typically astrophysical problems for which pressure broadening is important can be considered in three main categories:
(i) Understanding qualitative effects that one can actually see on spectrograms. (ii) Quantitative theory of line profiles, especially for hydrogen lines which can
be used as a diagnostic in fixing stellar atmospheric parameters: Teff and g. (iii) Quantitative theory of line broadening for use in determining abundances of
elements from profiles or equivalent widths (i.e. integrated intensities) of absorption lines.
A fourth topic, to which only passing reference will be made here, is that of the profiles of radio recombination lines in ionized hydrogen regions such as the Orion Nebula. Here appreciable Stark broadening is predicted by the current theory (Griem 1967), but the observed amount is about an order of magnitude lower (Menon and Payne 1969).
2. Qualitative effects One of the most intriguing pressure broadening effects is the appearance of violet-
displaced forbidden absorption components on the wings of strong lines of the diffuse series of He I in spectra of main-sequence stars of spectral class B, T N 20 000 K, Ne N ~ m - ~ . Struve (1929) correctly explained these as field-induced transitions of the form 2P-nF, normally forbidden, €or example 23P0-43F0 4470 on the wing of X 4471.
However, interpretations in terms of the static Stark effect led to great difficulties for many years until the development of the quantum theory of helium-line broaden- ing by Griem and others in the last few years, including impact broadening by electrons. Modern theories of the diffuse line profiles due to Griem (1968) and Barnard et al. (1969) have been applied to the interpretation of stellar helium line
Importance of spectral line shapes in astrophysics 28 1
profiles by Shipman and Strom (1970), Hardorp and Scholz (1970), Kodaira and Scholz (1970), Poland (1970) and Norris (1970). Apart from Poland, all these authors assumed local thermodynamic equilibrium, which leads to an underprediction of the central depth of the permitted line, but probably entails negligible errors in the line wings, in the forbidden component or in the total equivalent widths (Poland 1970). Apart from this effect on central depth, the predicted profiles tend to make the for- bidden component somewhat too sharp (peak too deep ; trough between forbidden and permitted peaks too high) in comparison with observation, and a similar effect has recently been found in laboratory experiments on X 4471 at similar electron densities (Burgess and Cairns 1970) where the observed line profiles are much more directly related to the absorption coefficient. According to Burgess (1970), this discrepancy may well be due to a conceptual error in the application of quasi-static ion broadening theory near the centre of the forbidden line. According to these results, the interpretation of the wings and equivalent widths of X 4471 and other He I lines in the blue region in terms of helium abundance should be quite reliable, but there are indications that the first lines of the series AX 6678, 5876 are stronger in hot stars than is predicted on the basis of currently available theories (Hardorp and Scholz 1970, Norris 1970).
Another related problem is that of pressure shifts in the spectra of white dwarfs, which makes it impossible to use helium lines for the determination of the Einstein shift. For this purpose one has to use hydrogen lines, for which the broadening is hopefully symmetrical (Greenstein and Trimble 1967).
3. Determination of effective temperature and surface gravity In this category one of the most important applications of line broadening theory
is the computation of Balmer line profiles as a diagnostic tool in studying stellar atmospheres.
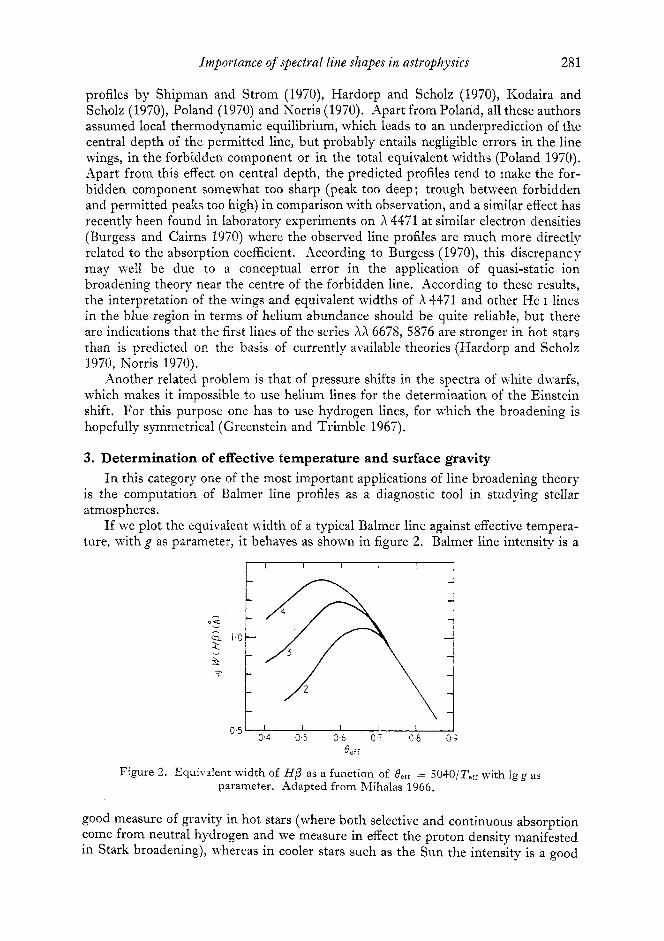
If we plot the equivalent width of a typical Balmer line against effective tempera- ture, with g as parameter, it behaves as shown in figure 2. Balmer line intensity is a
B e i f
Figure 2. Equivalent width of H/3 as a function of Befr = 5040/Tefr with lg g as parameter. Adapted from Mihalas 1966.
good measure of gravity in hot stars (where both selective and continuous absorption come from neutral hydrogen and we measure in effect the proton density manifested in Stark broadening), whereas in cooler stars such as the Sun the intensity is a good
282 B. E. J . Pagel
measure of Teff; this is because the continuous opacity now comes from H- and so the electron density or ion density term cancels out by virtue of Saha’s equation.
By fitting both the Balmer lines and the discontinuity at the head of the Balmer continuum, one can solve for both Teff and g, and this is an important method in choosing a model atmosphere to fit a given star, especially when the continuum is affected by interstellar reddening. A related criterion of electron density (or lumino- sity) is the confluence of high Balmer lines near the series limit. According to the Inglis-Teller formula, modified to allow for quasi-static broadening by electrons,
lg(2Ne) = 23’26-7.5 lg TZ
where n is the number of the last visible Balmer line. Some typical values are as follows.
Main sequence (AO: T lo4) 1.5 14.1 Supergiant (AO: T N lo4) 27 12.2 Circumstellar shell with emission
lines (AG Peg) 30 11.8
In discussing the profiles of Balmer lines, astrophysicists ha)-e often used the wing formula of Grieni et al. (1959):
%,(Ah) = C,F03’2AX-5/2{l + R(N,, T)4X1 ‘1 but following critical studies by Pfennig (1966) and others, it now seems that at the relatively low electron densities appropriate to stellar atmospheres, a better approximation is provided by treating electron broadening as quasi-static in the wings and negligible near the line centre (Feautrier e t al. 1967, Edmonds et al. 1967). A number of profiles calculated along these lines are available (Edmonds et al. 1967, Praderie 1967). These lead to somewhat higher gravities in hot stars. For Ho: in cooler stars one also has to allow for resonance broadening (Cayrel and Traving 1960) and probably for van der Waals interaction.
< Ne <
4. Determination of abundances The third problem for which we need good pressure-broadening data is that of
determining abundances of elements from equivalent widths of absorption lines. If the line is very weak, the problem is quite straightforward, since the equivalent width in wavelength units, say, is proportional to the abundance ratio of the element to hydrogen multiplied by the oscillator strength of the transition :
where $(T) is a contribution function depending on the structure of the stellar atmos- phere and the relevant states of excitation and ionization. T is the optical depth in the continuum.
So if we measure X for some line, we can deduce the abundance NM/NH for-some element M if we knowf.
Importance of spectral line shapes in astrophysics 283
Even if we do not knowf, we can still deduce the change in abundance in some star with respect to the Sun by comparing equivalent widths in the two cases:
n;, weak IC;,
Alg (7) = h l g X - t h l g - .
This method is very convenient in studying abundance differences in stars having physical parameters not too different from those of the Sun.
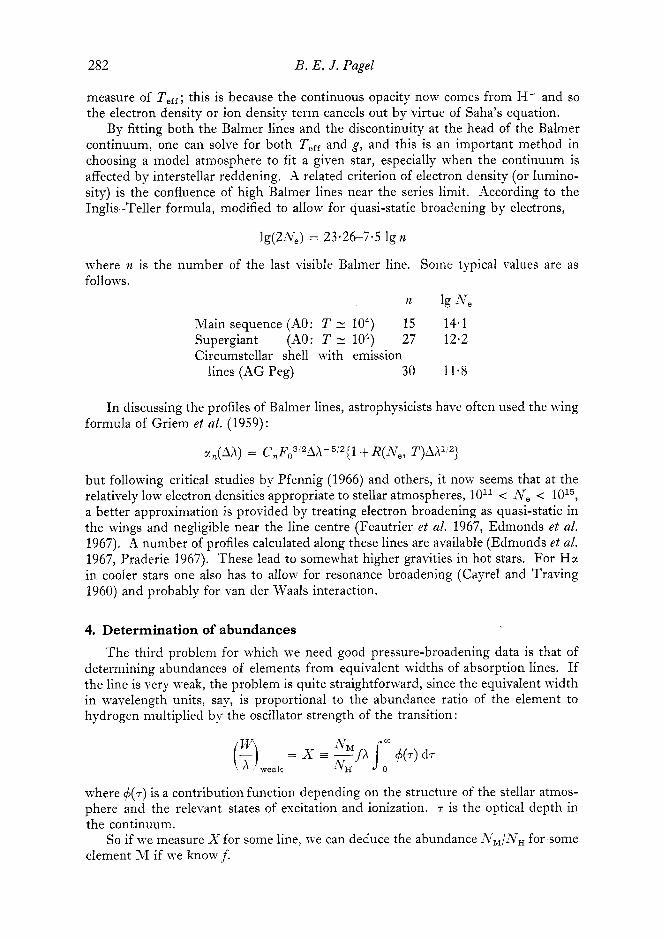
If the line is not weak, saturation occurs, that is WjX < X, where X is proportional to the abundance, and the situation is much more complicated. What we now have to do is to desaturate the line, that is, find a relationship whereby we can deduce X from the measured equivalent width.
-6 0 -50 - 4 0 -3 0 -2.0 - 1 0 Lgx- lg { ~ , / ~ ~ ) g f } + const
Figure 3. Typical curves of growth for A 5000 with lg y as parameter. Heavy curves: zD = 1.7 km s-I, a = 0.05 (average for Sun) and a = 0.005 (red giant). Light curves: zD = 3.4 km s-I, a = 0.025, 0,0025. The straight line represents
the unsaturated case.
This relationship is described by the curve of growth, whose shape depends on the amount of line broadening due to both Doppler and damping effects. Curves of growth plotted for two values of the Doppler width and of the damping constant y (in angular frequency units) are shown in figure 3. The curve has three main branches:
W h
Linear (unsaturated): - = X ;
vD Flat (saturated Doppler): - 2: 3 -; W,(5000 a) 2 0.1 -4 typically; h C
W Square root (damping) branch:
so if we have no suitable weak lines for some element, abundance determination becomes very difficult.
On the flat portion W depends mainly on the Doppler width, which is unpredic- table in advance.
On the damping branch we only derive the product X y or (NM/NH)fy , not (iVM/NH)f. Kor does it help much to look at the profile, since the dip is also a function of (NM/NH)fy along most of the wings and the core of the line is very saturated.
We illustrate this problem with two main examples.
28 4 B. E. J. Page1
(i) Mg abundance in hot stars on the main sequence (lo4 < Teff < 3-5 x lo4;
Henry and Mihalas (1964), adopting Stark broadening by electrons according to Ne 2: 2 x 10l4 ~ m - ~ ) from Mg 11 A4481 (3d 2D-44f2F0).
the Lindholm-Foley theory, used the formula
y = 213 6j7312C 4 2 3 70 - 2 3an2 301 3L\Te = const.C42’3~l~3a\~e
(Aller 1963), C4 being taken from laboratory experiments on the Stark shift. The Mg+ line typically lies on the flat portion of the curve of growth and the
abundance comes out 0.9 dex higher than solar. This result agrees with earlier ones obtained by other authors using different sets of model atmospheres. Such a large difference in Mg/H between the Sun and the stars is striking and would be of some cosmogonic importance if it were real. However, the allowance to be made for damping is a major source of uncertainty.
This question was considered by Hobbs and Cowley (1968), who noted that the improved theory in Griem’s book makes y twice as large. A further correction for quadrupole interaction (for which there is actually no physical basis in the impact approximation; see Griem 1964, pp. 94-5, Burgess 1968, and private communication from D. D. Burgess) increases the factor to 29. The correction to the abundance is actually somewhat greater, about 0.5 dex, which reduces the abundance difference to 0.4 des, probably within the uncertainty due to the effect of microturbulence on the Doppler width and other problems.
(ii) Damping constants and abundances in the Sun, especially iron abundance. In the solar spectrum,
T 2: 5500 K X, 2: 1017cm-3 A\-e Y 1013
and the main source of broadening outside the Doppler core is usually the van der Kaals and other forces exerted by neutral hydrogen atoms. (There are some cases of very highly excited lines, for example of NaI, that are very strongly broadened by the Stark effect, so that the curve of growth is practically linear (Mugglestone and O’Mara 1966); but these lines are so weak in any case that the effect of this on the abundance determination of sodium is quite small.)
Most discussions of pressure broadening in the Sun have been based on the Lindholm-Foley theory assuming a van der Waals potential combined with the Coulomb approximation as expounded, for example, in Unsold’s (1955) book:
where in the Coulomb approximation
e2 - e2
h h C6 = - x(ye2) = - xaO2 (5n*2 +- 1 - 31(1+ I))
o( = polarizability of the hydrogen atom, a. = Bohr radius, Y, = effective radius of the atom in either level, n* = effective quantum number, A = difference between upper and lower states.
Laboratory experiments on broadening and line shift due to inert gases by Hindmarsh and others have shown this theory to be incorrect, as it gives the wrong
Importance of spectral line shapes in astrophysics 285
ratio of shift to width, and various improvements have been introduced, for example the addition of a repulsive term to the interaction corresponding to the Lennard- Jones potential (Hindmarsh et al. 1967).
However, as far as I know, nobody has investigated the effect of these corrections in the astrophysical situation in any detail. Laboratory experiments on the line width of simple atoms due to broadening by rare gases at low temperatures in fact generally give quite fair agreement with the formula when the densities are low enough for the impact approximation to apply (Unsold and Weidemann 1955, Hindmarsh 1959). However, at a temperature of 4500 K, experimental results on the broadening of the sodium D lines by neutral helium at densities between loz1 and loz2 cm-3 indicate a value of y about 4.5 times that predicted from the van der Waals formula (Burgess and Grindlay 1970).
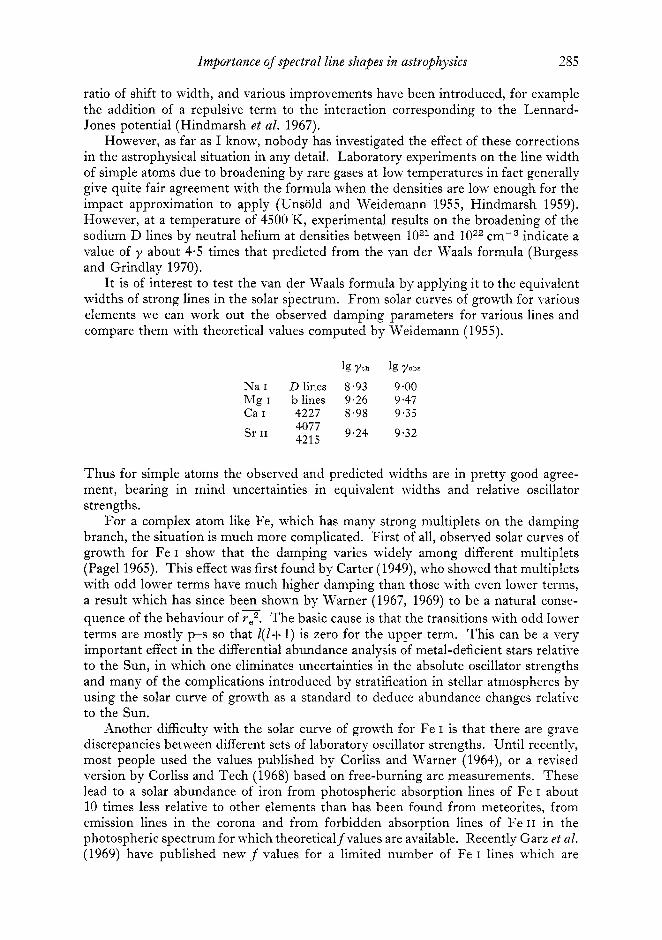
I t is of interest to test the van der Waals formula by applying it to the equivalent widths of strong lines in the solar spectrum. From solar curves of growth for various elements we can work out the observed damping parameters for various lines and compare them with theoretical values computed by Weidemann (1955).
Ig 7 t h 1g Yobs
Na I D lines 8.93 9.00 Mg I blines 9.26 9.47 CaI 4227 8.98 9.35
4077 9-24 9.32 Sr I' 421 5
Thus for simple atoms the observed and predicted widths are in pretty good agree- ment, bearing in mind uncertainties in equivalent widths and relative oscillator strengths.
For a complex atom like Fe, which has many strong multiplets on the damping branch, the situation is much more complicated. First of all, observed solar curves of growth for Fe I show that the damping varies widely among different multiplets (Page1 1965). This effect was first found by Carter (1949), who showed that multiplets with odd lower terms have much higher damping than those with even lower terms, a result which has since been shown by Warner (1967, 1969) to be a natural conse- quence of the behaviour of 3. The basic cause is that the transitions with odd lower terms are mostly p-s so that 1(1+ 1) is zero for the upper term. This can be a very important effect in the differential abundance analysis of metal-deficient stars relative to the Sun, in which one eliminates uncertainties in the absolute oscillator strengths and many of the complications introduced by stratification in stellar atmospheres by using the solar curve of growth as a standard to deduce abundance changes relative to the Sun.
Another difficulty with the solar curve of growth for Fe I is that there are grave discrepancies between different sets of laboratory oscillator strengths. Until recently, most people used the values published by Corliss and Warner (1964), or a revised version by Corliss and Tech (1968) based on free-burning arc measurements. These lead to a solar abundance of iron from photospheric absorption lines of Fe I about 10 times less relative to other elements than has been found from meteorites, from emission lines in the corona and from forbidden absorption lines of Fe11 in the photospheric spectrum for which theoretical f values are available. Recently Garz et al. (1969) have published new f values for a limited number of Fe I lines which are
286 B. E. J . Pagel
considerably smaller than those of Corliss and Warner and lead to an iron abundance about 10 times greater, in agreement with other values.
Does this finally settle the question? T o start with, one may ask whether the problem o f f values has been finally
solved. In view of the excellent precautions taken by the Kiel workers, it is quite possible
that this is so (cf. Bridges and Wiese 1970), but it is a bit surprising that all the previous work on the problem should now turn out to be so very bad. Secondly, it has been pointed out by various people studying the solar spectrum that the problem of collision broadening of Fe I lines is very important. Garz e t al. use 26 lines-of Fe I to determine the new abundance, but only 3 of these are really weak enough to give a result that is independent of the curve of growth parameters-Doppler width and damping-and perhaps 5 more are weak enough so that the error cannot exceed a factor 2. For the remaining lines the abundance is closely tied to the damping constant, which they computed from the standard formula taking? from the Coulomb approximation and from scaled Thomas-Fermi calculations by Warner (1969). From the consistency of the solar Fe abundances deduced from weak and strong lines, they concluded that the theoretical formula for the damping was adequate within a factor of 2 or so.
On this point, however, there are differences of opinion. Cowley et al. (1969), assuming Corliss-Tech f values and using measurements of the profile at the extreme wing of the lines, derive damping constants that are systematically higher by factors between 2 and 6, and point out that their results are in good agreement with laboratory measurements by Kusch (1958) on the broadening of Fe I lines by H atoms in a high- pressure arc discharge. More recently, laboratory measurements of the Fe I line broadening by argon in a shock tube by Grasdalen et al. (1969) have also suggested that the damping constmts for Fe1 may be higher than predicted, and a similar conclusion has been reached from a detailed study of solar line profiles by Ross (1970).
If all these people are right, it follows that the new iron abundance derived by Garz e t al. has to be diminished by 0.5 dex for the strong lines, which then would make them inconsistent with the weak lines on the new scale o f f values. So we cannot expect a satisfactory solution of the Fe I oscillator strength problem till these questions of collision damping are cleared up.
Acknowledgments
helpful comments and suggestions. I am grateful to Dr D. D. Burgess and Professor M. J. Seaton for numerous
References ALLER, L. H., 1963, The Atmospheres of the Stin and Stars (New York: Ronald Press), p. 318. B.4RNARD, A. J., COOPER, J., and SHAMEY, L. J., 1969, Astron. Astroph).s., 1, 28. BRIDGES, J. M., and WIESE, W. L., 1970, Astrophys. J . Lett., 161, L71. BURGESS, D. D., 1968, Phys. Rev., 176, 150. - BURGESS, D. D., and CAIRNS, C. J., 1970, J . Phys. B: Atom. molec. Phys., 3, L67. BURGESS, D. D., and GRINDLAY, J. E., 1970, Astrophys. J . , 161, 343. CARTER, W. W., 1949, Phys. Rev., 76, 962. CAYREL, R., and TRAVING, G., 1960, Z. Astrophys., 50, 239. CORLISS, C. R., and TECH, J. L., 1968, NBS Monograph, 108. CORLISS, C. R., and WAR~YER, B., 1964, Astroph3Is. J. Suppl., 8, 395.
1970, J . Phys. B: Atom. molec. Phys., 3, L70.
Importance of spectral h e shapes in astyopliysics 287
Cou LEY, C. R., 1970, Astrophys. Le t t . , 5, 149. COWLEY, C. R., ELSTE, G. H., and ALLEN, R. H., 1969, Astrophys. J . , 158, 1177. EDMONDS, F. N., SCHLOTER, H., and WELLS, D. C., 1967, Mem. R. Ast?,. SOC., 71, 271. FEAUTRIER, W., PRADERIE, F., and VAN REGEMORTER, H., 1967, Aniz. Astrophys., 30, 45. GAW, T., HOLWEGER, H., KOCK, M., and RICHTER, J., 1969, Astron. Astrophys., 2, 446. GRASDALEN, G. L., HCBER, M., and PARKISSOS, W. H., 1969, Astroph3z3.s. J . , 156, 1153. GREENSTEIN, J. L., and TRIRIBLE, V., 1967, Ast’ophys. J . , 149, 283. GRIEM, H. R., 1964, Plasma Spectroscop3 (New York: XlcGraw-Hill). - -
1967, Astrophys. J . , 148, 547. 1968, Astrophys. J . , 154, 1111.
GRIERI, H. R., KOLB, H. C., and SHEN, K. Y,, 1959, Pizys. Rei>., 116, 4. HARDORP, J., and SCHOLZ, M., 1970, Astrophys. J . Szippl., 173, 193. HEKRY, R. c., and hfIHALAS, D., 1964, Astrophys. J . , 140, 873. HINDM~RSH, W. R., 1959, Mon. -Vat. R. Astv. Soc., 119, 11. HINDMARSH, W. R., PETFORD, A. D., and SMITH, G., 1967, PTOC. R. SOC. -1, 297, 296. HOBBS, L. LI., and COWLEY, c. I<., 1968, Astrophys. J . , 153, 909. KODAIRX, K., and SCHOLZ, R I . , 1970, Astron. ,4stroph3~., 6, 93. KCSCH, H. J., 1958, 2. Astrophys., 45, 1. YIENOS, T. I<,, and PAYNE, J., 1969, Astitoph3-s. Le t t . , 3, 2.5. MIH~LAS, D., 1966, Astrophys. J . Suppl., 13, 1.
KORRIS, J., 1970, Thesis, Australian National University. PAGEL, B. E. J., 1965, R. Obs. Bull., No. 104. PFENNIG, H., 1966, J . Quant. Spectrosc. Radia t . Tvansfer, 6, 549. POLAND, A . I., 1970, Astrophys. J., 160, 609. PRADERIE, F., 1967, Ann. Astrophys., 30, 31. Ross, J. E., 1970, Nature, Lond., 225, 610. SHIPMAN, H. L., and STROM, S. E., 1970, Astrophys. J . , 159, 183. STRUVE, O., 1929, Astrophys. J. , 69, 173; 70, 85. UNSOLD, A., 1955, Physih der Stewzatmosphuren (Berlin: Springer-Verlag). UNSOLD, A . , and WEIDEMANN, v . , 1955, vistas in Astvonowzy, vol. 1, Ed. -4. Beer, p. 249. WARNER, B., 1967, Mon. N o t . R. Astr. Soc., 136, 381. - 1969, Obseraatory, 89, 11.
MUGGLESTONE, D., and O ’ R I A R A , B. J., 1966, MOO~Z. X o t . R. Ast?’. SOC., 132, 87.
V’EIDEMANN, v., 1955, 2. A S t T O p h J ’ S . , 36, 101.

![Astrophysics I, Lecture Slides – Chapter 2, ETH Zurich · 2019. 9. 23. · Spectral energy distribution of the sun 400 600 800 1000 1200 [nm] Astrophysics I, Lecture Slides –](https://img.pdfslide.net/doc/110x75/5fbe6330ba610267434e3860/astrophysics-i-lecture-slides-a-chapter-2-eth-zurich-2019-9-23-spectral.jpg)


![A Compact Spectral Descriptor for Shape Deformationsecai2020.eu/papers/1265_paper.pdf · mesh processing (e.g., [19, 24]). Spectral mesh processing represents geometric shapes as](https://img.pdfslide.net/doc/110x75/5fac21c5d894431ea53f4824/a-compact-spectral-descriptor-for-shape-mesh-processing-eg-19-24-spectral.jpg)