Embed Size (px)
Citation preview

Improvement of rating curve through Manning's Equation and LiDAR
Sylvia A. Sueno and Hannah A. AventuradoUniversity of the Philippines
Disaster Risk Exposure and Assessment for Mitigation
(DREAM) Project
Presented at th
e FIG W
orking Week 2016,
May 2-6, 2
016 in Christchurch, N
ew Zealand
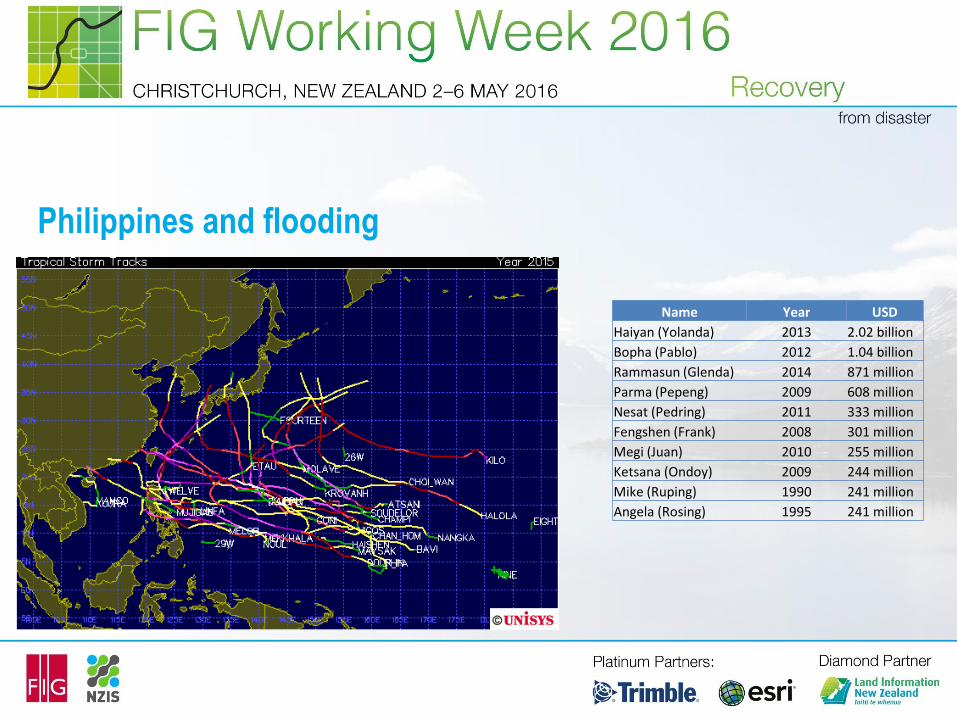
Philippines and flooding
Name Year USD
Haiyan (Yolanda) 2013 2.02 billion
Bopha (Pablo) 2012 1.04 billion
Rammasun (Glenda) 2014 871 million
Parma (Pepeng) 2009 608 million
Nesat (Pedring) 2011 333 million
Fengshen (Frank) 2008 301 million
Megi (Juan) 2010 255 million
Ketsana (Ondoy) 2009 244 million
Mike (Ruping) 1990 241 million
Angela (Rosing) 1995 241 million

Meteorological Sensors in the Philippines
Only baseflow discharge is available!
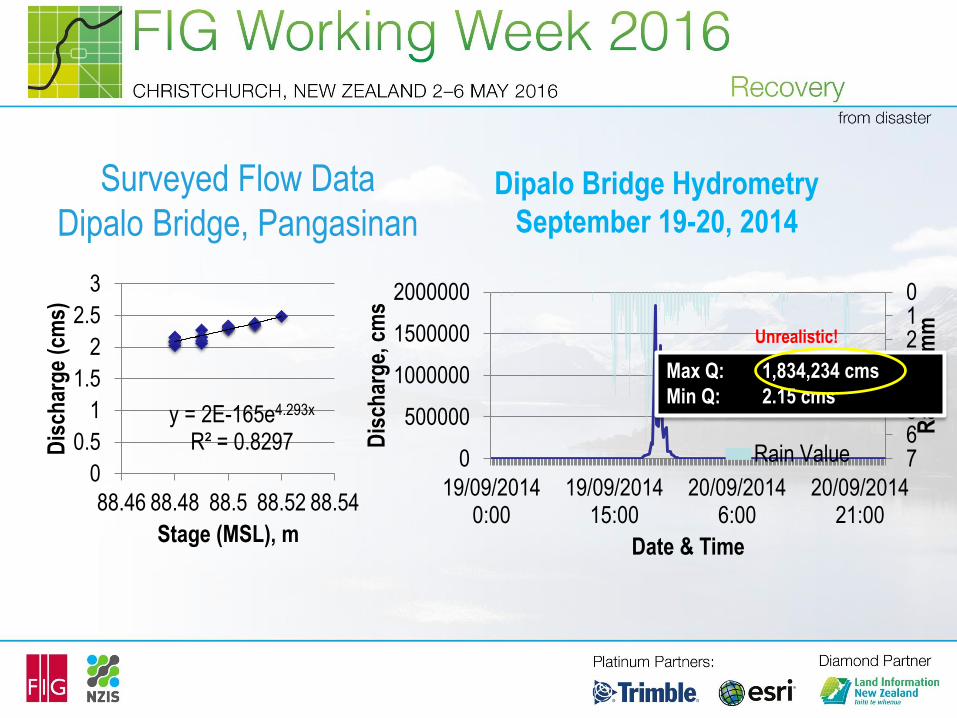
Surveyed Flow Data
Dipalo Bridge, Pangasinan
y = 2E-165e4.293x
R² = 0.8297
0
0.5
1
1.5
2
2.5
3
88.46 88.48 88.5 88.52 88.54
Dis
char
ge
(cm
s)
Stage (MSL), m
012345670
500000
1000000
1500000
2000000
19/09/20140:00
19/09/201415:00
20/09/20146:00
20/09/201421:00
Rai
nfa
ll, m
m
Dis
char
ge,
cm
s
Date & Time
Rain Value
Dipalo Bridge Hydrometry
September 19-20, 2014
Max Q: 1,834,234 cms
Min Q: 2.15 cms
Unrealistic!
River Measurements for Rating Curves
Problem with baseflow measurements only
• In-situ river discharge measurements during high flows are dangerous and expensive
to capture.
• The opportunities to gather field measurement are rare
!Nonetheless, this is required to develop a good elevation-discharge relationship, or rating
curve.
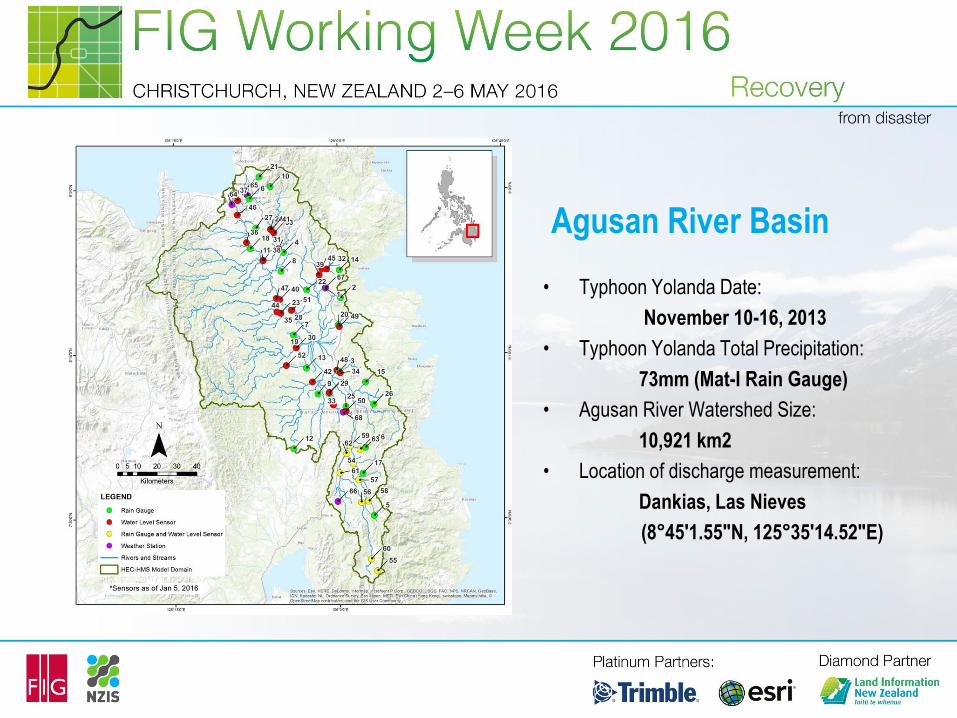
Agusan River Basin
• Typhoon Yolanda Date:
November 10-16, 2013
• Typhoon Yolanda Total Precipitation:
73mm (Mat-I Rain Gauge)
• Agusan River Watershed Size:
10,921 km2
• Location of discharge measurement:
Dankias, Las Nieves
(8°45'1.55"N, 125°35'14.52"E)
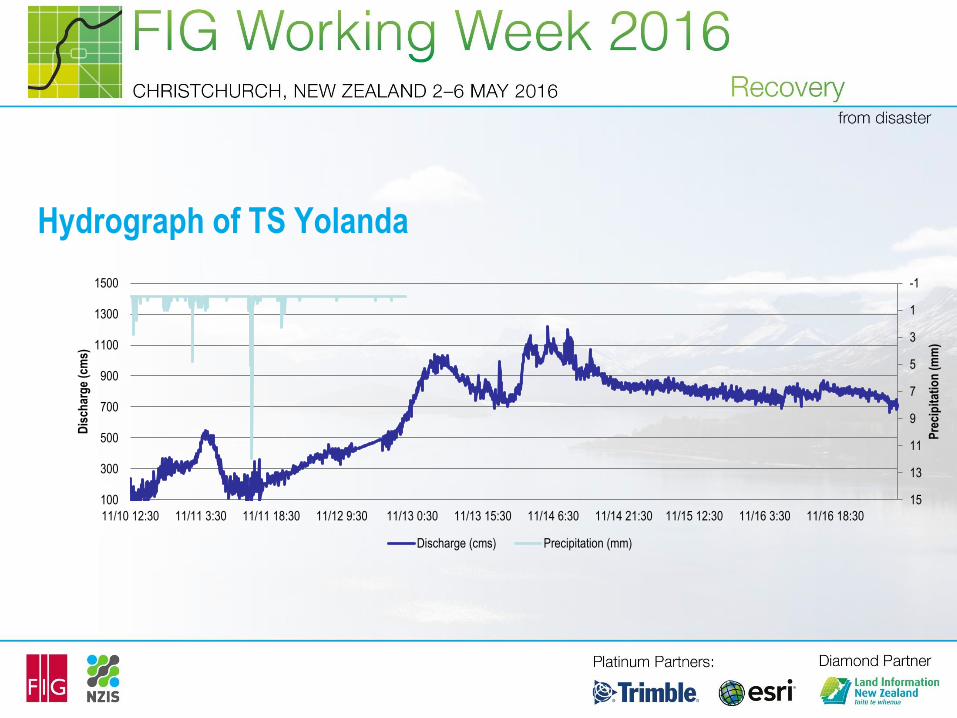
Hydrograph of TS Yolanda
-1
1
3
5
7
9
11
13
15100
300
500
700
900
1100
1300
1500
11/10 12:30 11/11 3:30 11/11 18:30 11/12 9:30 11/13 0:30 11/13 15:30 11/14 6:30 11/14 21:30 11/15 12:30 11/16 3:30 11/16 18:30
Pre
cip
itat
ion
(m
m)
Dis
char
ge
(cm
s)
Discharge (cms) Precipitation (mm)
Problem
Using only baseflow data of the Agusan River Basin,
which procedure for extending the rating curve will best
fit the actual river hydrograph?
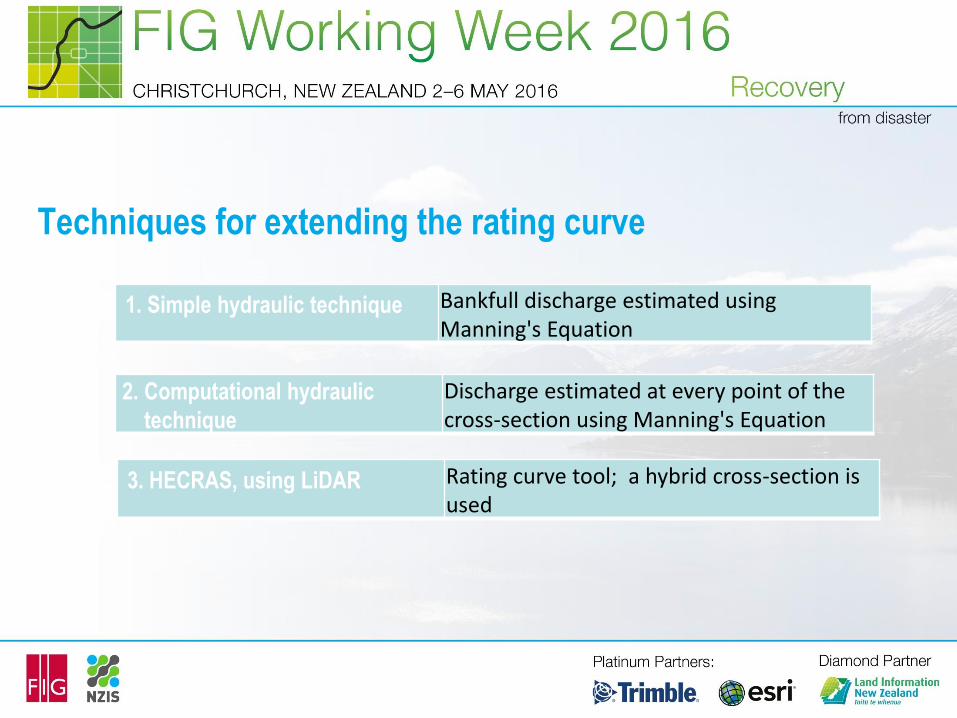
Techniques for extending the rating curve
1. Simple hydraulic technique Bankfull discharge estimated using Manning's Equation
2. Computational hydraulic
technique
Discharge estimated at every point of the cross-section using Manning's Equation
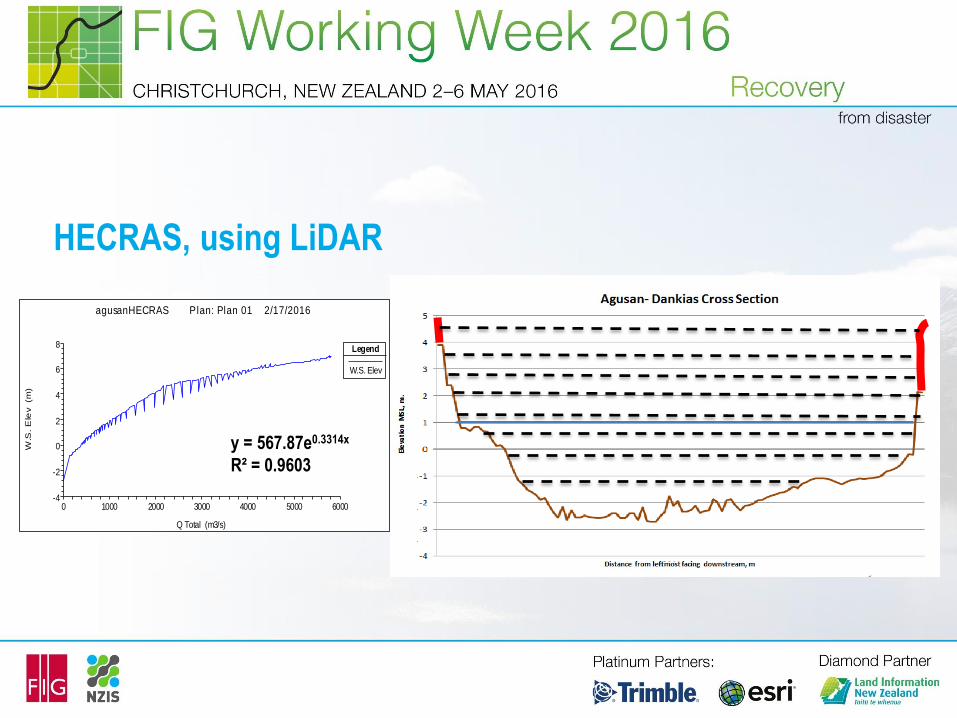
3. HECRAS, using LiDAR Rating curve tool; a hybrid cross-section is used
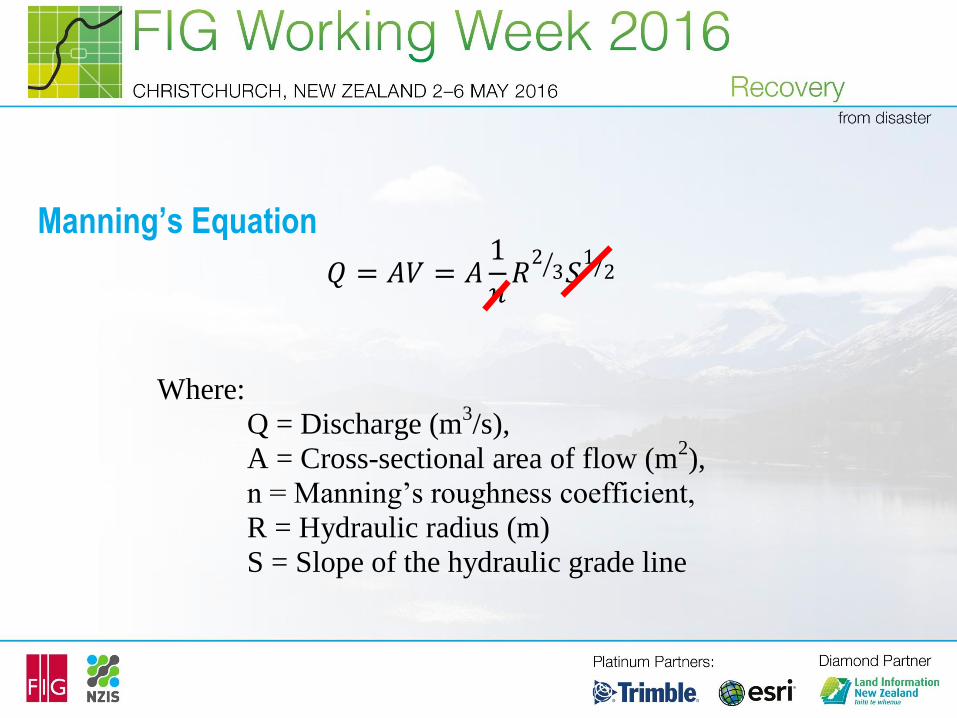
Manning’s Equation
𝑄 = 𝐴𝑉 = 𝐴1
𝑛𝑅23 𝑆
12
Where:
Q = Discharge (m3/s),
A = Cross-sectional area of flow (m2),
n = Manning’s roughness coefficient,
R = Hydraulic radius (m)
S = Slope of the hydraulic grade line

Equation (2). Manning’s Equation (Manning’s n and slope are constant)
𝑄 =𝐴53
𝑃23 × 𝑘
Where:
𝑘 =1
𝑛𝑆12

Equation (3). Manning’s Equation for bankfull discharge
Q𝑓𝑢𝑙𝑙 = 𝑘𝑎𝑣𝑒𝐴𝑓𝑢𝑙𝑙5/3
𝑃𝑓𝑢𝑙𝑙2/3
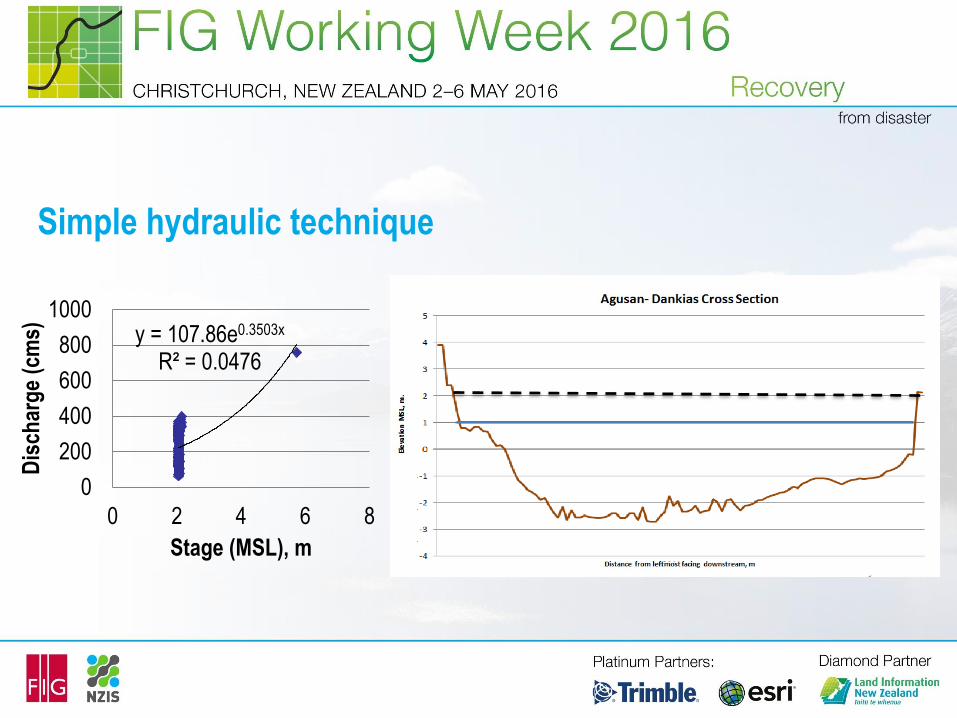
Simple hydraulic technique
y = 107.86e0.3503x
R² = 0.0476
0
200
400
600
800
1000
0 2 4 6 8
Dis
char
ge
(cm
s)
Stage (MSL), m
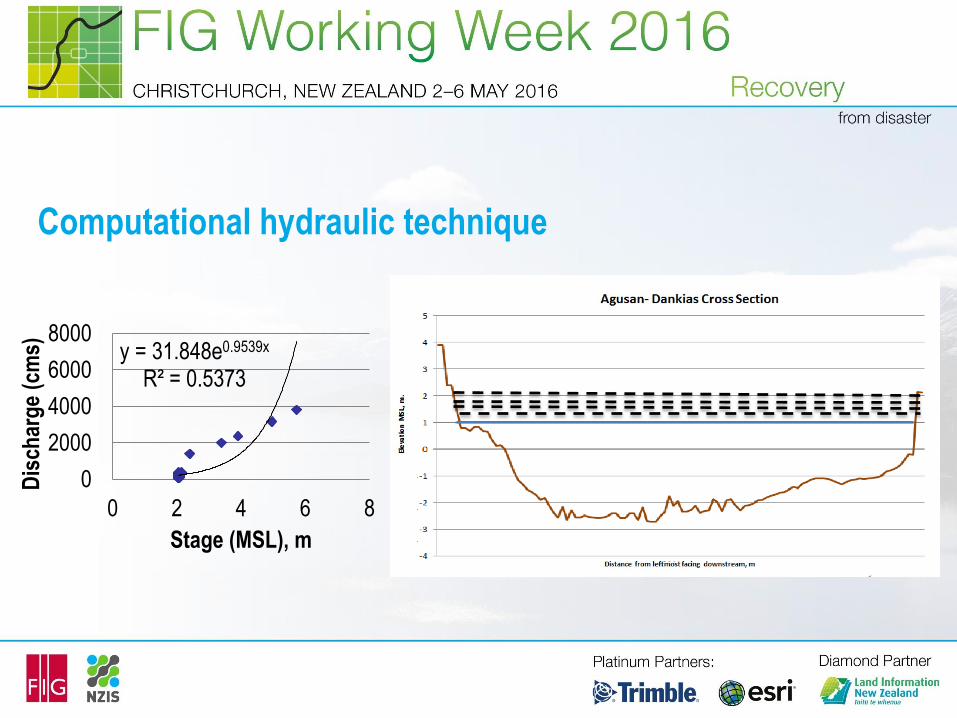
Computational hydraulic technique
y = 31.848e0.9539x
R² = 0.5373
0
2000
4000
6000
8000
0 2 4 6 8
Dis
char
ge
(cm
s)
Stage (MSL), m
0 1000 2000 3000 4000 5000 6000-4
-2
0
2
4
6
8
agusanHECRAS Plan: Plan 01 2/17/2016
Q Total (m3/s)
W.S
. E
lev (m
)
Legend
W.S. Elev
y = 567.87e0.3314x
R² = 0.9603
HECRAS, using LiDAR
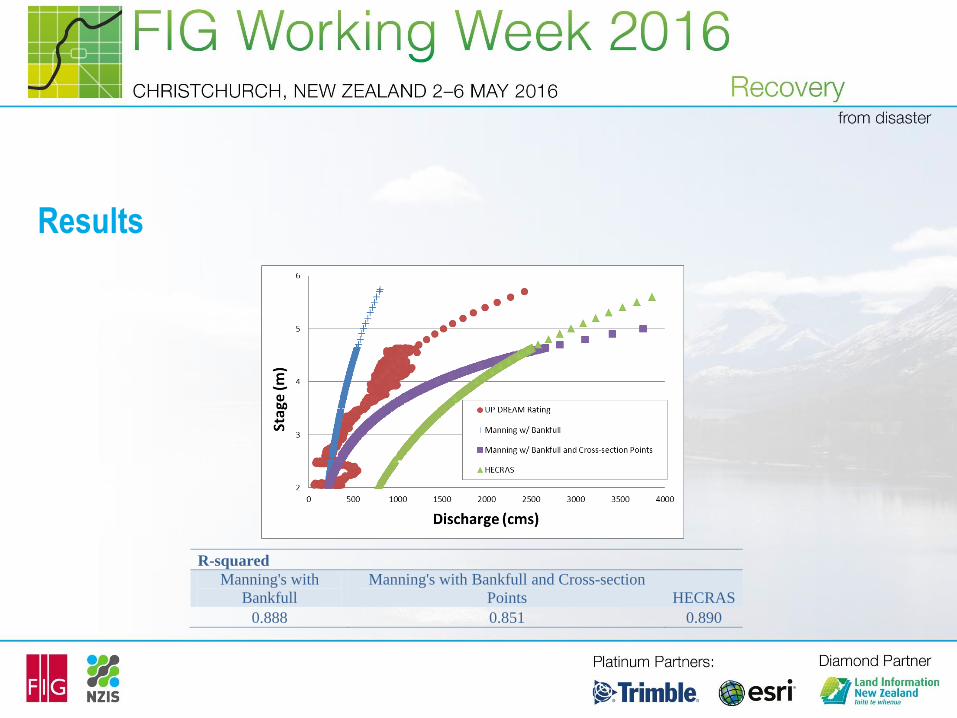
Results
R-squared
Manning's with
Bankfull
Manning's with Bankfull and Cross-section
Points HECRAS
0.888 0.851 0.890
Recommendations:
• Possible validation can be done by comparing actual flood events and the result of a
watershed-floodplain model calibrated using discharge generated rating curve