Embed Size (px)
Citation preview
Improving Indonesia’s Competitiveness:
Case Study of Textile and Farmed Shrimp Industries
Volume 1
Improving Indonesia’s Competitiveness: Case Study of Textile and Farmed-Shrimp Industries
Volume 1
September 2006
Foreign Investment Advisory Service A joint facility of the International Finance Corporation And The World Bank

IMPROVING INDONESIA’S COMPETITIVENESS: CASE STUDY OF TEXTILE AND FARMED-SHRIMP INDUSTRIES
Abbreviations ADB - Asian Development Bank AGOA – Africa Growth and Opportunity Act ASEAN – Association of Southeast Asian Nations CAFTA-DR – Central American Free Trade Agreement and Dominican Republic CBI – Caribbean Basin Initiative CIF – Cost, Insurance and Freight COO - Certificates of Origin EBA – Everything But Arms Agreement EDI – Electronic Data Interchange EPZs – Export Processing Zones EU – European Union FCR – Feed Conversion Ratios GATT – General Agreement on Tariffs and Trade GOI – Government of Indonesia GSP – General System of Privileges ITMF – International Textile Manufacturers Federation KPP – Komite Pengamanan Perdagangan LPEM - Lembaga Penyelidikan Ekonomi dan Masyarakat,.Institute of Social and Economic Research, University of Indonesia MFA – Multi-Fiber Agreement MIGA – Multilateral Investment Guarantee Agency MOI – Ministry of Industry MOT – Ministry of Trade NAFTA – North American Free Trade Agreement OECD – Organization for Economic Cooperation and Development PIC – Productivity Improvement Center PRC – People Republic of China PSF - Polyester Staple Fiber SAD – Single Administrative Document SEAI - Seafood Exporters Association of India SEZ – Special Economic Zones SLL – Shuttleless Looms TUFS – Textile Upgradation Fund Scheme USITC – United States International Trade Commission VAT – Value Added Tax WSSV - White Spot Syndrome Virus WTO – World Trade Organization
IMPROVING INDONESIA’S COMPETITIVENESS: CASE STUDY OF TEXTILE AND FARMED-SHRIMP INDUSTRIES
TABLE OF CONTENTS
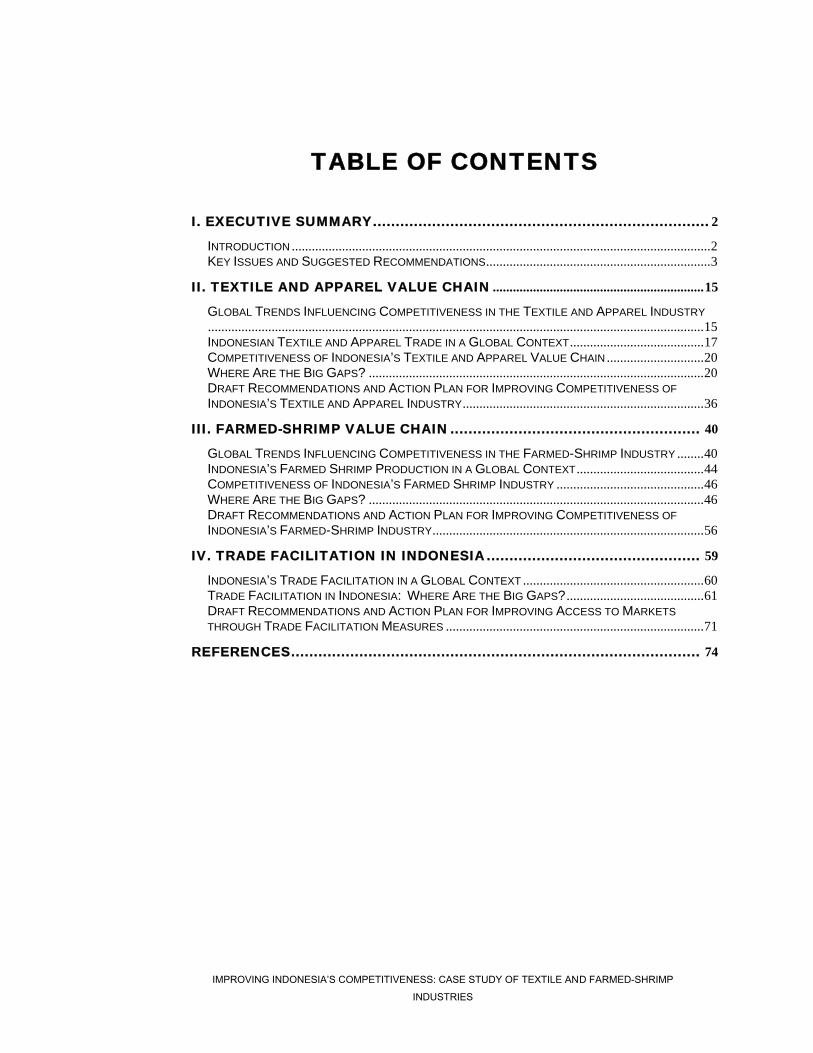
I. EXECUTIVE SUMMARY.......................................................................... 2 INTRODUCTION .............................................................................................................................2 KEY ISSUES AND SUGGESTED RECOMMENDATIONS...................................................................3
II. TEXTILE AND APPAREL VALUE CHAIN ...............................................................15
GLOBAL TRENDS INFLUENCING COMPETITIVENESS IN THE TEXTILE AND APPAREL INDUSTRY....................................................................................................................................................15 INDONESIAN TEXTILE AND APPAREL TRADE IN A GLOBAL CONTEXT........................................17 COMPETITIVENESS OF INDONESIA’S TEXTILE AND APPAREL VALUE CHAIN .............................20 WHERE ARE THE BIG GAPS? ....................................................................................................20 DRAFT RECOMMENDATIONS AND ACTION PLAN FOR IMPROVING COMPETITIVENESS OF INDONESIA’S TEXTILE AND APPAREL INDUSTRY........................................................................36
III. FARMED-SHRIMP VALUE CHAIN ....................................................... 40 GLOBAL TRENDS INFLUENCING COMPETITIVENESS IN THE FARMED-SHRIMP INDUSTRY ........40 INDONESIA’S FARMED SHRIMP PRODUCTION IN A GLOBAL CONTEXT ......................................44 COMPETITIVENESS OF INDONESIA’S FARMED SHRIMP INDUSTRY ............................................46 WHERE ARE THE BIG GAPS? ....................................................................................................46 DRAFT RECOMMENDATIONS AND ACTION PLAN FOR IMPROVING COMPETITIVENESS OF INDONESIA’S FARMED-SHRIMP INDUSTRY.................................................................................56
IV. TRADE FACILITATION IN INDONESIA............................................... 59 INDONESIA’S TRADE FACILITATION IN A GLOBAL CONTEXT ......................................................60 TRADE FACILITATION IN INDONESIA: WHERE ARE THE BIG GAPS? .........................................61 DRAFT RECOMMENDATIONS AND ACTION PLAN FOR IMPROVING ACCESS TO MARKETS THROUGH TRADE FACILITATION MEASURES .............................................................................71
REFERENCES.......................................................................................... 74
2
IMPROVING INDONESIA’S COMPETITIVENESS: CASE STUDY OF TEXTILE AND FARMED-SHRIMP INDUSTRIES
EXECUTIVE SUMMARY
I. Executive Summary
Introduction
The Ministry of Trade (on behalf of the GOI) requested FIAS1 and the World Bank to identify the salient features which matter most for improving the efficiency and competitiveness of Indonesia’s textile and apparel sector and the farmed shrimp sector, as a lens for identifying policy options to improve national export performance. The study was carried out to meet this request. This executive summary draws on observations made by expert consultants during a visit to Indonesia in February 2006 where discussions were held with a wide selection of companies active in each respective industry. This report was written by a team consisting of Uma Subramanian, Victor Abiola, with significant inputs from Russell Muir and Geoffrey Walton (all FIAS).2 It integrates various views and discussions in separate industry-specific reports completed by expert consultants, namely: (1) Farmed Shrimp Sector (Graeme Macfadyen, Poseidon) (2) Textile and Apparel Sector (Peter Dinsdale, IFC) (3) Trade Facilitation (Peter Yee, Consilium International). Interviews were conducted with companies all through the supply chain of the textile and apparel sector - including fiber producers and yarn spinners to manufacturers of fabrics and ready made garments, as well as representatives of the Government, industry associations, retailers and the banking sector. Visits were also made to a number of production facilities. Consultative meetings were held in Jakarta at the end of the visit to share information with stakeholders and seek feedback on the initial findings. The same activities were carried out to examine issues related to the shrimp industry. For the trade facilitation aspects, meetings were held with freight forwarders, representatives from the customs and port authority, and other relevant members of the private sector. The findings in this report were discussed and validated in July 2006 with industry stakeholders in two Consultative Workshops (textile and shrimp), Ministry of Trade, and other concerned Ministries and government agencies. The main issues raised by industry stakeholders are discussed in this paper, together with some actionable public policy and private sector recommendations for remedying them based on international experience and practices observed in countries competing with Indonesia within the region and beyond. These recommendations will provide inputs to the trade policy agenda which is currently being developed by the Indonesian Ministry of Trade. The main highlights are presented below.
1 Advisory and technical assistance facility of the World Bank and the International Finance Corporation. 2 The team gratefully acknowledges inputs from P. S. Srinivas, Megawati Sulistyo, as well as the Independent Research Advisory. Useful comments and consultations with several persons are acknowledged including, Kurnya Roesad, William James, William Wallace, Vincent Palmade, Leiping Wang, Migara Jayawardena, Michael Lane, Geoff Willis, Kelly Bird, Dorsati Madani, Ed Scura..
3
IMPROVING INDONESIA’S COMPETITIVENESS: CASE STUDY OF TEXTILE AND FARMED-SHRIMP INDUSTRIES
EXECUTIVE SUMMARY
Key Issues and Suggested Recommendations I. Textile and Apparel Industry:
Key Challenges in Indonesia’s Textile and Apparel Sector: (1) Low level of investment in the Indonesian textiles sector in recent years has resulted in declining
technological profile and low productivity relative to key competing countries like India and China. Users of old spinning equipment (>10 years), for example, can expend more energy (costing 4% of sales) and use 60% more labor minutes per kg of yarn produced, compared to users of today’s newer equipment. Similarly, Indonesian firms which rely on shuttle looms can lose up to US$3.6 on variable costs for every 100m of fabric, and generate poorer quality products compared to factories in China and India with more updated machinery (See Annex 1, Table 1 & 2). Investment in new machinery upgrades is hindered by the poor perception of the sector as a “sunset industry”, limited access to finance (including supplier credit from equipment manufacturers) due to a history of high non-performing loans, and an adverse business environment that further undermines investor’s confidence. There are a number of initiatives underway to prop up investment in new equipment and technology. For example, the Ministry of Industry has developed a proposal for a “collect fund” which will provide subsidized capital to export oriented firms in the textile industry to upgrade their equipment. Ministry of Industry is also holding discussions with financial institutions and equipment manufacturing firms to explore possibilities for expanding supplier credit. Lastly, measures to allow accelerated depreciation of old or outdated equipment are being discussed. This is already common practice in industries facing rapid technological changes in developed countries, but is yet so in Indonesia. Some specific recommendations regarding these measures are discussed later in the report.
(2) Weaknesses in trade facilitation measures expose the industry to rent seeking activities that may
significantly undermine future growth prospects in the industry. For example, weaknesses in trade remedy (anti-dumping) mechanisms and border management practices have allowed room for smuggling, dumping, illegal transshipment, and other rent seeking activities that expose the industry to unfair competition, undermine its image, and increase the risk of countervailing measures or bans from buyer markets. In addition, although import and export procedures have been streamlined significantly, inefficiencies in inbound and outbound logistics and infrastructure for sourcing inputs and delivering final products to market can still add up to 5% to production and delivery costs of a typical textile or apparel product (LPEM, 2005). These issues are discussed in more detail in subsequent sections of the report under Trade Facilitation.
(3) Although Indonesia’s energy costs are still very competitive at 4-6 cents/KwH, projected increases to 12-
14 cents/KwH may result in about 5-6% increase in production costs of textiles, if more energy efficient processes are not put in place at the firm level (See Annex 1, Table 3& 4).
(4) Delays in VAT refunds and imposition of advanced income taxes increase operational costs of doing
business. These delays can add up to about 9-13% of net profit for a company with $50m turnover
4
IMPROVING INDONESIA’S COMPETITIVENESS: CASE STUDY OF TEXTILE AND FARMED-SHRIMP INDUSTRIES
EXECUTIVE SUMMARY
business with a net profit of $2.5 million, at 10% interest rate on working capital (See estimates shown in Annex 1, Table 5) . In addition to VAT, there has been a rise in nuisance taxes and regulations imposed by local governments, which have increased the tax burden and administrative costs to the private sector. For example, some estimates show that bribery linked to nuisance taxes and regulations can add up to 4%-22% of production costs depending on the location (Kuncoro, 2004). The proliferation of nuisance taxes is a reflection of broader weaknesses in Indonesia’s national public finance management system to cope with the challenges of ongoing process of decentralization at the provincial level. Decentralization has put additional pressure on local governments to generate additional revenues that are separate from provisions given by the financial balance law of UU No 25/1999. As a result there has been a 13-fold increase in number of local regulations enacted since 2001, which has exhausted the limited capacity of the relevant departments of the internal revenue office responsible for supervising and ensuring that such regulations are in compliance with national fiscal management and competitiveness objectives.
(5) Low labor productivity and rigid labor market and policies cause accelerated increases in labor costs, and
undermine Indonesia’s low labor cost advantage – particularly for the apparel industry. These labor market rigidities derive from the current labor policies on overtime and severance pay system, minimum wage, and rules governing short term contracts. For example, in the absence of a functioning social security system, Indonesia’s severance payment system, by design, has become one of the most expensive in the world. This creates significant difficulties for firms to restructure in response to changing global market challenges.
In addition, current policy imposes a 40-hour week on the industry (as shown in Annex 1 Table 6) and applies statutory overtime rates which are directly proportional to the extra over-time hours worked. This policy sets incentives for workers to delay production until overtime periods when they can get higher pay. Hence it directly increases production costs and undermines the link between worker wages and productivity. Lastly, Indonesia’s minimum wage is reviewed almost annually, and many analysts argue that many of these increases were driven by short run interests in securing political support rather than immediate concerns about poor worker conditions or competitiveness of the industry. Minimum wage was said to have increased by 49% and 17% in Jakarta and Bandung respectively in 2000 and 39% (Jakarta) and 34% (Bandung) in 2001, while consumer price index only increased 7-13 percent (William James, 2003). In effect, it has resulted in rapid increases in cost of labor, which has had a direct impact on production costs of labor intensive industries – particularly the apparel industry.
(6) Together, these policies have created the incentive for firms to use contract labor rather than new employee hires. Here again, the current policy places certain limitations (as shown in Annex 1 Table 7) that result in less efficient use of contract labor and create disincentives for firms to invest in training and employee development activities. Reversing the impact of these policies will be difficult given their inherent political sensitivities.
(7) Need for stronger image and market development strategy. In particular, the rise in investor’s
negative perception of political instability and its associated impact on investment and sourcing decisions.
5
IMPROVING INDONESIA’S COMPETITIVENESS: CASE STUDY OF TEXTILE AND FARMED-SHRIMP INDUSTRIES
EXECUTIVE SUMMARY
(8) High risk of export losses from trade diversion due to higher average tariffs on textile and apparel products relative to key competitors in the US and other markets. Many competing suppliers of textile and apparel products to the US market (e.g. Pakistan, Vietnam, CBI countries like Nicaragua, and NAFTA countries like Mexico) have developed preferential trade agreements with US, Japan or the EU, which gives them a 6%-17% tariff advantage, on average, over Indonesia, as shown in Table 3. Thus Indonesia’s relatively higher tariff costs negatively affects the landed price of many of its textile and apparel products in the US market, hereby creating a disincentive for US apparel traders to source from the country. This relative difference in tariffs poses a risk of loosing market to lower tariff paying countries like Bangladesh, Vietnam, and Nicaragua etc. Bangladesh, for example, is one country that has significantly benefited from low relative tariff position in the EU market vis-à-vis other Asian producers because of the benefits it derives from the EU’s Everything But Arms (EBA) Agreement.
Suggested Recommendations (1) Improve Technology Profile and Productivity
Allow and establish guidelines for accelerated depreciation for tax purposes to support replacement of equipment and technology – particularly for firms with old and outdated equipment of over 10 years.
Conduct a systematic analysis of perceptions of major equipment manufacturers about attractiveness of Indonesia for supplier credits. Create a better enabling environment for machine makers in Japan & EU to get more involved in the supplier credit market. Discussions with some foreign supplier credit companies and financial institutions and their insistence on government guarantees suggest that investor confidence in the supplier credit market in Indonesia is hindered by both political and commercial risks. The Ministry may, therefore, need to proactively address this issue by exploring underlying causes and measures for addressing them such as export insurance, political risk insurance and other schemes with institutions like the Multilateral Investment Guarantee Agency (MIGA).
Collect Fund – Review current plan. Also thoroughly review performance of other countries’ incentive schemes such as India’s Textile Up-gradation Fund Scheme to ascertain usefulness, feasibility, and best fit for Indonesia.3
(2) Reducing Impact of Smuggling, Illegal Transshipment, and Cost of Inbound and Outbound Logistics
See section on trade facilitation
(3) Reducing Impact of Rising Energy Costs
Establish National Textile Energy Efficiency Scheme (TEES). The scheme will help firms overcome barriers to energy conservation including: – inadequacy of knowledge, lack of information, and high investment costs that may be required to re-engineer production processes to become more energy saving. Energy scheme should be intricately linked to the technology improvement recommendations described in (1) above. The TEES will also provide a sound basis for Indonesian
3 There is mixed evidence about the efficacy of schemes such as the TUFS.
6
IMPROVING INDONESIA’S COMPETITIVENESS: CASE STUDY OF TEXTILE AND FARMED-SHRIMP INDUSTRIES
EXECUTIVE SUMMARY
firms to focus technology up-gradation on environmentally friendly technologies and practices that will further enhance the industry’s image abroad.
The current practice of ad hoc applications of tariff rates across firms based on individual firm level negotiations is promoting uncertainty, rent seeking opportunities and lack of transparency. Promotion of mechanisms to apply/implement the tariff structure in a consistent and transparent manner across industries and monitoring of negotiating mechanisms, to minimize opportunities for discretion and rent seeking activities are critical.
Facilitate easier access to equipment and technology for alternative energy products and services.
(4) Reducing Impact of Domestic Taxes on Operational Costs
Elimination of advance income tax on imported processed materials. Modify and scale up current tax payer profiling system to a more elaborate risk-
based system anchored on intelligent profiling, and backed by effective streamlined post-refund audits.
Reform VAT refund processing in line with IMF Fiscal Affairs Department recommendations (IMF 2006), including:
o Mandatory requirements for VAT refund processing time of 10 days. o Provide for interest payments on delayed refunds after 30 days of receipt of
refund claim. o Reduce administrative procedures for VAT refund claims—
Eliminate requirement of original copies of purchase and sales invoices.
Streamline methods auditing of refund claims. Reduce information required in VAT tax return from 175 fields to
17 fields. Strengthen capacity of tax office to improve performance of the VAT refund
process. This could include empowering the tax authority to make use of third parties (e.g. external auditors, chartered accountants etc) that will speed up verification process for refund claims.
Strengthen central government review team to improve scrutiny of nuisance tax, regulations and levies imposed by local governments.
Benchmark administrative barriers and cost of compliance to regulations at the provincial or local government level to monitor impact of nuisance taxes and regulations.
(5) Improving Labor Productivity
Establish a productivity improvement centre (PIC), possibly working from an existing educational facility (e.g. ITB) in Bandung, with expertise provided from overseas.
Develop a textile and apparel education plan to support long-term growth and development of the industry.
Based on practices in comparable countries, the GOI should continue exploring some of the following important considerations. o Reduction in frequency of changes to minimum wage and limited government
involvement in the establishment of overtime rates and policies within firms.
7
IMPROVING INDONESIA’S COMPETITIVENESS: CASE STUDY OF TEXTILE AND FARMED-SHRIMP INDUSTRIES
EXECUTIVE SUMMARY
o Costs and principles guiding severance pay system should be aligned with regional and global practices and benchmarks. Severance pay system should be linked to sustainable deferred compensation schemes (e.g. by encouraging a more sustainable joint savings scheme between employer and employee to cater for job loss contingencies). Reforms of severance pay should be accompanied by reforms that improve the functioning and integrity of the social security system.
(6) Strengthening Industry’s Image and Market Development Strategy
Intensify and improve effectiveness of joint government and industry approaches to market promotion such as joint public-private participation in trade fairs, trade delegations, etc. including design, financing, and implementation of such initiatives.
Adopt practical business development measures such as providing incentives like office and warehouse space to global sourcing companies to set up sourcing centers in Indonesia, to stimulate knowledge and interest of global apparel buyers.
Develop a strategy to address growing investor’s negative perception of political instability in the country and its associated impact on investment and sourcing decisions of global textile and apparel traders and suppliers.
API needs to enlarge its focus on issues related to marketing and image building as it affects apparel exports, which is currently the dominant segment of Indonesia’s textile and apparel exports to the US market. One possible reason why the association’s focus on marketing and image building is not as strong is because its membership is predominantly textile manufacturers – hence apparel firms may not have a strong enough representative voice. Indonesia’s textile and apparel firms may draw lessons from other countries. In most of countries the apparel association is a separate entity distinct from a textile association (where it exists).
(7) Dealing with Risk of Trade Diversion Caused By Differentiated Global Tariffs of Textile and
Apparel Products Focus on improving productivity and reducing costs of doing business as important
steps towards counterbalancing the effect of tariff advantages in the short to medium term, and positioning Indonesia as the sourcing destination of choice in the long run.
Intensify support for multilateral trade agreements that facilitate global tariff reduction through the WTO framework. This would help reduce cost of access to a wider variety of major markets (US, EU, and Japan).
II. Farmed Shrimp Industry
Key Issues in Indonesia’s Farmed Shrimp Sector: (1) Weak enforcement of existing aquaculture product and process standards, technical and other
regulations. There were more than 50 “rapid alerts” in 2005 of Indonesian shipments of fisheries products that failed to comply with health conditions of fisheries products more broadly. This could very well lead to the EU placing a ban on fisheries imports from Indonesia, which can be costly. For example, the EU ban on imports from Thailand was estimated to have cost the industry about US$15m within 5 months
8
IMPROVING INDONESIA’S COMPETITIVENESS: CASE STUDY OF TEXTILE AND FARMED-SHRIMP INDUSTRIES
EXECUTIVE SUMMARY
between August and December 1997. A similar ban cost Uganda between May and July 1999, which resulted in a loss of up to US$36.9m, with fishing communities loosing about US1m per month due to reduced prices on related commodity exports. Although the shrimp sector is doing relatively better with respect to managing food safety and quality in Indonesia, it is often lumped together with other aquaculture products such that the poor compliance with international standards in those other products may have negative spill over effects on the image of Indonesian shrimp. Hence Indonesia’s shrimp industry faces a generally high tendency for export bans in the EU due to increasing stringency of foreign food safety requirements amidst limitations in overall domestic standards and quality assurance practices and infrastructure available to the aquaculture industry. Areas needing improvement specific to the farmed shrimp industry include:
a. Improvements in the infrastructure for certification of farmed-shrimp
products – Industry stakeholders expressed particular concern with the speed, proficiency and accuracy of testing and certification services provides by some government laboratories.
b. Enforcement of standards and regulations to improve productivity and quality of hatchery operations – With respect to imports, there is need to ensure that hatcheries importing P. Vannamei broodstock handle the distribution process well to avoid contamination and spread of diseases. Limitations in enforcement of hatchery standards continue to pose risks for the industry (particularly for disease control).
c. Due to poor coordination between central and local government, the enforcement and application of the landscape bill at the municipal level is still unclear and inadequate in regulating modalities for locating farm sites. For example, with the development of farm sites in many areas there has been a failure to enforce the 1km green belt.
(2) Poor quality domestic brood stock used by domestic hatcheries to produce fry, significantly undermines
survival rates, productivity and quality of output from many farms. Availability, cost, and conversion efficiency of fry to shrimp is very important for long term performance of the farmed shrimp industry. In Thailand and Taiwan, for example, rapid expansion is believed to have started not only because price of hatchery-reared fry dropped below US$10 per one thousand post larvae in the mid-1980s (Y.C. Shang et al, 1998), but also because hatcheries became better at producing disease free fry by making investments in appropriate treatment systems. In Indonesia, over 70% of fry used by shrimp farms are sourced domestically (mainly cheaper non-SPF fry from domestic broodstock priced at $15 per piece compared to $27 from F1 quality or imported SPF broodstock). Farmers choose to use non-SPF fry because it is cheaper, without full cognizance of the trade-offs (i.e. using non-SPF fry can reduce annual spawn rate 4 times, and survival rates by about 70%). Hence, improvements in the use and handling of disease-free brood stock to produce SPF fry from hatcheries, and their subsequent use by shrimp-farmers can significantly increase productivity and profitability within the industry. Investments in maintaining disease status of P. vannamei brood stock is increasing, but little attention have been given to P. monodon broodstock. Among others, the GOI’s ban on exports of P. monodon creates additional disincentive for investment in better processes and systems targeted at achieving disease free status for P. monodon brood stock..
9
IMPROVING INDONESIA’S COMPETITIVENESS: CASE STUDY OF TEXTILE AND FARMED-SHRIMP INDUSTRIES
EXECUTIVE SUMMARY
(3) Cost of shrimp feed is high relative to competing countries. Feed/ton cost in Indonesia is about 2 times the price in Panama, and prices are about 15% and 40% more expensive than in Thailand and China respectively. This high cost is driven by a number of factors:
a. The import content of ingredients used to produce shrimp feed in
Indonesia (e.g. fish meal, soybean meal, wheat flour, pre-mix containing vitamins etc) is higher than those in China and Thailand.
b. Although finished fish feed products is duty exempt; imports of key ingredients such as fish meal attract tariff rates of up to 2.5%, except for pre-mix which has a tariff of 15%.
c. Attempts to replace imported fish meal with locally produced meal have not been successful because the quality (e.g. salinity, protein content, etc) of locally-produced fish meal is too variable given the tropical multi-species nature of the fishery in Indonesia. For example, one key difference in quality is that cold water fish have a much higher levels of the essential omega 3 fatty acids, as compared to tropical fish.
d. Many feed mills still sell feed that is formulated for P. monodon which requires much more expensive marine protein in the ingredients than what is required for P. vannamei.
(4) Poor management practice at the farm level significantly undermines shrimp-farm productivity. Poor
feeding practices and indiscriminate use of antibiotics are important examples of how poor farm management practices impact the industry’s survival and competitiveness. In Indonesia, poor feeding practices prevents the realization of higher feed conversion ratios (FCRs), while the indiscriminate use of antibiotics and chemicals for disease control threatens the reputation of the whole industry in export markets. There is limited focus on disease prevention through activities like site selection, design and sustainable farm management coupled with poor water management, pond management, and effluent discharge. Government extension services to support knowledge management among farmers have been limited, and the use of plasma schemes linking small farmers to large producers, exporters or processors have yielded mixed results.
(5) Increasing business environment costs/constraints accentuate cost of production. These include:
Shrimp processors have limited access to finance to upgrade their equipment and facilities.
The negative impact of local regulations – so called “nuisance regulations” – on cost of production. A study carried out by SMERU research institute (2002) in Garut (West Java) and Gorontalo (North Sulawesi), for example, found that these regulations increased operational cost of aquaculture farms by up to 7%.
Estimates are that every 6% increase in electricity tariff would result in a 3% increase in cost of energy for shrimp processing. Hence, projected increases from 4-6 cents/KwH to 12-14 cents/KwH may result in a 50% increase in energy costs for shrimp processing.
(6) Need to develop a stronger image and market information and promotion strategy - Many shrimp
farmers and processors express concerns about “the image problem” with regard to Indonesian shrimp, and the perception that buyers in export markets have of Indonesian shrimp products. Results of interviews with buyers in key export markets suggest that buyers in fact generally view Indonesia’s performance rather favorably on almost all
10
IMPROVING INDONESIA’S COMPETITIVENESS: CASE STUDY OF TEXTILE AND FARMED-SHRIMP INDUSTRIES
EXECUTIVE SUMMARY
aspects that may influence Indonesia’s image including – overall quality (taste, freshness, texture); price; value for money (i.e. a combination of quality and price); product ranges available; consistency in the range of sizes available; consistency in seasonal supply; speed to market; ease of communication and doing business (e.g. language); traceability; and the ability to meet special buyer requirements. The main area of weakness is perceived to be the industry’s ability to maintain the quality and safety standards.
Suggested Recommendations: (1) Measures to Improve Application and Enforcement of Quality Standards
Implementation of government action plan presented to EC. Activities specified in the Plan are similar to those that are being successfully implemented in other exporting countries (e.g. Thailand, Bangladesh), and the Plan therefore represents a ‘must do’ action in order not to let Indonesia’s competitive position slip behind other exporters.
Improve enforcement of hatchery standards. This action will require MMAF to develop a documented strategy for areas/hatcheries to be inspected based on a prioritization of problem areas and production volumes for fry. The documented strategy should specify appropriate budgets and manpower allocations, as well as a timetable. It should also set priorities for key areas (geographical and by issue) where weaknesses in enforcement are especially apparent. A review of potential distributional and production impacts of enforcing hatchery standards would also help inform better targeting of policy support to improve hatcheries.
Construction of ‘shrimp clinics’ in key hatchery production areas based on public-private partnership (e.g. between MMAF and the private sector) and transparent criteria (e.g. main production volumes and farming areas, propensity for disease outbreaks, location of hatcheries etc). Shrimp clinics will help improve prospects for testing for disease at the hatchery level and prior to stocking and production4. Shrimp clinic would also help farms to test PL prior to stocking.
Step up coordination among central and local government to increase enforcement and monitoring of compliance with the landscape bill.
(2) Measures to Improve Productivity:
Improve extension services on best management practices at farm level. Based on public-private participation and on criteria that ensures best use of resources without duplication of effort.
Setting up “one-stop-aqua-shops” – this is an interesting development being pioneered by the STREAM initiative (see www.streaminitiative.org). Basically they are mobile shops/service providers selling products and assisting farmers with access to up to date information - they are also supposed to assist farmers to access government services and also with farm registration/licensing applications. They can provide a range of services - the most important feature is that they are set up by entrepreneurs and are basically a service driven consulting mechanism. Advice
4 There are also important issues related to what is being tested for, since only known diseases can be tested for and usually only for two or three major ones (i.e. white spot, taura, and a couple of emerging viruses). Also details of where such facilities should be located, the exact nature of services to be provided, how numerous they should be, cost recovery for investment and running costs, etc also need to be worked out
11
IMPROVING INDONESIA’S COMPETITIVENESS: CASE STUDY OF TEXTILE AND FARMED-SHRIMP INDUSTRIES
EXECUTIVE SUMMARY
and services drive sale of other products. The advice may not always be independent and in Thailand at least usually requires the farmers (or pressures the farmer) to purchase products (many of which may not be that useful). Feed agents and more reputable chemical suppliers are generally better, but again often all the farmers need is advice. Shrimp clinics proposed above can also serve a dual role of providing advice to the farmers.
(3) Measures to Reduce Costs and Constraints to Production
Improve efficiency of use of energy and transparency of energy policy. (See Action 4) under Textiles and Apparel section.
Review labor incentive schemes/payments for productivity. (See Action 3) under Textiles and Apparel section.
(4) Reduce Impact of Tariff, Non-tariff Barriers and Domestic Taxes on Operational Costs and Incentives
– unlike the textile and apparel industry, the impact of tariff disadvantages due to preferential agreements in other countries does not affect the shrimp industry. However, other recommendations (see Action 1) related to trade facilitation (e.g. increased border management and measures to stem illegal transshipment), as well as actions to reduce impact of taxes (see Action 5) under Textiles and Apparel section also apply to the farmed-shrimp industry. Other recommendations specific to the industry include:
Address the following issues associated with imports of inputs:
Increasing the validity of import permits from 6 months to 1 year. Pursue further reduction in tariff rates on key ingredients especially pre-mix
which has a tariff of 15%. Remove the ban on the export of P. monodon broodstock to maintain
competitiveness (Ministerial Decree 146/MPP/KEP/1999). At the minimum, pursue other less damaging policies such as export licensing control systems, use of export taxes etc, rather than an outright ban on exports.
(5) Measures to Improve Branding and Image in Key Markets
Undertake marketing study into the feasibility/requirements of diversifying export markets and products.
Develop on-line and offline market information tool as a ‘one-stop shop’ for exporters in Indonesia, including accurate industry data, international data on prices, market trends, legislation, benchmarking, and experiences of problems and successes.
Step up ongoing bilateral trade negotiations, with associated strengthening of MoT staff in this area if necessary, with focus on issues related to market access/constraints (e.g. tariff, sanitary standards, technical issues, and non-tariff barriers).
III. Broader Trade Facilitation Issues:
Key Trade Facilitation Issues Affecting Production and Export Performance in Textile and Farmed Shrimp Products in Indonesia (1) Indonesia’s malfunctioning trade-remedy mechanisms (antidumping and safeguard measures). It takes
excessively long time (> 12 months) to resolve cases related to dumping and subsidies in
12
IMPROVING INDONESIA’S COMPETITIVENESS: CASE STUDY OF TEXTILE AND FARMED-SHRIMP INDUSTRIES
EXECUTIVE SUMMARY
Indonesia. It was reported that in one case involving dumping, the decision took 3 years to reach the enforcement stage. To date, KPP has ruled on only one case.
(2) Irregularities in border and documentation management. Speed money at the going market rate
of 150,000 to 200,000 Rupiah per container (a range reported by two Indonesian freight forwarders) is a nuisance in comparison to the uncertainty and unpredictability of the formalities that adversely affects just-in-time supply chain management. The lack of transparency encourages rent seeking behavior where knowing how and what amount to pay off the officials is an important art to acquire in order to save time and frustration in cargo clearance. Also poor border and documentation management has left room for Illegal transshipment activities. Concrete quantitative evidence of illegal transshipment in the textiles industry is mixed and estimates of magnitudes vary widely,. Although the variance is high, their negative impact on Indonesian textile industry’s reputation is not. Incidences of illegal transshipment attract media attention. They could result in increased scrutiny and severe action by trading partners that could hurt legitimate textile producers and the industry as a whole. As such, the industry and the government need to be proactive in ensuring that the potential for such practices are minimized, as much as possible, in collaboration with their trading partners. The GOI is aware of these issues, and is taking some steps to address them, as discussed in the section 4 of this report on Trade Facilitation.
(3) Mixed performance of Indonesia’s EPZ schemes Suggested Recommendations: (1) Reduce cost of input and output logistics5
Improve time and costs of customs inspection, border control and terminal handling through streamlining policies and procedures (e.g. delays and fees associated with loading containers into vessels, documentation, procedures for transmitting letters of credit, EDI, port charges etc).
Develop training programs to help improve service quality of logistics operators. (2) Reform corrupt border management practices to secure a safe and efficient border
Create a Customs Ombudsman to investigate and resolve complaints concerning Customs to protect traders’ rights.
Develop a good up-to-date register that tracks the compliance history of the country’s traders in order to distinguish between high risk and low risk traders.
Establish a risk based procedure for border management based on international best practices, supplemented by a Single Window tool to free up enforcement resources from high volume traders with low risk to importers that pose higher risks of undervaluation and other forms of non-compliance.
Establish an official and remunerative salary that strengthens the integrity of the Customs system and upholds the officers to a higher standard of conduct.
5 Some of these recommendations are highlighted in the LPEM report (2006)
13
IMPROVING INDONESIA’S COMPETITIVENESS: CASE STUDY OF TEXTILE AND FARMED-SHRIMP INDUSTRIES
EXECUTIVE SUMMARY
Enforce zero tolerance policy against corruption supported by criminal sanctions and penalties for misconduct by both Customs and traders.
Establish strong internal audit unit for investigating all reports of misconduct, providing annual reviews of Customs operations, as well monitoring the compliance of the code of conduct.
Establish a forum for information exchange between traders and Customs to help both sides discuss operational issues.
(3) Strengthen Trade Remedy Mechanisms
Institute a single trade remedy regime to be administered by a single authority. Specify time deadlines for the different phases of work in the new law so as to
ensure that the investigation and reporting cycle is conducted properly and on time. Build up competency in administering the law, especially in investigating a case and
making recommendations on remedial measures, through better trained personnel and improved level of resources.
(4) Establish National Trade Facilitation Committee Structure the new entity by expanding the mandates of existing trade facilitation related organizations (the National Coordinating Board and the Coordinating Team for Enhancing Smoothness of Export and Import Goods) and consolidate them into one entity covering a wider area commensurate with trade facilitation objectives including:
Coordinating the modernization of border formalities, procedures and documentation used in international trade.
Formulating proposals and positions relating to trade and transport-related laws and regulations and practices.
Enhance awareness of emerging issues in trade facilitation.
(5) Clean Up Illegal Use of Certificate of Origin and Transshipment Activity On a partnership basis with the authorities of the importing country, introduce measures to protect the legitimacy of the transshipment country’s export manufacturers while at the same time exposing the scope of the problem, identifying the violators, and deterring future violations.
Adopt a high level of cooperation to enable the governments of the two countries to take special measures that support enforcement of respective laws and regulations, accuracy of claims of origin, prevention of circumventions of laws and regulations of either country, deterrence against transshipment, re-routing, false declaration concerning place of origin.
Take special measures to formalize the partnership through an MOU with the importing country that sets out the mechanism for authorities of both countries to verify documents and conduct on-site investigations of suspected shipments.
Ensure that the mechanism in the MOU addresses grounds for investigation, system of notification, mode of investigation, reporting and confidentiality arrangements, participation of experts and other relevant areas in the effort to stamp out illegal transshipment activities.
14
IMPROVING INDONESIA’S COMPETITIVENESS: CASE STUDY OF TEXTILE AND FARMED-SHRIMP INDUSTRIES
EXECUTIVE SUMMARY
As a precursor to the MOU, unilaterally take steps to build up capacity for ensuing partnership operation that would necessitate focus on the following areas:
The very existence of a company at the address given; The capacity of the factory/fish farm to manufacture/produce; Types of products being produced at the factory/farm; Employee capacity to produce the quantity of goods for export; Documentation on import and export of materials; Institutional capacity to conduct factory/farm checks; Regulatory capacity for levying fines, penalties, and other sanctions should
violations be found.
15
IMPROVING INDONESIA’S COMPETITIVENESS: CASE STUDY OF TEXTILE AND FARMED-SHRIMP INDUSTRIES
TEXTILE AND APPAREL VALUE CHAIN
II. Textile and Apparel Value Chain
Global Trends Influencing Competitiveness in the Textile and Apparel Industry
One of the most striking consequences of the removal of MFA restrictions on textile and apparel trade in 2005 is that retailers and designer companies from major importing markets (US, Japan, Europe) or elsewhere are now freer to source textile and clothing orders from the cheapest suppliers any where in the world – be it small economies like Nicaragua, Bangladesh, Nepal, Sri Lanka, or large producing giants like China, India, Pakistan and Indonesia. This increased flexibility in sourcing, coupled with recent improvements in supply-chain management techniques and technologies and increased global market power of large apparel buyers, has led to significantly higher degree of competition among supplier countries. As a major exporter of textile and apparel products, the future of Indonesia’s performance in this new environment depends heavily on the ability of its firms and policy makers to eliminate or reduce the impact of external and internal challenges that affect the industry’s ability to compete. External factors and trends that pose significant challenges and opportunities for textile and apparel exporting countries include. (1) General fall in average textile and apparel wholesale prices6 amidst global increases in costs of raw
materials (e.g. petroleum, energy, labor, mixed xylenes, ethyelene etc.). (2) Changes in technology along the entire value chain resulting in significant productivity differences between
old and new technologies, which is also fostering overcapacity in different segments of the chain. For example, today’s modern ring-spinning frames are 3 times more productive than those in operation 30 years ago. Open-end spinning is 4 times faster, while jet spinning produces more than double the output of open-end. A kilogram of yarn can be produced in less than 10 operator minutes today compared to several hours some years ago7.
(3) Increased diversification of textile and apparel imports from high to low cost producing centers. For
example, EU T & A industry is shifting production to North Africa, Turkey or Eastern Europe, while US is shifting towards CAFTA (CBI), ANDEAN, and ASEAN countries, and other low cost producers like China.
(4) Greater emphasis on competitiveness beyond questions of costs, to include other aspects of expanded
service capabilities like lead time, quality, reliability, flexibility, and so on. (5) Industry is becoming increasingly integrated into vertical supply chains leading to consolidation at the
country level, as well as dominance of global buyers that specialize in distribution and sales activities in key import markets.
6This has fueled significant increases in volumes as well as further reduction in prices that have largely benefited consumers and retailers in key apparel source markets – especially US. 7 Positive growth trends in synthetic yarn are driving further investment in texturing equipment. Most of the shipments of texture equipment have gone to Asia (mainly South Korea, India, and Taiwan) as a result of the growth of polyester fiber in the region. Similarly, weaving weft insertion rates in weaving have risen by a factor of 4-6 times, to over 120 weft-kms/hours.
16
IMPROVING INDONESIA’S COMPETITIVENESS: CASE STUDY OF TEXTILE AND FARMED-SHRIMP INDUSTRIES
TEXTILE AND APPAREL VALUE CHAIN
(6) Proliferation of Preferential Trade Agreements and Associated Trade Diversion Effects. The prevailing global trade policy regime still imposes significant tariffs that add to the total landed cost of textile and apparel products, in a manner that undermines competitiveness of countries that do not have preferential trade agreements relative to others that do (e.g. suppliers in the CAFTA, NAFTA regions as well as suppliers like Bangladesh, Pakistan, Vietnam etc that have developed preferential trade agreements with US, Japan or the EU). As at 2005, for example, while suppliers from Mexico, Israel, Colombia, Jordan, AGOA countries, and CAFTA-DR region paid average effective tariffs of 0.6%, 0.9%, 2.5%, 2.7%, 4.7%, 4.8% respectively, Indonesian firms were facing rates as high as 17% (William James, 2006).
(7) Re-emergence of Barriers to Trade in the Form of Safeguards, Antidumping and Countervailing Measures. For example, the increased growth and dominance of China’s share of the world textiles and apparel market in recent years, has been met by safeguards imposed by both the EU and the USA. The EU and China agreed to a deal last year that will restrain the growth of Chinese textile exports to the EU until end of 2007. Such safeguards imposed by the EU and the USA seem to have resulted in temporary benefits to other low cost suppliers such as Indonesia. Over 60% of Indonesia’s apparel exports fall within the category of products in which China faces restrictions. The value of US imports from Indonesia, in these export categories grew by 110% in the first quarter of 2006 from a decline of 27% in the same period in 2005 (William James, 2006)8.
(8) Rumors of Illegal Transshipment Activities are also increasing – a corollary of increased use of
safeguards and other “behind the border” policies (e.g. export restraints) which in effect act as quota restrictions. The reputational risk of involvement in illegal trading practices is very high for companies in the textile and apparel industry. In addition, social compliance policies require that the retail buyers need to know the factories where the product is made, these are inspected regularly and there are strict requirements on fabric and garment performance, methods of labeling, packing styles etc. involving visits by technicians and designers. These mechanisms would appear to inhibit any widespread application of illegal practices. However the emphasis on illegal transshipment in the media is increasing, which in turn may spur an increase in government regulatory attention to reporting requirements for traceability and establishment of rules of origin. Particularly for Indonesia, there is growing perception that the country has become a transit point for restricted Chinese apparel exports to the US, despite the lack of concrete evidence or empirical data supporting this view. More on illegal transshipment is discussed in Section 4 of this report.
The global textile and clothing markets remains complex, and there are many uncertainties. Recent changes in the global trade regime is resulting in winners and losers at both country, and company level, and creating a new mix of suppliers. For some countries like China, India, and Indonesia, the change in global textile and apparel market dynamics has been an opportunity to win greater exports and global market share overall. However, in the short-term many segments of the industry in these countries are facing external and internal
8 In the rush to get capacity in china in 2005 some large buyers began to realize problems with less established companies in the country. This has forced some of them to return to their preferred suppliers in Bangladesh, Vietnam, Indonesia and other countries
17
IMPROVING INDONESIA’S COMPETITIVENESS: CASE STUDY OF TEXTILE AND FARMED-SHRIMP INDUSTRIES
TEXTILE AND APPAREL VALUE CHAIN
disruptions that need to be addressed promptly in order to maintain long term competitiveness.
Indonesian Textile and Apparel Trade in a Global Context
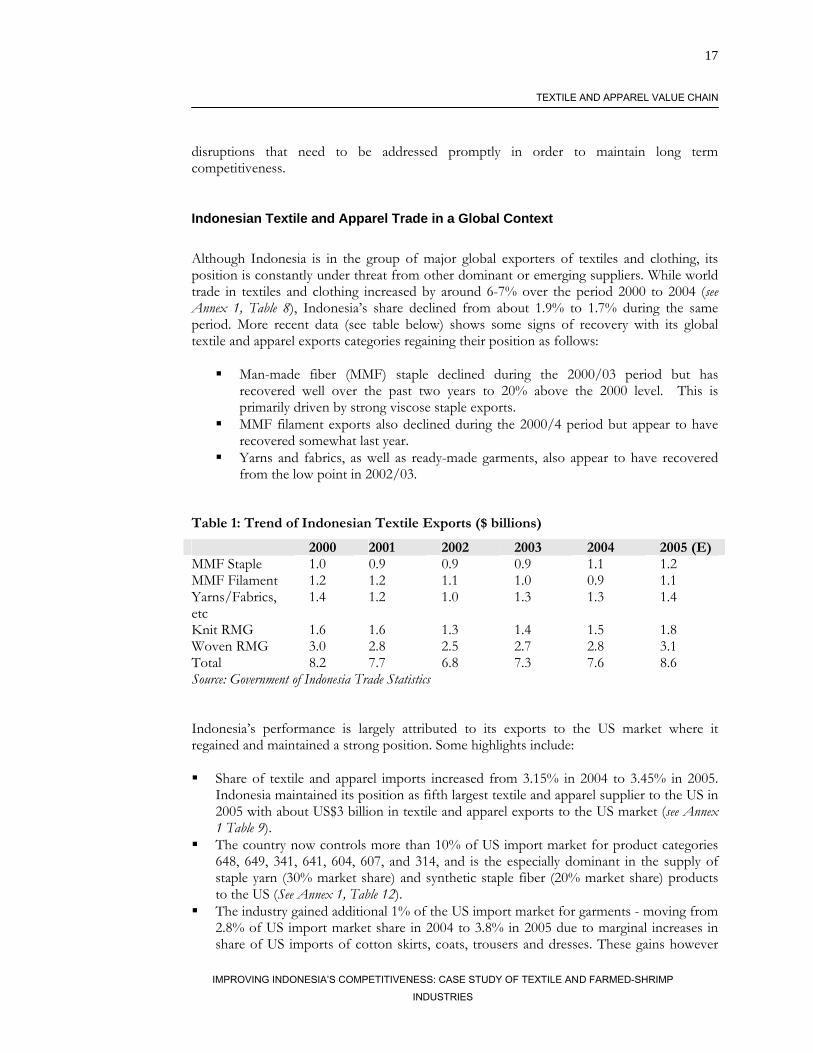
Although Indonesia is in the group of major global exporters of textiles and clothing, its position is constantly under threat from other dominant or emerging suppliers. While world trade in textiles and clothing increased by around 6-7% over the period 2000 to 2004 (see Annex 1, Table 8), Indonesia’s share declined from about 1.9% to 1.7% during the same period. More recent data (see table below) shows some signs of recovery with its global textile and apparel exports categories regaining their position as follows:
Man-made fiber (MMF) staple declined during the 2000/03 period but has recovered well over the past two years to 20% above the 2000 level. This is primarily driven by strong viscose staple exports.
MMF filament exports also declined during the 2000/4 period but appear to have recovered somewhat last year.
Yarns and fabrics, as well as ready-made garments, also appear to have recovered from the low point in 2002/03.
Table 1: Trend of Indonesian Textile Exports ($ billions)
2000 2001 2002 2003 2004 2005 (E) MMF Staple 1.0 0.9 0.9 0.9 1.1 1.2 MMF Filament 1.2 1.2 1.1 1.0 0.9 1.1 Yarns/Fabrics, etc
1.4 1.2 1.0 1.3 1.3 1.4
Knit RMG 1.6 1.6 1.3 1.4 1.5 1.8 Woven RMG 3.0 2.8 2.5 2.7 2.8 3.1 Total 8.2 7.7 6.8 7.3 7.6 8.6 Source: Government of Indonesia Trade Statistics Indonesia’s performance is largely attributed to its exports to the US market where it regained and maintained a strong position. Some highlights include: Share of textile and apparel imports increased from 3.15% in 2004 to 3.45% in 2005.
Indonesia maintained its position as fifth largest textile and apparel supplier to the US in 2005 with about US$3 billion in textile and apparel exports to the US market (see Annex 1 Table 9).
The country now controls more than 10% of US import market for product categories 648, 649, 341, 641, 604, 607, and 314, and is the especially dominant in the supply of staple yarn (30% market share) and synthetic staple fiber (20% market share) products to the US (See Annex 1, Table 12).
The industry gained additional 1% of the US import market for garments - moving from 2.8% of US import market share in 2004 to 3.8% in 2005 due to marginal increases in share of US imports of cotton skirts, coats, trousers and dresses. These gains however
18
IMPROVING INDONESIA’S COMPETITIVENESS: CASE STUDY OF TEXTILE AND FARMED-SHRIMP INDUSTRIES
TEXTILE AND APPAREL VALUE CHAIN
were offset by losses in other segments including a 5.45% loss in market share in the cotton poplin and broad cloth fabric – a category in which Indonesia enjoyed 17.89% market share as the second largest supplier in 20049 (see Annex 1, Table 10)..
US imports of both cotton and wool apparel has increased, although imports of silk apparel is down. Wool and silk products generally fall outside Indonesian’s top 40 textile and apparel exports to the US. Correspondingly, Indonesia’s market position in these product groups is far behind those of competing countries like China, India, and Pakistan.
MMF exports lost market share slightly in 2005, but the country still maintained its overall position as an important supplier. US imports of non-knit MMF shirts and blouses (Cat 641),10 MMF body support garments (Cat 649)11, and MMF slacks, breeches and shorts (Cat 648)12 from Indonesia in 2005 still accounted for 20.32%, 11.56%, and 11.08% of the market respectively. The biggest loss in market share (~4%) in MMF products came from the non-knit shirts and blouses – a category in which Indonesia had enjoyed 24.5% market share as the second largest supplier in 2004.
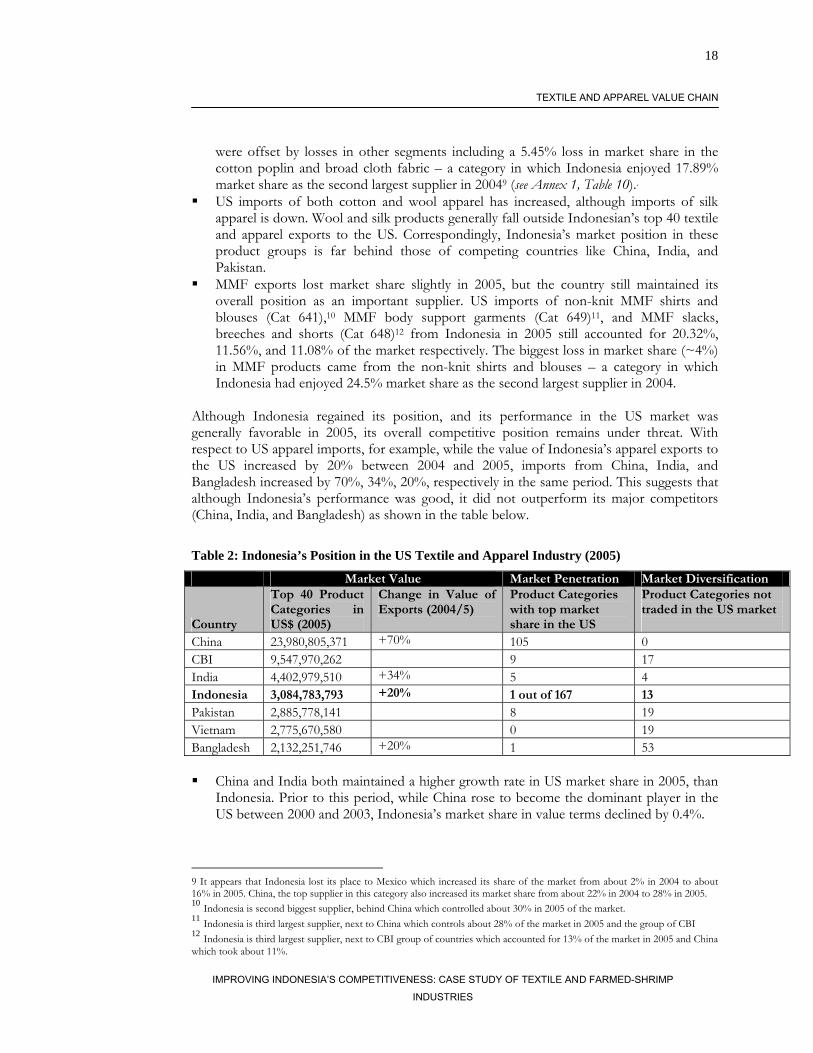
Although Indonesia regained its position, and its performance in the US market was generally favorable in 2005, its overall competitive position remains under threat. With respect to US apparel imports, for example, while the value of Indonesia’s apparel exports to the US increased by 20% between 2004 and 2005, imports from China, India, and Bangladesh increased by 70%, 34%, 20%, respectively in the same period. This suggests that although Indonesia’s performance was good, it did not outperform its major competitors (China, India, and Bangladesh) as shown in the table below.
Table 2: Indonesia’s Position in the US Textile and Apparel Industry (2005)
Market Value Market Penetration Market Diversification
Country
Top 40 Product Categories in US$ (2005)
Change in Value of Exports (2004/5)
Product Categories with top market share in the US
Product Categories not traded in the US market
China 23,980,805,371 +70% 105 0 CBI 9,547,970,262 9 17 India 4,402,979,510 +34% 5 4 Indonesia 3,084,783,793 +20% 1 out of 167 13 Pakistan 2,885,778,141 8 19 Vietnam 2,775,670,580 0 19 Bangladesh 2,132,251,746 +20% 1 53 China and India both maintained a higher growth rate in US market share in 2005, than
Indonesia. Prior to this period, while China rose to become the dominant player in the US between 2000 and 2003, Indonesia’s market share in value terms declined by 0.4%.
9 It appears that Indonesia lost its place to Mexico which increased its share of the market from about 2% in 2004 to about 16% in 2005. China, the top supplier in this category also increased its market share from about 22% in 2004 to 28% in 2005. 10 Indonesia is second biggest supplier, behind China which controlled about 30% in 2005 of the market. 11 Indonesia is third largest supplier, next to China which controls about 28% of the market in 2005 and the group of CBI 12 Indonesia is third largest supplier, next to CBI group of countries which accounted for 13% of the market in 2005 and China which took about 11%.
19
IMPROVING INDONESIA’S COMPETITIVENESS: CASE STUDY OF TEXTILE AND FARMED-SHRIMP INDUSTRIES
TEXTILE AND APPAREL VALUE CHAIN
Top 40 products from China, India, and CBI countries account for a higher share of the US market, relative to Indonesia – suggesting that the most important products from these countries sell more in the US.
China’s is the top supplier in 105 product categories in the US market, CBI region countries are the top exporters in 9 categories, and India is the top exporter in 5 product categories. In comparison, Indonesia is the top supplier in only 1 product category – staple yarn. This suggests that China, India and CBI countries have a higher degree of penetration in the US market relative to Indonesia.
US imports of Indonesian products are not as diversified as those of China and India. Chinese suppliers trade in all categories of US textile and apparel imports, while Indian suppliers are active in all but 4 product categories. This shows a very high degree of product diversification in both countries. In comparison, there are at least 13 product segments in which Indonesia does not export to the US.
Indonesia also faces stiff competition from emerging suppliers to the US market. Vietnam, Bangladesh and Pakistan, are showing a stronger positions in the US market, although their market share (in value terms) is still limited. One of the most formidable competitors here is Pakistan which was the top supplier in 8 product segments in 2005, and maintains a ranking as top-3 supplier in 24 product categories13, compared to Indonesia which ranked as top-3 supplier in 20 product categories14.
The above indicators suggest that both China and India are not only growing faster and trade in bigger volumes than Indonesia in the US market; they also enjoy a remarkable level of diversified penetration which further strengthens their ability to take advantage of economies of scope when exporting to the US market. In addition to intense competition in the US market, Indonesia’s textile and apparel industry also faces declining positions in Japanese and European markets. While Indonesia’s share in the Japanese fell by about 1.5% between 1995 and 2005,
China rose to become the dominant player accounting for 80% of the Japan imports of textile and apparel products in 2005. This is partly because the Japanese textile and apparel imports are dominated by product segments where Indonesia is currently experiencing declining competitive advantage.
Similarly, despite the 5.52% growth in the overall value of EU textile and apparel market, the value of Indonesia’s shipments of textiles and clothing to the EU fell by 12.7% in 2005, corresponding to a loss in market share of 0.41% (William James 2006).
In sum, Indonesia’s success in maintaining its market position in the post-MFA era is mixed, and further improvements will be more challenging going forward.
13 Partly due to its preferential trade agreement with the US 14 China ranked as top-3 supplier in 137 product categories while India ranked as top 3 in 35 product categories.
20
IMPROVING INDONESIA’S COMPETITIVENESS: CASE STUDY OF TEXTILE AND FARMED-SHRIMP INDUSTRIES
TEXTILE AND APPAREL VALUE CHAIN
Competitiveness of Indonesia’s Textile and Apparel Value Chain
Where Are the Big Gaps?
Indonesia potentially could benefit from these trends as a preferred supplier to global buyers, if certain constraints to industry growth and competitiveness are addressed urgently to position its firms accordingly. These constraints and challenges are summarized below: 1. Low level of investment in the Indonesian textiles sector in recent years has resulted in declining
technological profile and lower productivity Historically, periods of high performance in Indonesia’s textile industry have been closely related to periods of expansion or new investments in textile machinery and equipment (Hill 1994). Currently the technology profile in all the key segments of Indonesia’s textile value chain falls behind those of its main competitors, and this has different impact on different segments of the textile and apparel value chain. Overall, some analysts report that about 774 companies out of 4100 need to replace their old machinery. About 57% of the machines of textile and garment factories are 15 years old, 18% are 10-15 years old, 18% are 5-10 years and only 7% are below 5 years (Chongbo 2005). Some of the main weaknesses in technology profile of each segment of the textile and apparel chain are highlighted below: Technology Profile in Fiber Manufacturing. Of the top 5 exporters to the US market,
Indonesia is the only one that does not produce cotton. It imports cotton mainly from the US. To compensate for this, fiber manufacturing firms have to improve yield and minimize waste. The country’s fiber manufacturing sector comprises 19 producers of polyester staple and filament with a total capacity of 580 Ktpa of staple and about 800 Ktpa of filament. There are 2 producers of viscose rayon staple fiber with a combined capacity of 300 Ktpa, of which a third is exported. Domestic polyamide capacity is about 80 Ktpa across seven firms. Indonesia currently has no acrylic fiber production.
Capacity in long-staple spinning (i.e., for wool or wool substitutes) is insignificant, and other equipment
used for yarn manufacturing are older that those in China and India. The example in Annex 1, Table 1 and 19 shows the status of Indonesian spinning technology profile. Despite this profile the spinning sector in Indonesia has been able to take short-term export advantage of the change in the textile quota region and selling yarns (primarily for knitting) to the USA and EU. A lot of this is due to the price and capacity utilization advantages that have emerged due to the removal of quota limitations following the removal of MFA restrictions. Prior to this change Indonesia had limited yarn quota and quota trading added to costs (i.e. up to 30 US cents/kg) making the country less competitive. Now the market has opened but the most important criteria in export markets are yarn quality and price considerations. Without additional investments in better technology, Indonesia gains in this sector will not be sustainable because technology slippage will undermine competitiveness. Older technology not only increases costs of energy and raw materials per kilogram of yarn produced, but also produces relatively poorer quality. The advantage of new technology is illustrated in Annex 1, Table 1.
Indonesia’s technological profile in weaving is worse than most of its major competitors in the woven
fabrics sub-sector and investment in new weaving machines has been low over the past few years.
21
IMPROVING INDONESIA’S COMPETITIVENESS: CASE STUDY OF TEXTILE AND FARMED-SHRIMP INDUSTRIES
TEXTILE AND APPAREL VALUE CHAIN
For example, in 2004 when China’s growing private sector textile firms were installing 48,000 new shuttleless (SLL) machines, and India and Turkey were each putting in around 2000 machines, the weaving sector in Indonesia took delivery of only 150.
On the basis of a 3:1 speed ratio for shuttleless to shuttle, over 50% of the weaving capacity in China, Pakistan and Turkey is in shuttleless machines as shown in Annex 1 Table 19. However, in Indonesia it is around 30%, which is similar to India. About 82% of the shuttleless capacity in India is less than 10 years old whereas in Indonesia only 38% is less than 10 years old. Since shuttle looms have a lower capital cost but need higher labor, energy and maintenance requirements, recent rapid increases in labor and energy costs are likely to significantly undermine competitiveness of Indonesia’s weaving sector relative to China. As shown in Annex 1 Table 2, using shuttle instead of shuttles looms can add up to US$3.6 in variable costs (excluding capital recovery charges) for every 100 meters of woven fabric produced 15 and the fabric quality achieved by a shuttleless loom is usually higher. Hence discounts on selling price due to defects are much lower. Given the relatively lower use of shuttleless looms in Indonesia (Annex 1 Table 20), firms are likely to be operating with higher degree of defects and increased production costs compared to India and China.
Estimated capacity utilization in Indonesia’s knitting sector is about 50-60%. Sector data suggests
that the country’s position in this fabric forming process is also not as strong as those of it main competitors. For example, the leading supplier of needles suggests that the current national machine park is 8-10,000 circular machines. ITMF shipment data for the 1995-2004 periods suggests that about 30% of these machines are less than 10 years old. Additionally, shipments to Indonesia of flat-knitting machines have been negligible in the past decade, as shown in the Annex 1, Table 21.
Dyeing and finishing is generally operating on a single shift because of competitive pressures from China.
There has been very limited investment in dyeing and finishing in Indonesia, which limits the variety of fabrics that garment producers, can source from domestic textile industry. It is not surprising therefore that a high proportion of Indonesia’s garment production is based on imported fabrics.
In apparel manufacturing, improvements in shop floor production layout and the
sophisticated supply chain management systems for monitoring efficiency, quality and absenteeism are important critical success factors. The application of information technology is also another important area that is creating competitive value in the apparel industry. New technologies that facilitate exchange of point of sales data, fabric patterns and product designs are also helping to boost competencies of firms to better integrate into global apparel trade. Competitive advantage in also emerging from the application of cross-sectoral technologies where firms have embraced the combination of latest technologies of electronics innovation (e.g. nano-electronics) with smart clothing technologies16 to create more innovative high end value products in the foot wear industry, for example. However, although the importance and application of high
15 Capacity utilization in the weaving industry is estimated at 50-60%. In weaving Indonesia currently has a capacity of around 29,000 shuttleless looms (SLL) and about 200,000 shuttle looms (SL). These numbers have remained unchanged for the past 5 years indicating that little investment in the weaving sector has been made. 16 For example, Adidas’ incorporation of sensors, microprocessors and motors into running shoes to adjust level of cushioning during walking and running.
22
IMPROVING INDONESIA’S COMPETITIVENESS: CASE STUDY OF TEXTILE AND FARMED-SHRIMP INDUSTRIES
TEXTILE AND APPAREL VALUE CHAIN
technology is increasing17, competitiveness in the apparel industry remains driven by the cost and productivity of labor which is generally believed to be lower in Indonesia than China. Issues affecting labor competitiveness are discussed in subsequent sections of the report.
In the short period since the removal of MFA quotas in 2005, Indonesia firms have been able to exploit short term gains in a more liberalized market by simply increasing utilization of existing capacity. However this is not sustainable as the industry’s declining technological profile will significantly reduce input conversion efficiency in the medium to long-term, with fatal consequences on competitiveness. The situation can only be addressed by investments in machinery and equipment upgrades. Confidence to invest in recent years – particularly since the crisis - have lagged due to a variety of reasons including the uncertainties surrounding the changes in the textile quota regime, earlier economic crises in the country that has left many firms with debt and cash flow problems, and lack of support from the banking community. Chongbo (2005) also alludes to complaints from investors about lack of legal certainty, widespread corruption, inefficient bureaucracy and labor disputes that deter investor interests in the country. As such many investors are believed to have shifted to China and Vietnam where they can take advantage of better investment climate, lower wages and higher productivity. In the future one can expect further improvements in textile machine performance as well as increased emphasis on energy efficiency and the use of clean technologies. This does not necessarily mean higher speed but certainly better process control, improved productivity and product quality. Even in low wage cost countries the dictates of machine efficiency, reliability and control of quality means making use of modern technology. As machine speeds have increased so quality demands have risen. To remain cost competitive there is no option but to use the best equipment. The low level of investment in Indonesia over recent years resulted in a declining technological profile. To overcome this inertia Indonesia could draw on strategies that have been adopted by some other countries, which include:
Allow and establish guidelines for accelerated depreciation for tax purposes to support replacement of equipment and technology – particularly for firms with old and outdated equipment of over 10 years. In the US, for example, industries with rapidly changing technologies can apply accelerated depreciation for tax purposes.
Examine perceptions of major equipment manufacturers about attractiveness of Indonesia for
supplier credits, and create a better enabling environment for machine makers in Japan & EU to get more involved in Indonesia’s equipment supplier credit market. Discussions with some foreign supplier credit companies and financial institutions and their insistence on government guarantees suggest that investor confidence in the supplier credit market in Indonesia is hindered by both political and commercial risks. The Ministry may, therefore, need to proactively address this issue by exploring underlying causes and measures for addressing them such as export insurance, political risk insurance
17 Computers are used for setting standard times for each operation in the assembly of a garment (as exampled below) and for calculating daily production targets. Cutting operations in garment manufacturing are increasingly becoming more capital intensive.
23
IMPROVING INDONESIA’S COMPETITIVENESS: CASE STUDY OF TEXTILE AND FARMED-SHRIMP INDUSTRIES
TEXTILE AND APPAREL VALUE CHAIN
and other schemes with institutions like the Multilateral Investment Guarantee Agency (MIGA).
“Collect Fund” – The Ministry of Industry has a proposal to develop a fund, similar to
India Technology Upgradation Fund Scheme (TUFS), which would be used to stimulate and support technological upgradation in the textile and apparel sector. The merits of this type of approach are not well known, given that the India TUFS Model is still work in progress. As a first step, the GOI could conduct a thorough review of the TUFS to understand the pros and cons of the scheme, and the issues and usefulness in adapting the Collect Fund to fit the situation in Indonesia.18
2. Weaknesses in trade facilitation measures expose the industry to rent seeking activities that may
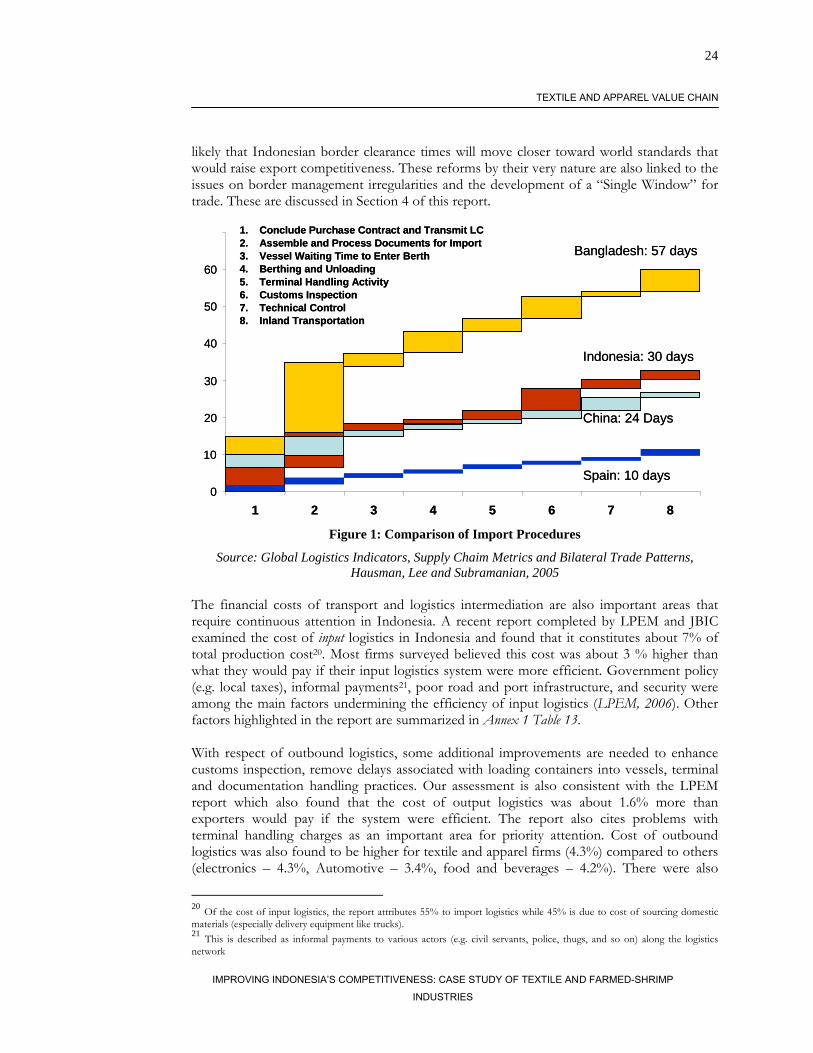
significantly undermine future growth prospects in the industry. For example, weaknesses in trade remedy (anti-dumping and safe-guards) mechanisms and border management practices have allowed room for smuggling, dumping, illegal transshipment, and other rent seeking activities that expose the industry to unfair competition, undermine its image, and increase the risk of countervailing measures or bans from buyer markets. In addition, although import and export procedures have been streamlined significantly, inefficiencies in inbound and outbound logistics and infrastructure for sourcing inputs and delivering final products to market can still add up to 5% to production and delivery costs of a typical textile or apparel product (LPEM, 2006). These issues are discussed in more detail in subsequent sections of the report under Trade Facilitation. With respect to inbound logistics, recent initiatives that provide for different channels of processing (green channel, red channel), reduction in number of inspections, and use of electronic data interchange (EDI) to facilitate filing Customs declaration forms and receipt of Customs decision have helped significantly to improve the flow and movement of goods. Particularly for Indonesia, textile and apparel firms seem to have been able take advantage of a more liberal trading environment to diversify their sourcing of textile and apparel product as shown in Annex 1 Table 14. The table shows that imports of textile and apparel products have shifted from high cost producers like Korea, Taiwan and Japan, to lower cost producers in China and the rest of the world within the last 5 years. However, as shown in Fig 1 below, there are important parts of the import process that still need attention (e.g. improvements in procedures for transmitting letters of credit, reduction in corruption and informal payments, terminal handling activities and charges, and improvements in the customs inspection process)19. The more challenging initiatives have yet to be undertaken, such as a comprehensive risk based inspection system, simplification and harmonization of documents into a single administrative document (SAD), and further streamlining of clearance procedures, all of which require more difficult reforms in Customs. Until deeper reforms take place, it is not
18 There is mixed evidence about the efficacy of schemes such as the TUFS. 19 For example, at the Port of Tanjung Priuk, the country’s main container port handling about 55% of the country’s containerized trade in which Jakarta International Container Terminal is the largest terminal operator, average clearance time (measured from the time of vessel berthing to Customs processing and eventual release) is nearly 6 days. Of this amount, Customs processing accounted for nearly 50% of the duration. In comparison, international practices from Japan (3.1 days), Germany (2 days), USA (2 days) and Singapore (1 day) were much superior to Indonesia.
24
IMPROVING INDONESIA’S COMPETITIVENESS: CASE STUDY OF TEXTILE AND FARMED-SHRIMP INDUSTRIES
TEXTILE AND APPAREL VALUE CHAIN
likely that Indonesian border clearance times will move closer toward world standards that would raise export competitiveness. These reforms by their very nature are also linked to the issues on border management irregularities and the development of a “Single Window” for trade. These are discussed in Section 4 of this report.
0
10
20
30
40
50
60
1 2 3 4 5 6 7 8
1. Conclude Purchase Contract and Transmit LC2. Assemble and Process Documents for Import3. Vessel Waiting Time to Enter Berth4. Berthing and Unloading5. Terminal Handling Activity6. Customs Inspection7. Technical Control8. Inland Transportation
Bangladesh: 57 days
Indonesia: 30 days
Spain: 10 days
China: 24 Days
Figure 1: Comparison of Import Procedures
Source: Global Logistics Indicators, Supply Chaim Metrics and Bilateral Trade Patterns, Hausman, Lee and Subramanian, 2005
The financial costs of transport and logistics intermediation are also important areas that require continuous attention in Indonesia. A recent report completed by LPEM and JBIC examined the cost of input logistics in Indonesia and found that it constitutes about 7% of total production cost20. Most firms surveyed believed this cost was about 3 % higher than what they would pay if their input logistics system were more efficient. Government policy (e.g. local taxes), informal payments21, poor road and port infrastructure, and security were among the main factors undermining the efficiency of input logistics (LPEM, 2006). Other factors highlighted in the report are summarized in Annex 1 Table 13. With respect of outbound logistics, some additional improvements are needed to enhance customs inspection, remove delays associated with loading containers into vessels, terminal and documentation handling practices. Our assessment is also consistent with the LPEM report which also found that the cost of output logistics was about 1.6% more than exporters would pay if the system were efficient. The report also cites problems with terminal handling charges as an important area for priority attention. Cost of outbound logistics was also found to be higher for textile and apparel firms (4.3%) compared to others (electronics – 4.3%, Automotive – 3.4%, food and beverages – 4.2%). There were also
20 Of the cost of input logistics, the report attributes 55% to import logistics while 45% is due to cost of sourcing domestic materials (especially delivery equipment like trucks). 21 This is described as informal payments to various actors (e.g. civil servants, police, thugs, and so on) along the logistics network
25
IMPROVING INDONESIA’S COMPETITIVENESS: CASE STUDY OF TEXTILE AND FARMED-SHRIMP INDUSTRIES
TEXTILE AND APPAREL VALUE CHAIN
differences in cost of outbound logistics by region, with the cheapest being Surabaya, which was about half the cost of the most expensive region – Medan. 3. Reducing Impact of Rising Energy Costs – where projected increases from US$0.4-0.5/KwH to
US$0.12-0.14/KwH are expected to raise production costs by 5-6%. There are two main concerns firms have regarding energy in Indonesia; (1) Rapid increases in costs of energy (2) The current practice of ad hoc applications of tariff rates across firms based on individual firm level negotiations is promoting uncertainty, rent seeking opportunities and lack of transparency. With regard to energy prices, current tariff from the grid is around 4-6 cents/Kwh, which appears to be at par, or lower than that of many competing countries (China 7.6, India 9.5, Pakistan 6.6, and Turkey 8.8). However textile firms in Indonesia are expecting electricity prices to double in the near future to about 12-14 cents/Kwh22.23 These changes will have significant implications for cost competitiveness since electricity costs account for 8-15% of total costs of production in the textile industry. Drawing on estimates that a 20% real increase in fuel and energy costs would translate into an increase of around 1-1.2% in total textile production costs (William James et al 2003), one can expect a doubling of electricity tariffs to result in about 5-6% increase in production costs. Similar estimates can be deduced from a value chain study that was conducted by IRA in 2005. To remain competitive at this level, the industry will have to embark on large scale energy efficiency measures, inclusive of technology up-gradation. Rising energy prices are also a binding constraint for Indonesia’s competitors. Heavily industrialized areas of China have power demand exceeding supply which is causing interruptions and encouraging larger companies to move to self-generation, based on coal. India’s textile sector lived for years with high grid prices which forced producers into self-generation but mostly using diesel power generation. Many firms in both countries have also upgraded their machinery to more modern ones that are more energy efficient. They also participate in energy audits to monitor and improve their efficiency of energy use. Indonesia can learn from these examples. Investment in better technology is a necessary and significant first step reducing the negative impact of rising energy costs on competitiveness. The latest textile technologies use less energy per unit of output so that as the machine parks in Indonesia are upgraded energy consumption efficiency should improve. For example, higher speed shuttleless looms not only produce a better quality of fabric than shuttle looms, they also use less energy per meter of fabric made and require less labor inputs (as shown in Annex 1 Table 1). Improving energy efficiency should not be about realization of energy savings alone. In addition, re-engineering production processes to become more energy saving, should be accompanies by choice of technologies upgradation that is more environmentally friendly. For example, because electricity and water have been very cheap in Indonesia, many textile firms may have production processes in place that emphasize a lot of wetting and drying activities, compared to firms in other countries (e.g. India or Turkey) where costs of
22 New entrants expect to pay about 12- 15c/KwH. Case by case negotiations with PLN cause uncertainty and according to firms interviewed provide opportunities for rent seeking. 23 The Java Bali Power Restructuring and Strengthening Project (World Bank) will address selected energy policy issues.
26
IMPROVING INDONESIA’S COMPETITIVENESS: CASE STUDY OF TEXTILE AND FARMED-SHRIMP INDUSTRIES
TEXTILE AND APPAREL VALUE CHAIN
electricity are significantly higher. Thus current manufacturing processes are likely to be less considerate about water conservation and use, compared to India or Turkey. Stakeholders in the industry would need to develop a national Textile Energy Efficient Scheme (TEES), with motivational incentives, and possibly supported by external technical assistance, to help firms manage the transition. The scheme will help firms overcome barriers to energy conservation including: – inadequacy of knowledge, lack of information. As an example, a summary of energy efficiency scheme in Taiwan is provided in Annex 1, Table 15. At the level of government, the GOI will need to strengthen coordinating mechanisms among key government actors, and improve availability of information on current and future trends on energy technology, cost and usage24. It is also important to disseminate information about the relative position of the country’s power rates, particularly at a time when energy costs are rising around the world, and to apply energy policy equitably. Despite an elaborate tariff rating structure that exists, the practice of ad hoc applications of tariff rates across firms based on individual firm level negotiations is promoting uncertainty, rent seeking opportunities and lack of transparency. There is a critical need to force mechanisms to ensure consistent and transparent application of tariff rates and monitoring of negotiating mechanisms. In addition, those companies seeking to establish their own generation capacity need to be supported through easing of permits and licenses. Therefore, the procedures for securing permits also need to be reviewed and streamlined. Some firms also expressed interest in a more robust energy policy that allows for sale of excess power generated to the national grid. This would enable more investment in larger scale energy projects that can help stimulate capacity and supply of electricity in the country. 4. Reducing Impact of Domestic Tariffs and Taxes on Operational Costs
a. Impact of Tariffs and Advanced Income Taxes
Import tariffs and duties do not seem to affect cost of sourcing for export oriented T&A firms. The prevailing duty-draw back and bonded-ware house scheme in the country appears to have been beneficial to textile and apparel producers in that it provides them access to imported raw materials without the additional costs associated with tariffs and duties. With respect to yarn production, cotton imports are free of duties. About US$650 million (CIF) worth of cotton is imported per annum. Likewise, because the textile sector uses a high percentage of man-made fiber staple from local producers (i.e. polyester and viscose) duty on imports of polyester and viscose is only 5%, and is reimbursable if the final product is processed and exported. There are two local producers of viscose and nine makers of polyester staple fiber (PSF). In the case of apparel imports, there is a 15% duty on garments imports, a 10% BPN (i.e. value added tax), and 2½% advance income tax (BPH). This tariff rate not only appears high enough to shield apparel producers from foreign competition, the advanced income tax also serves as an additional tax since it does not appear to be offset on a l:l basis against corporate tax. Accordingly, legitimately import sourced retail clothing products are high priced in Indonesia and there is thus a strong incentive to smuggle to avoid these taxes.
24 See http://www.aseanenergy.org/energy_organisations/eecssn/indonesia/barriers.htm
27
IMPROVING INDONESIA’S COMPETITIVENESS: CASE STUDY OF TEXTILE AND FARMED-SHRIMP INDUSTRIES
TEXTILE AND APPAREL VALUE CHAIN
Some analysts also argue that Indonesia’s exemptions and duty drawbacks are in favor of imported inputs and have led processing companies not to integrate with industries supplying domestic substitutes (Maidir et al, 2003). Many domestic companies that are not direct exporters do not benefit from the duty drawback or bonded warehouse schemes. They also do not get VAT refunds. As a result, they are input-taxed, and are at a competitive disadvantage compared to imports of intermediate goods to the exporting sector.
b. Impact of Delayed VAT Refunds
Indonesia’s VAT system has many international best practice features that allow segments of any industry value chain to remain in a revenue neutral position. Some of these features include: (1) VAT is based on a same single rate for all (i.e. 10%) (2) VAT on investment expenditure is refunded (3) Exports are zero rated while imports are subject to VAT based on destination principle (4) Cross checking of claims for credits for VAT included in input prices with VAT payments by input suppliers is possible (5) Transactions through retail are subject to VAT (Marks, 2003). However, although these taxes and duties may be rebated at the time of export of the resultant product a time lag between entry and exit (usually between 6 months – 1 year) has to be financed through a firm’s working capital. Without a prompt refund process VAT paid by exporting firms and their intermediate suppliers could effectively become a production or export tax. A 12 month delay in VAT refund can add up to about 9-13% of net profit for a company with $50m turnover business generating a net profit of $2.5 million, at 10% interest rate on working capital. Uncovering the cause(s) of these delays would require a more in depth study. Generally delays in VAT refunds could be due to any or some of the following: Complexity of the VAT system itself and the administrative prowess and resources
required to manage it. For example, In 1999/2000, firms whose annual turnover of taxable goods fall below Rp. 240m, or Rp. 120m for taxable services were allowed to register for VAT. This resulted in over 390,000 registrants, of which only about 13% paid VAT. Of this, about 30% accounted for over 90% of the VAT tax collection in 2000 (KPMG, 2000). As a result, a lot of administrative resources at the time were devoted to a large group of registrants that pay little or no VAT. There has been a lot of progress with improving tax administration in Indonesia since 2002, with the implementation of the DGT’s modernization program.
Level of difficulty the tax authority faces when validating legitimate claims before making refunds. This includes the tax authority’s ability to separate registered from unregistered trading that are eligible for refunds. As part of its current tax administration modernization strategy, the DGT is considering a strategic review of enforcement programs and measures for dealing with unregistered tax payers. There are also plans to design and implement new audit methods.
Complexity of the VAT audit processes and prevailing statutory requirements to prevent VAT fraud or evasion. Prevailing statutory requirements could impose 100% inspection and audit regimes that place significant burdens on administrative resources of the tax office, for instance, rather than risk based methods that are more cost effective. A more recent review of the tax reform proposals carried out by the IMF in July 2005 suggests that new models of segmenting tax payers are being explored in Indonesia, but there are still a number of provisions (e.g. ~100% audit of VAT refund claims and tedious
28
IMPROVING INDONESIA’S COMPETITIVENESS: CASE STUDY OF TEXTILE AND FARMED-SHRIMP INDUSTRIES
TEXTILE AND APPAREL VALUE CHAIN
information and documentation requirements) that impose undue burden on VAT tax payers and slow down the refund process.
Poor budgeting for VAT refunds which may lead to inadequate provision of sufficient funds to meet legitimate VAT refund claims. Poor budgeting may be linked to weak state capacity to forecast VAT refund levels. And the extent of cooperation, especially information sharing, that exists between the tax authority, customs, registrar of companies and other relevant agencies.
A review of the tax administration system in Indonesia was completed by the IMF in March 2006. The report made the following recommendations regarding the VAT system that could help reduce cost of delays in VAT refunds. Reform VAT refund processing in line with IMF Fiscal Affairs Department
recommendations (2006), including: o Mandatory requirements for VAT refund processing time of 10 days. o Provide for interest payments on delayed refunds after 30 days of receipt of
refund claim. o Reduce administrative procedures for VAT refund claims—
Eliminate requirement of original copies of purchase and sales invoices.
Streamline methods auditing of refund claims. Reduce information required in VAT tax return from 175 fields to
17 fields. Strengthen capacity of tax office to improve performance of the VAT refund process.
This could include empowering the tax authority to make use of third parties (e.g. external auditors, chartered accountants etc) to speed up verification process for refund claims.
These recommendations will help Indonesia align its system with global practices as summarized in Annex 1, Table 16, 17, & 18. Other supporting recommendations that could be addressed include: Elimination of advance income tax on imported processed materials Modify and scale up current tax payer profiling system to a more elaborate risk-based
system anchored on intelligent profiling, and backed by effective streamlined post-refund audits.
c. Impact of Nuisance Taxes and Levies Imposed by Local Governments Generally, as part of start-up and operational activities, firms need to comply with numerous regulations. A sample of these regulations (including tax, operational and trading requirements) can be found in Annex 1, Table 17. Some of these compliance requirements (e.g. restrictions on contract labor, losses due to delays in VAT refunds, etc) pose important constraints to firms, which have already been highlighted in previous sections of this report. In addition to these compliance requirements, Indonesian firms are also facing a rising number of new regulations that are related to the country’s ongoing decentralization efforts – the so-called “nuisance regulations”.
29
IMPROVING INDONESIA’S COMPETITIVENESS: CASE STUDY OF TEXTILE AND FARMED-SHRIMP INDUSTRIES
TEXTILE AND APPAREL VALUE CHAIN
Indonesia’s decentralization (under the 1999 Law 22 on Regional Government, and the 1999 Law 25 on Allocation of Finances between Central and Regional Government) appears to have resulted in competition among local government municipalities to create new sources of revenues mostly through proliferation of taxes and levies – the so called “nuisance taxes” (e.g. levy on use of diesel generators, cumbersome procedures for renewing business licenses and permits). In 2001, there were 1,006 conflicting local regulations established by local governments, of which the MoIA and MoF has cancelled about 537 (perda or peraturan daerah). In 2006, the MoIA accepted 5,054 perda concerning retribution and taxation from the total of 13,000 perda that was evoked. Specific examples of nuisance regulations and levies include: (1) local regulations which require one-off payments or monthly charges that raise cost of employing foreigners (e.g. in Pekanbaru, South Sumatra, Bekasi, Maluku) (2) parking fees in own plant area (3) taxes on public street lighting for those with own generator - known as PPJU (Pajak Penerangan Jalan Umum)25 (4) in a study carried out by SMERU research institute (2002) in Garut (West Java) and Gorontalo (North Sulawesi) municipal government enacted local legislation 17/2001 established levies (at IDR5,000 per vehicle a day) on the use of public roads and loading as well as unloading of goods for business purposes. The study found that these regulations increased operational cost of aquaculture farms by up to 7%. Some analysts have argued that nuisance taxes and regulations have fuelled bribery and corruption linked to tax assessments, securing licensing and registration permits, and other regulations for compliance. A survey analysis conducted by Kuncoro (2005) suggests that, on average, firms pay up to 10.8% of annual production costs on bribes. Bribe rates are said to increase with firm size, with firms located in urban areas having higher bribe rates. Foreign firms were also found to have higher bribe rates that their domestically owned counterparts. The range of bribe rates was also highly differentiated by regions - 22% in Jakarta Utara, 16% in Jambi, 10% in Bandung, and the lowest being Yogyyakarta with 3.8%. The proliferation of nuisance taxes is a reflection of broader weaknesses in Indonesia’s larger national public finance management system – including the pressure on local governments to generate additional revenues separate from that given by the financial balance law of UU No 25/1999. The limitations of Indonesia’s current public finance management system were discussed in a recent report from the Asian Development Bank (ADB 2005). The report highlighted the following weaknesses: (a) Outdated legal environment (b) Opaque and inefficient budget formulation process and separation of current and development budgets (c) Inefficient payment system and weak monitoring arrangements (d) Fragmented cash management arrangements (e) Unreliable accounting, auditing, and reporting systems, and (f) Overlaps between external and internal audit agencies. Effective interventions to curb the growth and impact of nuisance taxes would, therefore, require GOI to address broad public finance management issues. As a necessary first step however, the GOI has begun to develop a “negative” list of taxes and regulations that local governments can impose on businesses. Following this initiative, other supportive measures could be implemented including:
25 Here the victim has prepared its own generator and provide its own street lighting within its aquaculture & textile complex, this is then used by the local government to impose lighting levy/taxation to the company.
30
IMPROVING INDONESIA’S COMPETITIVENESS: CASE STUDY OF TEXTILE AND FARMED-SHRIMP INDUSTRIES
TEXTILE AND APPAREL VALUE CHAIN
Capacity of internal revenue office needs to be strengthened to ensure that local governments are in compliance with national fiscal management and competitiveness objectives when formulating district legislation and levies.
The GOI should also establish a benchmarking scheme to track the impact of local regulations and levies across local governments. These benchmarks will not only serve as a means to caution excessive regulation, but also provide indicators to evaluate complementarities between national, state and local government policies. FIAS-IFC-World Bank will be providing some support to the GOI in this area through an upcoming project.
5. Low Labor Productivity and Rigid Labor Market Policies causing Accelerated Increases in Labor
Costs, Undermines Indonesia’s Labor Cost Advantage With the exception of Pakistan, Bangladesh, Vietnam, and Sri Lanka, Indonesia does not appear to be overly disadvantaged in terms of unit labor costs, relative to top tier competitors in the Asian region like India and China (Annex 1 Table 6). Government’s labor policy is oriented toward strong employee protection which can be a key asset in improving Indonesia’s image as a socially responsible production base for textile and apparel, relative to China or India. However, prevailing employee protection laws appear to have made the labor market too rigid to allow firms adjust to competitive pressures confronting the industry26. Balancing policy measures for labor protection with firm-level productivity competitiveness is necessary step towards improving the unemployment situation in the country. Indonesia is the only one, amongst the major Asian textile producers (i.e. China, India, Pakistan,
Bangladesh and Thailand), which imposes a 40-hour week and applies statutory overtime rates which are directly proportional to extra hours (as shown in Annex 1 Table 6) This policy sets incentives for workers to delay production until overtime periods when they can get higher pay – hence it directly increases production costs and undermines the link between worker wages and productivity. Lastly, Indonesia’s minimum wage is reviewed almost annually, and many analysts argue that these increases have been driven by short run interests in securing political support rather than immediate concerns about poor worker conditions or competitiveness of the industry. Minimum wage was said to have increased by 49% and 17% in Jakarta and Bandung respectively in 2000 and 39% (Jakarta) and 34% (Bandung) in 2001, while consumer price index only increased 7-13 percent. In effect, it has resulted in rapid increases in cost of labor, which has direct impact on production costs of labor intensive industries – particularly the apparel industry.
In the absence of a functioning social security system, Indonesia’s severance payment system, by design,
has become one of the most expensive in the world. In an attempt to fill the void of a well functioning system of unemployment insurance and social security, Indonesia has become one of the very few countries where severance pay for dismissals has more than
26 This may be partly due to the fact that Indonesia was the target of several petitions filed under the Generalized System of Preferences (GSP) legislation arguing that the country did not meet internationally recognized labor standards in the mid 1990s. A formal GSP review was suspended in February 1994 without terminating GSP benefits for Indonesia. Since 1998, Indonesia has ratified all eight International Labor Organization core conventions on protecting internationally recognized worker rights and allowed trade unions to organize.
31
IMPROVING INDONESIA’S COMPETITIVENESS: CASE STUDY OF TEXTILE AND FARMED-SHRIMP INDUSTRIES
TEXTILE AND APPAREL VALUE CHAIN
doubled since 1996 and has tripled since 1986 (Padjadjaran University, 2004). This has begun to discourage some employers from hiring new workers, especially on a permanent basis. Severance costs under the 2003 law (dismissal and severance regulations and restrictions on workplace employment arrangements are covered under the new employment protection legislation or law no. 13/2003) are estimated to be equivalent to a “hiring tax” of about 4.1 monthly wages per employee or 34 percent of a worker’s annual wage.27 This “hiring tax” is up from an average of 29 percent imposed by the previous regulation PP150/2000, and is almost twice as high as the tax created by the 1996 decree on severance pay. This has negative implications for apparel manufacturers in particular, who require large amounts of labor.
Increases in real wage costs are de-linked from productivity, especially in the apparel industry. This is perhaps the most important issue with respect to labor. Anecdotal evidence arising from the interviews and discussions undertaken in Indonesia, plus previous visits to factories in China, suggests that labor productivity in garment production in Indonesia is about 30-50% below that of China, despite the fact that average wages per worker per week28 are about 0-20% less than those in coastal China. Lower labor productivity in the Indonesian apparel sector is partially linked to shop floor inefficiencies in both cutting rooms and sewing units. Also, the main management information systems (MIS) are fragmented and inefficient. This makes effective measurement and control difficult.
Indonesia’s labor policy also places a number of restrictions on employment contracts, above those of
competing countries, as shown in Annex 1, Table 7. These factors are combining to make marginal ready-made garments factories in Indonesia relatively less competitive unless increases in real wages are tied to labor productivity. This will require: (1) Regulatory interventions to relax labor market conditions, (2) Private sector investment in practical training for productivity improvement. Moving forward, the GOI could consider some of the following actions that have been implemented in other countries to address these constraints: Establishment of a productivity improvement centre (PIC), possibly working from an
existing educational facility in Bandung, with expertise provided from overseas. The PIC would provide practical shop-floor assistance in systems and procedures aimed at productivity enhancement within textile and apparel firms. Bandung, because of its central location and concentration of textile operation in the area, might also be considered as the focal point for a major initiative on the national textile education plan. Sample audits of personnel levels, training needs and productivity targets will need to be conducted as a prerequisite of establishing a national productivity improvement centre (PIC). A PIC plan will need to be developed including definition of objectives, timetable and costs. Implementation should begin with a pilot unit for testing the approach, the
27 The hiring tax measures the discounted expected cost, at a time the worker is hired, of dismissing a worker in the future or if the worker quits. It tells us the severance payment an employer expects to pay in the future if he or she hires a new worker. The calculation is based on probabilities the new worker leaves in a particular year and the cause of the separation, as different rates are applied to different separation causes (quits, dismissed for minor violations or economic cause). 28 Wages per week here is based on a 48 hour week which costs about US$36 in coastal China, US$23 inland China, and US$30 in Indonesia. Indonesian wages consist of additional costs on overtime for up to 8 hours given that the labor law limits working hours to 40 hours per week. As a result overtime policy makes Indonesia less competitive relative to inland China.
32
IMPROVING INDONESIA’S COMPETITIVENESS: CASE STUDY OF TEXTILE AND FARMED-SHRIMP INDUSTRIES
TEXTILE AND APPAREL VALUE CHAIN
results of which will guide full rollout. As part of its objectives, particular attention should be paid to:
o Adequacy of management systems in planning, scheduling, operations and
performance control (efficiency, quality, human relations, and incentives). o Training systems for multi-skilled sewing operators. Supervisors and middle
management need to be trained on work-loading, quality and performance controls.
o Productivity measurement and international benchmarking. Often when measuring labor productivity, producers only measure the direct personnel and fail to account of the indirect personnel, which can make an enormous difference in the calculation of productivity. The number of indirect personnel (i.e. including handling, manual transporting, quality inspections, supervisors etc) in garment operation needs to be controlled.
o Systems to assess profitability, delivery performance and goal achievement by style and per customer.
Develop a textile and apparel education plan to support long-term growth and development of the industry.
Based on practices in comparable countries, the GOI should continue exploring some of the following important considerations.
o Reduction in frequency of changes to minimum wage and limited government involvement in the establishment of overtime rates and policies within firms.
o Costs and principles guiding severance pay system should be aligned with regional and global practices and benchmarks. Severance pay system should be linked to sustainable deferred compensation schemes (e.g. by encouraging a more sustainable joint savings scheme between employer and employee to cater for job loss contingencies). Reforms of severance pay should be accompanied by reforms that improve the functioning and integrity of the social security system.
6. High risk of export losses from trade diversion due to higher average tariffs on textile and apparel
products relative to key competitors in the US and other markets Prior to the removal of MFA quota restrictions, Indonesia had limited yarn quota and quota trading added to costs (i.e. up to US$0.30/kg) making the landed price of the country’s textile and apparel products to be less competitive. Similarly, although quota restriction and associated costs are now a thing of the past, the prevailing global trade policy regime still imposes significant tariffs that add to the total delivery costs in a manner that can significantly divert trade from more cost efficient suppliers. Suppliers in the CAFTA, NAFTA regions, and others like Bangladesh, Pakistan, Vietnam etc that have developed preferential trade agreements with US, Japan or the EU stand to gain from these tariff advantages. In 2005, for example, suppliers in Mexico and Israel paid less than 1% duty on average for exports of textile and apparel to the US, while those in the CAFTA region paid about 5% in comparison to Indonesia exports which face about 18% duties on average. Hence CAFTA countries have about 13% tariff advantages (on average) over Indonesia.
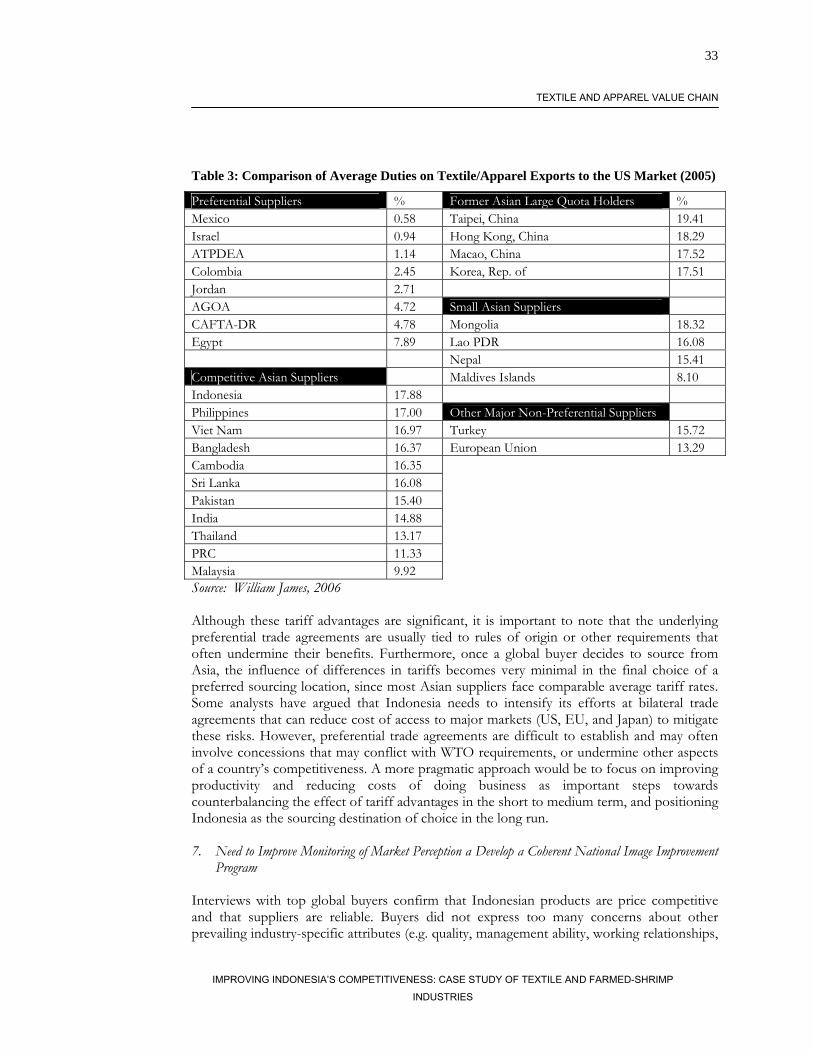
33
IMPROVING INDONESIA’S COMPETITIVENESS: CASE STUDY OF TEXTILE AND FARMED-SHRIMP INDUSTRIES
TEXTILE AND APPAREL VALUE CHAIN
Table 3: Comparison of Average Duties on Textile/Apparel Exports to the US Market (2005)
Preferential Suppliers % Former Asian Large Quota Holders % Mexico 0.58 Taipei, China 19.41 Israel 0.94 Hong Kong, China 18.29 ATPDEA 1.14 Macao, China 17.52 Colombia 2.45 Korea, Rep. of 17.51 Jordan 2.71 AGOA 4.72 Small Asian Suppliers CAFTA-DR 4.78 Mongolia 18.32 Egypt 7.89 Lao PDR 16.08 Nepal 15.41 Competitive Asian Suppliers Maldives Islands 8.10 Indonesia 17.88 Philippines 17.00 Other Major Non-Preferential Suppliers Viet Nam 16.97 Turkey 15.72 Bangladesh 16.37 European Union 13.29 Cambodia 16.35 Sri Lanka 16.08 Pakistan 15.40 India 14.88 Thailand 13.17 PRC 11.33 Malaysia 9.92 Source: William James, 2006 Although these tariff advantages are significant, it is important to note that the underlying preferential trade agreements are usually tied to rules of origin or other requirements that often undermine their benefits. Furthermore, once a global buyer decides to source from Asia, the influence of differences in tariffs becomes very minimal in the final choice of a preferred sourcing location, since most Asian suppliers face comparable average tariff rates. Some analysts have argued that Indonesia needs to intensify its efforts at bilateral trade agreements that can reduce cost of access to major markets (US, EU, and Japan) to mitigate these risks. However, preferential trade agreements are difficult to establish and may often involve concessions that may conflict with WTO requirements, or undermine other aspects of a country’s competitiveness. A more pragmatic approach would be to focus on improving productivity and reducing costs of doing business as important steps towards counterbalancing the effect of tariff advantages in the short to medium term, and positioning Indonesia as the sourcing destination of choice in the long run. 7. Need to Improve Monitoring of Market Perception a Develop a Coherent National Image Improvement
Program Interviews with top global buyers confirm that Indonesian products are price competitive and that suppliers are reliable. Buyers did not express too many concerns about other prevailing industry-specific attributes (e.g. quality, management ability, working relationships,
34
IMPROVING INDONESIA’S COMPETITIVENESS: CASE STUDY OF TEXTILE AND FARMED-SHRIMP INDUSTRIES
TEXTILE AND APPAREL VALUE CHAIN
etc), although industry’s speed-to-market could still be improved in lieu of improvements in logistics and border management. However, improvements national image and its impact of the industry could be enhanced by addressing some of the concerns raised by global apparel sourcing firms as highlighted below. Buyer 1: Indonesia is competitive on price but the Militant anti-west culture and instability makes it too high-risk as a sourcing base. Indonesia represents less than 1% of our purchases. 75% is sourced in Bangladesh and most of the rest in China.” - (quote from UK based sourcing operation dealing with Major accounts throughout Europe including M&S, Zara etc. Part of the Japanese ITOCHU group. Contact: - Operations Director) Buyer 2: “We have bought mostly underwear from Indonesia over the years, and found the suppliers to be reliable with labor costs competitive with the rest of the world. We would like to continue in business there but are concerned about the rise of militancy, and perceive that this will require special hotel and security arrangements for visiting staff at considerable cost. It is recognized that Indonesia has a large population and large capacity and is particularly competitive in that they have a good domestic textile industry. The transport infrastructure is good, with good freight services and no quota issues. Labor costs are low and steady as against China where costs are rising.” - ( Extract of conversation with Director of Operations, large foreign owned, UK based sourcing company, Courtaulds Ltd. Sourcing for such clients as Marks and Spencers, and other well known retail brands.) Buyer 3: “We have had no previous problems in Indonesia, they have good fabric supplies and CMT quality is fine. Impressed with the development and modernization of Jakarta in recent years. Experience has been that prices re good. We have concerns on the rise of religious fundamentalism, perception of which is mainly gained via the media.” - (Conversation with Independent sourcing company, (JAZ Ltd) working for such names as Farah, Sangan, with many years experience of sourcing in Sri Lanka. Contact - Managing Director.) Annex 1, Table 22 provides a summary of how Bangladesh and Vietnam developed and implemented what many consider to be a good image development and marketing strategy. Generally, as a first step towards a strong image and market development strategy, Indonesia will need to do the following: Intensify and improve effectiveness of joint government and industry approaches to
market promotion such as joint public-private participation in trade fairs, trade delegations, etc including design, financing, and implementation of such initiatives.
Adopt practical business development measures such as providing incentives like office and warehouse space to global sourcing companies to set up sourcing centers in Indonesia, to stimulate knowledge and familiarity of global apparel buyers with businesses and trade opportunities in the country.
Develop a strategy for addressing growing investor’s negative perception of political instability in the country and its associated impact on investment and sourcing decisions of global textile and apparel traders and suppliers.
The Textile Association (API), which also represents apparel exporter, needs to enlarge its focus on issues related to marketing and image building as it affects the apparel sector, which is currently the dominant segment of Indonesia’s textile and apparel exports to the US market. One possible reason why the association’s focus on marketing
35
IMPROVING INDONESIA’S COMPETITIVENESS: CASE STUDY OF TEXTILE AND FARMED-SHRIMP INDUSTRIES
TEXTILE AND APPAREL VALUE CHAIN
and image building is not as strong is because its membership is predominantly textile manufacturers – hence apparel firms may not have a strong enough representative voice. Indonesia’s textile and apparel firms may draw lessons from other countries; in most of these countries there is a dedicated apparel manufacturers association distinct from the textile association where appropriate.
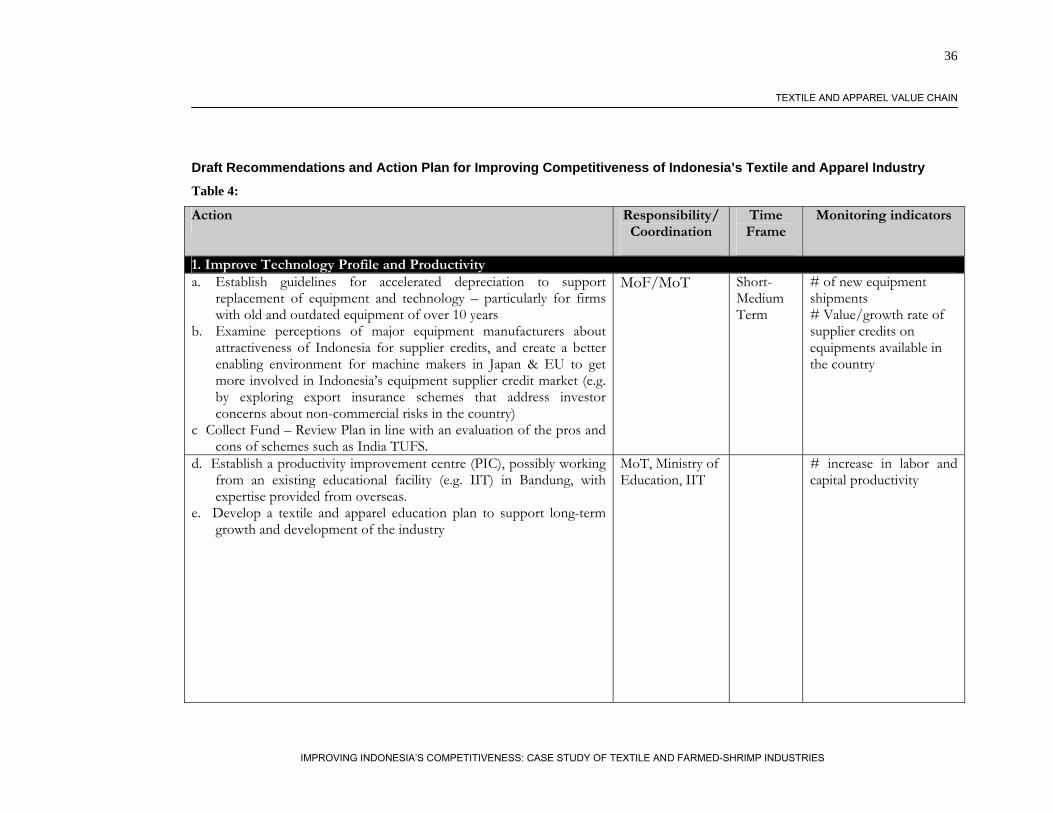
36
IMPROVING INDONESIA’S COMPETITIVENESS: CASE STUDY OF TEXTILE AND FARMED-SHRIMP INDUSTRIES
TEXTILE AND APPAREL VALUE CHAIN
Draft Recommendations and Action Plan for Improving Competitiveness of Indonesia’s Textile and Apparel Industry Table 4:
Action Responsibility/ Coordination
Time Frame
Monitoring indicators
1. Improve Technology Profile and Productivity a. Establish guidelines for accelerated depreciation to support
replacement of equipment and technology – particularly for firms with old and outdated equipment of over 10 years
b. Examine perceptions of major equipment manufacturers about attractiveness of Indonesia for supplier credits, and create a better enabling environment for machine makers in Japan & EU to get more involved in Indonesia’s equipment supplier credit market (e.g. by exploring export insurance schemes that address investor concerns about non-commercial risks in the country)
c Collect Fund – Review Plan in line with an evaluation of the pros and cons of schemes such as India TUFS.
MoF/MoT Short-Medium Term
# of new equipment shipments # Value/growth rate of supplier credits on equipments available in the country
d. Establish a productivity improvement centre (PIC), possibly working from an existing educational facility (e.g. IIT) in Bandung, with expertise provided from overseas.
e. Develop a textile and apparel education plan to support long-term growth and development of the industry
MoT, Ministry of Education, IIT
# increase in labor and capital productivity
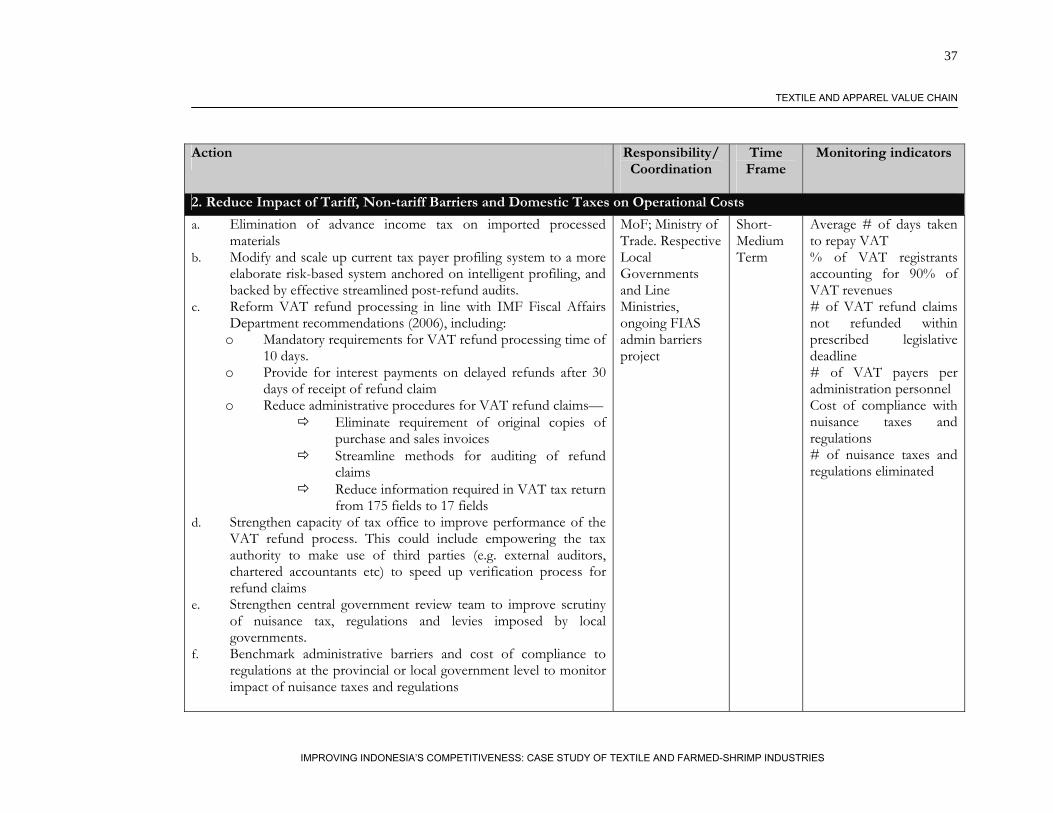
37
IMPROVING INDONESIA’S COMPETITIVENESS: CASE STUDY OF TEXTILE AND FARMED-SHRIMP INDUSTRIES
TEXTILE AND APPAREL VALUE CHAIN
Action Responsibility/ Coordination
Time Frame
Monitoring indicators
2. Reduce Impact of Tariff, Non-tariff Barriers and Domestic Taxes on Operational Costs a. Elimination of advance income tax on imported processed
materials b. Modify and scale up current tax payer profiling system to a more
elaborate risk-based system anchored on intelligent profiling, and backed by effective streamlined post-refund audits.
c. Reform VAT refund processing in line with IMF Fiscal Affairs Department recommendations (2006), including:
o Mandatory requirements for VAT refund processing time of 10 days.
o Provide for interest payments on delayed refunds after 30 days of receipt of refund claim
o Reduce administrative procedures for VAT refund claims— Eliminate requirement of original copies of
purchase and sales invoices Streamline methods for auditing of refund
claims Reduce information required in VAT tax return
from 175 fields to 17 fields d. Strengthen capacity of tax office to improve performance of the
VAT refund process. This could include empowering the tax authority to make use of third parties (e.g. external auditors, chartered accountants etc) to speed up verification process for refund claims
e. Strengthen central government review team to improve scrutiny of nuisance tax, regulations and levies imposed by local governments.
f. Benchmark administrative barriers and cost of compliance to regulations at the provincial or local government level to monitor impact of nuisance taxes and regulations
MoF; Ministry of Trade. Respective Local Governments and Line Ministries, ongoing FIAS admin barriers project
Short-Medium Term
Average # of days taken to repay VAT % of VAT registrants accounting for 90% of VAT revenues # of VAT refund claims not refunded within prescribed legislative deadline # of VAT payers per administration personnel Cost of compliance with nuisance taxes and regulations # of nuisance taxes and regulations eliminated
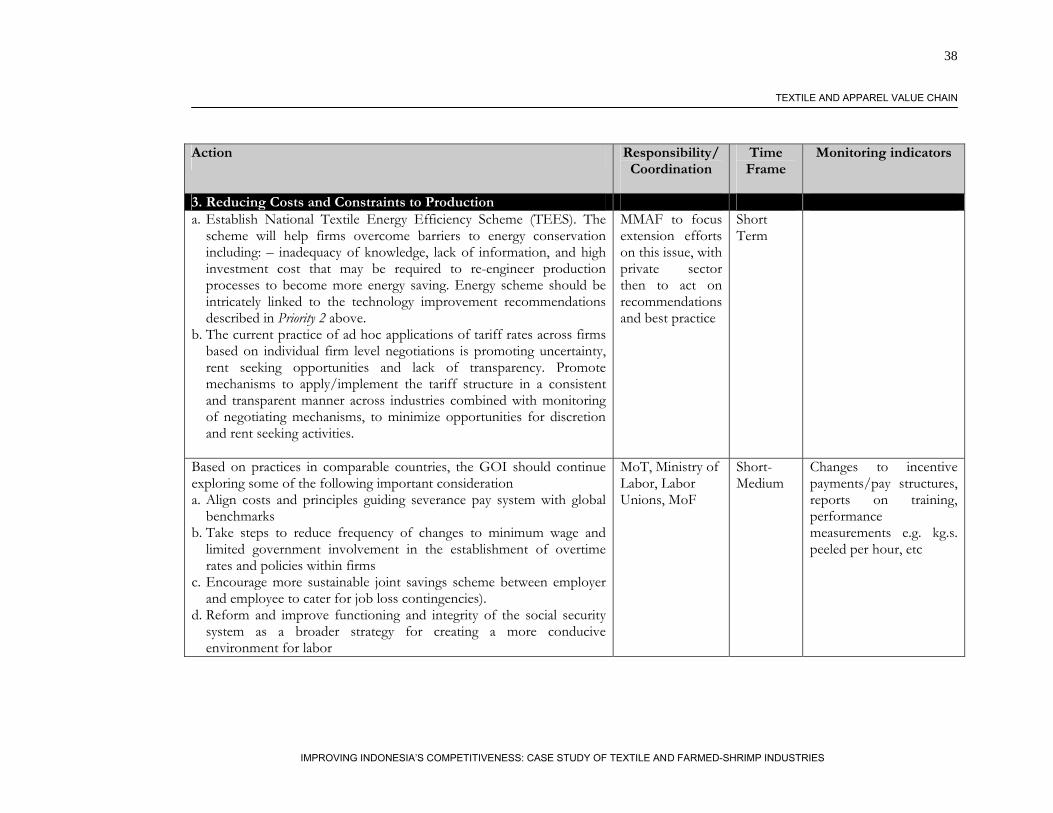
38
IMPROVING INDONESIA’S COMPETITIVENESS: CASE STUDY OF TEXTILE AND FARMED-SHRIMP INDUSTRIES
TEXTILE AND APPAREL VALUE CHAIN
Action Responsibility/ Coordination
Time Frame
Monitoring indicators
3. Reducing Costs and Constraints to Production a. Establish National Textile Energy Efficiency Scheme (TEES). The
scheme will help firms overcome barriers to energy conservation including: – inadequacy of knowledge, lack of information, and high investment cost that may be required to re-engineer production processes to become more energy saving. Energy scheme should be intricately linked to the technology improvement recommendations described in Priority 2 above.
b. The current practice of ad hoc applications of tariff rates across firms based on individual firm level negotiations is promoting uncertainty, rent seeking opportunities and lack of transparency. Promote mechanisms to apply/implement the tariff structure in a consistent and transparent manner across industries combined with monitoring of negotiating mechanisms, to minimize opportunities for discretion and rent seeking activities.
MMAF to focus extension efforts on this issue, with private sector then to act on recommendations and best practice
Short Term
Based on practices in comparable countries, the GOI should continue exploring some of the following important consideration a. Align costs and principles guiding severance pay system with global
benchmarks b. Take steps to reduce frequency of changes to minimum wage and
limited government involvement in the establishment of overtime rates and policies within firms
c. Encourage more sustainable joint savings scheme between employer and employee to cater for job loss contingencies).
d. Reform and improve functioning and integrity of the social security system as a broader strategy for creating a more conducive environment for labor
MoT, Ministry of Labor, Labor Unions, MoF
Short-Medium
Changes to incentive payments/pay structures, reports on training, performance measurements e.g. kg.s. peeled per hour, etc
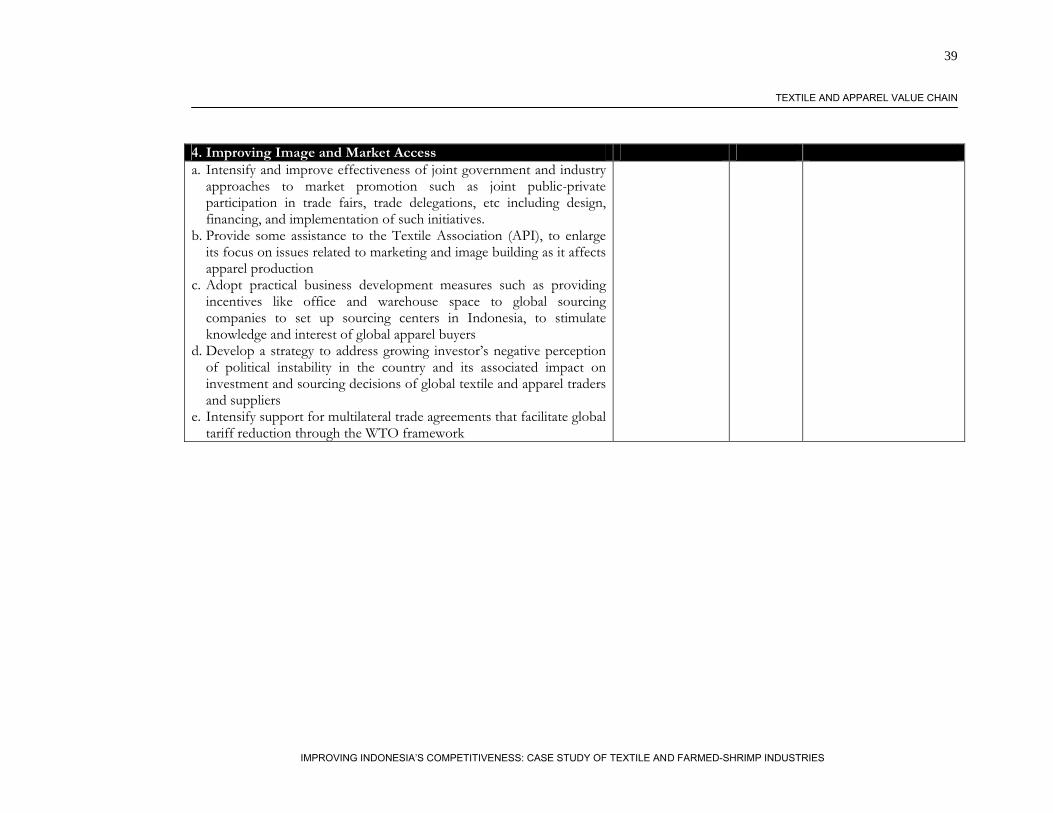
39
IMPROVING INDONESIA’S COMPETITIVENESS: CASE STUDY OF TEXTILE AND FARMED-SHRIMP INDUSTRIES
TEXTILE AND APPAREL VALUE CHAIN
4. Improving Image and Market Access a. Intensify and improve effectiveness of joint government and industry
approaches to market promotion such as joint public-private participation in trade fairs, trade delegations, etc including design, financing, and implementation of such initiatives.
b. Provide some assistance to the Textile Association (API), to enlarge its focus on issues related to marketing and image building as it affects apparel production
c. Adopt practical business development measures such as providing incentives like office and warehouse space to global sourcing companies to set up sourcing centers in Indonesia, to stimulate knowledge and interest of global apparel buyers
d. Develop a strategy to address growing investor’s negative perception of political instability in the country and its associated impact on investment and sourcing decisions of global textile and apparel traders and suppliers
e. Intensify support for multilateral trade agreements that facilitate global tariff reduction through the WTO framework
40
IMPROVING INDONESIA’S COMPETITIVENESS: CASE STUDY OF TEXTILE AND FARMED-SHRIMP INDUSTRIES
FARMED-SHRIMP VALUE CHAIN
III. Farmed-Shrimp Value Chain
Global Trends Influencing Competitiveness in the Farmed-Shrimp Industry
Indonesia’s shrimp export performance must be viewed in the context of both external (global) trends and internal (domestic) issues affecting the industry. From the global dimension, a number of key trends are worth highlighting. 1. Increased global production at lower prices accompanied by a higher degree of diversification into new
shrimp and aquaculture products with better quality Shrimp production and exports have increased significantly over the last two decades, providing considerable economic benefits for firms and farmers directly and indirectly linked to the industry. Global production rose from 214,000 tons in 1985 to 930,000 tons in 1995, and up to 1.95 million tons in 2005. These trends were due to: (1) Intensification of production systems, improved technology, and an increase in farmland under cultivation. This intensification is expected to continue – particularly in Asia. (2) Increases in production and diversification into new species - mainly P. vannamei). Large producing countries in Asia (mostly characterized by small-scale farmers) have rapidly increased the production area of P. vannamei, and those that have not are gearing up to do so. At the same time prices have declined by 43% to US$3.7/kg for P. vannamei and US$6.6/kg for P. monodon during 2001-2003 respectively, and below US$5.50/kg for both products as at mid- 2006. Indonesia’s production and price trends matches these global patterns, with production volumes having roughly doubled in the last 10 years. Indonesia is now the second-largest producer in terms of global production, third largest global producer of wild caught shrimp, fourth largest exporter of shrimp in volume terms, and the 5th largest in terms of the value of exports. Similar to global trends, Indonesia’s production has also increased significantly, characterized by increased diversification from P. monodon to P. vannamei driven in part by lower production costs and higher disease resistance derived from the use of P. vannamei. 2. Global rise in incidences of disease outbreaks and environmental pollution, increasing concerns about
food safety standards, and associated rise in the application and stringency of product/process standards and technical regulations
A major corollary of increased production and intensification of aquaculture farming has been the global rise of incidences of viral diseases, and the pollution of farm effluent, which represent perhaps the greatest threats to continued increases in production. Disease outbreaks have been particularly harmful to aquaculture trade, production and industrial development. For example, the demise of Taiwan’s shrimp industry due to bacterial and viral diseases, and the declines in annual production and exports in Thailand, China and Vietnam in the 1990s, are examples of how diseased stocks, poor farm (environmental) management practices, and depletion of the natural environment can undermine prospects in the industry. In an effort to curb this, farmers have resorted to use of antibiotics which adds its own health related risks for human consumption. As a result, there is increasing concern about the quality and sustainability of shrimp production and exports, which has led to a tightening
41
IMPROVING INDONESIA’S COMPETITIVENESS: CASE STUDY OF TEXTILE AND FARMED-SHRIMP INDUSTRIES
FARMED-SHRIMP VALUE CHAIN
of food safety legislation and increasingly stringent technical, social and environmental requirements to which exporting countries must comply in order to access key markets like Japan, US, and the EU. For example, at the time of writing: Japan has stepped up its surveillance of Indonesian shrimp due to fears of antibiotic
contamination. Examination of Indonesian product takes 10 days, as compared to 2 days for shrimp imported from Vietnam.
The US is reported to be planning to issue a temporary antidumping ban on imports of shrimp from Indonesia, driven in part by concerns about compliance with food safety standards and illegal transshipment of Chinese shrimp through Indonesia. There are also concerns in the US about the lack of Turtle Excluder Devices in the wild shrimp trawl fishery, which may result in import restrictions.
The European Union (EU) has always paid particular attention to regulating the tolerable limits of antibiotic residue in shrimp from Asian countries by imposing strict zero residue tolerance requirements on the use of chloramphenicol and nitrofuran in farmed shrimps29. This has affected Indonesia as well because it locked out a number of Indonesia’s shrimp products from the EU market.
More recently a mission by EC inspectors in September 2005 found deficient fishing vessels, continuing lack of formal approval procedure for establishments, a wide range of deficiencies in approved establishments, that controls are "almost non-existent along the product chain", deficiencies and shortcomings in laboratories, and an alarming trend in lead and cadmium contamination results. The mission concluded/reported (DG SANCO/7550/2005) that the “Indonesian Competent Authority is not yet in the position to provide the necessary guarantees foreseen in the Health Certificate attached to the Commission Decision 94/324/EC”. These findings, along with more than 50 “rapid alerts” in 2005 for Indonesian shipments of fisheries products failing to comply with health conditions could very well lead to the EU placing a ban on fisheries imports from Indonesia. Although the shrimp sector is doing relatively better with respect to managing food safety and quality in Indonesia, it is often lumped together with other aquaculture products such that the poor compliance with international standards in those other products may have negative spill over effects on the image of Indonesian shrimp exports.
Developing countries like Mauritius, South Africa, Honduras, Eritrea and so on, for instance, are also implementing legislation targeted at prevention from the spread of disease and the protection of the quality of aquatic organisms. This also has implications for diversification and access to other emerging markets. However there is a higher likelihood that farms able to comply with EU and US standards will have minimal problems with market access to these emerging markets since a lot of their standards and regulations are based on US and/or EU requirements.
In many cases, compliance with these requirements attracts considerable investment costs for revitalizing processes and facilities used for production and export, including laboratory facilities necessary to undertake the associated testing and certification, and human resources in both government and private sectors. Although purchasers may pay more for higher quality products, and certified organic and eco-labeled products often command considerable premiums, food safety and other quality 29 There are reports that the EU has reduced tolerance levels for these antibiotics
42
IMPROVING INDONESIA’S COMPETITIVENESS: CASE STUDY OF TEXTILE AND FARMED-SHRIMP INDUSTRIES
FARMED-SHRIMP VALUE CHAIN
requirements are increasingly becoming a “minimum” standard for market entry, rather than a differentiating factor to attract high market premiums. Failure to comply can result in market exclusion or loss in market share, rather than just static or reduced prices. 3. Rise in tariff and non-tariff measures (e.g. antidumping and countervailing measures) against shrimp
imports US anti-dumping complaints were filed in 2003 against six countries (Brazil, Ecuador, India, Thailand, China and Vietnam). These countries accounted for 75 percent of all shrimp imported to the United States. The impact on China was particularly high. For example, according to Hangzhou Customs, the volume of Zhejiang Province's warm water shrimp exports to the United Stated dropped by 97.1% in July-October 2004, corresponding to a 97.7% drop in value compared to the same period in 200330. Another impact of the antidumping rulings is that the “dumping countries” must now post a bond equal in value to their expected exports for the entire year in order to export shrimp to the United States. In Thailand the Thai Frozen Foods Association reports that its exporters would have to come up with more than $100 million in bank guarantees to meet the bonding requirements. This puts additional financial constraints of these exporters31. Learning from this, it is important for Indonesia to avoid any grounds for antidumping measures as much as possible. On the tariff front, the tariff advantages guaranteed by the WTO general system of preferences (GSP)32 provide significant competitive advantage to countries with such privileges. For example, Thailand's exports of shrimp products to the EU market fell steadily since its GSP privileges were removed on the grounds that Thailand was no longer a poor developing country. The EU cut the GSP awarded to Thailand by 50 per cent in 1997, and later eliminated it 1999. The EU’s restoration of Thailand’s GSP privileges in 2006 has helped to reduce tariff rates on Thai fresh shrimp and preserved shrimp from 12% and 20% respectively to about 4.2% and 7%. This would allow Thailand to become more price-competitive relative to Indonesia, Malaysia, India, China and Vietnam33. Currently, because
30 The US Department of Commerce awarded punitive anti-dumping duties in a range of 4.13 to 25.76% for Vietnamese imports, a significant reduction from the upper 93 pct bracket it had set in July 2004. It also awarded duties ranging from 27.89 to 112.81% on shrimp imports from China. Duties of 5.02 to 13.42% were awarded on Indian exporters, 2.35 to 4.48% for Ecuador, 9.69 to 67.8% for Brazil and 6 to 10% for Thailand. Analysts suggest that except for China, duties applied to all the other countries were not enough to undermine their ability to compete in the market. 31 John Sackton, Editor and Publisher, shrimpnews.com January 6, 2006). 32 GSP is a system of exemption from the Most Favored Nation principle that obligates WTO member countries to treat the imports of all other WTO member countries no worse than they treat the imports of their "most favored" trading partner. Beneficiaries of GSP privilege enjoy preferential tariff treatment for designated products exported to an importing country. This gives them a cost advantage equivalent to the differential between MFN tariff rates and the low or zero GSP preferential rates. It is a unilateral grant of tariff concessions; as such the beneficiary developing country is not required to extend reciprocal tariff reductions. (see http://en.wikipedia.org/wiki/Generalized_System_of_Preferences) 33 In June 20005, U.S. duty-free benefits were extended to certain imports from countries hit by the December 2004 tsunami and from some other developing countries including Indonesia. This was similar to 2001 when US expanded Indonesia's benefits under the Generalized System of Preferences (GSP) to 11 more products ranging from lumber and mining to fishing. These new benefits exempted these products from duties with a view to generate new trade benefits of up to $100 million in US imports.
43
IMPROVING INDONESIA’S COMPETITIVENESS: CASE STUDY OF TEXTILE AND FARMED-SHRIMP INDUSTRIES
FARMED-SHRIMP VALUE CHAIN
Indonesia’s shrimp exports to the EU are not subject to any duties, the industry will still enjoy a 4-7% cost advantage over counterparts from Thailand, despite the latter GSP privileges. Uses of import bans have also been prevalent as a precaution against the spread of diseases. For example, the Government of Indonesia placed a blanket ban on imports of “live” shrimp for six months in 2004-5 to create enough time and secured environment for examining the possible transfer of viruses and diseases from international markets, contaminated by antibiotic residues34. Similarly, the EU and USA have placed bans on shrimp imports from China, Thailand and other countries at different times in the last decade on food safety grounds to protect their citizens and environment. These bans have been very costly for affected countries. For example, the EU ban on aquaculture imports from Thailand was estimated to have cost the industry about US$15m within 5 months between August and December 1997. It is in Indonesia’s interest to avoid such incidences by strengthening its standards and quality assurance system for shrimp exports. Together, these factors are directly influencing the competitiveness landscape of the global shrimp industry, and the ability of Indonesia’s shrimp farmers to respond to these global them will be crucial for survival. Currently, Indonesia still has certain advantages in key global markets. Buyers, in fact, generally view Indonesia’s performance rather favorably against almost all the key buyer requirements listed above, or at least not comparatively weaker than other competitor countries. The main area of weakness is perceived to be the quality of product, with responsibility for quality issues viewed as lying firmly with the “Competent Authority” in Indonesia. For almost all of the key buyer requirements, the best global performer is perceived to be Thailand, although India and Pakistan are noted to be especially price competitive. 4. Allegations of Shrimp “Re-Exports” Suspicious of the dramatic increase in growth Indonesia’s export of shrimp to US from 1,003 tons in 2002 to 39,343 tons in 2004 and 14,405 in the first quarter in 2005, the US customs and excise officials began investigating 10 Indonesian shrimp exporters. The suspicion was that these exporters were re-exporting shrimp from China or a number of other countries currently subject to anti-dumping import duties (Source: Kompas daily, June 23, 2005 and Xinhua General News Service, June 24, 2005). Such allegations of illegal transshipment can be particularly damaging to Indonesia’s reputation. Some measures to curb the potential for illegal transshipment are discussed in Section 4 of this report. 5. The impact of natural disasters – the Tsunami In India, the President of the Seafood Exporters Association of India (SEAI) reports a 30% fall in shrimp catch from the sea and almost 60 per cent fall in the second aquaculture crop, due to the tsunami. The tsunami is also said to have damaged several of the aquaculture farms along the East coast as well as some hatcheries. It also destroyed most of the coastal waters of Nagapatinam (India) where natural brooders for seeding and stocking the aquaculture farms were sourced. This has led to a shortage of good brooders for the industry. Indonesia, Thailand and other countries had similar experiences. In Thailand, the
34 This ban is still in place and was recently renewed for another 6 months
44
IMPROVING INDONESIA’S COMPETITIVENESS: CASE STUDY OF TEXTILE AND FARMED-SHRIMP INDUSTRIES
FARMED-SHRIMP VALUE CHAIN
tsunami caused heavy damages to fry hatcheries. As such the effectiveness of disaster response, relief, recovery mechanisms cannot be overemphasized as integral elements of competitiveness in the industry for Indonesia. A recap of recent events suggests that Indonesia is already experiencing numerous floods and landslides in 2006 which have resulted in deaths, injuries and considerable physical damage. Yet reconstruction of areas already affected in previous incidences (e.g. Aceh and Nias) has been slow. Reports suggest the need for “adjustments to its master plan, particularly in relation to land use planning, reallocation of available funds among major activities, better coordination of implementing organizations, and a rethinking of conflicts between the authority’s roles as implementation agency and coordinating agency” (Kuncoro, 2006).
Indonesia’s Farmed Shrimp Production in a Global Context35
Boosted by strong production worldwide, key markets in USA, Japan, Spain, France, UK, and Italy, all imported more shrimp in volume terms during 2004 than in any previous year. While total volume imports for the USA, Japan and the five main EU importers passed 1.2 million tons for the first time following a 4% increase from 2003, their import values fell due to declining prices. Correspondingly, farmed shrimp production in Asian countries has expanded tremendously in the last 10-15 years. From the Philippines which had an annual growth rate of 2%, to Malaysia with 25%. In recent years, China has outpaced Thailand to become the world’s leading producer of farmed shrimp, producing 304 182 tons in 2001 and accounting for almost 25% of the world’s total production of farmed-shrimp. In comparison, Indonesia’s relative performance in key markets is discussed below Japanese market - Japanese imports in 2004 were more than 300,000 tons (240,000 of frozen unprocessed shrimp). The market has traditionally focused on imports of high quality large P. monodon which has favored Indonesia given its production of this larger sized species of shrimp. Indonesia was the second most important exporter to Japan with 48.6 thousand tons in 2004, but its share has been falling since 2001, with China, Thailand and Vietnam all showing rapid penetration into the Japanese market. This was largely the result of Thailand and China converting to P. vannamei, which not only lowered their production costs by almost US$1/kg but also enabled them to produce about twice the amount of shrimp per unit of production area. The Japanese has become more receptive to imports of P. vannamei, of smaller sizes, and of value-added products. Thailand, for example, expects its export of frozen seafood to Japan during 2006 to increase by 15% to Baht 80bn (US$ 2.02bn EUR 1.69bn), following the signing of the Thai-Japanese free-trade pact. As such, the Japanese market is increasingly opening up to other producers at the expense of Indonesia. Furthermore, Japan has stepped up its surveillance of Indonesian shrimp due to fears of antibiotic contamination. US market - Despite anti-dumping tariffs, imports in 2004 at 518,000 tons were up 3% compared to 2003, largely due to lower unit values boosting domestic demand in the US. The imposition of tariffs against China, Thailand, Ecuador, India, Vietnam, and Brazil following the anti-dumping case, had a significant impact on individual countries. China, Brazil, and India, that hit with the highest tariffs from the anti-dumping case, had declines of 80%, 68% and 18% respectively in shipments of raw shell on shrimp to the US. But 35 Data in the section from Globefish Shrimp Commodity Update, 2005
45
IMPROVING INDONESIA’S COMPETITIVENESS: CASE STUDY OF TEXTILE AND FARMED-SHRIMP INDUSTRIES
FARMED-SHRIMP VALUE CHAIN
Thailand, Ecuador, and Vietnam, all with relatively low tariffs, had increases for shell on headless shrimp of 55%, 39% and 32% respectively. The anti-dumping tariffs have also had an impact on product types in the US market. The major category that saw a large increase was in breaded product, which is exempt from anti-dumping duties, mostly coming from China. Indonesia was the third largest exporter of shrimp to the US market in 200436, after Thailand and China. The decline in Indonesian exports to Japan was more than made up for by an increase in Indonesian exports to the USA in 2004. However, Indonesia did not perform as well as would have been expected in the US market in 2005. Because of relatively little Indonesian value-added production in breaded products compared to other producers, exports to the US were virtually unchanged in 2005. And raw headless shipments were up only 3%, which is of concern given its favorable position with respect to higher tariffs and Continuous Bond Policy in the US that Thailand, Ecuador, China, India and Vietnam have to comply with. EU markets - Shrimp consumption in 2004 was boosted in EU markets by lower Euro prices, and the first half of 2005 showed similar import volumes to 2004. Key markets are Spain, Germany, Italy, France, and the UK. Thailand, Ecuador, Brazil, Madagascar, India and Bangladesh are especially important exporters of shrimp to EU markets. Noticeable is the relative lack of penetration into the EU market by Indonesian suppliers. With the reinstatement of Thailand’s GSP privileges, and the diversion of Chinese, India, Brazilian shrimp exports from US markets due to effects of antidumping duties, Indonesian shrimp farmers can expect a lot more competition in the EU market. Thai firms expect to increase their exports to EU markets by about 7 - 8% up to 450,000 tons in 2006, with particular emphasis on improvements in compliance to food quality and safety standards. In other emerging markets (e.g. Canada, Australia, etc) Indonesia also faces rising degree of competition – especially from Vietnam. Vietnam’s exports to Australia, for example, showed strong growth increased by 60% in 2004 and by 37% in 2005 – partly driven by trade diversion effects of US anti-dumping tariffs imposed on Vietnam. Demand within the industry is very responsive to changes in price, hence more efficient producers that can charge lower prices are able to increase market share. This might be beneficial to Indonesia because of its comparative advantage in farmed shrimp production due to its access to all year-round warmer water that prevent outbreaks of White Spot Syndrome Virus (WSSV). In the medium to longer-term, both demand and prices of shrimp are expected to rise37. Based on the most likely set of assumptions, global food fish production will increase slightly faster than global population through 2020, with per capita consumption projected to rise, and real prices are also expected to rise by 16 percent for crustaceans. Demand for shrimp is determined by many factors, but especially important are both population and income. While population in the key markets of EU, USA and Japan may not rise significantly in the coming years, other countries’ populations will do so providing expanding markets in other areas, and income increases in the USA, EU and Japan are also likely to increase demand and 36 The country has maintained this position for the last 10 years during which it consistently produced more shrimps than Thailand except during the 1993-96 periods. However Thailand exported 90% of its production while Indonesia exported about 70%.(IRA, 2005) 37 As demonstrated by recent modeling work on fish demand and prices conducted by the World Fish Centre (Delgado, et al, 2004)
46
IMPROVING INDONESIA’S COMPETITIVENESS: CASE STUDY OF TEXTILE AND FARMED-SHRIMP INDUSTRIES
FARMED-SHRIMP VALUE CHAIN
prices. This is especially true for a high value product such as shrimp. Indonesia can position itself well to take advantage of these opportunities, if certain constraints and challenges confronting the industry are promptly addressed. These are discussed below.
Competitiveness of Indonesia’s Farmed Shrimp Industry
Where Are the Big Gaps?
The key issues here are as follows: Weak enforcement of existing product and process standards, technical and other
regulations Poor quality domestic brood stock used by domestic hatcheries to produce fry,
significantly undermines survival rates, productivity and quality of output from many farms
Cost of shrimp feed is high relative to competing countries Poor management practices at the farm level significantly undermines shrimp-farm
productivity Increasing business environment costs/constraints accentuate cost of production Need to develop a stronger image and market information and promotion strategy
1. Weak enforcement of existing product and process standards, technical and other regulations There is much debate at present about the potential for food safety and environmental standards, traceability, etc to marginalize poor/small-scale producers due to the associated costs involved. Certainly, increasing emphasis by importing countries on the quality of product originating from shrimp farms, means that farmers and exporters (including processors) will have to pay increasing attention to the quality of their products if they are to maintain their access to diverse markets. But requirements in importing countries apply to all exporters (traders and processors), and if health/hygiene and environmental standards can be maintained/improved, then higher standards can help Indonesia to maintain current markets, and access new ones. Other competing countries are already improving their standardization, quality assurance and metrology systems in this regard. Authorities in Vietnam, for example, have increased testing of seed for dangerous pathogens, especially for intensive shrimp farms, while those in Thailand have stepped up certification requirements for hatcheries producing P. vannamei SPF, and are encouraging other hatcheries to adopt best practice codes of conduct. Indonesia is moving in this direction with small-scale P. monodon farmers interviewed in Surabaya being organized and certified under the German organic scheme Naturland, and are reported to be receiving higher prices from processors for certified product which is then sold into the niche organic market in Europe. There are also other schemes that have been put in place by Government (e.g. NESS scheme) to help farmers on a variety of issues ranging from farm management practices like application of antibiotics, to securing certification systems.
47
IMPROVING INDONESIA’S COMPETITIVENESS: CASE STUDY OF TEXTILE AND FARMED-SHRIMP INDUSTRIES
FARMED-SHRIMP VALUE CHAIN
Furthermore, a range of legislation38 already exists in Indonesia to encourage the application of best management practices, and minimize the negative spill over effects of shrimp farming. However past and current failures in food safety standards suggests that these regulations are not properly enforced, posing a number of threats to its ability to export shrimp. Responsibilities lie with both the Government and the private sector, and in the farming, trading and processing sectors. On the government’s side, there is need for more aggressive implementation of the government action plan presented to EC (See Annex 3, Table 33). All activities specified in the plan are similar to those under implementation in other exporting countries. For example, (1) Thailand’s enforcement of good management practices at the farm level through the CP program (2) Sri Lanka’s implementation of applicable EU directives in its aquaculture legislation in 1998 (3) Jamaica’s adoption of a special law for inspection and certification of various categories of aquaculture, inland, and marine products intended for exports. The law also contains provisions for licensing of persons and facilities engaged in production, harvesting, processing, handling, storage, and transport for export of such products (including development of an HACCP plan) – FAO Aquaculture News Letter No. 31 (4) Australian National Strategic Plan for Aquatic Animal Health 1998-2003. The Plan outlines the objectives and projects in order to develop a national approach to emergency preparedness and response and to overall management of aquatic animal health in Australia. Key elements of the plan consist of quarantine, surveillance, monitoring and reporting, research and development as well as legislation, policies and jurisdiction. FAO Aquaculture News Letter No. 31. (5) Vietnam’s establishment of the NAFIQAVED (quality control labs) and provide support to quality control and marketing. A summary of these initiatives is provided in Annex 2, Table 23. The GOI would need to keep pace with these initiatives, especially in the following areas: Previous HACCP approval by the “Competent Authority” of enterprises not meeting
health and hygiene standards has been especially detrimental. There continues to be a lack of sufficient skills and knowledge within the Competent Authority on food standard requirements in exporting countries (as evidenced by the recent EC inspectors report of September 2005).
For a perishable foods industry that requires on-time and quick delivery of products,
testing, inspection and certification services provided by the government are sometimes too slow and inadequate. There are reports that antibiotics tests sometimes take up to 4 months. And sometimes such tests come back inaccurate, causing firms to additional financial costs to retest abroad.
Although a landscape bill was created to regulate modalities for locating farm sites, its
application under decentralized municipal governments is unclear, due to poor coordination between central and local government. For example, with the development of farm sites in many areas there has been a failure to enforce the 1km green belt.
38 The Department of Oceanic and Fisheries (DKP) issued PROTEKAN Policy in 2003, on the back drop of other Decrees such as regulation no 4/1982 for environment management, no 5/1990 of resource and ecosystem conservation, and 24/1992 for landscape planning.
48
IMPROVING INDONESIA’S COMPETITIVENESS: CASE STUDY OF TEXTILE AND FARMED-SHRIMP INDUSTRIES
FARMED-SHRIMP VALUE CHAIN
More could be done by working with processors/exporters to provide adequate information to the industry, understanding trends, changes, and impact of foreign technical regulations, standards, and global market requirements. Perhaps the promotion of one-stop “Aqua shops” as is being done in Vietnam and India could help improve availability of relevant market information within the industry. Such Aqua shops will provide a single location for fish farmers and aquatic resources stakeholders to share knowledge, find information, and get some training on resources, services, materials and schemes that are available to support shrimp farmers.
Private sector operators also bear responsibility for problems because: There is a general lack of preparedness by many farms and processing companies to
meet increasingly stringent product certification programs, or to make associated investments in new technology and plant. Many farmers continue to abuse antibiotics and pesticides because they are usually able to sell their product, even if at lower prices i.e. the market incentive to adopt more probiotic approaches is not very strong. Rather the incentive to use antibiotics to salvage diseased stock is very high since many buyers continue to accept such products from farms. The market therefore encourages farmers to use antibiotics to salvage the stock at discounted prices rather than allow them to die.
Small quantities from small farms cause consolidators to hold batches, with resulting
deterioration in quality. Differences in application and compliance with health and hygiene standards may be partly due to the size of businesses involved, company specific attitudes to risk, and the requirements in end markets. Certainly the larger vertically integrated companies39, as well as the larger processing companies, are thought to be more rigorous in their attitudes towards the quality of product processed and exported, due to the higher prices they can get for better quality. They also face the risks of losing significant business and reputation if their product is of poor quality. But smaller traders selling domestically and/or exporting within the region may place less emphasis on sanitary standards and technical requirements due to less stringent regulations in regional markets, compared to the EU and the USA.
2. Poor quality domestic brood stock used by domestic hatcheries to produce fry, significantly undermines
survival rates, productivity and quality of output from many farms Production levels and value addition throughout the chain is undermined by the low quality of domestic hatchery-produced fry used by many shrimp farmers (mainly small farms). Locally produced broodstock are typically infected with one or more viral pathogens that affect shrimp. These infected fry usually have much higher mortality rates that feed through the rest of the supply chain. The use of low quality fry by Indonesia is driven by the following factors: In hatchery operations, the cost of brood stock is the single highest variable cost
incurred in the production of fry – accounting for 20-30%. Many hatcheries produce non-SPF (Specific Pathogen Free) fry which are cheaper to produce in Indonesia because many medium-sized hatcheries use lower quality domestic broodstock rather
39 In Asia such companies usually source a significant part of their stock from small farmers (e.g. through out-grower schemes)
49
IMPROVING INDONESIA’S COMPETITIVENESS: CASE STUDY OF TEXTILE AND FARMED-SHRIMP INDUSTRIES
FARMED-SHRIMP VALUE CHAIN
than imported SPF broodstock. An estimated 77% of the brood stock is bought from the domestic market while the rest are imported. Use of imported brood stock can add up to 12% to variable costs of production of P. vannamei fry; hence hatcheries have a strong price incentive to buy from domestic sources, even though domestic brood stock is of lower quality. For similar reasons, many small scale Indonesian farmers often make use of poor quality fry from hatcheries. They trade off lower production costs for losses in productivity, risk of disease occurrence and high mortality rates. This is partly due to the lack of knowledge of the magnitude of productivity gains from use of fry from better quality broodstock. Farmers that make use of cheaper non-SPF fry at $15 per piece40 compared to $27 from SPF quality imported broodstock, are not be convinced that the premium price on SPF/SPR fry convert into many times more yield (measured in terms of harvested shrimp) – depending on their ability to keep local pathogens out of their production ponds through the adoption of biosecure management practices41.
With respect to P. monodon, there is a Ministerial Decree 146/MPP/Kep/1999 that
prevents domestically produced brood stock from being exported. This ban has the tendency to reduce domestic prices paid for broodstock, hereby putting a downward pressure on incomes of domestic broodstock suppliers. Although such policy may have helped increase the availability of brood stock domestically, it creates significant disincentives for P. monodon brood stock producers to invest, upgrade and expand the quality of their products. The ban may also prevent them from taking advantage of economies of scale in production for larger base of export markets. Therefore less damaging alternative policy instruments should be considered (e.g. a licensing scheme, taxes on exported units, etc).
Poor enforcement of existing domestic hatchery standards (particularly for backyard
hatcheries) and limited availability of extension services to assist backyard hatcheries in complying with product and process standards. The large and dispersed number of backyard hatchery operations makes controlling them and the provision of extension services very difficult. Enforcement of regulations and quality improvements will require significant costs for domestic broodstock suppliers and hatcheries to upgrading their production techniques and improve product testing and certification42. The benefits and costs of greater enforcement of hatchery standards (planned for 2006-2007) are difficult to ascertain. It may be necessary to explore measures to support backyard hatcheries
40 Another alternative used by domestic hatcheries is the F1 quality brood stock. These are not imported, but grown by domestic hatcheries that import SPF Parent Stock from the US, and then try to keepthem disease free for the next generation of their broodstock. However, since Beeders (e.g. SIS) assembles their parent stocks from several Pure Lines as a strategy to protect intellectual property rights, customers that “pirate” stocks to produce F1s usually end up with a 5-10% drop in performance and a higher risk of infection from local pathogens. As such, there is already a clear price differentiation between PLs from imported parent stocks and those from F1s. 41 The cost of disease free fry is less than 20% of a pond operator’s variable cost – hence there is room for hatcheries that invest in imported pathogen free (SPF) broodstock to charge a premium (double the price) for the disease free fry it produces, provided the pond operator is knowledgeable and convinced of its benefits in terms of increased survival rates and increased productivity. Thus if survival rates of disease free fry are as high as is usually claimed, both the pond operator and hatchery can make more profits from investing in imported pathogen free broodstock. 42 For example, official health certificates from government laboratories proving SPF status are costly for small operators (at Rp 250,000-350,000 for each of three main virus tests required). As such, costs are an important disincentive for backyard hatcheries producing P. Monodon.
50
IMPROVING INDONESIA’S COMPETITIVENESS: CASE STUDY OF TEXTILE AND FARMED-SHRIMP INDUSTRIES
FARMED-SHRIMP VALUE CHAIN
with meeting costs of compliance. India’s MPEDA program which provides technical assistance and financial support to production and export is perhaps one plausible model to explore. Another alternative is a “mother hatcheries model” that is common in Thailand and China, and increasingly being adopted in Indonesia. A description of these models can be found in Annex 2 Table 24.
Small shrimp farmers often lack adequate information about the quality and comparative
features of different hatchery products before use. This is perhaps because labeling requirements on hatchery producers are not being adequately enforced. Perhaps Indonesia can draw on Bangladesh’s experience in implementing a Seal of Quality Program under its agro-based industry and technology development project.
Future growth and competitiveness of Indonesia’s farmed-shrimp sector will require the development of a long-term solution for improving bio-security of hatchery production (especially in backyard hatcheries in Indonesia) such that there is easy access to SPF fry at affordable prices. High costs of quality broodstock can undermine any industry’s ability to increase growth of P. vannamei, if corresponding survival rates and productivity are not maintained. In Thailand and Taiwan, for example, rapid expansion is believed to have started not only after the price of hatchery-reared fry dropped below US$10 per one thousand post larvae in the mid-1980s (Y.C. Shang et al, 1998), but also because hatcheries became better at producing disease free fry by making investments in appropriate treatment systems. Furthermore, costs of importing high quality brood stock to augment domestic hatchery production need to be reduced. Currently, the import price of SPF brood stock is around $21 per piece, with an additional $6-10 being charged on the sale price to hatcheries. Part of this premium is due, in part, to: Permits/registration to import broodstock are costly to obtain, valid only for 6 months,
are tied to sales to particular hatcheries, and are issued by local government under the decentralization process which, if strictly enforced by customs, ties importers to importing through certain designated airports. These procedures appear to be restrictive.
Broodstock importers are required to pay transport costs for quarantine officials to
accompany the transport of broodstock from airports to the hatcheries to which they sell. Laboratory tests for imported broodstock to cover the three main viruses, costing a total of Rp 750,000 – 1,150,000. This increases overall cost of imports and price in the local market.
Certificates of clearance are required at all airports if broodstock is moved from one
province to another by air i.e. arrives in Jakarta and is flown to E. Kalimantan, but are not required if broodstock is moved by land.
In sum, the combination of a ban on exports of domestic brood stock and high transactions cost on imported substitutes limits the industry’s ability to improve productivity and cost competitiveness in the long term because it forces downstream segments of the value chain to be dependent on poor quality domestic brood stock, while making imported substitutes more expensive.
51
IMPROVING INDONESIA’S COMPETITIVENESS: CASE STUDY OF TEXTILE AND FARMED-SHRIMP INDUSTRIES
FARMED-SHRIMP VALUE CHAIN
3. Cost of Shrimp Feed is High Relative to Competing Countries Feed costs make up about 60% of the variable costs of operating a shrimp farm in Indonesia. The use of feed and fertilizers is higher in countries such as China, Indonesia, Thailand and Philippines, compared to Bangladesh, India, and Vietnam because of high stocking density practices (Madan Dey et al, 2006). Furthermore, feed prices are higher compared to many other key farmed-shrimp producers in other countries. Feed/ton cost in Indonesia is about 2 times the price in Panama, and prices are about 15% and 40% more expensive than in Thailand and China respectively43. This is due, in part, to the following: The import content of ingredients used to produce shrimp feed in Indonesia (e.g. fish
meal, soybean meal, wheat flour, pre-mix containing vitamins etc) is higher than those in China and Thailand. Also many feed mills still sell feed that is formulated for P. monodon, which requires much more expensive marine protein in the ingredients than what is required for P. vannamei
Although finished fish feed products is duty exempt and imports of key ingredients such as fish meal attract low tariff rates of up to 2.5%, some ingredients like pre-mix44 still face tariffs as high as 15%.
Key inputs for fish feed (e.g. fish meal, soybean meal, wheat flour, pre-mix containing vitamins etc) are not domestically available in large quantities in Indonesia hence most of the inputs are imported. Mills in Indonesia are not large enough to explore economies of scale in bulk purchases on inputs, unlike China and Thailand, and Indonesia’s geographical position imposes certain constraints and additional costs on imported inputs, especially where such inputs come from supply markets that are further away (e.g. Central America). This is especially true given that much of the goods coming into, and going out of, Indonesia pass through Singapore.45 Moreover inefficiencies in domestic input logistics within Indonesia (as is the case of textiles and apparel) can add up to 3% to the purchase price of raw materials (LPEM, 2006)46. To put this in perspective, one study suggests that 1% reduction in cost of shrimp feed should translate into 4.4% decrease in cost of producing 1kg of P. vannamei. In the same manner as textile and apparel companies, inefficiencies in output logistics can also affect costs in the processing sector where delays (up to 48 hours) and costs road transport and port logistics further increases cost of input sourcing.
Attempts to replace imported fish meal with locally produced meal have not been successful because the quality (e.g. salinity, protein content, etc) of locally-produced fish meal is too variable given the tropical multi-species nature of the fishery in Indonesia
43 Source: Interviews with shrimp farmers and processors 44 Pre-mix accounts for about 3-5% of the costs of feed inputs. Source: Field interviews 45 Compared with Vietnam and Thailand, there is some similarity in import logistics constraints facing Indonesia - but this is rapidly disappearing in the former. In the past, these two countries relied considerably on Singapore as a hub port - busy feeder services were developed by shipping lines to connect Thai ports (Laem Chabang primarily) and Vietnamese ports (Ho Chi Minh City) to Singapore (and HK as well for Vietnam). This sole reliance on feeder services and hub ports gradually gave way to direct calls by liner services as the trade volumes grew. This does not mean at this juncture that feeder services have stopped but direct services are making more and more inroads. The absence of direct shipping services from Indonesia is largely attributed to the lack of traffic volume and poor port facilities (shallow draft, etc.). 46 The impact of input logistics costs on cost of shrimp input is are probably more for the shrimp industry because farms are sparsely located in rural areas which are often poorly served by transport and physical infrastructure.
52
IMPROVING INDONESIA’S COMPETITIVENESS: CASE STUDY OF TEXTILE AND FARMED-SHRIMP INDUSTRIES
FARMED-SHRIMP VALUE CHAIN
compared to the single-species small-pelagic fishery in South America used to produce most imported fish meal47.
4. Poor management practices at the farm level significantly undermines shrimp-farm productivity Management practices at the farm level are among the most important impediments to improving production and quality of shrimp exports in Indonesia. In today’s aquaculture world, implementation of safety assurance systems in fish-processing are becoming very advanced, yet good practices and enforcement of standards at the farm level are lagging behind in many countries. Deteriorating shrimp management practices at the farm level are partially due to: Predominant use of traditional methods of shrimp farming by many farmers. Efforts to
help traditional shrimp farmers migrate into my intensive farming systems have not been very successful (e.g. the INBUDKAN Program). Furthermore, there is no conclusive evidence that intensive shrimp farming systems are more productive and efficient that semi-intensive ones. A recent study suggests that Indonesian semi-intensive farms are particularly competitive in relative to farms in other countries like China, Philippines, and so on (Madan Dey, 2006). As such active promotion of intensive farming may be misleading.
Insufficient extension activities by Government and the absence of effective knowledge transfer among private sector members along the shrimp value chain. The plasma/nucleus schemes have had mixed success. The scheme involved private sector companies providing sufficient guidance and inputs to farms from whom they purchase harvested shrimps.
A lack of ‘clinics’ in production areas to provide rapid testing of shrimp for disease and general guidance on disease management and control.
The impact of poor management practices in many farms is reflected in: Poor feed management practices and use of low quality feed by some farmers, prevents
the realization of higher feed conversion ratios (FCRs) Poor quality (disease free) fry purchased from hatcheries is reducing productivity and
increasing the incidence of disease. As such, survival rates for P. vannamei in Indonesia are low compared to many countries in the region.
Insufficient use of good shrimp health management techniques at the farm level. The most pressing issue here is the treatment of water adequately to prevent shrimp from getting sick. Farmers’ use of antibiotics and chemicals indiscriminately for disease control, which threatens the reputation of the whole industry in export markets. Limited focus on disease prevention through activities like site selection, design and sustainable farm management. 48
47 Panama (at $440/tonne), Honduras ($460/ton), and Indonesia ($900/ton), Vietnam ($1000/ton), Thailand ( $780) and China at ($650) 48 Poor farm siting: under decentralization, local government is now responsible for issuing permits for farming, except for foreign investment. But there is inadequate capacity/knowledge at the local level on which to base zoning – some farms have been set up in unsuitable areas next to industry e.g. E. Kalimantan, while others are in dispute with local government about currently un-used land provided to them formally by central government. Poor shrimp farm design and construction
53
IMPROVING INDONESIA’S COMPETITIVENESS: CASE STUDY OF TEXTILE AND FARMED-SHRIMP INDUSTRIES
FARMED-SHRIMP VALUE CHAIN
Poor water management and effluent discharge, and pond management More education and training is needed to improve farm management skills and practices. The GOI, in collaboration with the private sector, needs to improve the delivery of extension services. Lessons can be drawn from Thailand where an “Integrated Shrimp Business Operation Project” was initiated in 2006 to help a group of shrimp farmers meet international standards. Vietnam is also implementing a “Best Management Program” which has contributed to improvements in farm management practice by promoting good agriculture practices, codes of conduct, and traceability programs for shrimp farms. To complement ongoing extension services, the establishment of “shrimp clinics” in key production areas should be encouraged. These clinics could provide training to farmers breeding and disease control programs and technologies, and other relevant practices. 5. Increasing business environment costs/constraints accentuate cost of production Production costs can be reduced by lowering risk of disease, improving productivity, and by reducing the investment climate constraints. In an industry where productivity is already compromised due to poor management practices and standards, amidst increasing costs of doing business, the impact on competitiveness is worsening. Shrimp producers and exporter expressed particular concerns about the following issues: Lack of access by shrimp farmers and processors to finance/credit – Access by farmers to formal capital from the banking sector is virtually non-existent49 in Indonesia, due to: (1) Inability of farmers to provide required collateral (2) Inability of farmers to provide full proof of tax payments and other documentation (3) Poor previous performance and risk profile of the sector. This may have slowed down the ability of traditional farmers to change towards biosecure practices. Generally access to finance has improved due to the GOI’s introduction of the Project of Coastal Community Empowerment (PEMP); and the Aquaculture Intensification Program (INBUDKAN) respectively (See Annex 3, Table 33 for details). These programs provide different financing alternatives to farmers, but their sustainability and performance needs to be reviewed. In the processing sector, working capital is not perceived to be a particular problem, but companies are finding it difficult to access investment capital from banks due to poor previous performance and high risk profile. The result of this is a considerable ageing of plant and related infrastructure, which threatens the long-term future of the industry and its ability to invest in facilities that provide for improved health and hygiene requirements. It also restricts the ability of businesses to invest in necessary plant and equipment upgrades, which are required to diversify product ranges and therefore markets. This may be a key factor in explaining why Indonesia’s exports are characterized by little value-added production in comparison with some other exporting countries. Significant ‘informal costs’ of doing business - Interviews conducted as part of this study consistently found complaints that informal payments throughout the supply chain were 49 Note however the recent (2006) IFC loan of $45 million to PT Central Pertiwi Bahari, a subsidiary of the Charoen Pokphand Group. While some individuals interviewed as part of this study cited lack of access to capital as a problem, it should be noted that other recent work49 has suggested that informal credit sources are widely available in Indonesia in general, and in the shrimp sector in particular, with credit for working capital often available through the borrowings from agents or discounts from suppliers (of fuel, fish feed and ice).
54
IMPROVING INDONESIA’S COMPETITIVENESS: CASE STUDY OF TEXTILE AND FARMED-SHRIMP INDUSTRIES
FARMED-SHRIMP VALUE CHAIN
numerous and significant - increasing both the cost and uncertainty of doing business. This is consistent with the results of a survey conducted in 2003 summarized in the box below. Of particular concern are: (1) Stealing of product from farms at harvest time, which increases costs of security50 (2) Informal payments to officials in the land authority, to secure land title documents, which increases fixed costs. (3) Informal payments to customs officials in the Customs and Excise Department, to facilitate and ensure rapid clearance of imported/exported goods (4) Informal payments that emanate from nuisance taxes set by districts. Some examples include: (a) charges on shrimp farms use of rain water (b) some local governments would like to treat shrimp aquaculture and agriculture sector as resource based sectors such as the oil and mining sector. This would give the local government rights to 80% of the revenue. (5) Informal payments linked to duty/VAT remissions. 2003 Survey by the Committee of Regional Autonomy Monitoring on service fees “When asked, the 5,140 survey respondents about the fees they pay in conjunction with their dealings with local government officials, 4,364 (84.9%) admitted that they pay illegal charges in addition to the official fees, while 776 respondents (15.1%) did not provide an answer. The 4,364 respondents who answered the question pay an average of 60.62% of the official fees in illegal levies in order to obtain the government services they require to run their businesses. Only 84 respondents (1.9%) say that the additional unlawful fees they pay amount to more than 100% of the official charges. At any level, illegal fees constitute additional costs that reduce a firm’s productivity and competitiveness. Conclusion Most respondents (84.9%) acknowledge that they pay illegal charges on top of the official fees in
order to obtain services from local government officials. On average, these additional unofficial charges amount to 60.62% of the official fees paid.
Typically, 2% of a company’s total operating expenditure consists of illegal levies that have to be paid to local government officials, security officers, community groups, youth groups, mass organizations, gangsters and others. 7.3% of respondents say that illegal levies account for as much as 8% to 10% of their operating costs.
Illegal fees in the judicial process are seen as the most onerous (13.1% of respondents), followed by illegal fees imposed by security officers (11.5%), extortion by community groups (8.5%), and extortion by gangsters (6.1%).
Companies operating in the forestry, agro industry (plantations and food crops) and mining sectors are the most prone to the imposition of various types of levies by many different parties. They are seen to be exploiting the “gifts of nature”, which are commonly regarded as the property of the local people, who feel entitled to control and benefit from these resources. There is also a widespread perception that these firms are not making sufficient contributions to their respective local governments and communities. Thus, some members of the local community extract their“ entitlement” from business operators in the form of unofficial fees and charges.
Electricity is unreliable and costly compared to competitors - At the farm level, power costs can be as much as 30% of total farm production costs, and around 57% of non-raw material production costs for shrimp processing and cold storage. In an industry where margins are tight, competitiveness can be significantly affected by the costs of power (which are set to increase in Indonesia). As such shrimp farmers express the same complaints as textile firms, with respect to anticipated increases in cost of electricity. Estimates are that every 6% 50 While there is a cultural element to this with farms in many areas traditionally being expected to provide some small amounts of shrimp to those living in the area, the practice of stealing product has become much more organized in recent years.
55
IMPROVING INDONESIA’S COMPETITIVENESS: CASE STUDY OF TEXTILE AND FARMED-SHRIMP INDUSTRIES
FARMED-SHRIMP VALUE CHAIN
increase in electricity tariff would result in a 3% increase in cost of energy (IRA 2005). Perhaps more important for the shrimp, however, is the reliability of electricity supply. This is crucial in a sector dealing with a perishable commodity, and in which an emphasis on maintaining the quality of the cold chain is of paramount importance. At the hatchery and farm level, power is principally used for pumps to circulate water, and this is vital to maintain aeration and water quality and therefore survival and production levels. For the processors/cold storage companies, reliable electricity is important for both the efficiency of plant operations, and for the maintenance of stocks of product held in cold storage and therefore for both quality and profitability. The unreliable supply of electricity in Indonesia results in farmers and processors being forced to invest in their own power supply. For big farmers able to generate their own electricity, power outages are less of a problem. Labor regulations are imposing costs and productivity is reducing - All the labor issues that affect the textile industry are also relevant to the performance of the shrimp industry. Rigidities imposed by existing labor policies are increasingly burdensome and causing labor costs to increase at a rapid rate. 6. Need to develop a stronger Image, Market Information and Promotion Strategy Indonesia has historically relied on Japan as its main source market, with this market accounting for nearly 50% of its exports. However, as noted above, other exporting countries are increasingly penetrating this market, and the general global trend favors increased market diversification. United States is the next most important market with about 15% of exports. While some of the larger processing/export companies undertake market research and benchmark themselves against their competitors, the sector as a whole is not reacting sufficiently to current market changes and competitor behavior (e.g. market and product diversification). Given lower import tariff rates to EU relative to Thailand, and to the US relative to countries involved in the anti-dumping case (for the moment), one might expect Indonesia’s export performance in these markets to have been stronger. Many shrimp farmers and processors express concerns about “the image problem” with regard to Indonesian shrimp, and the perception that buyers in export markets have of Indonesian shrimp products. Results of interviews with buyers in key export markets suggest that buyers in fact generally view Indonesia’s performance rather favorably almost all aspects that may influence Indonesia’s image including – overall quality (taste, freshness, texture); price; value for money (i.e. a combination of quality and price); product ranges available; consistency in the range of sizes available; consistency in seasonal supply; speed to market; ease of communication and doing business (e.g. language); traceability; and the ability to meet special buyer requirements. The main area of weakness is perceived to be the quality of product, with responsibility for quality issues (current problems as well as solutions) viewed as lying firmly with the “Competent Authority” in Indonesia. For almost all of the key buyer requirements, the best global performer is perceived to be Thailand, although Bangladesh and India were reported to be especially price competitive by some buyers.
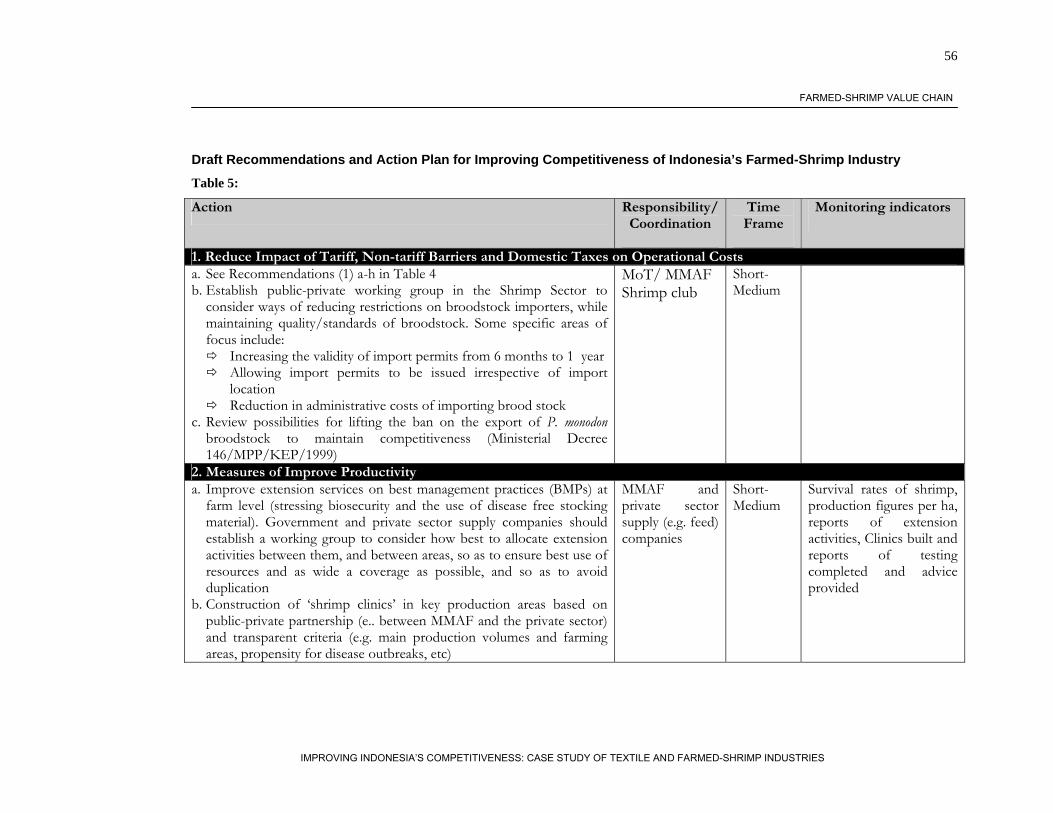
56
IMPROVING INDONESIA’S COMPETITIVENESS: CASE STUDY OF TEXTILE AND FARMED-SHRIMP INDUSTRIES
FARMED-SHRIMP VALUE CHAIN
Draft Recommendations and Action Plan for Improving Competitiveness of Indonesia’s Farmed-Shrimp Industry
Table 5:
Action Responsibility/ Coordination
Time Frame
Monitoring indicators
1. Reduce Impact of Tariff, Non-tariff Barriers and Domestic Taxes on Operational Costs a. See Recommendations (1) a-h in Table 4 b. Establish public-private working group in the Shrimp Sector to
consider ways of reducing restrictions on broodstock importers, while maintaining quality/standards of broodstock. Some specific areas of focus include:
Increasing the validity of import permits from 6 months to 1 year Allowing import permits to be issued irrespective of import
location Reduction in administrative costs of importing brood stock
c. Review possibilities for lifting the ban on the export of P. monodon broodstock to maintain competitiveness (Ministerial Decree 146/MPP/KEP/1999)
MoT/ MMAF Shrimp club
Short-Medium
2. Measures of Improve Productivity a. Improve extension services on best management practices (BMPs) at
farm level (stressing biosecurity and the use of disease free stocking material). Government and private sector supply companies should establish a working group to consider how best to allocate extension activities between them, and between areas, so as to ensure best use of resources and as wide a coverage as possible, and so as to avoid duplication
b. Construction of ‘shrimp clinics’ in key production areas based on public-private partnership (e.. between MMAF and the private sector) and transparent criteria (e.g. main production volumes and farming areas, propensity for disease outbreaks, etc)
MMAF and private sector supply (e.g. feed) companies
Short-Medium
Survival rates of shrimp, production figures per ha, reports of extension activities, Clinics built and reports of testing completed and advice provided
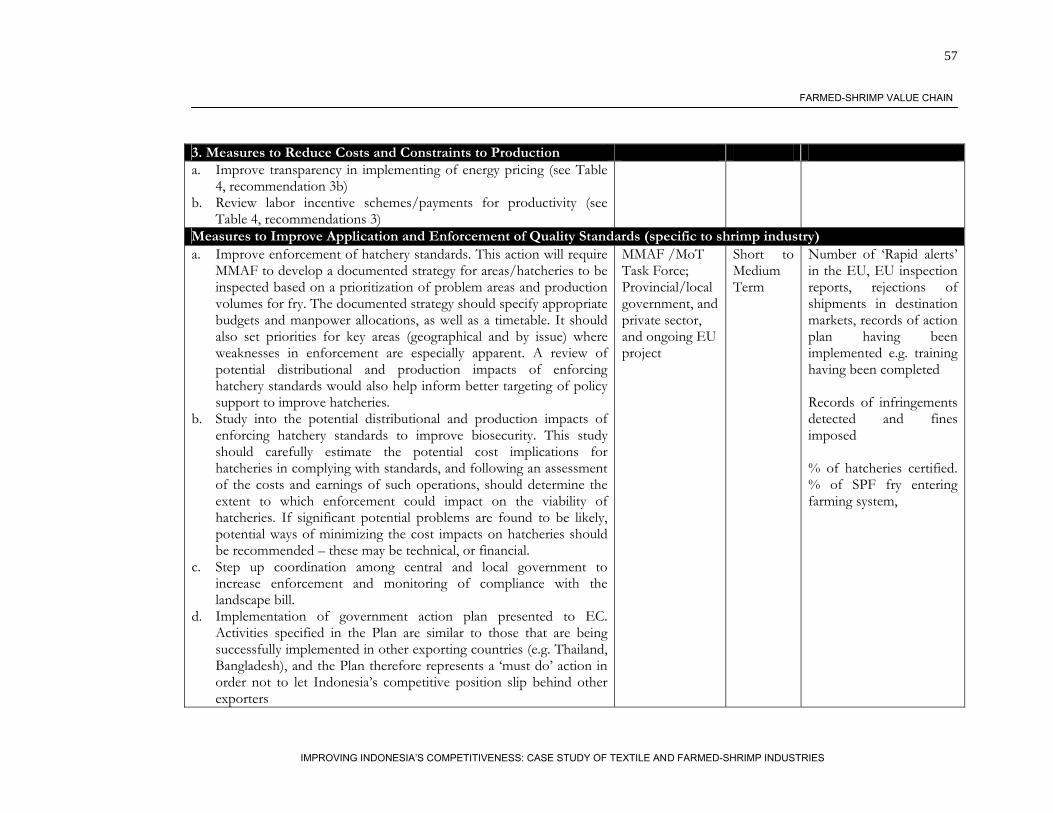
57
IMPROVING INDONESIA’S COMPETITIVENESS: CASE STUDY OF TEXTILE AND FARMED-SHRIMP INDUSTRIES
FARMED-SHRIMP VALUE CHAIN
3. Measures to Reduce Costs and Constraints to Production a. Improve transparency in implementing of energy pricing (see Table
4, recommendation 3b) b. Review labor incentive schemes/payments for productivity (see
Table 4, recommendations 3)
Measures to Improve Application and Enforcement of Quality Standards (specific to shrimp industry) a. Improve enforcement of hatchery standards. This action will require
MMAF to develop a documented strategy for areas/hatcheries to be inspected based on a prioritization of problem areas and production volumes for fry. The documented strategy should specify appropriate budgets and manpower allocations, as well as a timetable. It should also set priorities for key areas (geographical and by issue) where weaknesses in enforcement are especially apparent. A review of potential distributional and production impacts of enforcing hatchery standards would also help inform better targeting of policy support to improve hatcheries.
b. Study into the potential distributional and production impacts of enforcing hatchery standards to improve biosecurity. This study should carefully estimate the potential cost implications for hatcheries in complying with standards, and following an assessment of the costs and earnings of such operations, should determine the extent to which enforcement could impact on the viability of hatcheries. If significant potential problems are found to be likely, potential ways of minimizing the cost impacts on hatcheries should be recommended – these may be technical, or financial.
c. Step up coordination among central and local government to increase enforcement and monitoring of compliance with the landscape bill.
d. Implementation of government action plan presented to EC. Activities specified in the Plan are similar to those that are being successfully implemented in other exporting countries (e.g. Thailand, Bangladesh), and the Plan therefore represents a ‘must do’ action in order not to let Indonesia’s competitive position slip behind other exporters
MMAF /MoT Task Force; Provincial/local government, and private sector, and ongoing EU project
Short to Medium Term
Number of ‘Rapid alerts’ in the EU, EU inspection reports, rejections of shipments in destination markets, records of action plan having been implemented e.g. training having been completed Records of infringements detected and fines imposed % of hatcheries certified. % of SPF fry entering farming system,
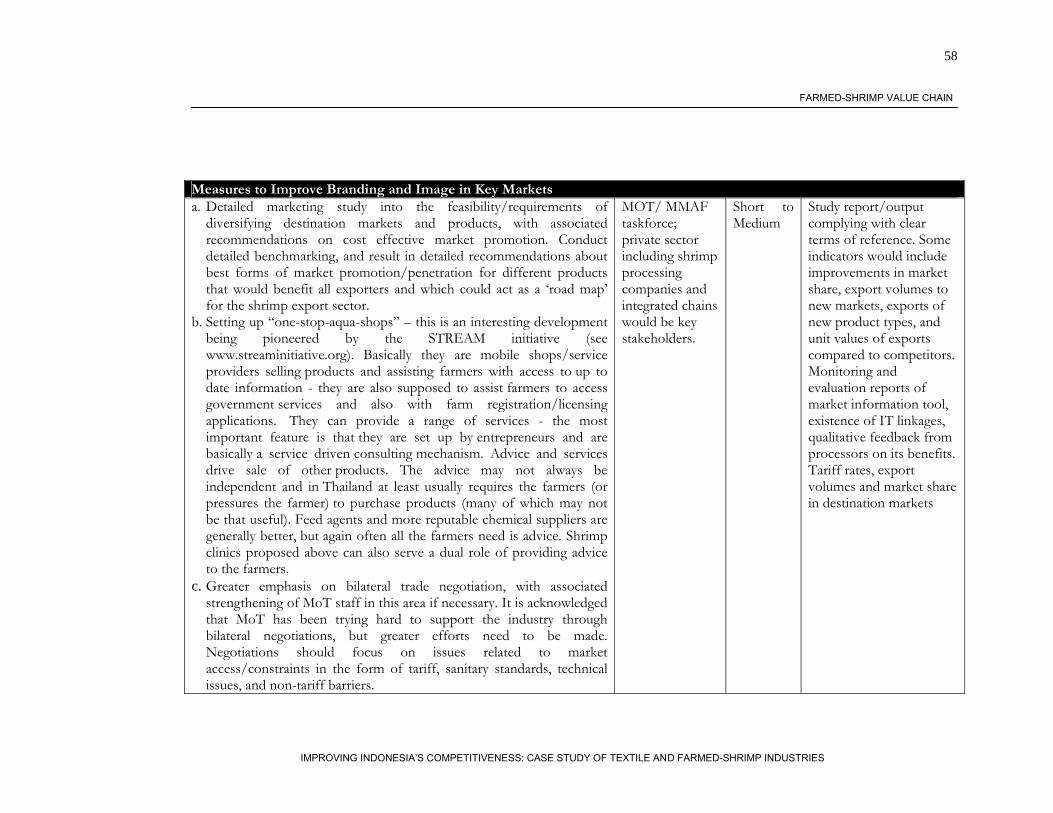
58
IMPROVING INDONESIA’S COMPETITIVENESS: CASE STUDY OF TEXTILE AND FARMED-SHRIMP INDUSTRIES
FARMED-SHRIMP VALUE CHAIN
Measures to Improve Branding and Image in Key Markets a. Detailed marketing study into the feasibility/requirements of
diversifying destination markets and products, with associated recommendations on cost effective market promotion. Conduct detailed benchmarking, and result in detailed recommendations about best forms of market promotion/penetration for different products that would benefit all exporters and which could act as a ‘road map’ for the shrimp export sector.
b. Setting up “one-stop-aqua-shops” – this is an interesting development being pioneered by the STREAM initiative (see www.streaminitiative.org). Basically they are mobile shops/service providers selling products and assisting farmers with access to up to date information - they are also supposed to assist farmers to access government services and also with farm registration/licensing applications. They can provide a range of services - the most important feature is that they are set up by entrepreneurs and are basically a service driven consulting mechanism. Advice and services drive sale of other products. The advice may not always be independent and in Thailand at least usually requires the farmers (or pressures the farmer) to purchase products (many of which may not be that useful). Feed agents and more reputable chemical suppliers are generally better, but again often all the farmers need is advice. Shrimp clinics proposed above can also serve a dual role of providing advice to the farmers.
c. Greater emphasis on bilateral trade negotiation, with associated strengthening of MoT staff in this area if necessary. It is acknowledged that MoT has been trying hard to support the industry through bilateral negotiations, but greater efforts need to be made. Negotiations should focus on issues related to market access/constraints in the form of tariff, sanitary standards, technical issues, and non-tariff barriers.
MOT/ MMAF taskforce; private sector including shrimp processing companies and integrated chains would be key stakeholders.
Short to Medium
Study report/output complying with clear terms of reference. Some indicators would include improvements in market share, export volumes to new markets, exports of new product types, and unit values of exports compared to competitors. Monitoring and evaluation reports of market information tool, existence of IT linkages, qualitative feedback from processors on its benefits. Tariff rates, export volumes and market share in destination markets
59
IMPROVING INDONESIA’S COMPETITIVENESS: CASE STUDY OF TEXTILE AND FARMED-SHRIMP INDUSTRIES
TRADE FACILITATION IN INDONESIA
IV. Trade Facilitation in Indonesia
This section deals with trade facilitation issues that cut across both the shrimp and textile value chains – and possibly economy wide as well – which cause friction in the trading process between the international buyer and the Indonesian seller. Trade facilitation is discussed from a relatively broad context covering the trading of goods across national borders starting from the time an international purchase order is received by the seller from an overseas buyer to the time that the transaction is completed when the finished product is delivered to the international buyer and payment is cashed by the seller. It includes all the intervening activities, namely sourcing material inputs, order processing, inbound international transport, import border clearance, inland transport, warehousing and storage of inbound materials, manufacturing into finished product, inventory management, domestic transport, export border clearance and international transport. Many parties are engaged in these activities which are often plagued by inefficient procedures of a commercial and regulatory nature that raise the costs of trading across borders, at the expense of competitiveness of Indonesian exporters. Such procedures include excessive data and documentation requirements, lack of transparency, slow legal redress, long cargo release and clearance times, absence of co-ordination between border control agencies, and at times, illegal collusion between border control officials and some rogue traders. The purpose of trade facilitation is to remedy these difficulties through the adoption of a comprehensive and integrated approach that simplify and harmonize procedures that will ensure that all relevant activities take place in an efficient, transparent, and predictable manner, based on internationally accepted norms, standards and best practices. Global Trends in Trade Facilitation In today’s global world, the importance of trade facilitation measures and associated behind-the-border issues cannot be overemphasized. More and more countries are paying increasing attention to improving transaction costs associated with import and export procedures and other activities that affect the free and efficient flow of goods and service across borders. Specifically, countries are focusing attention on the following trends: (1) Increased attention to supply chain efficiency: Supply chain efficiencies have strong effects on
productivity and competitiveness of private firms in developing countries. It takes Kazakhstan 93 days to export a container; it takes Indonesia 25 days; Malaysia 20 days while it takes Germany only 6 days to export a similar container. These variations in supply chain performance across countries are caused by a combination of differences in quality of infrastructure services as well differences in policies, procedures and institutions that in turn affect trade competitiveness of countries. Countries are increasingly moving towards: Harmonization and simplification of procedures, including documentation Adoption of common e-business standards and codes for automation of trade
related information and documents
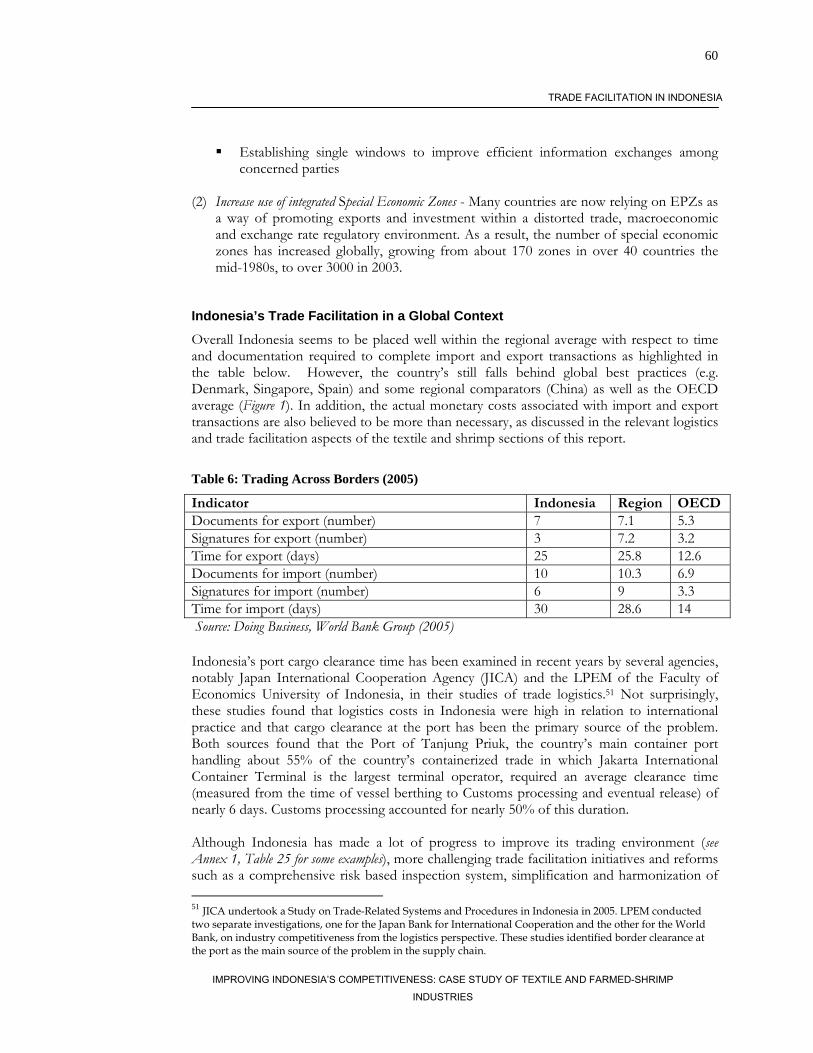
60
IMPROVING INDONESIA’S COMPETITIVENESS: CASE STUDY OF TEXTILE AND FARMED-SHRIMP INDUSTRIES
TRADE FACILITATION IN INDONESIA
Establishing single windows to improve efficient information exchanges among concerned parties
(2) Increase use of integrated Special Economic Zones - Many countries are now relying on EPZs as
a way of promoting exports and investment within a distorted trade, macroeconomic and exchange rate regulatory environment. As a result, the number of special economic zones has increased globally, growing from about 170 zones in over 40 countries the mid-1980s, to over 3000 in 2003.
Indonesia’s Trade Facilitation in a Global Context
Overall Indonesia seems to be placed well within the regional average with respect to time and documentation required to complete import and export transactions as highlighted in the table below. However, the country’s still falls behind global best practices (e.g. Denmark, Singapore, Spain) and some regional comparators (China) as well as the OECD average (Figure 1). In addition, the actual monetary costs associated with import and export transactions are also believed to be more than necessary, as discussed in the relevant logistics and trade facilitation aspects of the textile and shrimp sections of this report.
Table 6: Trading Across Borders (2005)
Indicator Indonesia Region OECDDocuments for export (number) 7 7.1 5.3 Signatures for export (number) 3 7.2 3.2 Time for export (days) 25 25.8 12.6 Documents for import (number) 10 10.3 6.9 Signatures for import (number) 6 9 3.3 Time for import (days) 30 28.6 14 Source: Doing Business, World Bank Group (2005) Indonesia’s port cargo clearance time has been examined in recent years by several agencies, notably Japan International Cooperation Agency (JICA) and the LPEM of the Faculty of Economics University of Indonesia, in their studies of trade logistics.51 Not surprisingly, these studies found that logistics costs in Indonesia were high in relation to international practice and that cargo clearance at the port has been the primary source of the problem. Both sources found that the Port of Tanjung Priuk, the country’s main container port handling about 55% of the country’s containerized trade in which Jakarta International Container Terminal is the largest terminal operator, required an average clearance time (measured from the time of vessel berthing to Customs processing and eventual release) of nearly 6 days. Customs processing accounted for nearly 50% of this duration. Although Indonesia has made a lot of progress to improve its trading environment (see Annex 1, Table 25 for some examples), more challenging trade facilitation initiatives and reforms such as a comprehensive risk based inspection system, simplification and harmonization of 51 JICA undertook a Study on Trade-Related Systems and Procedures in Indonesia in 2005. LPEM conducted two separate investigations, one for the Japan Bank for International Cooperation and the other for the World Bank, on industry competitiveness from the logistics perspective. These studies identified border clearance at the port as the main source of the problem in the supply chain.
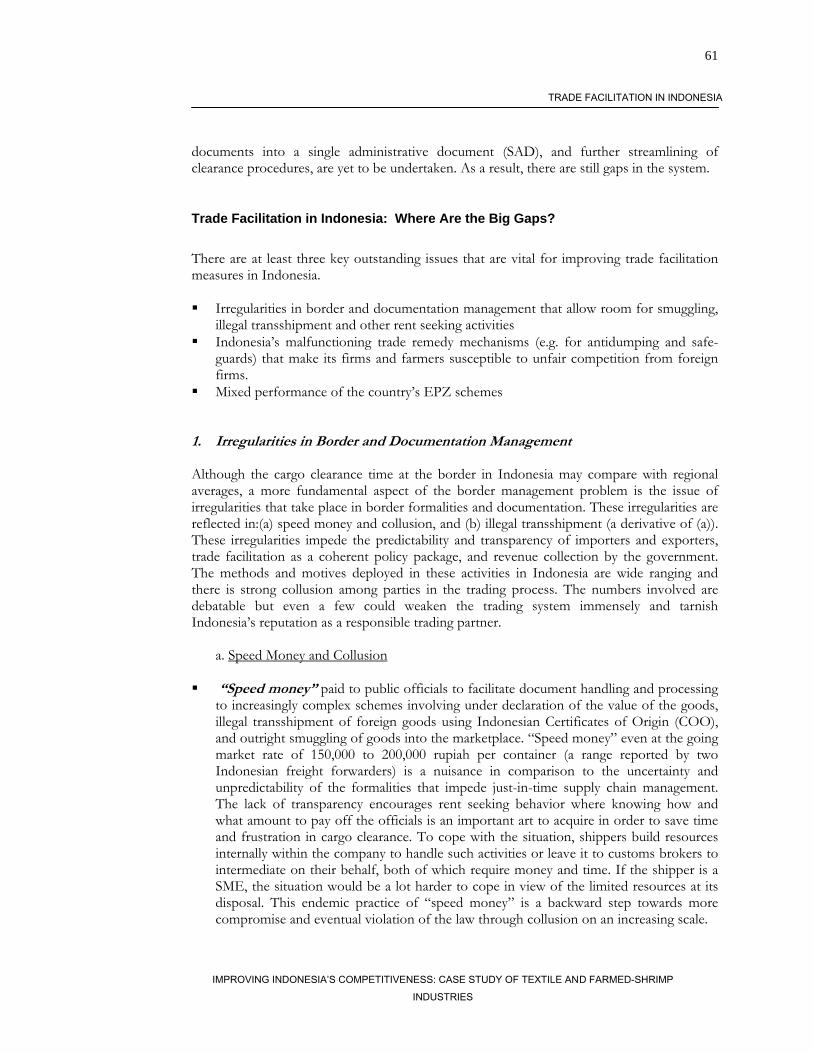
61
IMPROVING INDONESIA’S COMPETITIVENESS: CASE STUDY OF TEXTILE AND FARMED-SHRIMP INDUSTRIES
TRADE FACILITATION IN INDONESIA
documents into a single administrative document (SAD), and further streamlining of clearance procedures, are yet to be undertaken. As a result, there are still gaps in the system.
Trade Facilitation in Indonesia: Where Are the Big Gaps?
There are at least three key outstanding issues that are vital for improving trade facilitation measures in Indonesia. Irregularities in border and documentation management that allow room for smuggling,
illegal transshipment and other rent seeking activities Indonesia’s malfunctioning trade remedy mechanisms (e.g. for antidumping and safe-
guards) that make its firms and farmers susceptible to unfair competition from foreign firms.
Mixed performance of the country’s EPZ schemes 1. Irregularities in Border and Documentation Management Although the cargo clearance time at the border in Indonesia may compare with regional averages, a more fundamental aspect of the border management problem is the issue of irregularities that take place in border formalities and documentation. These irregularities are reflected in:(a) speed money and collusion, and (b) illegal transshipment (a derivative of (a)). These irregularities impede the predictability and transparency of importers and exporters, trade facilitation as a coherent policy package, and revenue collection by the government. The methods and motives deployed in these activities in Indonesia are wide ranging and there is strong collusion among parties in the trading process. The numbers involved are debatable but even a few could weaken the trading system immensely and tarnish Indonesia’s reputation as a responsible trading partner.
a. Speed Money and Collusion “Speed money” paid to public officials to facilitate document handling and processing
to increasingly complex schemes involving under declaration of the value of the goods, illegal transshipment of foreign goods using Indonesian Certificates of Origin (COO), and outright smuggling of goods into the marketplace. “Speed money” even at the going market rate of 150,000 to 200,000 rupiah per container (a range reported by two Indonesian freight forwarders) is a nuisance in comparison to the uncertainty and unpredictability of the formalities that impede just-in-time supply chain management. The lack of transparency encourages rent seeking behavior where knowing how and what amount to pay off the officials is an important art to acquire in order to save time and frustration in cargo clearance. To cope with the situation, shippers build resources internally within the company to handle such activities or leave it to customs brokers to intermediate on their behalf, both of which require money and time. If the shipper is a SME, the situation would be a lot harder to cope in view of the limited resources at its disposal. This endemic practice of “speed money” is a backward step towards more compromise and eventual violation of the law through collusion on an increasing scale.
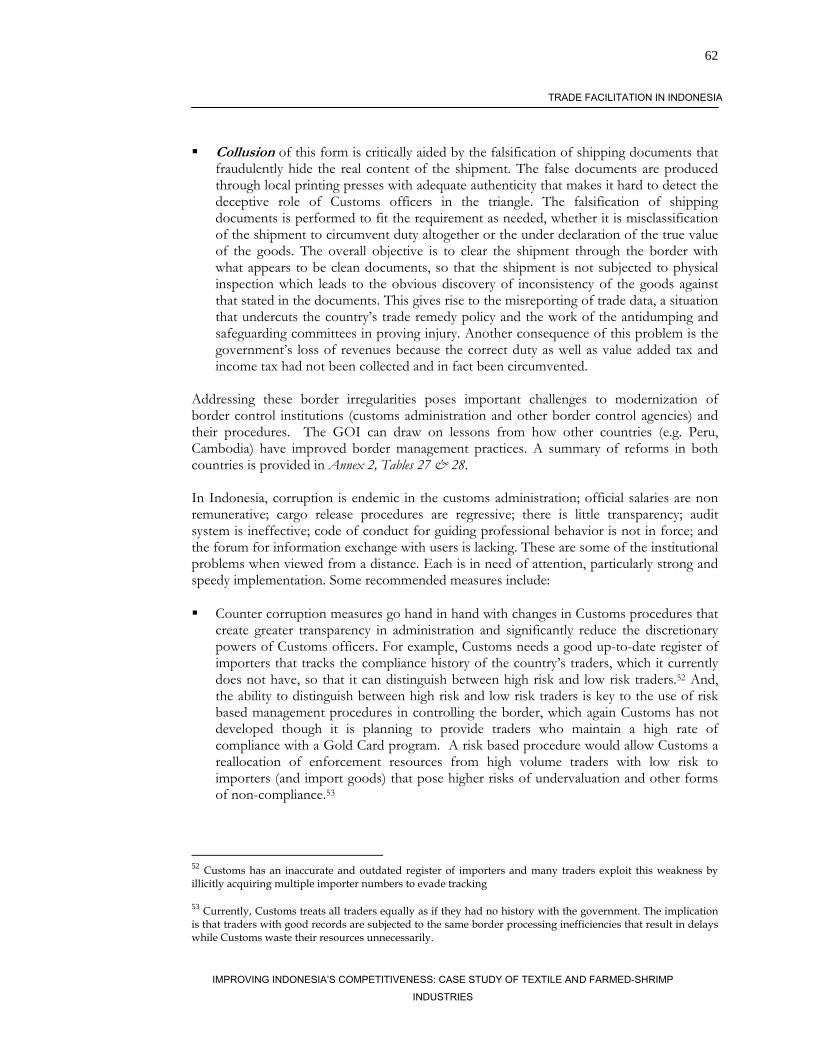
62
IMPROVING INDONESIA’S COMPETITIVENESS: CASE STUDY OF TEXTILE AND FARMED-SHRIMP INDUSTRIES
TRADE FACILITATION IN INDONESIA
Collusion of this form is critically aided by the falsification of shipping documents that fraudulently hide the real content of the shipment. The false documents are produced through local printing presses with adequate authenticity that makes it hard to detect the deceptive role of Customs officers in the triangle. The falsification of shipping documents is performed to fit the requirement as needed, whether it is misclassification of the shipment to circumvent duty altogether or the under declaration of the true value of the goods. The overall objective is to clear the shipment through the border with what appears to be clean documents, so that the shipment is not subjected to physical inspection which leads to the obvious discovery of inconsistency of the goods against that stated in the documents. This gives rise to the misreporting of trade data, a situation that undercuts the country’s trade remedy policy and the work of the antidumping and safeguarding committees in proving injury. Another consequence of this problem is the government’s loss of revenues because the correct duty as well as value added tax and income tax had not been collected and in fact been circumvented.
Addressing these border irregularities poses important challenges to modernization of border control institutions (customs administration and other border control agencies) and their procedures. The GOI can draw on lessons from how other countries (e.g. Peru, Cambodia) have improved border management practices. A summary of reforms in both countries is provided in Annex 2, Tables 27 & 28. In Indonesia, corruption is endemic in the customs administration; official salaries are non remunerative; cargo release procedures are regressive; there is little transparency; audit system is ineffective; code of conduct for guiding professional behavior is not in force; and the forum for information exchange with users is lacking. These are some of the institutional problems when viewed from a distance. Each is in need of attention, particularly strong and speedy implementation. Some recommended measures include: Counter corruption measures go hand in hand with changes in Customs procedures that
create greater transparency in administration and significantly reduce the discretionary powers of Customs officers. For example, Customs needs a good up-to-date register of importers that tracks the compliance history of the country’s traders, which it currently does not have, so that it can distinguish between high risk and low risk traders.52 And, the ability to distinguish between high risk and low risk traders is key to the use of risk based management procedures in controlling the border, which again Customs has not developed though it is planning to provide traders who maintain a high rate of compliance with a Gold Card program. A risk based procedure would allow Customs a reallocation of enforcement resources from high volume traders with low risk to importers (and import goods) that pose higher risks of undervaluation and other forms of non-compliance.53
52 Customs has an inaccurate and outdated register of importers and many traders exploit this weakness by illicitly acquiring multiple importer numbers to evade tracking 53 Currently, Customs treats all traders equally as if they had no history with the government. The implication is that traders with good records are subjected to the same border processing inefficiencies that result in delays while Customs waste their resources unnecessarily.
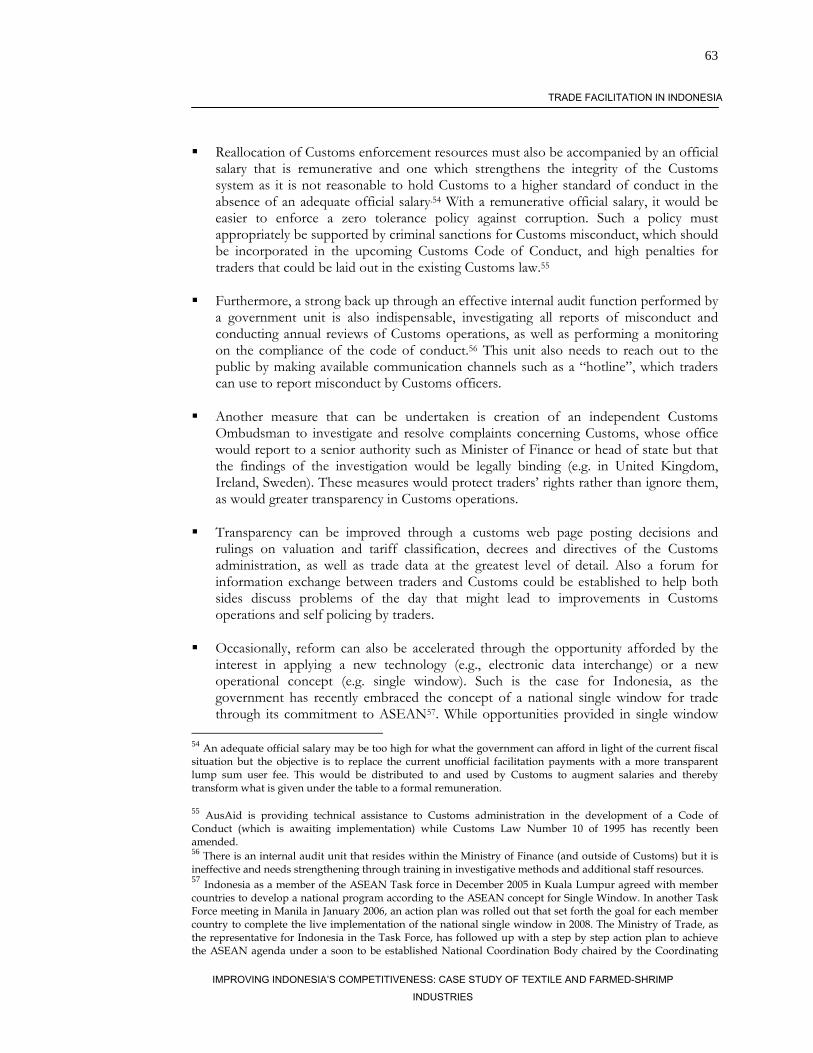
63
IMPROVING INDONESIA’S COMPETITIVENESS: CASE STUDY OF TEXTILE AND FARMED-SHRIMP INDUSTRIES
TRADE FACILITATION IN INDONESIA
Reallocation of Customs enforcement resources must also be accompanied by an official salary that is remunerative and one which strengthens the integrity of the Customs system as it is not reasonable to hold Customs to a higher standard of conduct in the absence of an adequate official salary.54 With a remunerative official salary, it would be easier to enforce a zero tolerance policy against corruption. Such a policy must appropriately be supported by criminal sanctions for Customs misconduct, which should be incorporated in the upcoming Customs Code of Conduct, and high penalties for traders that could be laid out in the existing Customs law.55
Furthermore, a strong back up through an effective internal audit function performed by
a government unit is also indispensable, investigating all reports of misconduct and conducting annual reviews of Customs operations, as well as performing a monitoring on the compliance of the code of conduct.56 This unit also needs to reach out to the public by making available communication channels such as a “hotline”, which traders can use to report misconduct by Customs officers.
Another measure that can be undertaken is creation of an independent Customs
Ombudsman to investigate and resolve complaints concerning Customs, whose office would report to a senior authority such as Minister of Finance or head of state but that the findings of the investigation would be legally binding (e.g. in United Kingdom, Ireland, Sweden). These measures would protect traders’ rights rather than ignore them, as would greater transparency in Customs operations.
Transparency can be improved through a customs web page posting decisions and
rulings on valuation and tariff classification, decrees and directives of the Customs administration, as well as trade data at the greatest level of detail. Also a forum for information exchange between traders and Customs could be established to help both sides discuss problems of the day that might lead to improvements in Customs operations and self policing by traders.
Occasionally, reform can also be accelerated through the opportunity afforded by the
interest in applying a new technology (e.g., electronic data interchange) or a new operational concept (e.g. single window). Such is the case for Indonesia, as the government has recently embraced the concept of a national single window for trade through its commitment to ASEAN57. While opportunities provided in single window
54 An adequate official salary may be too high for what the government can afford in light of the current fiscal situation but the objective is to replace the current unofficial facilitation payments with a more transparent lump sum user fee. This would be distributed to and used by Customs to augment salaries and thereby transform what is given under the table to a formal remuneration. 55 AusAid is providing technical assistance to Customs administration in the development of a Code of Conduct (which is awaiting implementation) while Customs Law Number 10 of 1995 has recently been amended. 56 There is an internal audit unit that resides within the Ministry of Finance (and outside of Customs) but it is ineffective and needs strengthening through training in investigative methods and additional staff resources. 57 Indonesia as a member of the ASEAN Task force in December 2005 in Kuala Lumpur agreed with member countries to develop a national program according to the ASEAN concept for Single Window. In another Task Force meeting in Manila in January 2006, an action plan was rolled out that set forth the goal for each member country to complete the live implementation of the national single window in 2008. The Ministry of Trade, as the representative for Indonesia in the Task Force, has followed up with a step by step action plan to achieve the ASEAN agenda under a soon to be established National Coordination Body chaired by the Coordinating
64
IMPROVING INDONESIA’S COMPETITIVENESS: CASE STUDY OF TEXTILE AND FARMED-SHRIMP INDUSTRIES
TRADE FACILITATION IN INDONESIA
concept are admirable the challenges to be faced in implementing it should not be underestimated because the concept is not a panacea for an insecure border. For single window to work and achieve the gains it promises, fundamental reforms in border management have to be completed. It should be noted that successful countries that have adopted single window were those that have streamlined their procedures over a period of time under an environment that was evolutionary rather than revolutionary, as witnessed by the experience of developed countries such as UK, Sweden, U.S., Singapore and others. Developing countries that were also successful are few and far in between, notably Mauritius and most recently Cambodia where work is still underway. The case of Cambodia bears mentioning because it represents a progressive model in which the circumstances are not too unlike those in Indonesia.58
Finally, institutional coordination is key to border reforms because the responsibility for
and impact of reform cuts across many government departments and private sector parties (and yet falls on no-man’s land). Reforms are best carried out under an umbrella committee (chaired by a strong leader) that represents the interests of all public and private stakeholders engaged in the trading process. International best practice point to the formation of a National Trade Facilitation Committee59 which has the primary purpose of encouraging and implementing the modernization of trade procedures, including that of border management reform and single window. This committee would provide a national forum for (i) the dialogue on border formalities, procedures and documentation used in international trade (facilitation objectives); (ii) the proposal of trade and transport-related regulations and practices (regulatory objectives); (iii) policy recommendations on facilities and investments in support of trade and transport (development policy objectives); and (iv) building awareness of the methods and benefits of trade facilitation (training objectives). Trading countries that have national bodies of this nature range from developed economies such as U.K., France, Sweden, etc. to less developed economies such as Pakistan.
Customs reform is an integrated process that cannot be approached in a piecemeal manner. Reform requires careful balancing of conflicting interests, strong political commitment to establish the necessary legislative base, availability of resources, and technical procedures that take away the discretionary powers of Customs officers. International experience has shown that positive results can be achieved, as demonstrated by Peru, Philippines, Cambodia, China and a number of other developing countries. Minister for Economic Affairs that would involve more than 30 parties in the trading process. The action plan is predicated on a pilot project to be implemented in a free trade zone in Batam Island, an area rumored to be the scene of illegal transshipment activities and border irregularities. 58 Cambodia’s position with respect to the ASEAN Single Window is presently under discussion. 59 In Indonesia’s case, the proposition for creating a National Trade Facilitation Committee would need consideration of its co-existence with the National Coordinating Board, which is the forerunner created to oversee the work of the Single Window project. As a Committee of this nature would typically have a much wider purview covering a range of areas targeted at improving trade facilitation, whereas the work of the Board is dedicated to the implementation of the Single Window, it is conventional practice to incorporate such work under the Committee’s umbrella (as an area in the simplification of trade procedures, which is one of the primary functions). In other words, the Board and its work on Single Window can migrate into the Committee under which it would function at the sub-committee level in conjunction with other sub-committees specially set up to address various trade facilitation issues of the day.
65
IMPROVING INDONESIA’S COMPETITIVENESS: CASE STUDY OF TEXTILE AND FARMED-SHRIMP INDUSTRIES
TRADE FACILITATION IN INDONESIA
b. Illegal Transshipment Activities In recent years there have been allegations of illegal transshipments where goods from other countries are claimed as products produced in Indonesia carrying COO issued by the Ministry of Trade. Rumors abound as to the methods deployed in such illegal practices but the view of the Indonesian exporting community is that these began with falsifying the COO domestically and then later expanded more aggressively to falsifying the document abroad, either in the hub ports of Singapore and Hong Kong or in the country of production, so that the goods never enter Indonesia at all. Farmed shrimp and textiles are two such products under close scrutiny at the present time by U.S. and EU authorities (Annex 2 Table 29). Interviews suggest that illegal transshipment of farmed shrimp is linked to Vietnamese, Chinese and Thai sources of production while textiles are linked to Chinese origin, both of which are alleged to take advantage of Indonesian COO illegally.60 Estimates of the extent and magnitude of illegal transshipments vary widely.61 While there is no reliable quantitative evidence on the magnitude of illegal transshipments of textiles, the point remains that any suspicion of transshipment has serious negative impact on Indonesia’s reputation in export markets; it also exposes legitimate textile producers to severe actions by the importing country that could hurt the industry. Informal discussions with the U.S. Customs indicate that the Indonesian textile industry is definitely under scrutiny though no cases have emerged yet. In the farmed shrimps industry, the U.S. and EU authorities are reported to have complained to the Indonesian government last year about such activities. The Ministry of Trade has acknowledged that European Union officials, as well as U.S. officials, have visited Indonesia several times to investigate the matter, the latest as recently as the EU visit of February 2006. The surge in interest coincided with U.S. import bans on China, Vietnam and Thailand on antidumping grounds in 2003 and 2004. As Indonesia’s shrimp production was insufficient to meet U.S. demand, the sanctions against neighboring countries brought opportunistic exporters a surprising prospect. In 2004, U.S. Customs sent an inspection team to Indonesia to audit the records of several companies and up to 8 of these companies were suspected of transshipping Chinese shrimps from Guangdong Province. The industry and the government need to be proactive in ensuring that the potential for illegal transshipment practices are minimized, as much as possible, in collaboration with their trading partners. The GOI is aware of these issues, and has taken a number of important steps to address them. For example, soon after the departure of the U.S. inspection team, the Indonesian government undertook several actions:
60 According to the Indonesian Textile Association (API), Chinese textiles were first switched to Indonesian origin at the bonded warehouse (Gudang Berikat) or the bonded zone (Kawasan Berikat Nusantara) and then later the practice expanded to direct shipments from China. 61 While a recent report based on trade statistics suggests an estimate of less than 0.5% (see William James, 2006), according to the Indonesia Textile Association, illegal transshipments could be as high as 30% of textile exports.
66
IMPROVING INDONESIA’S COMPETITIVENESS: CASE STUDY OF TEXTILE AND FARMED-SHRIMP INDUSTRIES
TRADE FACILITATION IN INDONESIA
Measures were taken to tighten the improper issuance of COO in October 2004 when the Minister of Trade issued ministerial decree 618 that reduced the authorized locations for issuing the certificates from 183 to 84. Almost another year later, the minister issued another decree in September 2005 that ruled that only 14 of the 84 locations were authorized to issue certificates for shrimps and textiles. In comparison, a strong and geographically large exporting nation like China has only 14 locations authorized to issue COO. In early 2006 after the last visit of the EU inspection team, the Ministry of Trade took further steps to improve the procedure for issuing the COO (after having reduced the number of issuing locations significantly). Under the new procedure, which is still in the consultation stage with Customs, the existing documents comprising Customs Export Declaration Form (PEB), Bill of Lading, and Commercial Invoice of the exporter would need to be supplemented by additional ones to attest the authenticity of the product as originating from Indonesia. In the case of the U.S., these would include (i) the U.S. State Department’s Shrimp Importer and Exporter Form and (ii) the phytosanitary certificate issued by the laboratories of the Ministry of Marine Affairs and Fisheries, whereas the EU would need additional documents pertaining to phytosanitary certificate from the Ministry of Marine Affairs and Fisheries and the GSP Form A.
By the end of 2004, the Ministry of Trade also banned all shrimp imports into Indonesia
in a bid to prevent such illicit re-exports and to protect the reputation of the shrimp industry. The ban was initially set for a fixed period of 6 months but it has in fact been renewed twice, once in June, 2005 and again in December, 2005. In early 2006, the Ministry of Marine Resources and Fisheries preemptively banned seven Indonesian companies from exporting shrimp to the US on evidence that the product originated from China and Taiwan.
More recently the Trade Minister visited Washington in April 2006 to discuss trade
matters with U.S. authorities and secured agreement on the transshipment issue that both countries work together to resolve the problem. Though the substance of the agreement is not made known, a cooperative partnership appears to be the approach that would be taken. This approach is consistent with U.S. practice. See Annex 2, Table 26 for details of specific steps taken by the US government.
In dealing with illegal transshipment issues strategically, it would be best to: Pursue a program that would, first of all, clean up the illegal issuance of Indonesian
certificate of origin that is employed in transshipment activity. This matter is of the greatest urgency because of the high risk of the importing countries that might levy trade sanctions against Indonesian textiles and shrimp, an action that would immediately halt or disrupt the legitimate exports of these two industries. Policies should be implemented as soon as possible to empower the concerned agencies with the mandate to develop and implement the required measures to stamp out these illegal activities. Such measures should be developed closely with the importing country on a bilateral basis, as explained next.
Employ more proactive discussions at the bilateral level between Indonesia and the
government of the import country and, where needed, extended to a third country that represents the actual origin of the product. The best way for Indonesia to respond is to work with the authorities of the importing country (e.g. the US) on a partnership basis
67
IMPROVING INDONESIA’S COMPETITIVENESS: CASE STUDY OF TEXTILE AND FARMED-SHRIMP INDUSTRIES
TRADE FACILITATION IN INDONESIA
that would protect the legitimacy of its export manufacturers and producers while at the same time expose the scope of the problem, identify the violators, and deter future violations. A high level of cooperation by the countries is called for, particularly between Indonesia and the importing countries, which allows their governments to take special measures in the affected trades represented by farmed shrimp and textiles and apparel - usually though an official memorandum of understanding (see Annex 2, Table 30 for Standard Provisions Expected by U.S. in a Memorandum of Understanding (MOU)). At the time of writing, a draft MOU between Indonesia and the US was already in place.
2. Indonesia’s Malfunctioning Trade Remedy Mechanisms Indonesia relies on trade remedies in the form of duties or other import restrictions to protect its industries from injury due to unfair foreign trade practices or unexpected import surges after determining that a domestic industry has been injured or threatened with injury by imports. Specifically, the government imposes antidumping or countervailing duties when it finds that imports are priced at less than home market value (or normal value), or benefit from a subsidy, and that such imports injure the domestic industry. Similarly, the government imposes safeguard measures in the form of temporary import restrictions after finding that import surges have seriously injured or threatened serious injury to domestic industry and that emergency protection is necessary to provide the comfort of time for adjustment. Indonesia’s investigative process and procedures for trade remedies are modeled after the WTO guidelines, namely Article VI of GATT for antidumping and Article XVI of GATT for countervailing measures. A safeguard committee (Komite Pengamanan Perdagangan Indonesia or KPP) was established later in 2003 through Presidential Decree No. 84/2002 on Domestic Industrial Safeguard Measures Resulting from a Surge in Imports. KPP conducts its investigations along WTO procedures (as set out in Article XIX of GATT and Agreement on Safeguards) and each investigation is focused on whether the surge in import has caused serious injury. However, no ministerial decree has been issued yet to provide for the formal organization of KPP or a Secretariat to support its functions. This significantly undermines its capacity to perform. For example: It takes excessively long time to resolve cases, particularly for dumping and subsidy
cases, frequently exceeding 12 months. It was reported that in one case involving dumping, the decision took 3 years to reach the enforcement stage, a period that rendered irreversible damage to the applicant. To date, KPP has ruled on only one case.
Strong lobby groups representing sellers from exporting countries caused undue
influence on government officials that adversely affected the decision making process, which in at least one case led to the roll back of countervailing duties from the recommended level to a lower level. This kind of performance is indicative of an ineffective or malfunctioning trade remedy system62.
62 Against this background, the government is contemplating a plan to merge KPP with KADI into a single committee so that the new entity would function as an effective single trade-remedy authority under a comprehensive trade remedy law. The success of this effort will depend on continuous technical assistance and improvements in availability and capacity of human resources. Poor technical capacity undermines KPP’s ability to perform its functions effectively.
68
IMPROVING INDONESIA’S COMPETITIVENESS: CASE STUDY OF TEXTILE AND FARMED-SHRIMP INDUSTRIES
TRADE FACILITATION IN INDONESIA
Inaccurate reporting of trade data and unreliable border control also weakens the ability of authorities to enforce trade remedies effectively. Both issues fall within the purview of border management agencies, of which Customs is at the forefront as the lead entity. Inaccurate trade statistics is masking the real situation and making it highly improbable for the authorities to prove unfair trade practices or unexpected import surges – witness the case of apparel and electronics where official import statistics. Under-recording is a byproduct of improper border control activities which involve the falsification of import documents so that goods are misclassified to circumvent duties or even outright smuggling. Such activities render the border insecure and it follows that trade remedies, however well developed, cannot be expected to be enforced effectively to protect Indonesian industries. To be effective, trade remedy mechanisms need to be speedy in response, thorough in investigation, and effective in enforcement of the recommended measures. To strengthen the current system, GOI could draw on lessons from some practices that were successfully adopted in the US (see detailed summary in Annex 2, Table 26) such as: Although the legal framework for trade remedies appears fragmented63, the execution of
the regime is quite efficient and effective. This is because a core part of the investigations entails proof of injury, regardless of whether the case is antidumping, countervailing duty or safeguard measure, which is an area of responsibility that rests with a very competent anchor institution – the USITC.
Another key factor is the statutory compliance of time deadlines which instills the
discipline necessary to administer the law efficiently and on time. In this time schedule, considerations are given to a range of possible outcomes during the investigation and recommendation phase to cover for normal as well as complicated cases. It plays a central role in the administration of trade remedy laws in the U.S. regime.
A third and obvious factor is competency in administering the laws. There must be
knowledgeable and skilled personnel in various fields while at the same time equipped with adequate resources. In the USITC, the team assembled to conduct an investigation for a normal case has a complement of 6 professionals comprising of an investigator, economist, accountant/auditor, industry analyst, attorney, and supervisory investigator. At the same time, the Department of Commerce (DOC) also assembles its own team to undertake its part of the investigation separately but in parallel with the USITC investigation. Certain level of assured resources is also necessary to carry out an investigation effectively.
Finally, the success of trade remedy laws is also contingent on good enforcement of the
recommendations of the investigations. Speedy enforcement is essential, as is effective enforcement. Customs and Border Protection plays a vital role in this regard.
From Indonesia’s standpoint, these four factors point to some of the lessons that apply to Indonesia’s trade remedy regime. Firstly, it demonstrates that a regime with separate 63 Trade remedy laws are not necessarily enacted as a single trade law but individual laws that evolved over a period of time as the need arose. In the U.S., the result is a trade remedy regime that is predicated on two key statutes, Title VII of the Tariff Act of 1930, as amended, (antidumping and countervailing duty) and Section 201 of the Trade Act of 1974 (safeguard against injury from import surges) that provide the mandates for three central authorities (USITC, DOC and the President) to administer the laws.
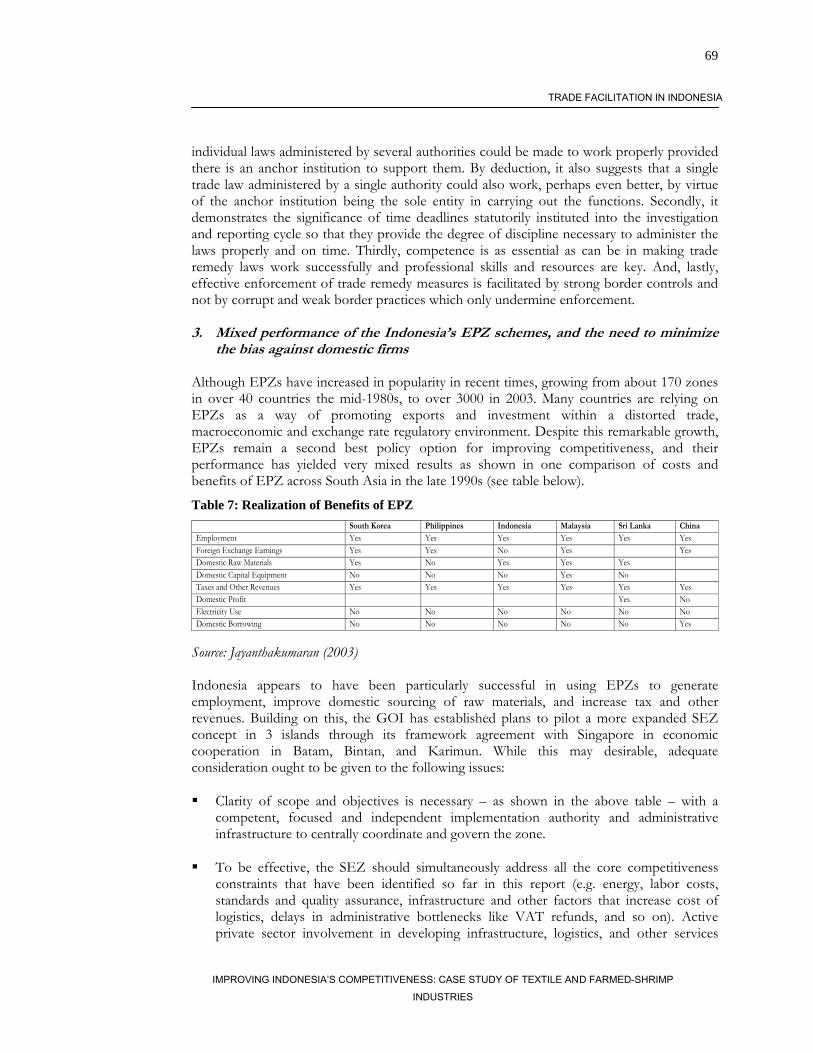
69
IMPROVING INDONESIA’S COMPETITIVENESS: CASE STUDY OF TEXTILE AND FARMED-SHRIMP INDUSTRIES
TRADE FACILITATION IN INDONESIA
individual laws administered by several authorities could be made to work properly provided there is an anchor institution to support them. By deduction, it also suggests that a single trade law administered by a single authority could also work, perhaps even better, by virtue of the anchor institution being the sole entity in carrying out the functions. Secondly, it demonstrates the significance of time deadlines statutorily instituted into the investigation and reporting cycle so that they provide the degree of discipline necessary to administer the laws properly and on time. Thirdly, competence is as essential as can be in making trade remedy laws work successfully and professional skills and resources are key. And, lastly, effective enforcement of trade remedy measures is facilitated by strong border controls and not by corrupt and weak border practices which only undermine enforcement. 3. Mixed performance of the Indonesia’s EPZ schemes, and the need to minimize
the bias against domestic firms Although EPZs have increased in popularity in recent times, growing from about 170 zones in over 40 countries the mid-1980s, to over 3000 in 2003. Many countries are relying on EPZs as a way of promoting exports and investment within a distorted trade, macroeconomic and exchange rate regulatory environment. Despite this remarkable growth, EPZs remain a second best policy option for improving competitiveness, and their performance has yielded very mixed results as shown in one comparison of costs and benefits of EPZ across South Asia in the late 1990s (see table below).
Table 7: Realization of Benefits of EPZ South Korea Philippines Indonesia Malaysia Sri Lanka China Employment Yes Yes Yes Yes Yes Yes Foreign Exchange Earnings Yes Yes No Yes Yes Domestic Raw Materials Yes No Yes Yes Yes Domestic Capital Equipment No No No Yes No Taxes and Other Revenues Yes Yes Yes Yes Yes Yes Domestic Profit Yes No Electricity Use No No No No No No Domestic Borrowing No No No No No Yes
Source: Jayanthakumaran (2003) Indonesia appears to have been particularly successful in using EPZs to generate employment, improve domestic sourcing of raw materials, and increase tax and other revenues. Building on this, the GOI has established plans to pilot a more expanded SEZ concept in 3 islands through its framework agreement with Singapore in economic cooperation in Batam, Bintan, and Karimun. While this may desirable, adequate consideration ought to be given to the following issues: Clarity of scope and objectives is necessary – as shown in the above table – with a
competent, focused and independent implementation authority and administrative infrastructure to centrally coordinate and govern the zone.
To be effective, the SEZ should simultaneously address all the core competitiveness
constraints that have been identified so far in this report (e.g. energy, labor costs, standards and quality assurance, infrastructure and other factors that increase cost of logistics, delays in administrative bottlenecks like VAT refunds, and so on). Active private sector involvement in developing infrastructure, logistics, and other services
70
IMPROVING INDONESIA’S COMPETITIVENESS: CASE STUDY OF TEXTILE AND FARMED-SHRIMP INDUSTRIES
TRADE FACILITATION IN INDONESIA
relating to operations of Single Window facilities within the zone will help reduce costs and increase benefits. Also the phasing out of subsidies on energy, land acquisition, help reduce the costs of the SEZ.
Analysts have suggested that the coordinated package of incentives (e.g. duty draw back
schemes, investment incentives, etc), infrastructure facilities, and quality of governance found in EPZs and SEZs are often biased against domestic suppliers, and prevent them from effectively integrating into the export value chain. For example, if the customs procedures for domestic firms lengthier than those with bonded zone status, firms with bonded zone status would prefer to import from abroad rather than rely on domestic suppliers whose order to delivery time will be constrained by customs procedures (see (Annex 1, Table 31 and 32 for detail information on benefits to firms in EPZ vs non-EPZ based firms in China and Indonesia). The same analogy goes for nuisance taxes, logistics, and so on. Hence without building effective linkages between domestic firms outside the zone and exporting firms, the long term objectives of the SEZ may be compromised. It is important to note that recent comparative analysis suggest that while the relative advantages enjoyed by the EPZ vis-à-vis rest of the economy attracts investments to the EPZ, the export competitiveness of the zones themselves is determined by the prevailing investment climate in the country as a whole (Aggarwal 2005).
Concessions (particularly those related to fiscal incentives like tax holidays,
concessionary turnover tax, etc) are the backbone of attractiveness of EPZs or SEZs. However, the magnitude and type of concession to be given are bound by WTO requirements of equal treatment. Hence the use of SEZs and associated perks and incentives has limited scope for long term competitiveness in an increasing liberal global trade environment.
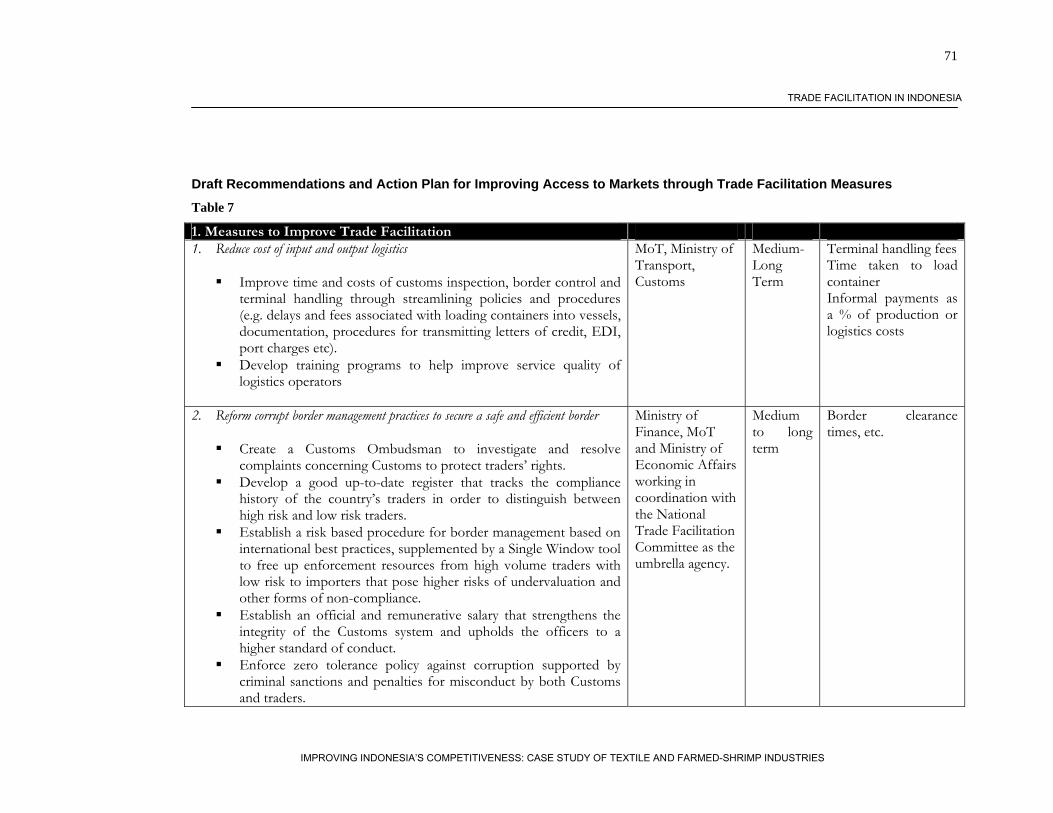
71
IMPROVING INDONESIA’S COMPETITIVENESS: CASE STUDY OF TEXTILE AND FARMED-SHRIMP INDUSTRIES
TRADE FACILITATION IN INDONESIA
Draft Recommendations and Action Plan for Improving Access to Markets through Trade Facilitation Measures
Table 7
1. Measures to Improve Trade Facilitation 1. Reduce cost of input and output logistics
Improve time and costs of customs inspection, border control and terminal handling through streamlining policies and procedures (e.g. delays and fees associated with loading containers into vessels, documentation, procedures for transmitting letters of credit, EDI, port charges etc).
Develop training programs to help improve service quality of logistics operators
MoT, Ministry of Transport, Customs
Medium-Long Term
Terminal handling fees Time taken to load container Informal payments as a % of production or logistics costs
2. Reform corrupt border management practices to secure a safe and efficient border
Create a Customs Ombudsman to investigate and resolve complaints concerning Customs to protect traders’ rights.
Develop a good up-to-date register that tracks the compliance history of the country’s traders in order to distinguish between high risk and low risk traders.
Establish a risk based procedure for border management based on international best practices, supplemented by a Single Window tool to free up enforcement resources from high volume traders with low risk to importers that pose higher risks of undervaluation and other forms of non-compliance.
Establish an official and remunerative salary that strengthens the integrity of the Customs system and upholds the officers to a higher standard of conduct.
Enforce zero tolerance policy against corruption supported by criminal sanctions and penalties for misconduct by both Customs and traders.
Ministry of Finance, MoT and Ministry of Economic Affairs working in coordination with the National Trade Facilitation Committee as the umbrella agency.
Medium to long term
Border clearance times, etc.
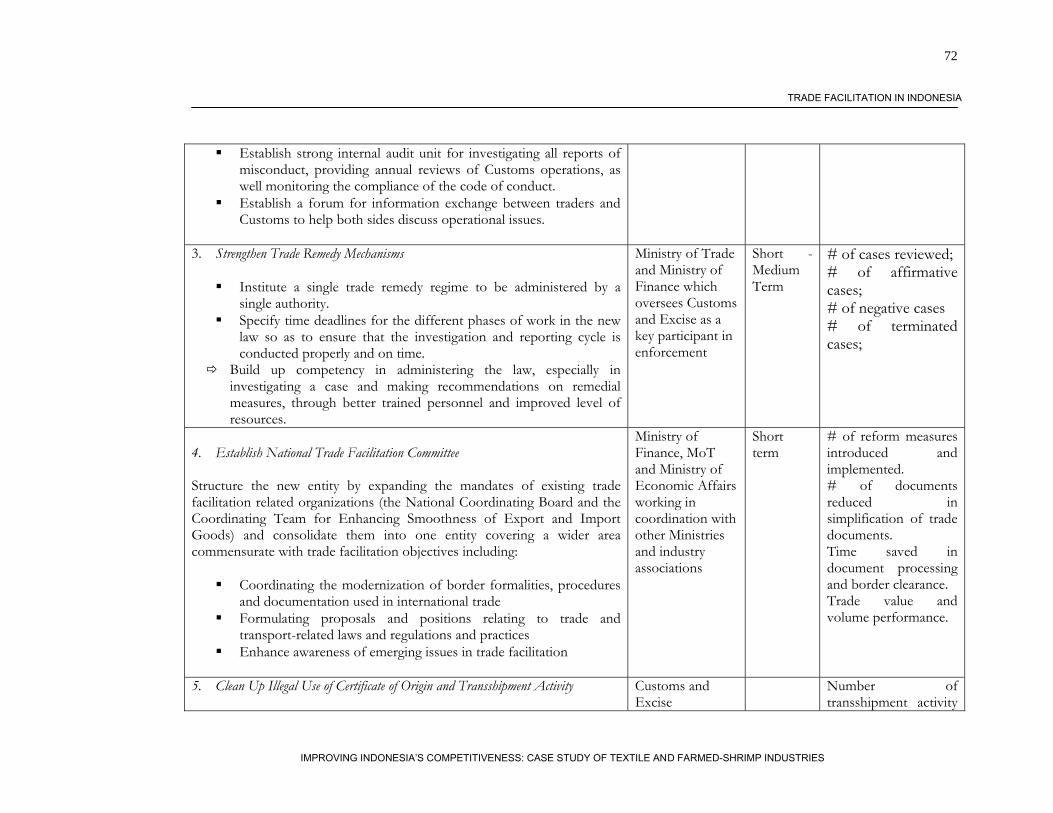
72
IMPROVING INDONESIA’S COMPETITIVENESS: CASE STUDY OF TEXTILE AND FARMED-SHRIMP INDUSTRIES
TRADE FACILITATION IN INDONESIA
Establish strong internal audit unit for investigating all reports of misconduct, providing annual reviews of Customs operations, as well monitoring the compliance of the code of conduct.
Establish a forum for information exchange between traders and Customs to help both sides discuss operational issues.
3. Strengthen Trade Remedy Mechanisms
Institute a single trade remedy regime to be administered by a single authority.
Specify time deadlines for the different phases of work in the new law so as to ensure that the investigation and reporting cycle is conducted properly and on time.
Build up competency in administering the law, especially in investigating a case and making recommendations on remedial measures, through better trained personnel and improved level of resources.
Ministry of Trade and Ministry of Finance which oversees Customs and Excise as a key participant in enforcement
Short - Medium Term
# of cases reviewed; # of affirmative cases; # of negative cases # of terminated cases;
4. Establish National Trade Facilitation Committee Structure the new entity by expanding the mandates of existing trade facilitation related organizations (the National Coordinating Board and the Coordinating Team for Enhancing Smoothness of Export and Import Goods) and consolidate them into one entity covering a wider area commensurate with trade facilitation objectives including:
Coordinating the modernization of border formalities, procedures and documentation used in international trade
Formulating proposals and positions relating to trade and transport-related laws and regulations and practices
Enhance awareness of emerging issues in trade facilitation
Ministry of Finance, MoT and Ministry of Economic Affairs working in coordination with other Ministries and industry associations
Short term
# of reform measures introduced and implemented. # of documents reduced in simplification of trade documents. Time saved in document processing and border clearance. Trade value and volume performance.
5. Clean Up Illegal Use of Certificate of Origin and Transshipment Activity
Customs and Excise
Number of transshipment activity
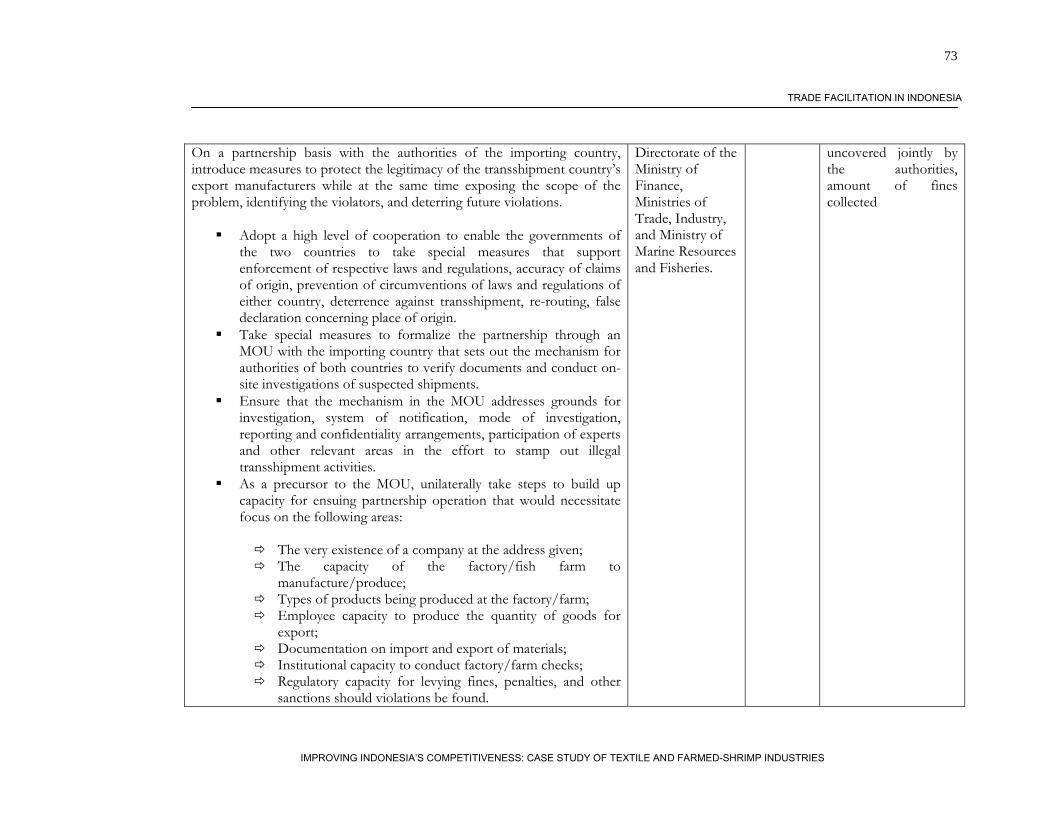
73
IMPROVING INDONESIA’S COMPETITIVENESS: CASE STUDY OF TEXTILE AND FARMED-SHRIMP INDUSTRIES
TRADE FACILITATION IN INDONESIA
On a partnership basis with the authorities of the importing country, introduce measures to protect the legitimacy of the transshipment country’s export manufacturers while at the same time exposing the scope of the problem, identifying the violators, and deterring future violations.
Adopt a high level of cooperation to enable the governments of the two countries to take special measures that support enforcement of respective laws and regulations, accuracy of claims of origin, prevention of circumventions of laws and regulations of either country, deterrence against transshipment, re-routing, false declaration concerning place of origin.
Take special measures to formalize the partnership through an MOU with the importing country that sets out the mechanism for authorities of both countries to verify documents and conduct on-site investigations of suspected shipments.
Ensure that the mechanism in the MOU addresses grounds for investigation, system of notification, mode of investigation, reporting and confidentiality arrangements, participation of experts and other relevant areas in the effort to stamp out illegal transshipment activities.
As a precursor to the MOU, unilaterally take steps to build up capacity for ensuing partnership operation that would necessitate focus on the following areas:
The very existence of a company at the address given; The capacity of the factory/fish farm to
manufacture/produce; Types of products being produced at the factory/farm; Employee capacity to produce the quantity of goods for
export; Documentation on import and export of materials; Institutional capacity to conduct factory/farm checks; Regulatory capacity for levying fines, penalties, and other
sanctions should violations be found.
Directorate of the Ministry of Finance, Ministries of Trade, Industry, and Ministry of Marine Resources and Fisheries.
uncovered jointly by the authorities, amount of fines collected
74
IMPROVING INDONESIA’S COMPETITIVENESS: CASE STUDY OF TEXTILE AND FARMED-SHRIMP INDUSTRIES
References Abernathy, F. et al. (December 2005), “The Future of the Apparel and Textile Industries: Prospects and Choices for Public Private Actors”, Harvard Center for Textile and Apparel Research Aggarwal, Aradhna (February 2005), “Performance Of Export Processing Zones: A Comparative Analysis Of India, Sri Lanka And Bangladesh”, Indian Council For Research On International Economic Relations Asian Development Bank (November 2005), “Report and Recommendation of the President to the Board of Directors: Republic of Indonesia – Development Policy Support Program”, Project Number 39605 Aswicahyono, Haryo and Feridhanusetyawan, Tubagus (January 2004), “The Evolution of Upgrading of Indonesia’s Industry”, CSIS Working Paper Series WPE 073 BCAS/Macfadyen/Aeron-Thomas, 2001. The Costs And Benefits Of Bagda Shrimp Farming In Bangladesh. An economic, financial and livelihoods assessment. Blonigen, Bruce A. (2005), “The Effects of NAFTA on Antidumping and Countervailing Duty Activity”, World Bank Economic Review, Vol 19, No 3, pp 407 – 424. Briggs, M., et al. (2004) Introductions and movement of Penaeus Vannamei and Penaeus Stylirostris in Asia and the Pacific. FAO RAP Publication 2004/10 Bruce, M., Daly, L. and Towers, N. (2004), “Lean or Agile – A Solution for Supply Chain Management in the Textiles and Clothing Industry”, International Journal of Operations and Production Management, Vol 24 No 2, 2004, pp 151-170 Brugere, Cecile and Ridler, Neil (2004), “Global Aquaculutre Outlook in the Next Decades: An Analysis of National Aquaculture Production Forecasts 2030”, FAO Fisheries Circular No. 1001 Cato, J. and Subasinge, S. (2003). Case study: The shrimp export industry in Bangladesh, in Food safety in food security and food trade, Laurian J. Unnevehr ed. Washington, D.C.: International Food Policy Research Institute. Brief 9 of 17. Cato, J. and Subasinghe, S. (2004). An Overview of the Bangladesh Shrimp Industry with Emphasis on the Safety and Quality of Exported Products. World Bank Report Chan, David Yih-Liang, et al (2005), “Current situation of energy conservation in high energy-consuming industries in Taiwan”, Energy Policy 33 (2005) Chongbo (October 2005), “Indonesia textile and garment industry: challenges and prospects”, The Indonesian quarterly; vol. 33 (2005), afl. 3, pg. 206-214 / 2005
75
IMPROVING INDONESIA’S COMPETITIVENESS: CASE STUDY OF TEXTILE AND FARMED-SHRIMP INDUSTRIES
Davis, J,. Brondolo, J. et al (March 2006), “Republic of Indonesia: Road Map for Modernizing Tax Administration”, IMF Fiscal Affairs Department Delgado, et al. 2004. Fish to 2020, Supply and demand in changing global markets. World Fish Centre Dowlah, C.A.F. (1999), “The Future of Readymade Clothing Industry of Bangladesh in the Post-Uruguay Round World” Eichengreen, B. and Tong, H. (2006), “How China is Reorganizing the World Economy”, Asian Economic Policy Review, 2006, 1, 73-97 FAO. Globefish Shrimp Commodity Update, 2005 Green, S. 2004. http://www.asianresearch.org/articles/2259.html Hamour, Elwaleed A. (1999), “Impact of Increased Exposure to International Competition: The Case of the Turkish Textile Industry”, Journal of Economic Cooperation 20, 4 (1999) 35 -71 Harrison, Graham and Krelove, Russell (December, 2005), “VAT Refunds: A Review of Country Experience”, IMF Working Paper WP/05, Fiscal Affairs Department Hill (1992), “Indonesia’s Textile and Garment Industries: Development in Asian Perspective”, Institute of South East Asian Studies, Occasional Paper 87, Singapore. IFC (May 2003), “Preliminary Textile Sector Interviews”, Conducted By Booz Allen Hamilton Independent Research and Advisory, (2005), “Aquaculture”, Report on the Farmed-Shrimp Value Chain in Indonesia Independent Research and Advisory, 2004/5. Aquaculture, Report on the Farmed Shrimp Value Chain in Indonesia Independent Research and Advisory, (2005), “Textiles”, Report on the Textile Value Chain in Indonesia Indonesia Country Brief (August 2005), Exporter Information, New Zealand Trade and Enterprise Jaipur, India: CUTS Centre for International Trade, Economics & Environment. 27Pp. James, William E. (2006), Structural Change and Competitiveness in Indonesia’s Garment Industry in the Post Quota Era. James, William E., Ray, David J. and Minor, Peter J. (2003), “Indonesia’s Textiles And Apparel: The Challenges Ahead”, Bulletin of Indonesian Economic Studies, Vol. 39, No. 1, 2003: 93–103

76
IMPROVING INDONESIA’S COMPETITIVENESS: CASE STUDY OF TEXTILE AND FARMED-SHRIMP INDUSTRIES
Javed, A. and Bhati, H. (2000), “How to Live in a Textile Quota-free World”, The Pakistan Development Review 39: 4 Part II (Winter 2000), pp 609-628 Jayanthakumaran, Kankesu (2003), “Benefit-Cost Appraisals of Export Processing Zones: A Survey of the Literature”, Development Policy Review, 2003, 21 (1): 51-65. Kagawa, M. and Bailey, C. (2006), “Trade Linkages in Shrimp Exports: Japan, Thailand, and Vietnam”, Development Policy Review, 2006, 24 (3): 303 – 319 KPMG Consulting Barents Group (July 2000), “VAT – A Case for Certain Policy Improvements”, Policy Memorandum - USAID Tax and Fiscal Reform Project Indonesia Krishnan, M., Principal Scientist & Head, Social Sciences Division, Central Institute of Brackishwater Aquaculture (ICAR). India. Pers. Comm. (2006). KSA Technopak (October 2005), “Report on Productivity Improvement Program for SME Apparel Manufacturing in Bangladesh” Kuncoro (2004), “Bribery In Indonesia: Some Evidence from Micro-Level Data”, Bulletin of Indonesian Economic Studies, Vol 40, No 3, 2004: 329-54 Kuncoro, A. and Resosudarmo, B. P. (2006), “Survey Of Recent Developments”, Bulletin of Indonesian Economic Studies, Vol. 42, No. 1, 2006: 7–31 LPEM, (2005), “Competitiveness of Indonesian Industries From Logistics Perspective: Inefficiency in the Logistics of Export Industries”, Lembaga Penyelidikan Ekonomi dan Masyarakat - FEUI Madan Dey et al, (September, 2006), “Socio-Economics of Shrimp Farming in Asia: A Cross-Country Comparison”, in Part III: Economics of Shrimp Farming in Selected Regions, “Shrimp Culture: Economics, Market, and Trade”, Edited by PingSun Leung, Carole Engle. Published in cooperation with The World Aquculture Society(2006). Maidir et al, (February 2003), Aswicahyono, Haryo and Imelda Maidir 2003. Indonesia’s textiles and apparels industry: Taking a stand in the new international competition. CSIS Working Paper 064. Marks, S. (2003), “Proposed Changes to the Value Added Tax: Implications For Tax Revenue And Price Distortions”, Bulletin of Indonesian Economic Studies, Vol. 41, No. 1, 2005: 81–95 Nuruzzaman, Mohamed. IV Fisheries Project Shrimp Expert. Pers. Comm. (2006). OECD (2004), “A New World Map In Textiles and Clothing - Adjusting To Change” Olarreaga, Marcelo and Ozden, Caglar (2005), “AGOA and Apparel: Who Captures the Tariff Rent in the Presence of Preferential Market Access”, World Bank Group
77
IMPROVING INDONESIA’S COMPETITIVENESS: CASE STUDY OF TEXTILE AND FARMED-SHRIMP INDUSTRIES
Padjadjaran University, 2004. Indonesia’s Employment Protection Legislation: Swimming Against the Tide? Palanichamya, C. and Sundar Babu, N. (2005), “Second Stage Energy Conservation Experience with a Textile Industry”, Energy Policy 33 (2005) 603–609 Palanichamy, C. and Sundar Babu, N. (2005), “Second Stage Conservation Experience with a Textile Industry”, Energy Policy 33 (2005) 603-609. Pangestu, Mari and Feridhanusetyawan, Tubagus (February 2004), “Indonesia in Crisis: A Macroeconomic Perspective”, CSIS Working Paper Series WPE 074 Philipps, M., NACA, Pers. Comm (2006) Poseidon, 2005. Phase 1: Initial Fact-Finding and Data Collection on Current State of the Marine Fisheries Sector. IFC/PEP Aceh Rahman, Mustafizur. 2002. Market access implications of SPS and TBT: Bangladesh perspective. Shang, Y.C. et al (1998), ”Comparative Economics of Shrimp Farming in Asia”, Aquaculture 164 (1998) 183-200 SMERU research institute (2002) in Garut (West Java) and Gorontalo (North Sulawesi). “The Shrimp Seal of Quality Program – Dhaka, Bangladesh”, Cases for Management Education SMERU research institute (2002) in Garut (West Java) and Gorontalo (North Sulawesi). “The Shrimp Seal of Quality Program – Dhaka, Bangladesh”, Cases for Management Education Soesastro, Hadi (May 2004), “Towards a U.S. – Indonesia Free Trade Agreement”, CSIS Working Paper Series WPE 085 Undy, R. et al (2002), “The Impact of the National Minimum Wage on the Apparel Industry”, Industrial Relations Journal 33:4 Undy, R., Kessler, I. and Thompson, M. (2002), “Impact of National Minimum Wage on the Apparel Industry”, Industrial Relations Journal 33: 4 Various Eurofish articles Various FoodMarketExchange.com articles Various Globefish articles Various Intrafish articles (www.intrafish.com) Webb, R., Camminati, J. and Thorne, R.L. (July 2005), “Antidumping Mechanisms and Safeguards in Peru”, World Bank Policy Research Working Paper (WPS3658)
78
IMPROVING INDONESIA’S COMPETITIVENESS: CASE STUDY OF TEXTILE AND FARMED-SHRIMP INDUSTRIES
Whalley, John (April 2006), “The Post MFA Performance of Developing Asia” Working Paper 12178, NBER Working Paper Series World Bank (October 2005), “Indonesia Export Competitiveness”, (Internal Draft) World Bank/NACA/FAO/WWF/UNEP/GPA. February 2006. International Principles for Responsible Shrimp Farming. Draft Principles for consideration by the Governing Council of the Network of Aquaculture Centres in Asia-Pacific February 2006 www.shrimpnews.com wb52678 L:\FIAS CountryVC\Indonesia VC\Final Draft Report\Sept final Indonesia - Textile and Shrimp Competitiveness Study v1.doc 09/14/2006 5:22:00 PM