Embed Size (px)
Citation preview
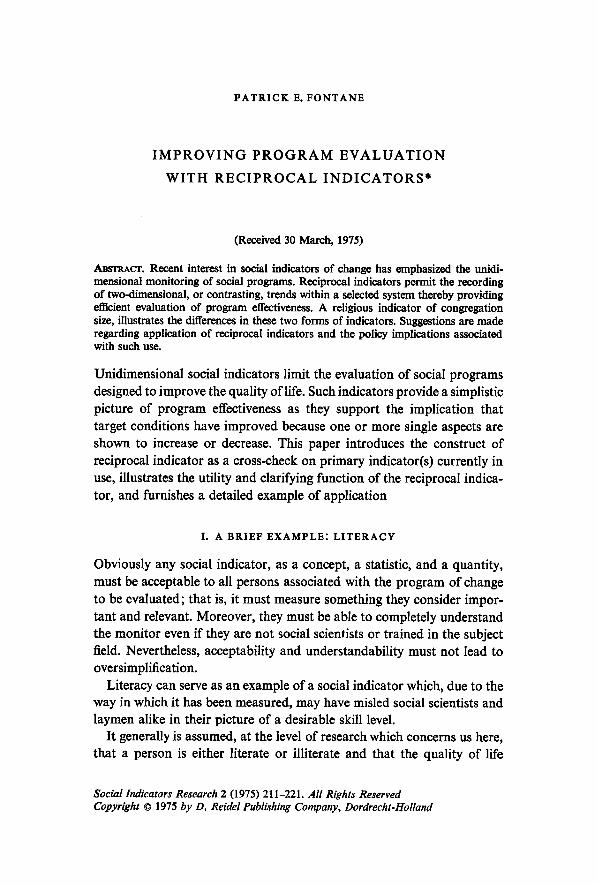
PATRICK E. FONTANE
I M P R O V I N G P R O G R A M E V A L U A T I O N
W I T H R E C I P R O C A L I N D I C A T O R S *
(Received 30 March, 1975)
AnSrRACT. Recent interest in social indicators of change has emphasized the unidi- mensional monitoring of social programs. Reciprocal indicators permit the recording of two-dimensional, or contrasting, trends within a selected system thereby providing efficient evaluation of program effectiveness. A religious indicator of congregation size, illustrates the differences in these two forms of indicators. Suggestions are made regarding application of reciprocal indicators and the policy implications associated with such use.
Unidimensional social indicators limit the evaluation of social programs designed to improve the quality of life. Such indicators provide a simplistic picture of program effectiveness as they support the implication that target conditions have improved because one or more single aspects are shown to increase or decrease. This paper introduces the construct of reciprocal indicator as a cross-check on primary indicator(s) currently in use, illustrates the utility and clarifying function of the reciprocal indica- tor, and furnishes a detailed example of application
I. A B R I E F E X A M P L E : L I T E R A C Y
Obviously any social indicator, as a concept, a statistic, and a quantity, must be acceptable to all persons associated with the program of change to be evaluated; that is, it must measure something they consider impor- tant and relevant. Moreover, they must be able to completely understand the monitor even if they are not social scientists or trained in the subject field. Nevertheless, acceptability and understandability must not lead to oversimplification.
Literacy can serve as an example of a social indicator which, due to the way in which it has been measured, may have misled social scientists and laymen alike in their picture of a desirable skill level.
It generally is assumed, at the level of research which concerns us here, that a person is either literate or illiterate and that the quality of life
Social Indicators Research 2 (1975) 211-221. All Rights Reserved Copyright �9 1975 by D. Reidel Publishing Compm~y, Dordrecht-Holland

212 P A T R I C K E. F O N T A N E
increases as the proportion of population assignable to the first category increases and the proportion of population assignable to the second de- creases. This can be questioned. Although hardly anyone would object if we assume all illiterate persons to be in a single homogeneous category, literacy cannot be viewed in an equivalent way. It is a continuous variable, with no real termination. If the evaluative indicators used in a program do not take this into account, the level of literacy of those categorized as literate actually can be decreasing as the proportion of population assigned to that category is increasing. Indeed, the desire to educate more and more people to the point where they can qualify as literate might, by itself, result in educational techniques which decrease the level of literacy in the population.
The literacy of a population at any level is often represented as the proportion of persons who have attained a standard level compared to those who have not. 1 This relationship is represented as
Proportion of N at/above (predetermined) reading level
Proportion of N below (predetermined) reading level
Determination of the standard is a thorny problem and it should not be dismissed lightly. Responsibilities for this selection lie at the level of evaluation. One method has been to compute a test-based standard, e.g. a statistic of the test distribution for each level (grade) as the test standard. This is of course a standard deviation. A significant difficulty with this procedure is that is assumes the �9 score is 'desirable' and bifurcates the distribution into scores exceeding the statistical norm or scores failing to achieve this standard. Also, it virtually precludes valid comparison from one range of the test scores to another because scores vary for a variety of reasons, some associated with the program, others not, including the test instrument itself.
A reciprocal indicator of literacy is constructed in such a way as to avoid the determination of an absolute point of standardization. Com- parison, i.e. evaluation, is longitudinal. Reading ability (literacy) is usually interpreted as a mix of comprehension and speed with which the person responds to comprehendable written material. Thus, a reciprocal indicator of evaluation for a reading education program could be con- strutted as a ratio of comprehension to speed. This permits a monitoring

RECIPROCAL INDICATORS 213
of change for individual Ss, and for each program unit (e.g. administrative sub-system) in the population.
Statistic of reading comprehension
Statistic of reading speed
N.B. The statistic of reading speed should not be a (test) constant. This type of indicator, such as comprehension of and speed of reading
would have no computational utility because it is constructed from two numerical universes. However, it provides evaluators with an improved method to monitor change(s) in the selected system because it provides a concurrent monitoring of contrasting effect. Reciprocal indicators permit presentation of reversals as well as advances in the conditions they monitor. Finally, reciprocal indicators retain all the assets of continuous monitors to determine an on-going program effectiveness.~
II. A P P L I C A T I O N
In the 1960s church planners searched for indicators to aid evaluation of changing needs and program effectiveness (Choate, 1972; Brewer, 1973). One indicator frequently used to determine effectiveness of individual churches was the size of congregation. In an era of disaffection from the institutionalized church, stability or nominal growth were interpreted as 'good', signs of a viable church program. However this information was dependent upon records maintained by the individual congregations and required by many denominational offices. Furthermore, the gross nature of this indicator was conducive to false interpretations of parish stability and program effectiveness because it did not expose change occurring within the congregations.
As a case in point, All Saints Episcopal Church, a moderate sized urban congregation in the eastern United States, reported the following statement of its membership in annual reports filed over a nine-year period (see Table I). 3
The interpretation of diocesian leaders was that this had been a very stable congregation with a successful program of Christian witness and community involvement. Its size was seriously affected only by the vicis- situdes affecting the national denomination in 1968.
Historically, the large number of Episcopal churches in this metro-

214 P A T R I C K E. FONTANE
politan area discouraged membership in a parish after moving away from the neighborhood in which that church was located. Accordingly, All Saints had always been a neighborhood church, serving people in the immediate area rather than being a center for commuting worshipers.
The ecological distribution of All Saints members had remained re- markably stable over the years. A comparison of residence distances for
TABLE I
Membership of All Saints Episcopal Church: 1961-1969
1961 1962 1963 4 1964 1965 1966 1967 1968 1969
N 620 625 627 623 630 575 b 580 543 e 542 Change q-5 -I-2 --4 + 7 --3 +5 --37 --1
�9 '52 removed from active list' (the change was computed after these paper deletions had been subtracted). b Episcopal churches lost many members as a result of the decisions reached at the 1968 general convention. e Change of parish priest.
members from the church buildings revealed that the percentage of congregation members living one mile or less from the church was virtually constant between 1964 and 1969, when ot~cial parish censes were taken (see Table II).
TABLE II
Percent of congregation members living one mile or less from church buildings
1964 39.3 1969 38.2 19704 39.3
a Determined by respondents to mailed questionnaire (Fontane, 1972).
From the foregoing it would appear that ecological stability, at least among All Saints Episcopalians, accounted for the consistency in size of congregation over the years. Such an explanation was not, however, con-

RECIPROCAL INDICATORS 215
sistent with the observation of new faces in the neighborhood and in the congregation.
All Saints was located in an area of the city experiencing rapid popula- tion change. Middle-aged residents were being attracted to metro suburbs in adjacent towns; the elderly, including a large Jewish population, remained. Newly formed families of young people, Italian Roman Catho- lics escaping the central city, and 'swingles' were moving into the neigh- borhoods of two and three-tiered dwellings. Therefore, a stable-sized congregation such as that reported in Table I could exist in an area of rapid population change, only if parishioners who moved from the neigh- borhood maintained their ties to All Saints - thereby behaving contrary to the norm for such relocation and challenging the reliability of informa- tion contained in Table II - or else, there was a great deal of coming and going of members in this parish, unrevealed by the official indicators.
The annual gross membership statistic found on the annual reports requiied by the diocese and in Table I is the result of tabulating names added to the congregation's membership roster minus the number deleted from this list. I f the membership indicator were expressed as the reciprocal relationship of this computation a different pattern from that of Table I emerges and suggests a serious internal problem at All Saints.
Table III presents the membership indicator of change in congregation size as a reciprocal relationship. While maintaining over-all size stability, All Saints is in fact experiencing a change of membership. The actual
TABLE HI Membership of All Saints Episcopal Church: including new members
and members removed from official roster: 1961-1969
1961 1962 1963 ~ 1964 1965 1966 1967 1968 1969
N 620 625 627 623 630 575 580 543 542 New members added +40 +31 +24 +30 -I-31 -t-20 -I-25 -I-26 +17 Oldmembers deleted e --38 -28 -22 -24 --24 -23 b -20 --63 -18 Percent total member- ship changed/year 12.5 9.4 7.3 10.3 8.7 7.5 7.8 16.4 6.5
a New parish priest. b 52 names were removed from the 'active list of members'. Number in table represents number of active members who left the parish. e Includes deaths.

216 P A T R I C K E. FONTA N B
number of persons into and out of (including deaths) this congregation each year during the nine year period averages approximately nine percent of the annual total membership (8.75 excluding 1968, 9.6 including 1968). 4 This annual change should no t be interpreted as cumulative because some new members may, in their turn, leave the parish.
This turnover of parishioners can be expected to affect the structure of social relations in the congregation and consequently, the parish pro- grams being implicitly evaluated. Indeed, such a suspicion is confirmed when several service groups in the congregation during this nine year period are examined.
Members of a church congregation express commitment to their parish by participation in the voluntary activities of their church (Fontane, 1974). At All Saints in 1951 there were five groups, including the Brotherhood of St. Andrew (men's service group) and the Episcopal Churchwomen (women's service group), whose primary purpose was to provide program leadership, assist the parish via fund-raising events, and to provide service functions (e.g. ushering at special services, building maintenance, etc.). By 1959 two of these groups had disappeared entirely after long periods of numerical stability and a third had merged with the two continuing groups. A possible explanation is that constant membership change in- capacitated the groups to sustain activities and expectations of the parish. Thus, they fulfilled no need as parish-reinforcing groups.
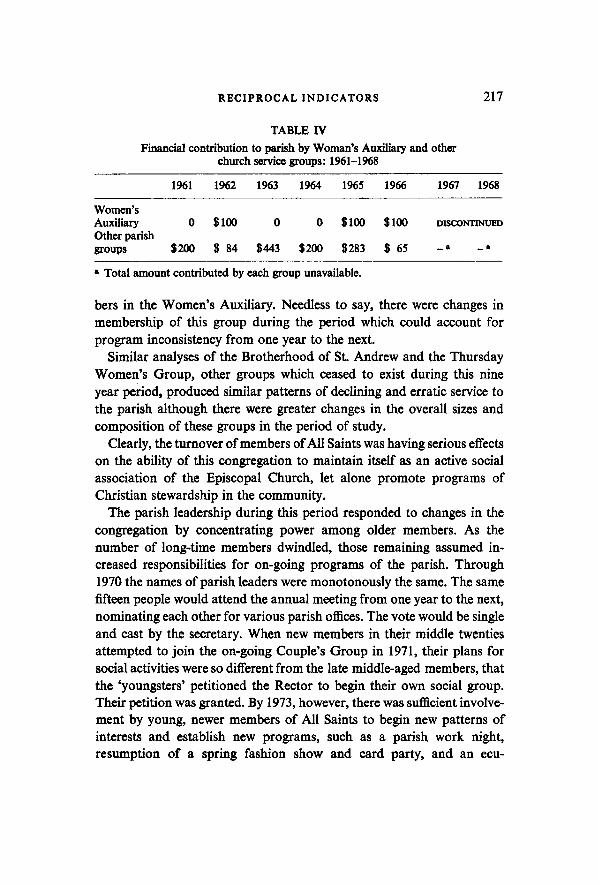
The Women's Auxiliary is an especially effective illustration of this occurrence. Its primary function was to sponsor events and programs thereby providing additional monies to the operating budget of the parish. In the nine years prior to 1951 this group provided an average of $497 to the parish (range $552 in 1955 to $400 in 1960). In 1961 there were fourteen members of this group; however, they decided to cooperate with other parish service groups in raising money and therefore, for the first time in the history of this group (traceable to 1952), it did not indepen- dently contribute money to the parish. For the following six years this group vacillated between independence and cooperation with other parish groups in money-raising programs. Finally, in 1966 the Women's Auxil- iary ceased to exist. The financial contribution of this group over these years, compared with cooperative efforts contrasts greatly with the pre- 1960 years (see Table IV).
During the period 1961 through 1966 there were fourteen active mere-
RECIPROCAL INDICATORS
TABLE IV Financial contribution to parish by Woman's Auxiliary and other
church sea'vicr groups: 1961-1968
217
1961 1962 1963 1964 1965 1966 1967 1968
Women's Auxiliary 0 $1 O0 0 0 $1 O0 $1 O0 DISCONTINUED Other parish g r o u p s $200 $ 84 $443 $200 $283 $ 65 - �9 _ a
Total amount contributed by each group unavailable.
bers in the Women's Auxiliary. Needless to say, there were changes in membership of this group during the period which could account for program inconsistency from one year to the next.
Similar analyses of the Brotherhood of St. Andrew and the Thursday Women's Group, other groups which ceased to exist during this nine year period, produced similar patterns of declining and erratic service to the parish although there were greater changes in the overall sizes and composition of these groups in the period of study.
Clearly, the turnover of members of All Saints was having serious effects on the ability of this congregation to maintain itself as an active social association of the Episcopal Church, let alone promote programs of Christian stewardship in the community.
The parish leadership during this period responded to changes in the congregation by concentrating power among older members. As the number of long-time members dwindled, those remaining assumed in- creased responsibilities for on-going programs of the parish. Through 1970 the names of parish leaders were monotonously the same. The same fifteen people would attend the annual meeting from one year to the next, nominating each other for various parish offices. The vote would be single and east by the secretary. When new members in their middle twenties attempted to join the on-going Couple's Group in 1971, their plans for social activities were so different from the late middle-aged members, that the 'youngsters' petitioned the Rector to begin their own social group. Their petition was granted. By 1973, however, there was sufficient involve- ment by young, newer members of All Saints to begin new patterns of interests and establish new programs, such as a parish work night, resumption of a spring fashion show and card party, and an ecu-

218 P A T R I C K E. F O N T A N E
menical social group with members of other neighborhood churches. To recapitulate, All Saints Episcopal Church provides an illustration of
the sociological application of reciprocal social indicators used for pro- gram evaluation. The gross size of congregation from one year to the next during the decade of the 1960s has been shown inadequate to provide sufficient information to permit an effective evaluation of the Christian stewardship offered by this church.
The reciprocal indicator of membership change accentuates additions compared to deletions from the aggregate congregation roster and pro- vides a concise statement of movement into and out of the parish. As an indicator of program effectiveness it provides a record of membership continuity as well as member movement coincidental with planned programs.
All Saints was a declining congregation all through the 1960s. It was not declining in size, rather, it was declining in its ability to satisfy needs of a congregation formed by new members replacing old members during a period of rapid membership turn-over. This replacement within the congregation was similarly occurring in parish service groups. The result was increased power in parish affairs for remaining long-term members and a decreasing effectiveness of heretofore successful groups.
I l L S U G G E S T I O N S FOR F U R T H E R A P P L I C A T I O N
The utilization of reciprocal indicators is not limited to specific programs or conditions. For example, industry has long considered the relationship between production capacity and actual production as an important indicator of plant efficiency.
Equal opportunity employment legislation has created the desireability of monitoring the effectiveness of Affirmative Action programs to attract qualified employees from minority groups. An indicator of program effectiveness is often the number of new minority group employees hired since the inception of the program. However, if the program has been designed to a t t rac t minority employees, the indicator should include not only those actually hired but also those who apply for the position(s):
N minority group members actually hired
N qualified minority applications received

R E C I P R O C A L I N D I C A T O R S 219
Thus, such a reciprocal indicator could reveal that a program judged successful because of the increased hirings was not successfully attracting qualified applicants, which was its primary directive.
Other uses of reciprocal indicators include examination of adjustments in the work week to provide additional leisuretime for workers. Previous research suggests that many workers would acquire second jobs. To learn if the program was effective in its purpose to encourage rest and/or recreation for the worker, utilization of released time must be monitored. The reciprocal expression could appear as
N workers on R & R activities
N workers earning additional income
This indicator would be more complex than the affirmative action indicator above. The alternatives available to short-week workers range from assuming time-equivalent leisure activities to accepting a second full-time job. To effectively monitor this program would require a network of indicators such as the systems model of structural equations proposed by Anderson (1973).
IV. C O N C L U S I O N S
A reciprocal indicator of change which identifies concomitant variation, and meets the two requirements of all indicators, intelligibility and rele- vance, efficiently monitors responses to shifting conditions and programs because of its dual simplicity of application and interpretation.
On the other hand, designers of social programs may be reluctant to adopt reciprocal indicators on two grounds: First, such indicators will present program effectiveness in terms of a 'mixed bag' thus conflicting with the administrative desire to present a positive evaluation of program effectiveness. The issue here is one of program verification v e r s u s program evaluation. Consequently, care must be exercised that the selected indica- tor is an objective reciprocal monitor of policy implementation and not a representation of policy-formed manipulation. Second, temptation exists to reverse the intended purpose of reciprocal indicators and use them instead to forecast program effectiveness, thereby creating a means whereby policy-forming superordinates can evaluate program-originating

220 PATRICK E. FONTANE
subordinants. 5 This issue raises questions of policy governing the utiliza- tion of reciprocal indicators which cannot be easily dismissed.
Reciprocal indicators are sociologically useful as the example of All Saints Church illustrates. However, they do not release the applied sociologist from professional misgivings - they may in fact intensify these misgivings - about becoming a technocratic hireling to evaluate programs generated by politically expedient social policies he or she may have no share in formulating.
Dept. of Sociology and Anthropology Long Island University, Southhampton, New York
NOTES
* Revision of a paper presented to the Annual Meetings of the Eastern Sociological Society, April 5-7, 1974; Philadelphia, Pennsylvania. I wish to thank Richard G. Sipes for his criticisms and helpful comments on parts of this manuscript and for his en- couragement toward publication. x A United States government evaluation of reading ability, utilizing national samples at several age levels, is presented with median standards. Variations occur within quartiles from the median score. (National Assessment of Educational Progress; A Project of the Education Commission of the States, Reading: Summary Data. Report 02-R-00; U.S. Government Printing Office S/N 1780-01325; July 1974.) See also David Fox, Expansion of the More Effective Schools Program (New York Center for Urban Education, 1967). 2 The United States Bureau of Standards 'Census Clock' in Washington presents the results of a complex series of reciprocal indicators as it 'ticks off' the rate of population increase of the nation. a This research was supported in part by Research Grant No. 050-8931-0/1 from the Research Foundation of the State University of New York. 4 Departure by death is included in this indicator, because, while natural rather than social causes were determinants, there is still one less member in the congregation. 5 Thus, to return to the illustration of evaluating reading comprehension, it is not inconceivable that some school systems 'teach to the tests'. Since more federal money is directed to systems to improve their programs, the possibility exists that some systems adopt a policy to teach their students 'down' so as to attract a greater share of federal funds.
B I B L I O G R A P H Y
Anderson, James O.: 1973, 'Causal Models and Social Indicators: Toward the Devel- opment of Social Systems Models', American Sociological Review 38, 285-301.
Bauer, Raymond A. (ed.): 1966, Social Indicators, MIT Press, Cambridge. Brewer, Earl D.C.: 1973, 'Social Indicators and Religious Indicators', Review of
Religiou~ Research 14, 77-90.
RECIPROCAL INDICATORS 221
Choate, Norman L.: 1972, 'Evaluation and Methods in Applied Research', Review of Religious Research 13, 101-106.
Fontane, Patrick E.: 1974, 'Viability of Congregation as a Religious Indicator', Social Indicators Research 1, 243-255.
Fontane, Patrick E.: 1972, 'The Church Worker in the Neighborhood Congregation', Review of Religious Research 13, 140-141 (Winter).
Fox, David: 1967, Expansion of the More Effective Schools Program, Center for Urban Education, New York.
Hanson, Morris R. and Bryant, Edward C.: 1972, 'National Assessment Design Impli- cations', unpublished paper, presented to the American Association for the Advance- ment of Science annual meetings.
Mnshkin, Selma J.: 1973, National Assessment and Social Indicators, United States Government, Department of Health, Education and Welfare; (OE)-73-11111.
United States Government Printing Office: 1974, Reading: Summary Data, National Assessment of Educational Progress, 02-R-00; S/N 1780-01325; Washington, D.C.; July.
Wilson, Robert L.: 1972, 'Indicators of Religious Institutions', Unpublished paper, United Methodist Task Force on Religious Indicators.