Embed Size (px)
Citation preview
Published: June 09, 2011
r 2011 American Chemical Society 9324 dx.doi.org/10.1021/ie200383s | Ind. Eng. Chem. Res. 2011, 50, 9324–9338
ARTICLE
pubs.acs.org/IECR
Improving the Heat Integration of Distillation Columns in a CryogenicAir Separation UnitL. V. Van der Ham*,† and S. Kjelstrup†,‡
†Department of Chemistry, Norwegian University of Science and Technology, 7491 Trondheim, Norway‡Department of Process and Energy, Delft University of Technology, 2628CA Delft, The Netherlands.
ABSTRACT: The distillation columns of a two-column cryogenic air separation unit (ASU) are responsible for a considerable partof the total ASU inefficiencies. The efficiency of a conventional distillation column can be increased by distributing the reboiler andcondenser duties over a larger part of its length. In an ASU, this can be realized by moving the low-pressure column (LPC) downalong the high-pressure column (HPC), thus increasing the number of heat-integrated stages (HI stages).We present an assessmentof the effect that such an intensification of the heat integration has on the performance of the ASU distillation section, using theentropy production as performance criterion. When keeping the operating pressures fixed, the entropy production in the LPC isreplaced by entropy production in the HI stages, without affecting the total entropy production. Reducing the pressure ratio enablesa reduction in the LPC entropy production without increasing the contribution of the HI stages. For a probable value of the heat-transfer capacity per stage, increasing the pressure in the LPC results in a decrease of 21% in the total entropy production, whiledecreasing the pressure in the HPC results in a decrease of 23%. Decreasing the pressure in the HPC when using an opportunisticheat-transfer capacity yields a decrease of 31%. The reductions in entropy production materialize eventually as changes in therequired ASU compressor, pump, and expander duties. Compared to the addition of either an additional heat exchanger or anadditional distillation column, the use of HI stages seems to be the most promising method for improving the thermodynamicperformance of a cryogenic ASU. More-detailed experimental data are required to simulate heat-integrated distillation columnsaccurately.
1. INTRODUCTION
The use of an IntegratedGasificationCombinedCycle (IGCC)with precombustionCO2 capture is one of themain candidates forcarbon capture and storage on an industrial scale. In an IGCC,purified oxygen is required in the gasification step and purifiednitrogen is used as diluent in the gas turbine. In case of a coal-basedIGCC, additional nitrogen is required to transport coal into thegasifier.1 The purified oxygen and nitrogen are usually obtainedusing cryogenic distillation of air.2,3
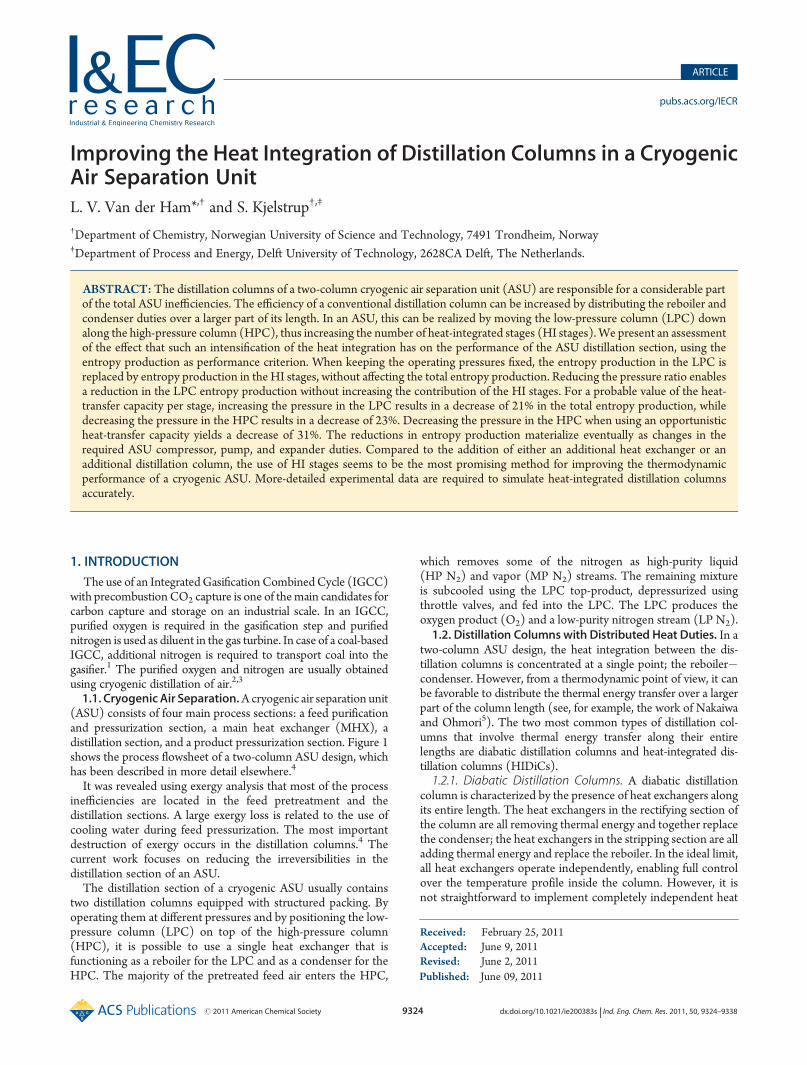
1.1. Cryogenic Air Separation.A cryogenic air separation unit(ASU) consists of four main process sections: a feed purificationand pressurization section, a main heat exchanger (MHX), adistillation section, and a product pressurization section. Figure 1shows the process flowsheet of a two-column ASU design, whichhas been described in more detail elsewhere.4
It was revealed using exergy analysis that most of the processinefficiencies are located in the feed pretreatment and thedistillation sections. A large exergy loss is related to the use ofcooling water during feed pressurization. The most importantdestruction of exergy occurs in the distillation columns.4 Thecurrent work focuses on reducing the irreversibilities in thedistillation section of an ASU.The distillation section of a cryogenic ASU usually contains
two distillation columns equipped with structured packing. Byoperating them at different pressures and by positioning the low-pressure column (LPC) on top of the high-pressure column(HPC), it is possible to use a single heat exchanger that isfunctioning as a reboiler for the LPC and as a condenser for theHPC. The majority of the pretreated feed air enters the HPC,
which removes some of the nitrogen as high-purity liquid(HP N2) and vapor (MP N2) streams. The remaining mixtureis subcooled using the LPC top-product, depressurized usingthrottle valves, and fed into the LPC. The LPC produces theoxygen product (O2) and a low-purity nitrogen stream (LP N2).1.2. Distillation Columns with Distributed Heat Duties. In a
two-column ASU design, the heat integration between the dis-tillation columns is concentrated at a single point; the reboiler�condenser. However, from a thermodynamic point of view, it canbe favorable to distribute the thermal energy transfer over a largerpart of the column length (see, for example, the work of Nakaiwaand Ohmori5). The two most common types of distillation col-umns that involve thermal energy transfer along their entirelengths are diabatic distillation columns and heat-integrated dis-tillation columns (HIDiCs).1.2.1. Diabatic Distillation Columns. A diabatic distillation
column is characterized by the presence of heat exchangers alongits entire length. The heat exchangers in the rectifying section ofthe column are all removing thermal energy and together replacethe condenser; the heat exchangers in the stripping section are alladding thermal energy and replace the reboiler. In the ideal limit,all heat exchangers operate independently, enabling full controlover the temperature profile inside the column. However, it isnot straightforward to implement completely independent heat
Received: February 25, 2011Accepted: June 9, 2011Revised: June 2, 2011
9325 dx.doi.org/10.1021/ie200383s |Ind. Eng. Chem. Res. 2011, 50, 9324–9338
Industrial & Engineering Chemistry Research ARTICLE
exchangers in practice, because it requires the availability of ther-mal energy at many different temperatures.A practical way to limit the number of required temperature
levels is to connect several heat exchangers to each other andoperate them in series, yielding sequential heat exchangers; butthis removes some of the control over the temperature profile. Byvarying the heat-transfer area per heat exchanger, it is stillpossible to control the temperature profile to some extent.Various theoretical studies have investigated the optimal
distribution of heat duties over the length of an ideal diabaticdistillation column.6�11 It was found that the most importantheat exchangers are those close to the top and the bottom of thecolumn and, in some cases, those close to the feed location.1.2.2. Heat-Integrated Distillation Columns. A heat-inte-
grated distillation column (HIDiC) can be regarded as a con-ventional distillation column that is split into two at its feedlocation. Heat integration is realized by positioning the two partsnext to each other and operating them at different pressures. Theoriginal top (or rectifying) section of the column is operated at ahigher pressure than the original bottom (or stripping) section,since the rectifying section requires the removal of thermalenergy and the stripping section requires the addition of thermalenergy. Transferring thermal energy along the length of theintegrated column decreases the required reboiler and condenserduties. However, to sustain a pressure difference between the twocolumn parts, a compressor and a throttle valve are needed. It isthe net effect of the added compressor duty and the decreasedreboiler and condenser duties that determines the thermody-namic feasibility of a HIDiC.When the rectifying and stripping sections of a HIDiC contain
equal numbers of stages, both their tops and bottoms are typicallypositioned next to each other. When the sections contain unequalnumbers of stages, it is no longer possible to realize heat inte-gration between all stages. Theoretical investigations by de Rijke12
assessed the performance of three different separation cases thathave unequal numbers of stages in their rectifying and strippingsections. For each of the cases, he compared two possible column
configurations: one with the two columns aligned at the topand one with the two columns aligned at the bottom. The bestconfigurations were those where the top and bottom of theoriginal column were positioned closest to each other.De Rijke also compared the performance of HIDiCs with a
uniform heat distribution with the performance of HIDiCs witha uniform distribution of the heat-transfer area. He found thatthe a uniform distribution of heat-transfer area yields the bestHIDiC design. A similar conclusion was reached by Suphanit.13
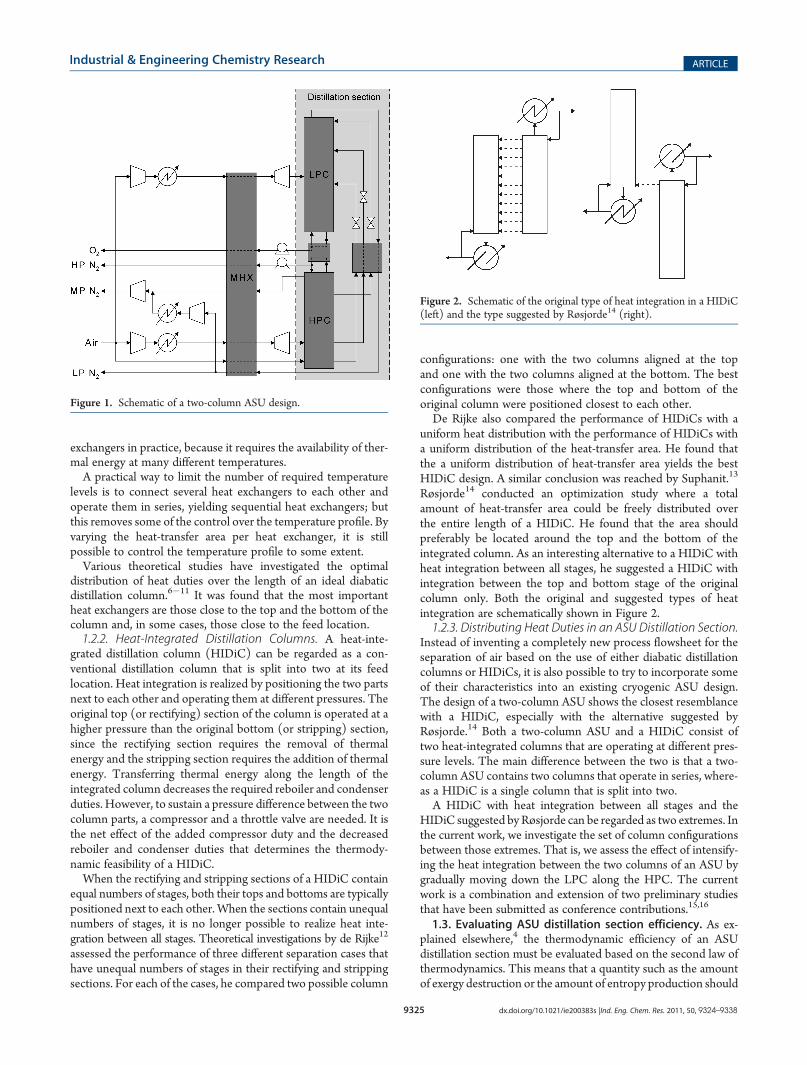
Røsjorde14 conducted an optimization study where a totalamount of heat-transfer area could be freely distributed overthe entire length of a HIDiC. He found that the area shouldpreferably be located around the top and the bottom of theintegrated column. As an interesting alternative to a HIDiC withheat integration between all stages, he suggested a HIDiC withintegration between the top and bottom stage of the originalcolumn only. Both the original and suggested types of heatintegration are schematically shown in Figure 2.1.2.3. Distributing Heat Duties in an ASU Distillation Section.
Instead of inventing a completely new process flowsheet for theseparation of air based on the use of either diabatic distillationcolumns or HIDiCs, it is also possible to try to incorporate someof their characteristics into an existing cryogenic ASU design.The design of a two-column ASU shows the closest resemblancewith a HIDiC, especially with the alternative suggested byRøsjorde.14 Both a two-column ASU and a HIDiC consist oftwo heat-integrated columns that are operating at different pres-sure levels. The main difference between the two is that a two-column ASU contains two columns that operate in series, where-as a HIDiC is a single column that is split into two.A HIDiC with heat integration between all stages and the
HIDiC suggested byRøsjorde can be regarded as two extremes. Inthe current work, we investigate the set of column configurationsbetween those extremes. That is, we assess the effect of intensify-ing the heat integration between the two columns of an ASU bygradually moving down the LPC along the HPC. The currentwork is a combination and extension of two preliminary studiesthat have been submitted as conference contributions.15,16
1.3. Evaluating ASU distillation section efficiency. As ex-plained elsewhere,4 the thermodynamic efficiency of an ASUdistillation section must be evaluated based on the second law ofthermodynamics. This means that a quantity such as the amountof exergy destruction or the amount of entropy production should
Figure 1. Schematic of a two-column ASU design.
Figure 2. Schematic of the original type of heat integration in a HIDiC(left) and the type suggested by Røsjorde14 (right).
9326 dx.doi.org/10.1021/ie200383s |Ind. Eng. Chem. Res. 2011, 50, 9324–9338
Industrial & Engineering Chemistry Research ARTICLE
be used as basis. Because there is no energy input or output withinthe distillation section of an ASU (except for thermal losses),using amounts of energy is meaningless. Therefore, an evaluationcriterion based on the first law of thermodynamics is not suitable.1.4. Aim of the Work. The aim of this study is to assess how
intensification of the heat integration between distillation col-umns of a two-column ASU affects its distillation section per-formance, using the total entropy production as performancecriterion.A possible performance improvement will materialize as a
quality decrease of the feed streams, and/or a quality increase ofthe product streams. For a cryogenic ASU, a higher qualitycorresponds to a lower temperature, a higher pressure, moreliquid phase, and higher purities; a lower quality corresponds to ahigher temperature, a lower pressure, more vapor phase, andpurities close to the air composition. The lowest-possible qualitycorresponds to atmospheric conditions.
2. MODEL DESCRIPTION
A detailed description of the model is given in Appendix A; themain properties are repeated here for the sake of convenience.The thermodynamic properties required tomodel the distillationsection are calculated using a reference equation of state byLemmon et al.,17 assuming a binary mixture of nitrogen andoxygen. The feed air has a nitrogen mole fraction of 0.79.
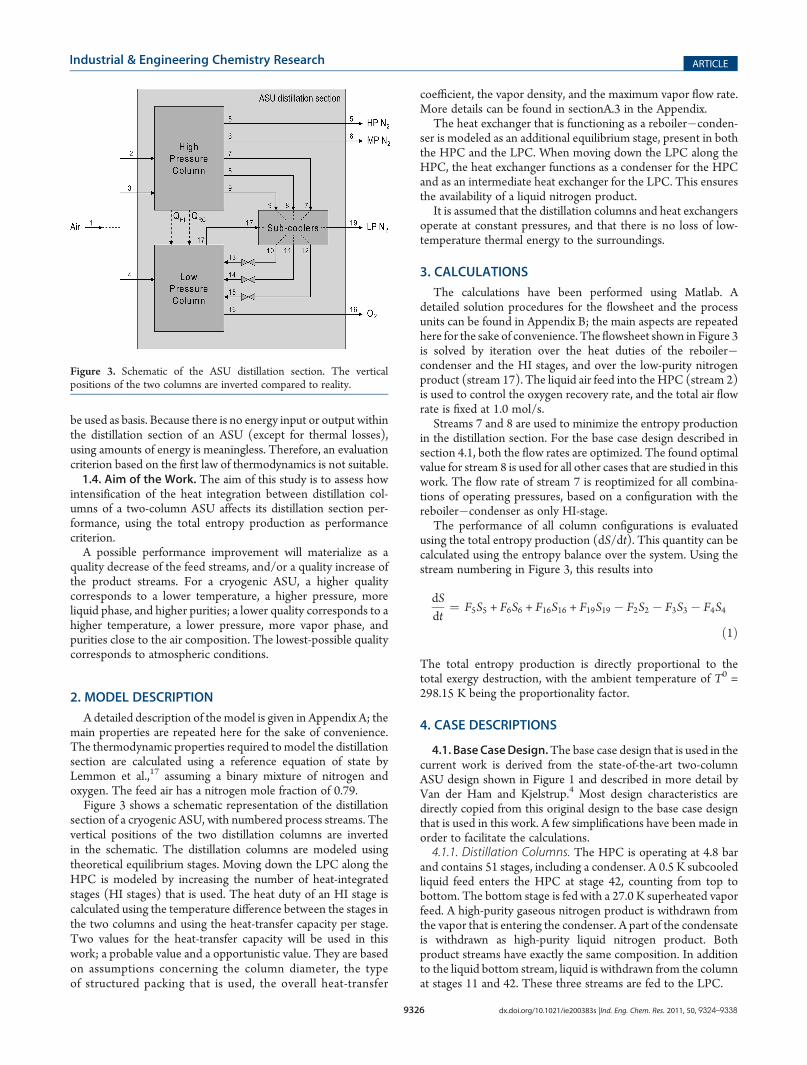
Figure 3 shows a schematic representation of the distillationsection of a cryogenic ASU, with numbered process streams. Thevertical positions of the two distillation columns are invertedin the schematic. The distillation columns are modeled usingtheoretical equilibrium stages. Moving down the LPC along theHPC is modeled by increasing the number of heat-integratedstages (HI stages) that is used. The heat duty of an HI stage iscalculated using the temperature difference between the stages inthe two columns and using the heat-transfer capacity per stage.Two values for the heat-transfer capacity will be used in thiswork; a probable value and a opportunistic value. They are basedon assumptions concerning the column diameter, the typeof structured packing that is used, the overall heat-transfer
coefficient, the vapor density, and the maximum vapor flow rate.More details can be found in sectionA.3 in the Appendix.
The heat exchanger that is functioning as a reboiler�conden-ser is modeled as an additional equilibrium stage, present in boththe HPC and the LPC. When moving down the LPC along theHPC, the heat exchanger functions as a condenser for the HPCand as an intermediate heat exchanger for the LPC. This ensuresthe availability of a liquid nitrogen product.
It is assumed that the distillation columns and heat exchangersoperate at constant pressures, and that there is no loss of low-temperature thermal energy to the surroundings.
3. CALCULATIONS
The calculations have been performed using Matlab. Adetailed solution procedures for the flowsheet and the processunits can be found in Appendix B; the main aspects are repeatedhere for the sake of convenience. The flowsheet shown in Figure 3is solved by iteration over the heat duties of the reboiler�condenser and the HI stages, and over the low-purity nitrogenproduct (stream 17). The liquid air feed into the HPC (stream 2)is used to control the oxygen recovery rate, and the total air flowrate is fixed at 1.0 mol/s.
Streams 7 and 8 are used to minimize the entropy productionin the distillation section. For the base case design described insection 4.1, both the flow rates are optimized. The found optimalvalue for stream 8 is used for all other cases that are studied in thiswork. The flow rate of stream 7 is reoptimized for all combina-tions of operating pressures, based on a configuration with thereboiler�condenser as only HI-stage.
The performance of all column configurations is evaluatedusing the total entropy production (dS/dt). This quantity can becalculated using the entropy balance over the system. Using thestream numbering in Figure 3, this results into
dSdt
¼ F5S5 + F6S6 + F16S16 + F19S19 � F2S2 � F3S3 � F4S4
ð1Þ
The total entropy production is directly proportional to thetotal exergy destruction, with the ambient temperature of T0 =298.15 K being the proportionality factor.
4. CASE DESCRIPTIONS
4.1. BaseCaseDesign.The base case design that is used in thecurrent work is derived from the state-of-the-art two-columnASU design shown in Figure 1 and described in more detail byVan der Ham and Kjelstrup.4 Most design characteristics aredirectly copied from this original design to the base case designthat is used in this work. A few simplifications have been made inorder to facilitate the calculations.4.1.1. Distillation Columns. The HPC is operating at 4.8 bar
and contains 51 stages, including a condenser. A 0.5 K subcooledliquid feed enters the HPC at stage 42, counting from top tobottom. The bottom stage is fed with a 27.0 K superheated vaporfeed. A high-purity gaseous nitrogen product is withdrawn fromthe vapor that is entering the condenser. A part of the condensateis withdrawn as high-purity liquid nitrogen product. Bothproduct streams have exactly the same composition. In additionto the liquid bottom stream, liquid is withdrawn from the columnat stages 11 and 42. These three streams are fed to the LPC.
Figure 3. Schematic of the ASU distillation section. The verticalpositions of the two columns are inverted compared to reality.
9327 dx.doi.org/10.1021/ie200383s |Ind. Eng. Chem. Res. 2011, 50, 9324–9338
Industrial & Engineering Chemistry Research ARTICLE
The LPC is operating at 1.3 bar and contains 56 stages,including the reboiler. An 11.7 K superheated vapor feed entersthe column at stage 25, again counting from top to bottom. Thethree streams originating from the HPC are partially vaporizedupon passing the throttle valves. Their liquid parts enter thecolumn at stages 1, 16, and 28; their vapor parts enter the columnat stages 1, 15, and 27. A low-purity gaseous nitrogen product iswithdrawn from the top of the column, and a liquid oxygenproduct is withdrawn from the reboiler.4.1.2. Subcoolers. The minimum temperature difference in
both subcoolers amounts to 2.5 K.4.1.3. Product and Process Specifications. The original design
is defined by two product specifications: an oxygen mole fractionof 0.95 in the oxygen product, and a ratio of 3.20 between themolar flow rates of the oxygen and the high-purity liquid nitrogenproducts. In addition, the nitrogen fraction of the high-puritynitrogen products is required to be at least 0.999; however, thiswas never a limiting specification.The molar flow rate of the vapor feed to the LPC always
amounts to 1.5% of the total feed flow rate. The oxygen recoverywas found to amount to 96% in the original design; this value isused as specification for the base case design used in this work, aswell as for all other configuration variations.4.1.4. Model Simplifications. Compared to the original design
used in Van der Ham and Kjelstrup,4 three simplifications havebeen made. First, it is assumed that the process streams containtwo components only: nitrogen and oxygen. In the originaldesign, argon was also included as a mixture component.The second simplification used in this work is the assumption
that the distillation columns and heat exchangers operate atconstant pressures. In the original design, the pressure drop inthe distillation columns amounts to ∼1 mbar per theoreticalequilibrium stage. In the subcoolers, it is∼50 mbar for the vaporstream and ∼100 mbar for the liquid streams.The third simplification is the assumption that no low-tem-
perature thermal energy is lost to the surroundings. The originaldesign included energy losses from the distillation columns andthe heat exchangers.The effect of these simplifications is the same for all process
configurations studied in this work. Therefore, they do not have anyinfluence on a comparison between the different configurations.4.2. Adjusting Operating Pressures.While moving down the
LPC along theHPC, the condenser of theHPC ismoving up alongthe LPC. This causes the temperature difference in this heat ex-changer to increase, resulting in a lower amount of required heat-transfer area. Instead of increasing the temperature difference andreducing the amount of heat-transfer area, it is also possible to keepthe temperature difference at its base case value by decreasing theratio of the column operating pressures. This can be done by eitherlowering the pressure in the HPC, or by increasing the pressure inthe LPC. The effect of both strategies on the distillation sectionperformance is investigated in the current study.
4.3. Case Overview. Five different cases are studied in thiswork. The first case is the base case, described in section 4.1; itdoes not involve any HI stages. The other four cases are all basedon the base case, but they do include HI stages. They differ fromeach other in the operating pressures and the heat-transfercapacity that are used. The second case uses the same operatingpressure as the base case. In the third, the pressure in the LPC isallowed to increase, while in the fourth and fifth cases, the pres-sure in the HPC is allowed to decrease. Cases 2, 3, and 4 all usethe probable heat-transfer capacity described in section A.3 inAppendix A. The fifth case uses the opportunistic heat-transfercapacity. The case details are summarized in Table 1.
5. RESULTS
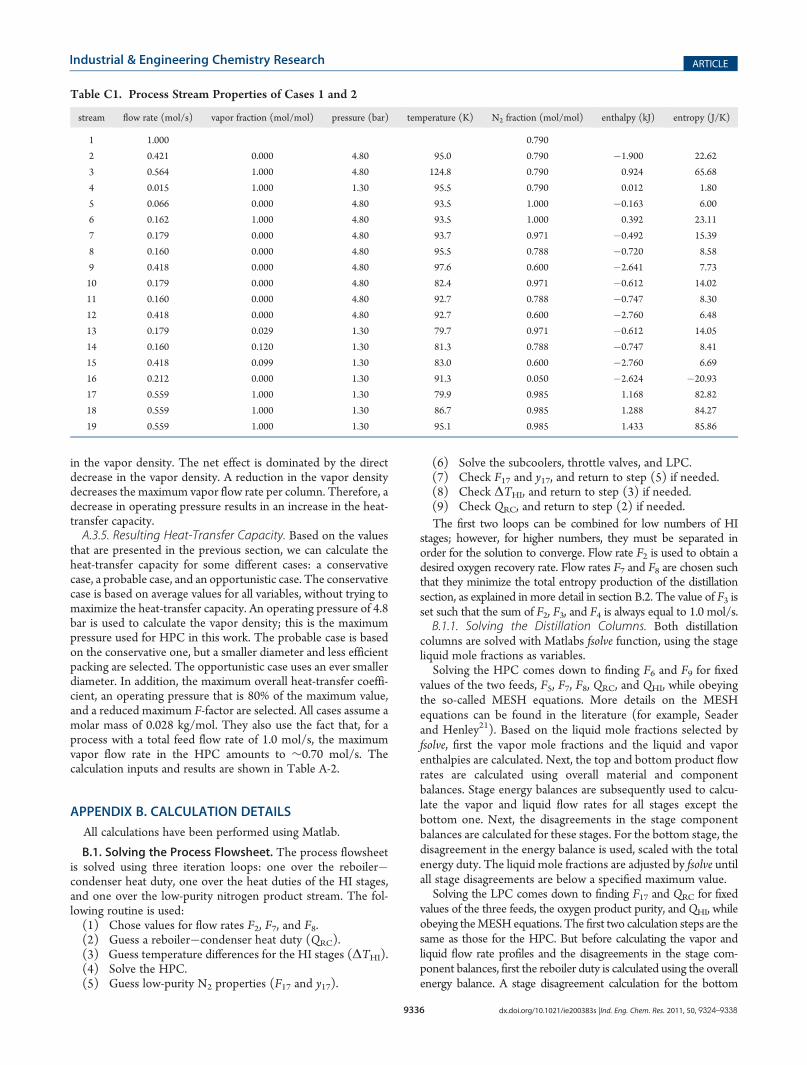
5.1. Base Case Characteristics. The base case design isdefined by the process characteristics described in section 4.1.The resulting properties of all process streams are listed in TableC1 in Appendix C. The total entropy production in the distilla-tion section amounts to 3.94 J/(K s) per mole feed. In AppendixC, it is shown how the total entropy production of the base case isdistributed over the main components of the distillation section,along with a comparison with the values calculated for theoriginal process design used in Van der Ham and Kjelstrup.4
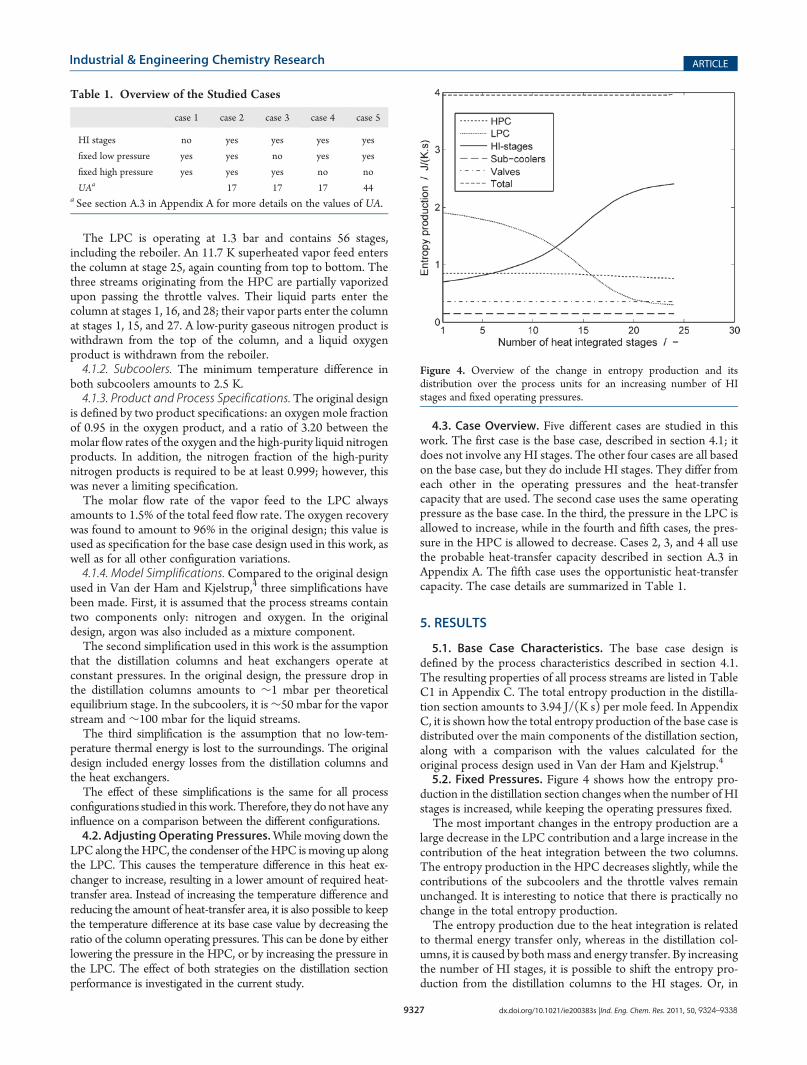
5.2. Fixed Pressures. Figure 4 shows how the entropy pro-duction in the distillation section changes when the number of HIstages is increased, while keeping the operating pressures fixed.The most important changes in the entropy production are a
large decrease in the LPC contribution and a large increase in thecontribution of the heat integration between the two columns.The entropy production in the HPC decreases slightly, while thecontributions of the subcoolers and the throttle valves remainunchanged. It is interesting to notice that there is practically nochange in the total entropy production.The entropy production due to the heat integration is related
to thermal energy transfer only, whereas in the distillation col-umns, it is caused by bothmass and energy transfer. By increasingthe number of HI stages, it is possible to shift the entropy pro-duction from the distillation columns to the HI stages. Or, in
Table 1. Overview of the Studied Cases
case 1 case 2 case 3 case 4 case 5
HI stages no yes yes yes yes
fixed low pressure yes yes no yes yes
fixed high pressure yes yes yes no no
UAa 17 17 17 44a See section A.3 in Appendix A for more details on the values of UA.
Figure 4. Overview of the change in entropy production and itsdistribution over the process units for an increasing number of HIstages and fixed operating pressures.
9328 dx.doi.org/10.1021/ie200383s |Ind. Eng. Chem. Res. 2011, 50, 9324–9338
Industrial & Engineering Chemistry Research ARTICLE
other words, it is possible to replace the entropy production dueto mass transfer by entropy production due to thermal energytransfer. Sections 5.2.1 and 5.2.2 explain in more detail why theentropy production in the LPC and due to heat integration arechanging.Similar to the total entropy production, there is practically no
change in the properties of the process streams; they are the sameas the stream properties listed in Table C1 in Appendix C for thebase case. The only exception is the distribution of the total heatduty over the reboiler�condenser and the other HI stages, whichis treated in more detail in section 5.2.2.5.2.1. LPC Stripping Section. The maximum decrease in
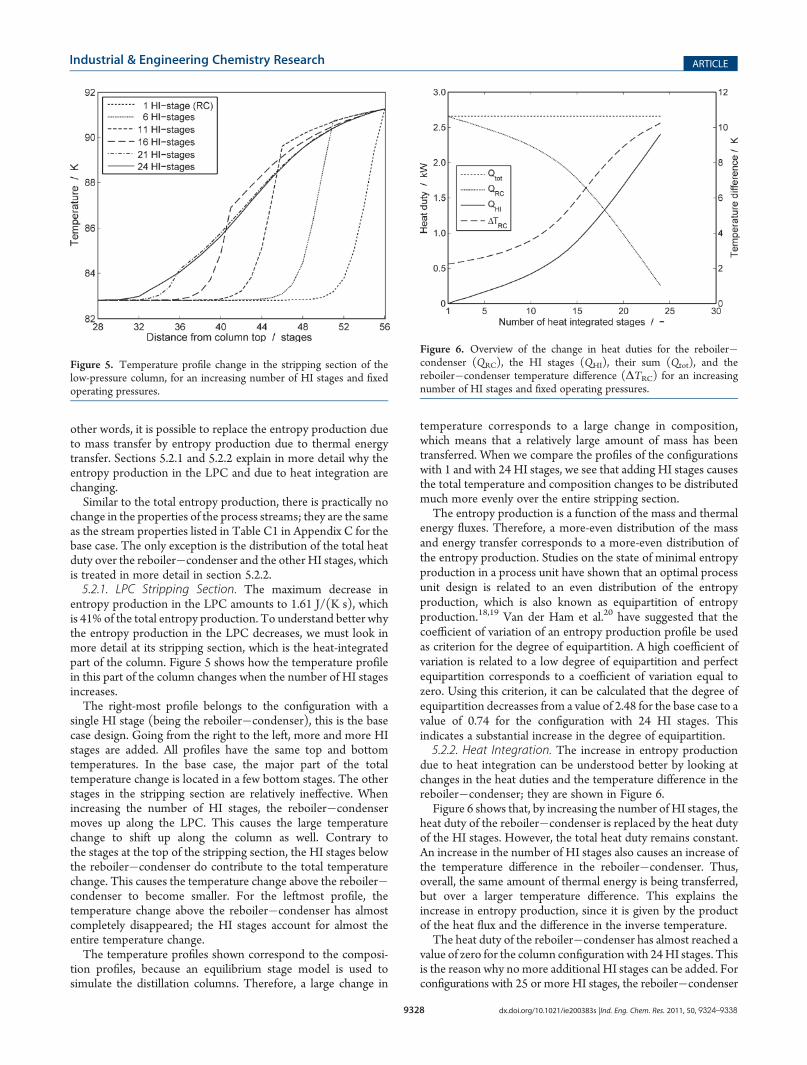
entropy production in the LPC amounts to 1.61 J/(K s), whichis 41% of the total entropy production. To understand better whythe entropy production in the LPC decreases, we must look inmore detail at its stripping section, which is the heat-integratedpart of the column. Figure 5 shows how the temperature profilein this part of the column changes when the number of HI stagesincreases.The right-most profile belongs to the configuration with a
single HI stage (being the reboiler�condenser), this is the basecase design. Going from the right to the left, more and more HIstages are added. All profiles have the same top and bottomtemperatures. In the base case, the major part of the totaltemperature change is located in a few bottom stages. The otherstages in the stripping section are relatively ineffective. Whenincreasing the number of HI stages, the reboiler�condensermoves up along the LPC. This causes the large temperaturechange to shift up along the column as well. Contrary tothe stages at the top of the stripping section, the HI stages belowthe reboiler�condenser do contribute to the total temperaturechange. This causes the temperature change above the reboiler�condenser to become smaller. For the leftmost profile, thetemperature change above the reboiler�condenser has almostcompletely disappeared; the HI stages account for almost theentire temperature change.The temperature profiles shown correspond to the composi-
tion profiles, because an equilibrium stage model is used tosimulate the distillation columns. Therefore, a large change in
temperature corresponds to a large change in composition,which means that a relatively large amount of mass has beentransferred. When we compare the profiles of the configurationswith 1 and with 24 HI stages, we see that adding HI stages causesthe total temperature and composition changes to be distributedmuch more evenly over the entire stripping section.The entropy production is a function of the mass and thermal
energy fluxes. Therefore, a more-even distribution of the massand energy transfer corresponds to a more-even distribution ofthe entropy production. Studies on the state of minimal entropyproduction in a process unit have shown that an optimal processunit design is related to an even distribution of the entropyproduction, which is also known as equipartition of entropyproduction.18,19 Van der Ham et al.20 have suggested that thecoefficient of variation of an entropy production profile be usedas criterion for the degree of equipartition. A high coefficient ofvariation is related to a low degree of equipartition and perfectequipartition corresponds to a coefficient of variation equal tozero. Using this criterion, it can be calculated that the degree ofequipartition decreasses from a value of 2.48 for the base case to avalue of 0.74 for the configuration with 24 HI stages. Thisindicates a substantial increase in the degree of equipartition.5.2.2. Heat Integration. The increase in entropy production
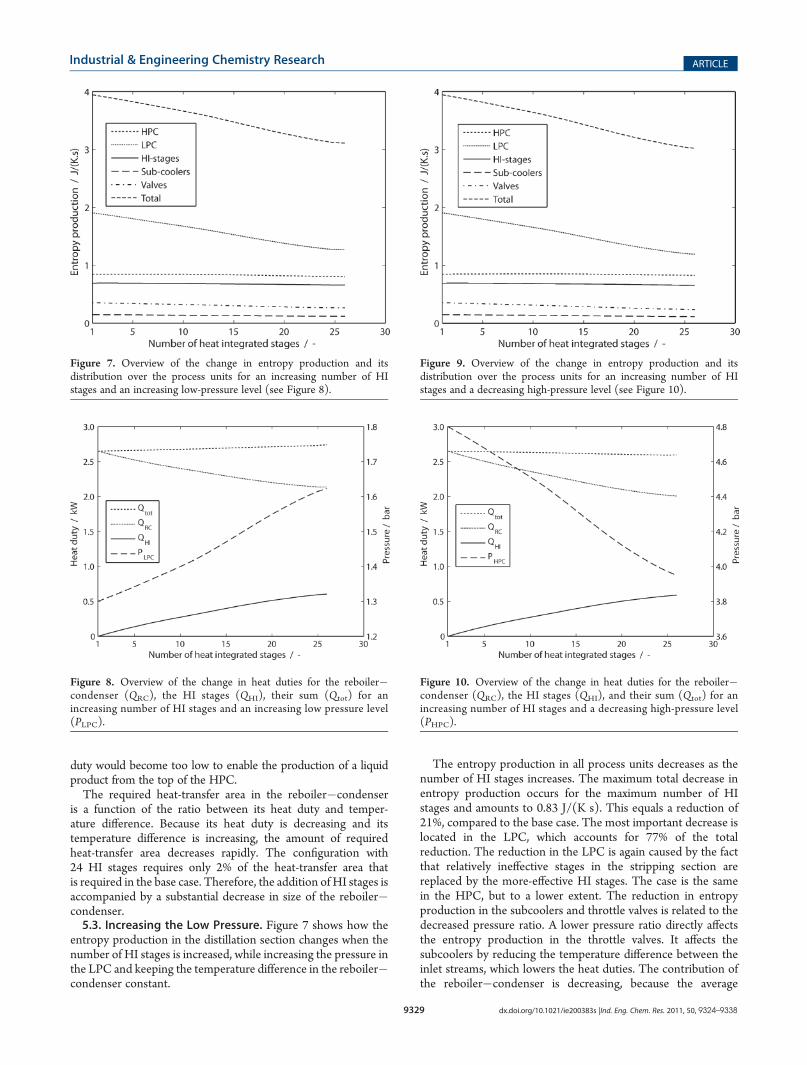
due to heat integration can be understood better by looking atchanges in the heat duties and the temperature difference in thereboiler�condenser; they are shown in Figure 6.Figure 6 shows that, by increasing the number of HI stages, the
heat duty of the reboiler�condenser is replaced by the heat dutyof the HI stages. However, the total heat duty remains constant.An increase in the number of HI stages also causes an increase ofthe temperature difference in the reboiler�condenser. Thus,overall, the same amount of thermal energy is being transferred,but over a larger temperature difference. This explains theincrease in entropy production, since it is given by the productof the heat flux and the difference in the inverse temperature.The heat duty of the reboiler�condenser has almost reached a
value of zero for the column configuration with 24HI stages. Thisis the reason why nomore additional HI stages can be added. Forconfigurations with 25 or more HI stages, the reboiler�condenser
Figure 5. Temperature profile change in the stripping section of thelow-pressure column, for an increasing number of HI stages and fixedoperating pressures.
Figure 6. Overview of the change in heat duties for the reboiler�condenser (QRC), the HI stages (QHI), their sum (Qtot), and thereboiler�condenser temperature difference (ΔTRC) for an increasingnumber of HI stages and fixed operating pressures.
9329 dx.doi.org/10.1021/ie200383s |Ind. Eng. Chem. Res. 2011, 50, 9324–9338
Industrial & Engineering Chemistry Research ARTICLE
duty would become too low to enable the production of a liquidproduct from the top of the HPC.The required heat-transfer area in the reboiler�condenser
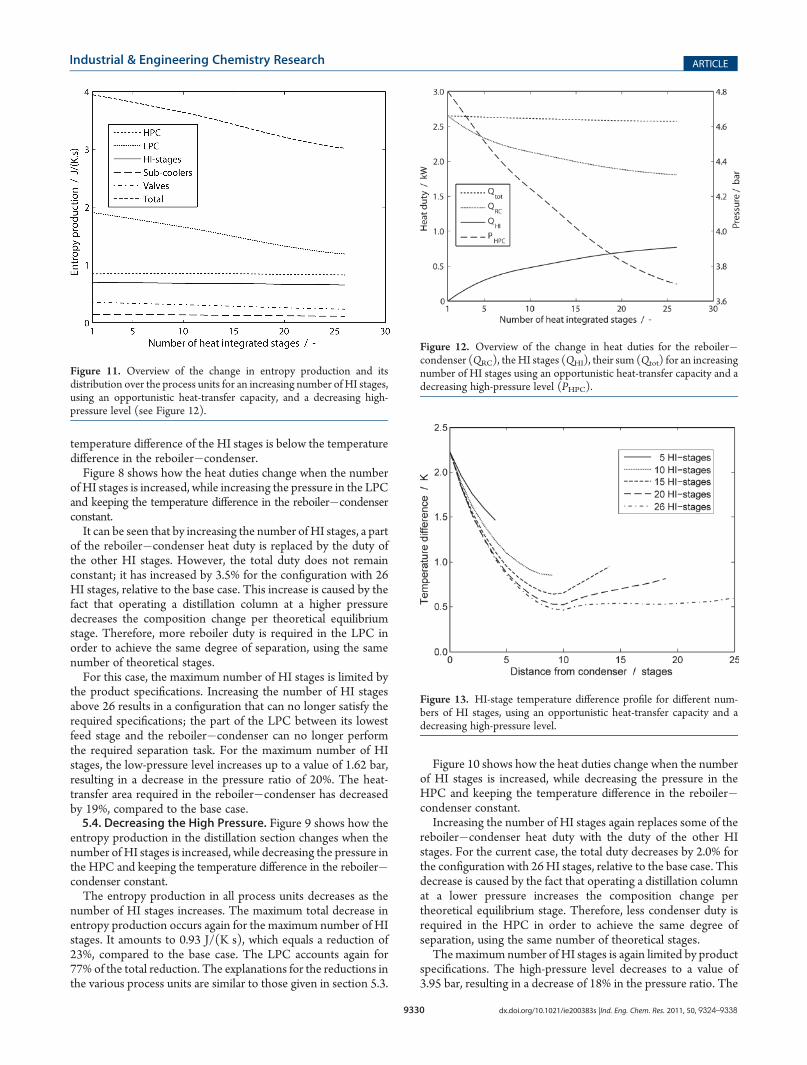
is a function of the ratio between its heat duty and temper-ature difference. Because its heat duty is decreasing and itstemperature difference is increasing, the amount of requiredheat-transfer area decreases rapidly. The configuration with24 HI stages requires only 2% of the heat-transfer area thatis required in the base case. Therefore, the addition of HI stages isaccompanied by a substantial decrease in size of the reboiler�condenser.5.3. Increasing the Low Pressure. Figure 7 shows how the
entropy production in the distillation section changes when thenumber of HI stages is increased, while increasing the pressure inthe LPC and keeping the temperature difference in the reboiler�condenser constant.
The entropy production in all process units decreases as thenumber of HI stages increases. The maximum total decrease inentropy production occurs for the maximum number of HIstages and amounts to 0.83 J/(K s). This equals a reduction of21%, compared to the base case. The most important decrease islocated in the LPC, which accounts for 77% of the totalreduction. The reduction in the LPC is again caused by the factthat relatively ineffective stages in the stripping section arereplaced by the more-effective HI stages. The case is the samein the HPC, but to a lower extent. The reduction in entropyproduction in the subcoolers and throttle valves is related to thedecreased pressure ratio. A lower pressure ratio directly affectsthe entropy production in the throttle valves. It affects thesubcoolers by reducing the temperature difference between theinlet streams, which lowers the heat duties. The contribution ofthe reboiler�condenser is decreasing, because the average
Figure 7. Overview of the change in entropy production and itsdistribution over the process units for an increasing number of HIstages and an increasing low-pressure level (see Figure 8).
Figure 8. Overview of the change in heat duties for the reboiler�condenser (QRC), the HI stages (QHI), their sum (Qtot) for anincreasing number of HI stages and an increasing low pressure level(PLPC).
Figure 9. Overview of the change in entropy production and itsdistribution over the process units for an increasing number of HIstages and a decreasing high-pressure level (see Figure 10).
Figure 10. Overview of the change in heat duties for the reboiler�condenser (QRC), the HI stages (QHI), and their sum (Qtot) for anincreasing number of HI stages and a decreasing high-pressure level(PHPC).
9330 dx.doi.org/10.1021/ie200383s |Ind. Eng. Chem. Res. 2011, 50, 9324–9338
Industrial & Engineering Chemistry Research ARTICLE
temperature difference of the HI stages is below the temperaturedifference in the reboiler�condenser.Figure 8 shows how the heat duties change when the number
of HI stages is increased, while increasing the pressure in the LPCand keeping the temperature difference in the reboiler�condenserconstant.It can be seen that by increasing the number of HI stages, a part
of the reboiler�condenser heat duty is replaced by the duty ofthe other HI stages. However, the total duty does not remainconstant; it has increased by 3.5% for the configuration with 26HI stages, relative to the base case. This increase is caused by thefact that operating a distillation column at a higher pressuredecreases the composition change per theoretical equilibriumstage. Therefore, more reboiler duty is required in the LPC inorder to achieve the same degree of separation, using the samenumber of theoretical stages.For this case, the maximum number of HI stages is limited by
the product specifications. Increasing the number of HI stagesabove 26 results in a configuration that can no longer satisfy therequired specifications; the part of the LPC between its lowestfeed stage and the reboiler�condenser can no longer performthe required separation task. For the maximum number of HIstages, the low-pressure level increases up to a value of 1.62 bar,resulting in a decrease in the pressure ratio of 20%. The heat-transfer area required in the reboiler�condenser has decreasedby 19%, compared to the base case.5.4. Decreasing the High Pressure. Figure 9 shows how the
entropy production in the distillation section changes when thenumber of HI stages is increased, while decreasing the pressure inthe HPC and keeping the temperature difference in the reboiler�condenser constant.The entropy production in all process units decreases as the
number of HI stages increases. The maximum total decrease inentropy production occurs again for the maximum number of HIstages. It amounts to 0.93 J/(K s), which equals a reduction of23%, compared to the base case. The LPC accounts again for77% of the total reduction. The explanations for the reductions inthe various process units are similar to those given in section 5.3.
Figure 10 shows how the heat duties change when the numberof HI stages is increased, while decreasing the pressure in theHPC and keeping the temperature difference in the reboiler�condenser constant.Increasing the number of HI stages again replaces some of the
reboiler�condenser heat duty with the duty of the other HIstages. For the current case, the total duty decreases by 2.0% forthe configuration with 26HI stages, relative to the base case. Thisdecrease is caused by the fact that operating a distillation columnat a lower pressure increases the composition change pertheoretical equilibrium stage. Therefore, less condenser duty isrequired in the HPC in order to achieve the same degree ofseparation, using the same number of theoretical stages.Themaximum number of HI stages is again limited by product
specifications. The high-pressure level decreases to a value of3.95 bar, resulting in a decrease of 18% in the pressure ratio. The
Figure 11. Overview of the change in entropy production and itsdistribution over the process units for an increasing number of HI stages,using an opportunistic heat-transfer capacity, and a decreasing high-pressure level (see Figure 12).
Figure 12. Overview of the change in heat duties for the reboiler�condenser (QRC), theHI stages (QHI), their sum (Qtot) for an increasingnumber of HI stages using an opportunistic heat-transfer capacity and adecreasing high-pressure level (PHPC).
Figure 13. HI-stage temperature difference profile for different num-bers of HI stages, using an opportunistic heat-transfer capacity and adecreasing high-pressure level.
9331 dx.doi.org/10.1021/ie200383s |Ind. Eng. Chem. Res. 2011, 50, 9324–9338
Industrial & Engineering Chemistry Research ARTICLE
heat-transfer area required in the reboiler�condenser has de-creased by 24%, compared to the base case.5.5. Opportunistic Heat-Transfer Capacity. Figure 11 shows
how the entropy production in the distillation section changeswhen the number of HI stages is increased, while decreasing thepressure in the HPC and using an opportunistic value for theheat-transfer capacity.The entropy production in all process units decreases as the
number of HI stages increases. The maximum total decrease inentropy production occurs again for the maximum number of HIstages. It amounts to 1.23 J/(K s), which equals a reduction of31%, compared to the base case. The LPC accounts for 75% ofthe total reduction. The explanations for the reductions in thevarious process units are similar to those given in section 5.3.Figure 12 shows how the heat duties change when the number
of HI stages is increased, while decreasing the pressure in theHPC and using an opportunistic value for the heat-transfercapacity.Increasing the number of HI stages again replaces some of the
reboiler�condenser heat duty with the duty of the other HIstages. For the current case, the total duty decreases by 2.9% forthe configuration with 26 HI stages, relative to the base case. Thisdecrease is again caused by the lower pressure in the HPC.Themaximum number of HI stages is again limited by product
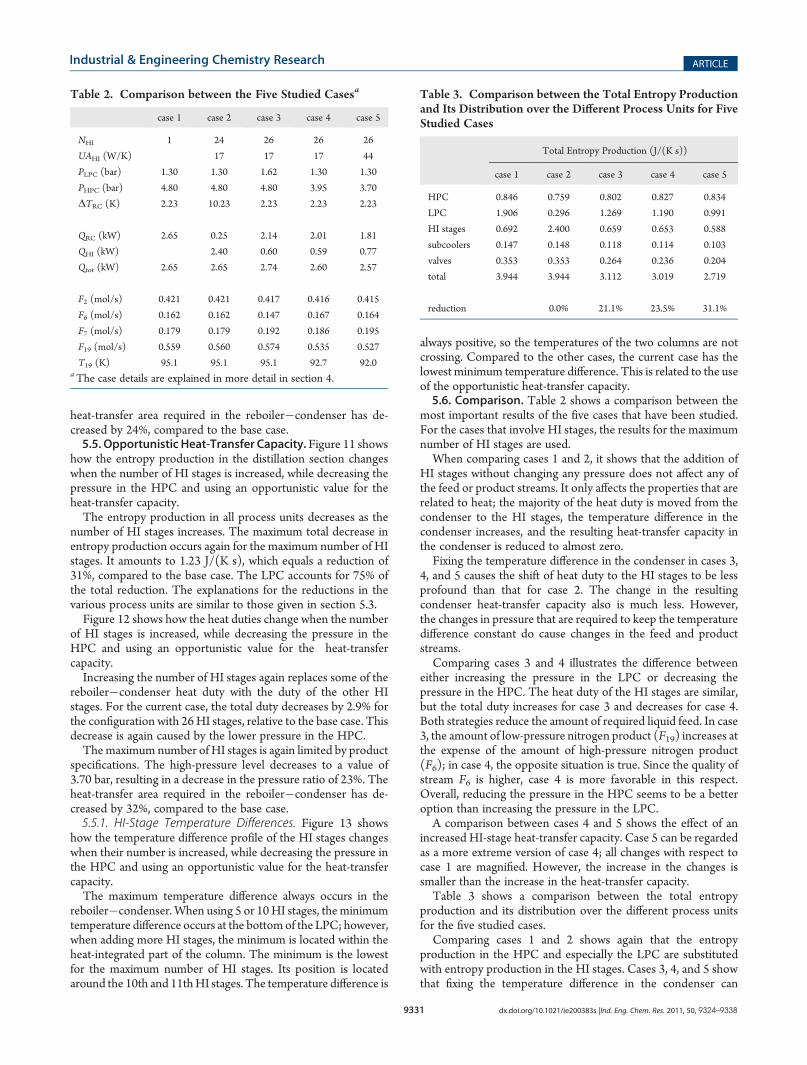
specifications. The high-pressure level decreases to a value of3.70 bar, resulting in a decrease in the pressure ratio of 23%. Theheat-transfer area required in the reboiler�condenser has de-creased by 32%, compared to the base case.5.5.1. HI-Stage Temperature Differences. Figure 13 shows
how the temperature difference profile of the HI stages changeswhen their number is increased, while decreasing the pressure inthe HPC and using an opportunistic value for the heat-transfercapacity.The maximum temperature difference always occurs in the
reboiler�condenser.When using 5 or 10HI stages, theminimumtemperature difference occurs at the bottomof the LPC; however,when adding more HI stages, the minimum is located within theheat-integrated part of the column. The minimum is the lowestfor the maximum number of HI stages. Its position is locatedaround the 10th and 11thHI stages. The temperature difference is
always positive, so the temperatures of the two columns are notcrossing. Compared to the other cases, the current case has thelowest minimum temperature difference. This is related to the useof the opportunistic heat-transfer capacity.5.6. Comparison. Table 2 shows a comparison between the
most important results of the five cases that have been studied.For the cases that involve HI stages, the results for the maximumnumber of HI stages are used.When comparing cases 1 and 2, it shows that the addition of
HI stages without changing any pressure does not affect any ofthe feed or product streams. It only affects the properties that arerelated to heat; the majority of the heat duty is moved from thecondenser to the HI stages, the temperature difference in thecondenser increases, and the resulting heat-transfer capacity inthe condenser is reduced to almost zero.Fixing the temperature difference in the condenser in cases 3,
4, and 5 causes the shift of heat duty to the HI stages to be lessprofound than that for case 2. The change in the resultingcondenser heat-transfer capacity also is much less. However,the changes in pressure that are required to keep the temperaturedifference constant do cause changes in the feed and productstreams.Comparing cases 3 and 4 illustrates the difference between
either increasing the pressure in the LPC or decreasing thepressure in the HPC. The heat duty of the HI stages are similar,but the total duty increases for case 3 and decreases for case 4.Both strategies reduce the amount of required liquid feed. In case3, the amount of low-pressure nitrogen product (F19) increases atthe expense of the amount of high-pressure nitrogen product(F6); in case 4, the opposite situation is true. Since the quality ofstream F6 is higher, case 4 is more favorable in this respect.Overall, reducing the pressure in the HPC seems to be a betteroption than increasing the pressure in the LPC.A comparison between cases 4 and 5 shows the effect of an
increased HI-stage heat-transfer capacity. Case 5 can be regardedas a more extreme version of case 4; all changes with respect tocase 1 are magnified. However, the increase in the changes issmaller than the increase in the heat-transfer capacity.Table 3 shows a comparison between the total entropy
production and its distribution over the different process unitsfor the five studied cases.Comparing cases 1 and 2 shows again that the entropy
production in the HPC and especially the LPC are substitutedwith entropy production in the HI stages. Cases 3, 4, and 5 showthat fixing the temperature difference in the condenser can
Table 2. Comparison between the Five Studied Casesa
case 1 case 2 case 3 case 4 case 5
NHI 1 24 26 26 26
UAHI (W/K) 17 17 17 44
PLPC (bar) 1.30 1.30 1.62 1.30 1.30
PHPC (bar) 4.80 4.80 4.80 3.95 3.70
ΔTRC (K) 2.23 10.23 2.23 2.23 2.23
QRC (kW) 2.65 0.25 2.14 2.01 1.81
QHI (kW) 2.40 0.60 0.59 0.77
Qtot (kW) 2.65 2.65 2.74 2.60 2.57
F2 (mol/s) 0.421 0.421 0.417 0.416 0.415
F6 (mol/s) 0.162 0.162 0.147 0.167 0.164
F7 (mol/s) 0.179 0.179 0.192 0.186 0.195
F19 (mol/s) 0.559 0.560 0.574 0.535 0.527
T19 (K) 95.1 95.1 95.1 92.7 92.0aThe case details are explained in more detail in section 4.
Table 3. Comparison between the Total Entropy Productionand Its Distribution over the Different Process Units for FiveStudied Cases
Total Entropy Production (J/(K s))
case 1 case 2 case 3 case 4 case 5
HPC 0.846 0.759 0.802 0.827 0.834
LPC 1.906 0.296 1.269 1.190 0.991
HI stages 0.692 2.400 0.659 0.653 0.588
subcoolers 0.147 0.148 0.118 0.114 0.103
valves 0.353 0.353 0.264 0.236 0.204
total 3.944 3.944 3.112 3.019 2.719
reduction 0.0% 21.1% 23.5% 31.1%
9332 dx.doi.org/10.1021/ie200383s |Ind. Eng. Chem. Res. 2011, 50, 9324–9338
Industrial & Engineering Chemistry Research ARTICLE
prevent the HI contribution from increasing, while still decreas-ing the LPC contribution. The reductions in the contributions ofthe LPC, HI stages, subcoolers, and valves all increase as the totalreduction increases. But the reduction in the HPC contributionbecomes smaller when the total reduction increases.
6. DISCUSSION
6.1. Model Improvements. The model that is used tosimulate the distillation columns and their heat integration isbased on several assumptions. Although these assumptions donot affect the comparison between the different cases studied inthis work, it is still good to mention the ones that are expected tohave the largest influence on the results of a single case. Possiblefuture model improvements should focus on removing thoseassumptions.6.1.1. Variable Heat-Transfer Coefficient. The current heat-
integration model uses a single constant value for the overallheat-transfer coefficient. This value is used for all HI stages. Inreality, the overall heat-transfer coefficient can be expected todepend on various factors, such as the liquid flow rate, the vaporflow rate, and the types of evaporation and condensationprocesses. The comparison between cases 4 and 5 shows thatthe value of the overall heat-transfer coefficient does have aconsiderable influence on the potential performance improve-ment when using HI stages. Therefore, more-detailed knowledgeon the behavior of the overall heat-transfer coefficient is required,both theoretical and experimental.6.1.2. Rate-Based Distillation Model. The distillation columns
are simulated using the assumption that the vapor and liquidstreams leaving a theoretical stage are at equilibrium with eachother. This equilibrium, in reality, does not occur in a distillationcolumn, especially not when it is equipped with structuredpacking. Rate-based models are often used to provide for amore accurate representation of distillation columns. (See, forexample, the work of Seader and Henly21 for more details onrate-based distillation models.)The current heat-integration model uses the difference be-
tween the outlet temperatures of two heat-integrated theoreticalstages. Because the temperature difference varies along the lengthof the heat-integrated columns, the use of theoretical stages
involves an additional simplification. It forces the continuoustemperature difference profile to be represented by a limitednumber of temperature differences only. Therefore, the accuracyof the heat-integration model would benefit from the use of arate-based distillation model instead of an equilibrium stagedistillation model.6.1.3. Coupling between Mass and Thermal Energy Fluxes. In
the current model, it assumed that the heat integration betweenthe two columns does not affect their separation efficiencies(or, in other words, it is assumed that there is no couplingbetween mass and thermal energy fluxes). Theoretical studieshave shown that the coupling between mass and thermal energyfluxes can have considerable influence on their magnitudes.22,23
Even their directions may change in some cases. The presenceof HI stages can be expected to make this coupling effect moreprofound than in conventional distillation columns, because anadditional thermal flux is present in the system. The effect ofcoupling between mass and thermal energy fluxes should beverified experimentally and included in the model. This will enablemore-accurate predictions of the separation efficiency per columnheight.6.2. Further Optimization of the Heat-Transfer Capacity.
An increase in the heat-transfer capacity has a positive effect onthe performance improvement that HI stages have. The oppor-tunistic heat-transfer capacity calculated in section A.3 in Ap-pendix A can be regarded as a simple first attempt to increase theheat-transfer capacity. There are various options that, in theory,can increase the heat-transfer capacity even further.The first two options are related to the type of structured
packing that is used and the operating flow rate. The use ofstructured packing with a lower efficiency results in an increasedtheoretical stage height, and, thus, a higher heat-transfer capacityper theoretical stage. Another possibility is to operate thedistillation column further below its maximum vapor flow rate.This results into a larger required column cross-section, and thusincreases the number of parallel columns that is required for agiven feed flow rate.Three more options involve changes to the heat-transfer area.
First, the heat-transfer area can be increased by applying surfaceenhancements. The design described by Horiuchi et al.24 uses,for example, a wire that is wound around the inner column wall.This both increases the heat-transfer area and improves the heat-transfer coefficient of the liquid film flowing down along thecolumn wall. Other types of surface enhancements are alsopossible, such as small fins or engravings. A second way ofincreasing the effective heat-transfer area is to improve thethermal contact between the structured packing and the columnwall and, thus, use the structured packing as a heat-transfer area.Normally, the packing and the wall are in contact via liquid wall-wipers. Their number can be increased, or their design can beoptimized for heat conduction. The third option to increase theheat-transfer area is to use smaller column diameters.Using smaller column diameters will also allow for thinner
columnwalls, further improving the heat-transfer capacity. Distil-lation columns are often constructed from steel. For example,replacing steel with aluminum or copper, which have higherthermal conductivities, will also help to increase the heat-transfercapacity.Several of the suggested improvements change the character of the
process unit from a heat exchanging distillation column in thedirection of a distilling heat exchanger. For example, the use of afractionating heat exchanger has been investigated by Tung et al.25
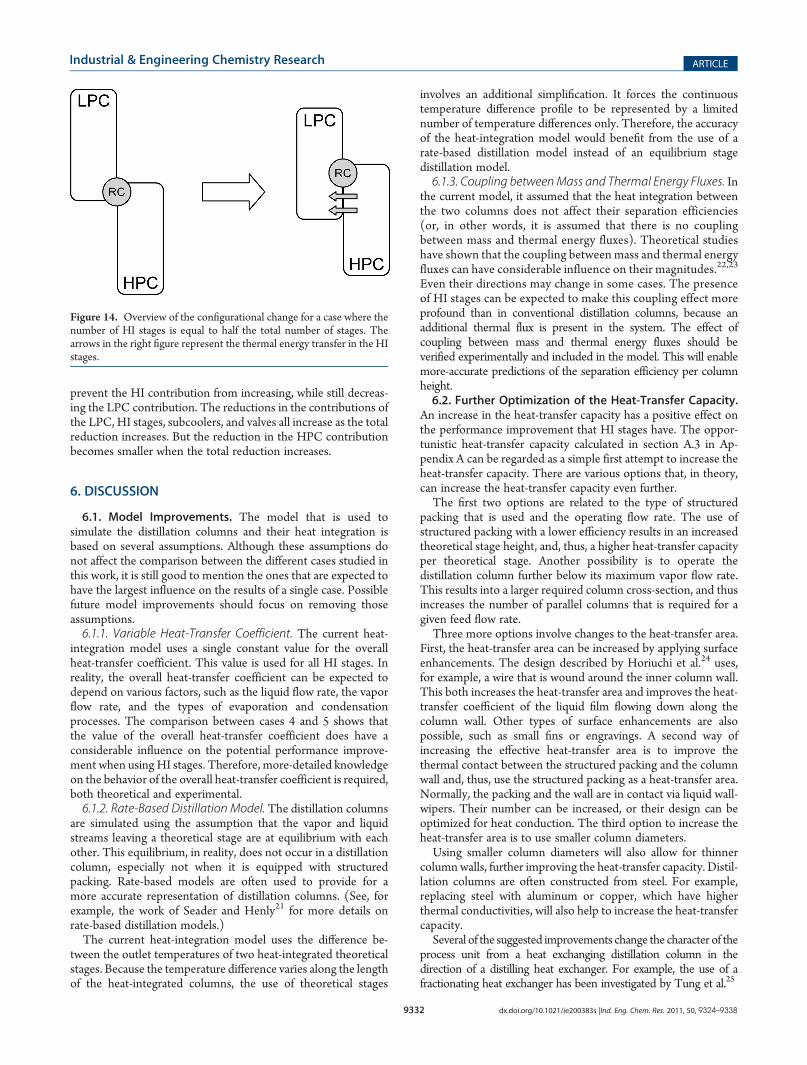
Figure 14. Overview of the configurational change for a case where thenumber of HI stages is equal to half the total number of stages. Thearrows in the right figure represent the thermal energy transfer in the HIstages.
9333 dx.doi.org/10.1021/ie200383s |Ind. Eng. Chem. Res. 2011, 50, 9324–9338
Industrial & Engineering Chemistry Research ARTICLE
One must keep in mind that this assessment of improvementpossibilities focuses on the thermodynamic performance only;the effect that the changes have on the economics is not takeninto account.6.3. Other Configuration Improvement Possibilities. The
current work focuses on the possible performance improvementsrelated to the use of HI stages, in combination with adjustedoperating pressures. In addition to these changes, adjustments inseveral other design parameters might further improve the per-formance of the distillation section.In the current study, the number of theoretical distillation
stages remains fixed in each column. This also holds for the feedand the draw locations. Redistributing the total number of stagesover the two columns, and adjusting the feed and draw locations,could further increase the distillation section efficiency. Espe-cially interesting is the option tomove the feed location of stream15 up toward the top of the LPC, since this feed location islimiting themaximumpossible number of HI stages for cases 3, 4,and 5 studied in this work.Another degree of freedom that can be introduced is the use of
different types of structured packing in the two columns. Usingthe same type of packing in both columns, the heat-transfercapacity per column height is always the same in the twocolumns. By allowing different types of packing, these quantitiescan be decoupled, adding more optimization possibilities. Inorder to model heat-integrated columns that are equipped withdifferent types of packing, a rate-based distillation model isrequired, as described in section 6.1.2. It should be kept in mindthat choosing a different type of packing might result in higherinvestment costs.6.4. Materialization of the Performance Improvement.
The addition of HI stages affects both the size of the distillationsection and the overall ASU performance.6.4.1. Effect on Distillation Section Size. Figure 14 shows a
conceptual drawing of how the distillation column configurationchanges when using themaximumnumber of 26HI stages, whichis about half of the total number of stages in both columns.Moving the LPC down along, or into, the HPC results in a
lower total column height. The use of HI stages also decreasesthe size of the reboiler�condenser. This causes the total size ofthe cold-box in which they are located to decrease. A smallercold-box results into lower capital costs and the costs of thereboiler�condenser itself will also decrease.However, the use of HI stages also increases the capital costs,
since the use of multiple parallel columns with a small diameterrequires more column wall per cross-section in the heat-inte-grated part of the configuration. The structured packing that isused also becomes more expensive, because more-complicatedshapes are involved.6.4.2. Effect on ASU Performance. The performance improve-
ments realized in cases 3, 4, and 5 materialize in changed inletand outlet stream conditions of the distillation section. Thecompositions of the streams hardly change, but their flow rates,pressures (and, therefore, temperatures) do. Detailed simula-tions that accurately quantify the effects of these changes on theoverall ASU performance are outside the scope of the currentwork. Therefore, the current assessment has a more qualitativecharacter.The performance improvements translate in the end in de-
creased pump and compressor duties. In the original designdescribed in the work of Van der Ham and Kjelstrup,4 the mainair compressor, which is located upstream of stream 2, accounts
for 68% of the total work input. The nitrogen compressordownstream of stream 6 uses 22%, and the one that is upgradingabout one-fifth of stream 19 to the high-pressure level uses 8%.The remaining part of the total work input is used in the boosterair compressor upstream of stream 4, and in the two pumps. Theexpander duties are comparable to the pump duties.A decrease in the flow rate or stream 2 directly reduces the
duty of the main air compressor, which has a considerable effecton the total work input. For a fixed expander duty, a decrease inthe pressure of stream 2 also reduces the duty of the main aircompressor. An increase in the pressure of stream 4 has a verylimited effect on the total work input, since the contribution ofthe booster air compressor to the total work input is very small.An increase in the flow rate of stream 6 requires a smaller partof stream 19 to be upgraded, reducing the duty for compressingthis part of stream 19. But a reduced pressure of stream 6 requiresmore duty in the nitrogen compressor. Changes in the pressuresof the streams 5 and 16 affect the pump duties. However, thishardly influences the total work input, since the pumps accountfor only a small part of the total work input. An increase in thepressure of stream 19 reduces the required duty in the compres-sor that is upgrading a part of this stream. Decreases in thecompressor duties also decreases the duties of the aftercoolers.Also the MHX is affected by the changes in the process
streams. A decrease in pressure ratio between the two distillationcolumns results in a smaller temperature difference at the coldside of the MHX, requiring more heat-transfer area. Changes inthe flow rates alter the heat duty of the MHX, and therefore alsoaffect the required heat-transfer area.The decreasing size of the cold-box will also affect the ASU
performance, because it results in smaller losses of low-tempera-ture energy to the surroundings.6.5. Comparison with Other Structural Changes. In the
work of Van der Ham and Kjelstrup,4 two other changes in theASU flowsheet are discussed that can improve the ASU effi-ciency. The first one is the addition of a third distillation column,and the second one is the addition of one or two intermediateheat exchangers in the bottom section of the LPC.Addition of a third column reduced the entropy production in
the distillation section by 30%, while adding intermediate heatexchangers managed to reduce it by ∼15%. From a thermo-dynamic performance perspective, adding an intermediate heatexchanger is thus the least promising, although it is probably lessexpensive than adding a distillation column or using HI stages. Asdiscussed in sections 6.2 and 6.3, the performance improvementof using HI stages can expected to be increased even further,yielding a reduction in entropy production that is comparable orlarger than when adding a third distillation column.Comparing the three alternatives based on these considera-
tions, the use of HI stages seems to be the most promising.However, this does not necessarily mean that it also is the least-expensive alternative.
7. CONCLUSIONS
The performance improvement that can be realized by the useof heat-integrated stages (HI stages) in a two-column airspearation unit (ASU) has been assessed. Increasing the numberof HI stages without adjusting the operating pressures causes theheat duty of the condenser to be taken over by the HI stages. Thisresults in a relocalization of entropy production from the HPCand especially the LPC to the HI stages, while keeping the total
9334 dx.doi.org/10.1021/ie200383s |Ind. Eng. Chem. Res. 2011, 50, 9324–9338
Industrial & Engineering Chemistry Research ARTICLE
entropy production unchanged. The reduction in the LPCentropy production is partly caused by a more even distributionof the entropy production in its stripping section. The increasedamount of entropy production in the HI stages is mainly causedby an increasing temperature difference. At the maximumnumber of HI stages, the condenser requires only 2% of its basecase heat-transfer area.
A reduction in the ratio between the operating pressures canbe used to keep the temperature difference in the condenser at itsbase case value. This enables a reduction in the LPC entropyproduction without increasing the entropy production in the HIstages, resulting in an overall decrease. For a probable value of theheat-transfer capacity, increasing the pressure in the LPC resultsin a maximum decrease of 21%, while decreasing the pressure inthe HPC results in a maximum decrease of 23%. Decreasing thepressure in the HPC when using a opportunistic heat-transfercapacity yields a maximum decrease of 31%. All these maximaoccur at 26 HI stages; this number is limited by the productspecifications and the fixed feed stages. About three-quarters ofthe reductions are caused by the LPC, but the contributions ofthe other process units also decrease.
The reductions in entropy production materialize as changesin the feed and product stream properties; the overall quality ofthe feeds is reduced and the overall quality of the products isincreased. These changes eventually affect the required com-pressor, pump, and expander duties of the ASU. The use of HIstages also affects the size of the cold-box in which the distillationcolumns are located. Compared to the addition of either anadditional heat exchanger or an additional distillation column,the use of HI stages seems to be the most promising method forimproving the thermodynamic performance of a cryogenic ASU.
In order to improve the model that is used to simulate heat-integrated distillation columns (HiDiCs), more detailed experi-mental data are required. The achievable heat-transfer capacityshould be determined, along with its dependency on variousoperating conditions. In order to ensure the accuracy of rate-based distillation models when applied to heat-integrated col-umns, the coupling between the thermal and mass fluxes shouldbe assessed.
APPENDIX A. DETAILED MODEL DESCRIPTION
A.1. Thermodynamic Model. A reference equation-of-stateby Lemmon17 is used to calculate all thermodynamic propertiesthat are required in this work. This empirical thermodynamicmodel is developed to predict the properties of air-like mixtureswith an accuracy that is as high as possible. It describes theHelmholtz energy of any mixture of nitrogen, oxygen, and argonas a function of temperature and density. Other thermodynamicquantities of the mixture can be calculated by combining deri-vatives of the Helmholtz energy, with respect to the temperatureand density.A.1.1. Partial Molar Quantities. The partial molar quantities of
a component are given by the derivatives of these quantities, withrespect to the number of moles of this component, at con-stant temperature, pressure, and the number of moles of the othercomponent(s). In the current study, the partial molar quantitiesare obtained by numerical evaluation of these derivatives.A.1.2. Mixture Composition. In the current work, it is as-
sumed that air consists of a binary mixture of nitrogen and oxygenonly. The biggest advantage of this assumption is that the com-position of a single phase is defined by the temperature and
pressure only. This simplifies the solution procedure for especiallythe distillation columns. The feed air mixture is assumed to have anitrogenmole fraction of 0.79 and an oxygenmole fraction of 0.21.
A.2. Process Units and Flowsheet. Figure 3 shows a sche-matic representation of the distillation section of a cryogenicASU, with numbered process streams. The vertical positions ofthe two distillation columns are inverted in the schematic.A.2.1. Distillation Columns. The distillation columns are
modeled using theoretical equilibrium stages (see, for example,the work of Seader and Henley21 for more details). It is assumedthat the columns operate at a constant pressure and that there isno loss of low-temperature thermal energy to the surroundings.A.2.2. Heat-Integrated Stages. The main aim of the current
study is to evaluate how the distillation section performancechanges when the heat integration between the two columns isincreased by moving down the LPC along the HPC. In terms oftheoretical equilibrium stages, this corresponds to increasing thenumber of heat-integrated stages (HI stages).The heat duty between twoHI stages (QHI) can be calculated by
multiplying the temperature difference between the two stages(ΔTHI) by the overall heat-transfer coefficient (U) and the availableheat-transfer area (A). In this work, the stage outlet temperatureshave been used in order to calculate temperature differencesbetween HI stages. The overall heat-transfer coefficient and theheat-transfer area available per stage are combined into a singlequantity: the heat-transfer capacity per theoretical stage (UA). It isdescribed in more detail in section A.3 in Appendix A.A.2.3. Reboiler�Condenser. The heat exchanger that is func-
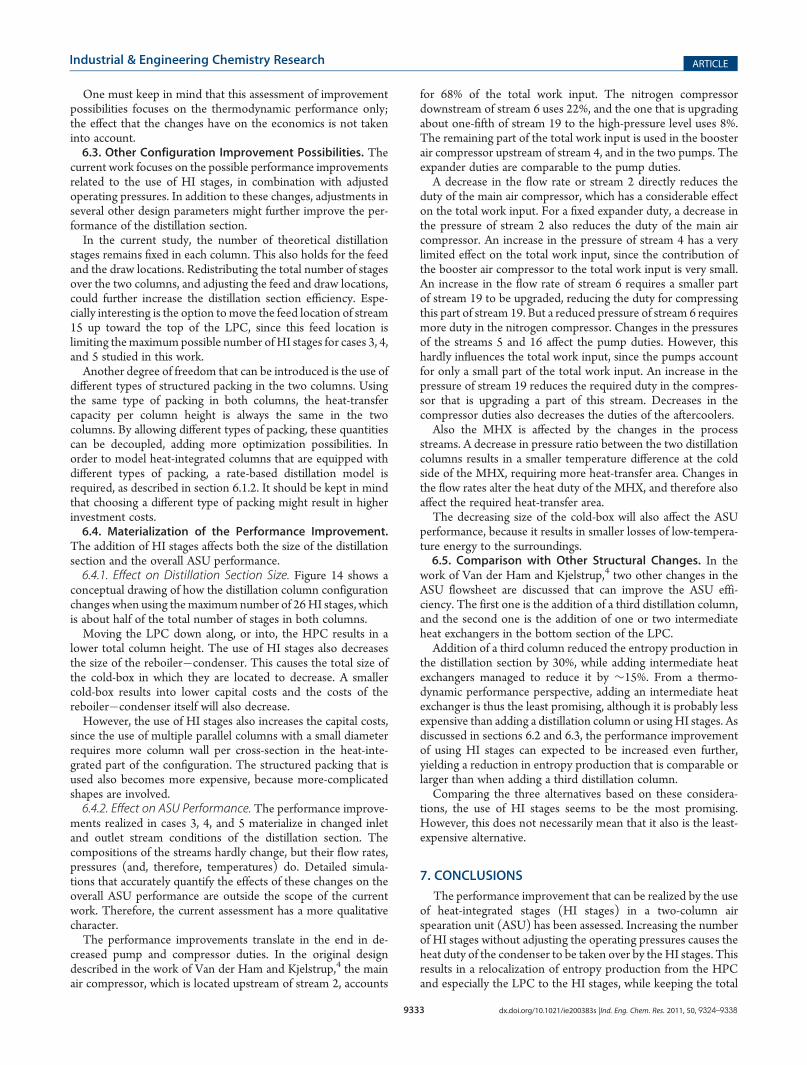
tioning as a reboiler�condenser is modeled as an additionalequilibrium stage, present in both the HPC and the LPC. Whathappens with the reboiler�condenser when the LPC is moveddown along the HPC remains to be decided. In theory, there arefour possible configurations. A first option is to remove the heatexchanger completely and rely on the heat transfer between theHI stages only. The next two options are to keep a single heatexchanger and have it either function as reboiler for the LPC andas intermediate heat exchanger for the HPC, or as condenser forthe HPC and intermediate heat exchanger for the LPC. A fourthpossibility is to add a second heat exchanger and have bothprevious functionalities. The four configurations are schemati-cally illustrated in Figure A1.In order to keep the number of heat exchangers unchanged
and to ensure the availability of a liquid nitrogen product, adecision was made to use the second configuration: a single heatexchanger that functions as a condenser for the HPC.
Figure A1. Schematic of the four possible column configurations. Fromleft to right: no reboiler or condenser, condenser only, reboiler only, orboth a reboiler and a condenser.
9335 dx.doi.org/10.1021/ie200383s |Ind. Eng. Chem. Res. 2011, 50, 9324–9338
Industrial & Engineering Chemistry Research ARTICLE
A.2.4. Subcoolers. The subcooling step within the distillationsection is simulated using two separate subcoolers. In the firstone, stream 7 is cooled using stream 17, yielding streams 10 and18. In the second one, streams 8 and 9 are cooled using stream 18,yielding streams 11, 12, and 19. The outlet temperatures ofstreams 11 and 12 are assumed to be the same. It is also assumedthat the subcoolers operate at a constant pressure and that thereis no loss of low-temperature thermal energy to the surroundings.A.2.5. Throttle Valves. The throttle valves are modeled as
adiabatic pressure decrease processes. This means that there is noloss of low-temperature thermal energy to the surroundings.
A.3. Heat-Transfer Capacity per Theoretical Stage. One ofthe key design variables for HiDiCs is the heat-transfer capacityper theoretical equilibrium stage. In concentrically integrated col-umns that are equipped with structured packing, the amount ofheat-transfer area can be calculated by multiplying the height of atheoretical stage with the circumference of the inner column. Thediameter of a column is usually determined by its vapor flow rate;it is chosen such that the F-factor, which is given by the squareroot of the vapor mass density multiplied with the superficialvapor velocity, is always below a critical value. Both this criticalF-factor (Fmax) and the height of a theoretical stage are perfor-mance properties of the structured packing that is used.In order to make a realistic estimate for the heat-transfer
capacity per theoretical stage, we need to select the type of struc-tured packing and values for the inner column diameter, the over-all heat-transfer coefficient, and the operating conditions in thecolumn. Using these values, it is possible to calculate the maxi-mummolar vapor flow rate that can be allowed in a single columnof the chosen diameter, based on the definition of the F-factor:
Vmax ¼ FmaxπD2
i
4
! ffiffiffiffiffiffiffiffiffiFVmolMmol
sð2Þ
The ratio between this maximum flow rate per column and theactual required flow rate determines the number of parallel
columns that is needed. The heat-transfer capacity per stagemust be multiplied with the number of parallel columns.A.3.1. Structured Packing. Structured packing is commonly
characterized using graphs of its separation efficiency and itspressure drop as function of the F-factor. The separationefficiency is usually given by the number of transfer units permeter of packing (NTH) or its inverse, the height equivalent toa theoretical plate (HETP). Up to the critical F-factor, theseparation efficiency decreases slightly as the F-factor increases.However, above the critical F-factor, the packing starts to floodand the separation efficiency diminishes. The critical F-factor ismainly determined by the type of packing, but it also depends onthe liquid flow rate in the column. In the current study, weassume that the separation efficiency has a constant value, up tothe critical F-factor, above which it becomes zero. The criticalF-factor is assumed to be independent of the liquid flow rate.Some approximate values for the separation efficiency and criticalF-factor of some standard types of structured packing are listed inTable A-1.Using less-efficient packing increases the amount of heat-
transfer area per equilibrium stage and allows for either a higherthroughput or a lower pressure drop. But it also requires a highercolumn. For a given total feed flow rate, a higher throughputwould lower the amount of heat-transfer capacity, because thenumber of parallel columns decreases.A.3.2. Inner Column Diameter. A small column diameter
results in a high heat-transfer capacity, but it also requires a highnumber of parallel columns for a given total feed. Two Japanesepilots of a concentric HIDiC used inner column diameters in therange of 0.14�0.27 m,24,26 yielding an average of value of 0.20 m.A.3.3. Overall Heat-Transfer Coefficient. It is not straightfor-
ward to obtain a reliable estimate for the overall heat-transfercoefficient; only three experimental results are available in theopen literature for heat transfer between two HiDiC parts thatare equipped with structured packing.24,27,28 They all report asingle value that represents the entire column. Their values rangebetween 670 W/(m2 K) and 1100 W/(m2 K) and have anaverage value of ∼800 W/(m2 K).A.3.4. Operating Conditions. The operating conditions in the
column determine the vapor density. At the top of the HPC, themixture will always have a very high nitrogen fraction. This leavesthe operating pressure as the most important factor thatinfluences the vapor density. The pressure affects the vapordensity directly, and indirectly via the dew point temperature ofthe mixture. For a decreasing pressure at a constant temperature,the vapor density decreases. The dew-point temperature alsodecreases for a decreasing pressure, which causes a slight increase
Table A-1. Approximate Properties of Several Types ofStructured Packing
Montz B1-series B1-150 B1-250 B1-500
Sulzer Mellapak 170.Y 250.Y 500.Y
NTH (stages/m) 2 3 4
Fmax (Pa1/2) 3.0 2.5 2.0
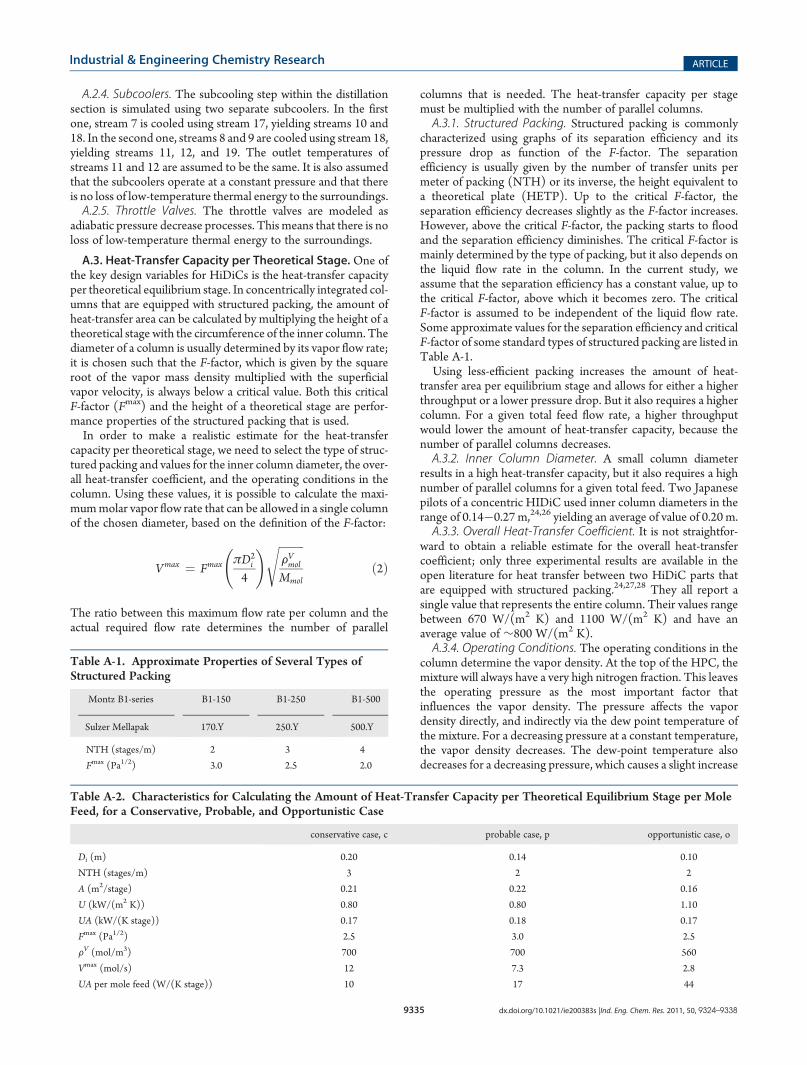
Table A-2. Characteristics for Calculating the Amount of Heat-Transfer Capacity per Theoretical Equilibrium Stage per MoleFeed, for a Conservative, Probable, and Opportunistic Case
conservative case, c probable case, p opportunistic case, o
Di (m) 0.20 0.14 0.10
NTH (stages/m) 3 2 2
A (m2/stage) 0.21 0.22 0.16
U (kW/(m2 K)) 0.80 0.80 1.10
UA (kW/(K stage)) 0.17 0.18 0.17
Fmax (Pa1/2) 2.5 3.0 2.5
FV (mol/m3) 700 700 560
Vmax (mol/s) 12 7.3 2.8
UA per mole feed (W/(K stage)) 10 17 44
9336 dx.doi.org/10.1021/ie200383s |Ind. Eng. Chem. Res. 2011, 50, 9324–9338
Industrial & Engineering Chemistry Research ARTICLE
in the vapor density. The net effect is dominated by the directdecrease in the vapor density. A reduction in the vapor densitydecreases the maximum vapor flow rate per column. Therefore, adecrease in operating pressure results in an increase in the heat-transfer capacity.A.3.5. Resulting Heat-Transfer Capacity. Based on the values
that are presented in the previous section, we can calculate theheat-transfer capacity for some different cases: a conservativecase, a probable case, and an opportunistic case. The conservativecase is based on average values for all variables, without trying tomaximize the heat-transfer capacity. An operating pressure of 4.8bar is used to calculate the vapor density; this is the maximumpressure used for HPC in this work. The probable case is basedon the conservative one, but a smaller diameter and less efficientpacking are selected. The opportunistic case uses an ever smallerdiameter. In addition, the maximum overall heat-transfer coeffi-cient, an operating pressure that is 80% of the maximum value,and a reduced maximum F-factor are selected. All cases assume amolar mass of 0.028 kg/mol. They also use the fact that, for aprocess with a total feed flow rate of 1.0 mol/s, the maximumvapor flow rate in the HPC amounts to ∼0.70 mol/s. Thecalculation inputs and results are shown in Table A-2.
APPENDIX B. CALCULATION DETAILS
All calculations have been performed using Matlab.
B.1. Solving the Process Flowsheet. The process flowsheetis solved using three iteration loops: one over the reboiler�condenser heat duty, one over the heat duties of the HI stages,and one over the low-purity nitrogen product stream. The fol-lowing routine is used:(1) Chose values for flow rates F2, F7, and F8.(2) Guess a reboiler�condenser heat duty (QRC).(3) Guess temperature differences for the HI stages (ΔTHI).(4) Solve the HPC.(5) Guess low-purity N2 properties (F17 and y17).
(6) Solve the subcoolers, throttle valves, and LPC.(7) Check F17 and y17, and return to step (5) if needed.(8) Check ΔTHI, and return to step (3) if needed.(9) Check QRC, and return to step (2) if needed.The first two loops can be combined for low numbers of HI
stages; however, for higher numbers, they must be separated inorder for the solution to converge. Flow rate F2 is used to obtain adesired oxygen recovery rate. Flow rates F7 and F8 are chosen suchthat they minimize the total entropy production of the distillationsection, as explained in more detail in section B.2. The value of F3 isset such that the sum of F2, F3, and F4 is always equal to 1.0 mol/s.B.1.1. Solving the Distillation Columns. Both distillation
columns are solved with Matlabs fsolve function, using the stageliquid mole fractions as variables.Solving the HPC comes down to finding F6 and F9 for fixed
values of the two feeds, F5, F7, F8, QRC, and QHI, while obeyingthe so-called MESH equations. More details on the MESHequations can be found in the literature (for example, Seaderand Henley21). Based on the liquid mole fractions selected byfsolve, first the vapor mole fractions and the liquid and vaporenthalpies are calculated. Next, the top and bottom product flowrates are calculated using overall material and componentbalances. Stage energy balances are subsequently used to calcu-late the vapor and liquid flow rates for all stages except thebottom one. Next, the disagreements in the stage componentbalances are calculated for these stages. For the bottom stage, thedisagreement in the energy balance is used, scaled with the totalenergy duty. The liquid mole fractions are adjusted by fsolve untilall stage disagreements are below a specified maximum value.Solving the LPC comes down to finding F17 and QRC for fixed
values of the three feeds, the oxygen product purity, andQHI, whileobeying theMESH equations. The first two calculation steps are thesame as those for the HPC. But before calculating the vapor andliquid flow rate profiles and the disagreements in the stage com-ponent balances, first the reboiler duty is calculated using the overallenergy balance. A stage disagreement calculation for the bottom
Table C1. Process Stream Properties of Cases 1 and 2
stream flow rate (mol/s) vapor fraction (mol/mol) pressure (bar) temperature (K) N2 fraction (mol/mol) enthalpy (kJ) entropy (J/K)
1 1.000 0.790
2 0.421 0.000 4.80 95.0 0.790 �1.900 22.62
3 0.564 1.000 4.80 124.8 0.790 0.924 65.68
4 0.015 1.000 1.30 95.5 0.790 0.012 1.80
5 0.066 0.000 4.80 93.5 1.000 �0.163 6.00
6 0.162 1.000 4.80 93.5 1.000 0.392 23.11
7 0.179 0.000 4.80 93.7 0.971 �0.492 15.39
8 0.160 0.000 4.80 95.5 0.788 �0.720 8.58
9 0.418 0.000 4.80 97.6 0.600 �2.641 7.73
10 0.179 0.000 4.80 82.4 0.971 �0.612 14.02
11 0.160 0.000 4.80 92.7 0.788 �0.747 8.30
12 0.418 0.000 4.80 92.7 0.600 �2.760 6.48
13 0.179 0.029 1.30 79.7 0.971 �0.612 14.05
14 0.160 0.120 1.30 81.3 0.788 �0.747 8.41
15 0.418 0.099 1.30 83.0 0.600 �2.760 6.69
16 0.212 0.000 1.30 91.3 0.050 �2.624 �20.93
17 0.559 1.000 1.30 79.9 0.985 1.168 82.82
18 0.559 1.000 1.30 86.7 0.985 1.288 84.27
19 0.559 1.000 1.30 95.1 0.985 1.433 85.86
9337 dx.doi.org/10.1021/ie200383s |Ind. Eng. Chem. Res. 2011, 50, 9324–9338
Industrial & Engineering Chemistry Research ARTICLE
stage is no longer required, since the mole fraction of the bottomproduct is fixed, as is explained in section 4.1.B.1.2. Solving the Subcoolers. The two subcoolers are solved
in series. For both subcoolers, the first solution step is to calculatethe total heat capacities of the hot and cold streams. Those heatcapacities are subsequently used to determine at which side of thesubcooler theminimum allowable temperature difference occurs,which fixes one of the outlet temperatures. The other outlettemperature is calculated using the energy balance. As a last step,it is verified that the temperature difference at the other side ofthe subcooler is larger than the minimum allowable value.B.1.3. Solving the Throttle Valves.The outlet conditions of the
throttle valves are found by first assuming values for the liquidoutlet compositions. The component and material balances aresubsequently used to find the total vapor and liquid outlet flowrates. Next, the disagreement in the energy balance is calculated.The liquid outlet compositions are adjusted until the disagree-ments are below a specified maximum value.B.1.4. Solution Consistency and Accuracy. After solving all
process units and the flowsheet, the consistency of the foundsolution is checked. The disagreements in the energy, compo-nent, and material balances for all process units, distillationstages, and the entire flowsheet are calculated. All disagreementsare required to be below 10�6, with the energy balance disagree-ments being scaled with the total heat duty.
B.2. Optimizing the Intercolumn Flows. The intercolumnflow rates F7 and F8 are free variables; they can be used tooptimize the flowsheet. In this work, they are used to minimizethe entropy production in the distillation section. For the basecase design described in section 4.1, both flow rates are opti-mized. The found optimal value for F8 is used for all other casesthat are studied in this work. F7 is re-optimized for all combina-tions of operating pressures, based on a configuration with thereboiler�condenser as only HI-stage.By choosing not to optimize F7 and F8 for each column config-
uration, some performance gain might be lost. This potential loss isexpected to be minor, compared to other contributions to theperformance gain. In case its importance is not negligible, the reportedperformance gains will be underestimated, compared to reality.
APPENDIX C. BASE CASE CHARACTERISTICS
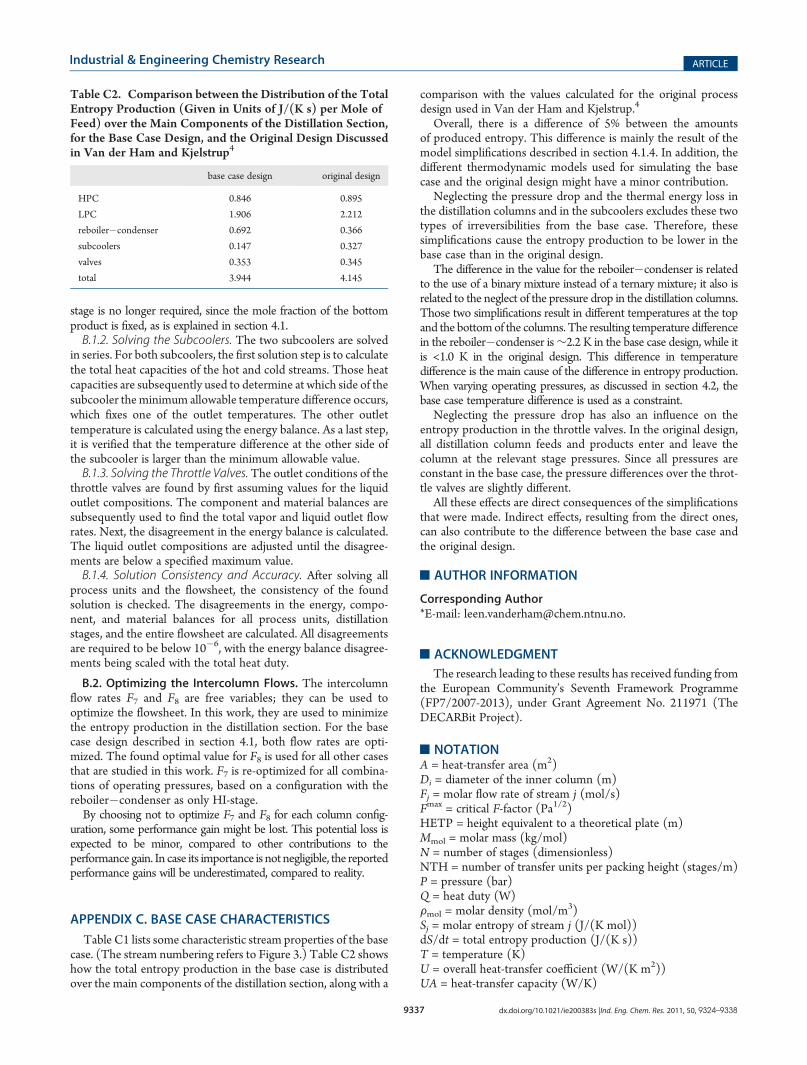
Table C1 lists some characteristic stream properties of the basecase. (The stream numbering refers to Figure 3.) Table C2 showshow the total entropy production in the base case is distributedover the main components of the distillation section, along with a
comparison with the values calculated for the original processdesign used in Van der Ham and Kjelstrup.4
Overall, there is a difference of 5% between the amountsof produced entropy. This difference is mainly the result of themodel simplifications described in section 4.1.4. In addition, thedifferent thermodynamic models used for simulating the basecase and the original design might have a minor contribution.
Neglecting the pressure drop and the thermal energy loss inthe distillation columns and in the subcoolers excludes these twotypes of irreversibilities from the base case. Therefore, thesesimplifications cause the entropy production to be lower in thebase case than in the original design.
The difference in the value for the reboiler�condenser is relatedto the use of a binary mixture instead of a ternary mixture; it also isrelated to the neglect of the pressure drop in the distillation columns.Those two simplifications result in different temperatures at the topand the bottomof the columns. The resulting temperature differencein the reboiler�condenser is∼2.2 K in the base case design, while itis <1.0 K in the original design. This difference in temperaturedifference is the main cause of the difference in entropy production.When varying operating pressures, as discussed in section 4.2, thebase case temperature difference is used as a constraint.
Neglecting the pressure drop has also an influence on theentropy production in the throttle valves. In the original design,all distillation column feeds and products enter and leave thecolumn at the relevant stage pressures. Since all pressures areconstant in the base case, the pressure differences over the throt-tle valves are slightly different.
All these effects are direct consequences of the simplificationsthat were made. Indirect effects, resulting from the direct ones,can also contribute to the difference between the base case andthe original design.
’AUTHOR INFORMATION
Corresponding Author*E-mail: [email protected].
’ACKNOWLEDGMENT
The research leading to these results has received funding fromthe European Community’s Seventh Framework Programme(FP7/2007-2013), under Grant Agreement No. 211971 (TheDECARBit Project).
’NOTATIONA = heat-transfer area (m2)Di = diameter of the inner column (m)Fj = molar flow rate of stream j (mol/s)Fmax = critical F-factor (Pa1/2)HETP = height equivalent to a theoretical plate (m)Mmol = molar mass (kg/mol)N = number of stages (dimensionless)NTH = number of transfer units per packing height (stages/m)P = pressure (bar)Q = heat duty (W)Fmol = molar density (mol/m3)Sj = molar entropy of stream j (J/(K mol))dS/dt = total entropy production (J/(K s))T = temperature (K)U = overall heat-transfer coefficient (W/(K m2))UA = heat-transfer capacity (W/K)
Table C2. Comparison between the Distribution of the TotalEntropy Production (Given in Units of J/(K s) per Mole ofFeed) over the Main Components of the Distillation Section,for the Base Case Design, and the Original Design Discussedin Van der Ham and Kjelstrup4
base case design original design
HPC 0.846 0.895
LPC 1.906 2.212
reboiler�condenser 0.692 0.366
subcoolers 0.147 0.327
valves 0.353 0.345
total 3.944 4.145
9338 dx.doi.org/10.1021/ie200383s |Ind. Eng. Chem. Res. 2011, 50, 9324–9338
Industrial & Engineering Chemistry Research ARTICLE
V max = maximum molar vapor flow rate (mol/s)y = vapor mole fraction (dimensionless)
AbbreviationsASU = air separation unitHI = heat-integrated (stages)HIDiC = heat-integrated distillation columnHP = high pressureHPC = high-pressure columnIGCC = integrated gasification combined cycleLP = low pressureLPC = low-pressure columnMHX = main heat exchangerMP = medium pressureRC = reboiler�condenser
’REFERENCES
(1) Røkke, N. A.; Langørgen, Ø. Enabling pre-combustion plants—The DECARBit project. Energy Procedia 2009, 1, 1435–1442.(2) Thorogood, R.M.Developments in air separation.Gas Sep. Purif.
1991, 5, 83–94.(3) Castle, W. F. Air separation and liquefaction: Recent develop-
ments and prospects for the beginning of the newmillenium. Int. J. Refrig.2002, 25, 158–172.(4) Van der Ham, L. V.; Kjelstrup, S. Exergy analysis of two cryogenic
air separation processes. Energy 2010, 35, 4731–4739.(5) Nakaiwa, M.; Ohmori, T. Innovation in distillation processes:
Process intensification for energy savings through concept of “detuning”from ideal state. Synthesiology (Engl. Ed.) 2009, 2, 55–63.(6) Rivero, R. Exergy simulation and optimization of adiabatic and
diabatic binary distillation. Energy 2001, 26, 561–593.(7) Schaller, M.; Hoffmann, K. H.; Siragusa, G.; Salamon, P.;
Andresen, B. Numerically optimized performance of diabatic distillationcolumns. Comput. Chem. Eng. 2001, 25, 1537–1548.(8) De Koeijer, G. M.; Kjelstrup, S.; Salamon, P.; Siragusa, G.;
Schaller, M.; Hoffmann, K. H. Comparison of Entropy Production RateMinimization Methods for Binary Diabatic Distillation. Ind. Eng. Chem.Res. 2002, 41, 5826–5834.(9) DeKoeijer, G.M.; Røsjorde, A.; Kjelstrup, S. Distribution of heat
exchange in optimum diabatic distillation columns. Energy 2004, 29,2425–2440.(10) Røsjorde, A.; Kjelstrup, S. The second law optimal state of a
diabatic binary tray distillation column.Chem. Eng. Sci.2005, 60, 1199–1210.(11) Johannessen, E.; Røsjorde, A. Equipartition of entropy produc-
tion as an approximation to the state of minimum entropy production indiabatic distillation. Energy 2007, 32, 467–473.(12) De Rijke, A. Ph.D. Thesis, Delft University of Technology,
Delft, The Netherlands, 2007.(13) Suphanit, B. Design of internally heat-integrated distillation
column (HIDiC): Uniform heat transfer area versus uniform heatdistribution. Energy 2010, 35, 1505–1514.(14) Røsjorde, A. Minimization of entropy production in separate
and connected process units. Ph.D. Thesis, Norwegian University ofScience and Technology, Trondheim, Norway, 2004.(15) Van der Ham, L. V.; Kjelstrup, S. Distributing the heat
integration of distillation columns for air separation. In Proceedings ofthe 24th International Conference on Efficiency, Cost, Optimization, Simula-tion and Environmental Impact of Energy Systems, Novi Sad, Serbia, July4�7, 2011.(16) Van der Ham, L. V.; Kjelstrup, S. Improving the heat integra-
tion of distillation columns in a cryogenic air separation unit. InProceedings of the 23rd IIR International Congress of Refrigeration, Prague,Czech Republic, August 21�26, 2011.(17) Lemmon, E. W.; Jacobsen, R. T.; Penoncello, S. G.; Friend,
D. G. Thermodynamic properties of air and mixtures of nitrogen, argon,
and oxygen from 60 to 2000 K at pressures to 2000 MPa. J. Phys. Chem.2000, 29, 331–385.
(18) Tondeur, D.; Kvaalen, E. Equipartition of entropy production.An optimality criterion for transfer and separation processes. Ind. Eng.Chem. Res. 1987, 26, 50–56.
(19) Johannessen, E.; Kjelstrup, S. A highway in state space forreactors with minimum entropy production. Chem. Eng. Sci. 2005,60, 3347–3361.
(20) Van der Ham, L. V.; Gross, J.; Kjelstrup, S. Two performanceindicators for the characterization of the entropy production in a processunit. Energy 2011, 36, 3727�3732.
(21) Seader, J. D.; Henley, E. J. Separation Process Principles; JohnWiley and Sons: New York, 1998.
(22) Van der Ham, L. V.; Bock, R.; Kjelstrup, S. Modelling thecoupled transfer ofmass and thermal energy in the vapour�liquid regionof a nitrogen�oxygen mixture. Chem. Eng. Sci. 2010, 65, 2236–2248.
(23) Van der Ham, L. V.; Kjelstrup, S. The importance of couplingbetween thermal and molar fluxes in a nitrogen�oxygen distillationcolumn. Submitted to Int. J. Thermodyn., 2011
(24) Horiuchi, K.; Yanagimoto, K.; Kataoaka, K.; Nakaiwa, M.;Iwakabe, K.; Matsuda, K. Energy saving characteristics of the internallyheat integrated distillation column (HIDiC) pilot plant for multicom-ponent petroleum distillation. J. Chem. Eng. Jpn. 2008, 41, 771–778.
(25) Tung, H. H.; Davis, F. J.; Mah, R. S. H. FractionatingCondensation and Evaporation in Plate-Fin Devices. AIChE J. 1986, 32,1116–1124.
(26) Naito, K.;Nakaiwa,M.;Huang, K.; Endo, A.; Aso, K.;Nakanishi,T.; Nakamura, T.; Noda, H.; Takamatsu, T. Operation of a bench-scaleideal heat integrated distillation column (HIDiC): An experimentalstudy. Comput. Chem. Eng. 2000, 24, 495–499.
(27) Nakanishi, T.; Adachi, N.; Nishida, N.; Iwakabe, K.; Horiuchi,K.; Nakaiwa, M. Basic design of a double-pipe unit type internally heatintegrated distillation column (HIDiC). In Proceedings of the AIChEAnnual Meeting 2008; Philadelphia, PA, November 16�21, 2008.
(28) Niggemann, G.; Hiller, C.; Fieg, G. Experimental and Theore-tical Studies of a Dividing-Wall Column Used for the Recovery of High-Purity Products. Ind. Eng. Chem. Res. 2010, 49, 6566–6577.