Embed Size (px)
Citation preview
IMS3001 – BUSINESS INTELLIGENCE SYSTEMS – SEM 1 , 2004
Knowledge-Driven Knowledge-Driven Business Intelligence Business Intelligence Systems: Part IISystems: Part II
Week 11Dr. Jocelyn San PedroSchool of Information
Management & SystemsMonash University
IMS3001 – BUSINESS INTELLIGENCE SYSTEMS – SEM 1 , 2004 2
Lecture OutlineLecture Outline Data Mining Technologies
Neural Networks Genetic Algorithms Fuzzy Logic Decision Trees
Data Visualisation
IMS3001 – BUSINESS INTELLIGENCE SYSTEMS – SEM 1 , 2004 3
Learning ObjectivesLearning ObjectivesAt the end of this lecture, the students will Gain some understanding of data
mining technologies (decision trees, neural networks, genetic algorithms, and fuzzy logic) that are commonly used in data mining techniques
Preview some visualisation tools and gain an understanding of how they support business decision making
IMS3001 – BUSINESS INTELLIGENCE SYSTEMS – SEM 1 , 2004 4
Data Mining TechnologiesData Mining Technologies1960s – classical statistical analysis Correlation, regression, chi-square, cross-
tabulation
1980s – classical statistical analysis augmented by more powerful set of soft computing techniques
neural networks, genetic algorithms, fuzzy logic, decision trees
IMS3001 – BUSINESS INTELLIGENCE SYSTEMS – SEM 1 , 2004 5
Soft Computing Emerging discipline that combines
computational methods for dealing with inexact, approximate reasoning approaches
simulating the brain-way of solving problems - neural networks
evolving solutions - genetic algorithms dealing with logical ambiguity - fuzzy logic representing effect of each event, or decision,
on successive events – decision trees
IMS3001 – BUSINESS INTELLIGENCE SYSTEMS – SEM 1 , 2004 6
Neural NetworksNeural Networks Attempt to mirror the way human brain works in
recognizing patterns by developing mathematical structures with the ability to learn (Marakas, 2002)
Attempt to “learn” patterns from data directly, by sifting data repeatedly, searching for relationships, automatically building models, and correcting over and over again the model’s own mistakes – (Dhar and Stein, 1997)
Good at modelling poorly understood problems for which sufficient data can be collected
IMS3001 – BUSINESS INTELLIGENCE SYSTEMS – SEM 1 , 2004 7
Artificial Neural Nets Artificial Neural Nets (ANNs)(ANNs)simple computer programs that build
models from data by trial and error“Learning from Experience” Present a piece of data to a neural network The net predicts an output The net compares is guess to the actual correct
value (also presented to the network) If ANN guess is right, the net does nothing If ANN guess is wrong, net figures out how to
adjust some internal parameters so that it can make better prediction if it sees similar data again in future
Over time, the ANN begins to converge on a fairly accurate model of the process
IMS3001 – BUSINESS INTELLIGENCE SYSTEMS – SEM 1 , 2004 8
Artificial Neural Nets Artificial Neural Nets (ANNs)(ANNs)
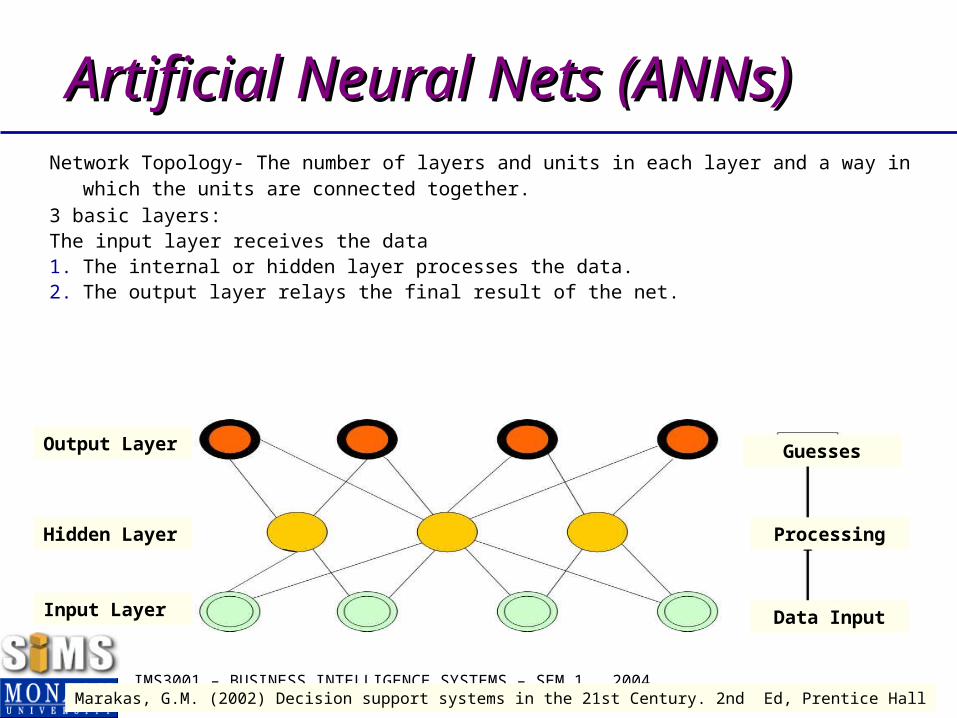
Network Topology- The number of layers and units in each layer and a way in which the units are connected together.
3 basic layers:The input layer receives the data1. The internal or hidden layer processes the data.2. The output layer relays the final result of the net.
Output Layer
Hidden Layer
Input Layer
Guesses
Processing
Data Input
Marakas, G.M. (2002) Decision support systems in the 21st Century. 2nd Ed, Prentice Hall
IMS3001 – BUSINESS INTELLIGENCE SYSTEMS – SEM 1 , 2004 9
Artificial Neural Nets Artificial Neural Nets (ANNs)(ANNs)
Marakas, G.M. (2002) Decision support systems in the 21st Century. 2nd Ed, Prentice Hall
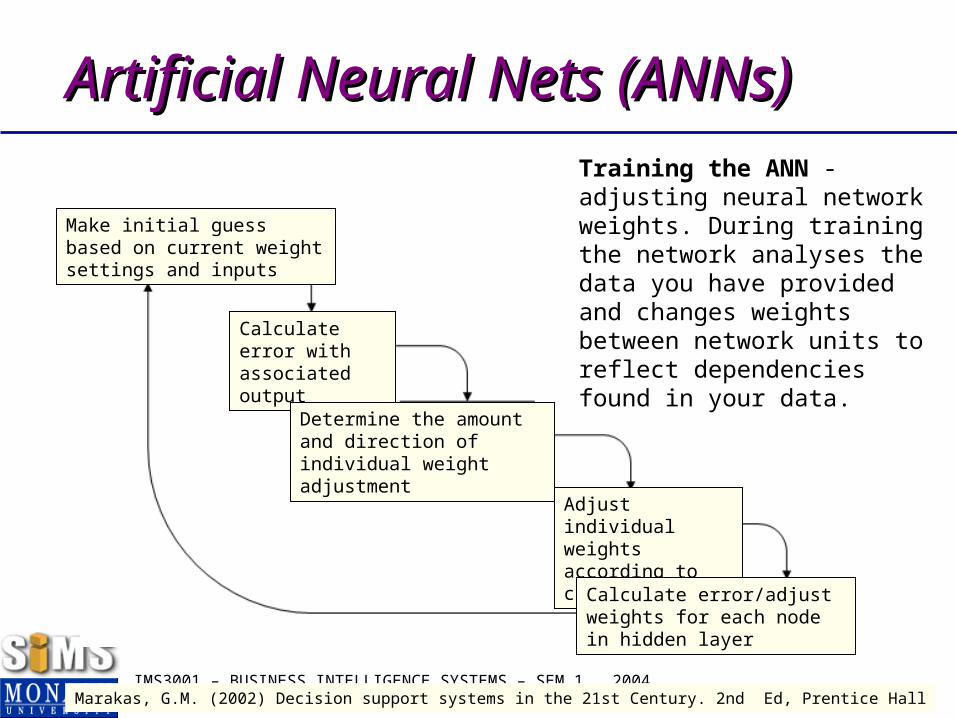
Make initial guess based on current weight settings and inputs
Calculate error with associated output
Determine the amount and direction of individual weight adjustment
Adjust individual weights according to calculations
Calculate error/adjust weights for each node in hidden layer
Training the ANN - adjusting neural network weights. During training the network analyses the data you have provided and changes weights between network units to reflect dependencies found in your data.
IMS3001 – BUSINESS INTELLIGENCE SYSTEMS – SEM 1 , 2004 10
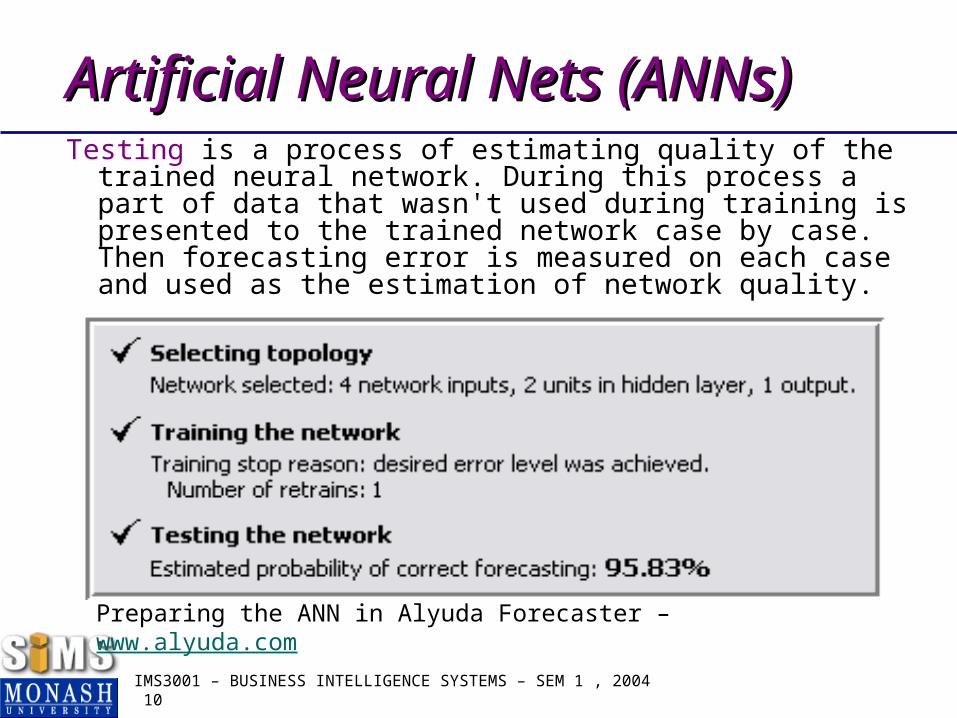
Artificial Neural Nets Artificial Neural Nets (ANNs)(ANNs)Testing is a process of estimating quality of the trained
neural network. During this process a part of data that wasn't used during training is presented to the trained network case by case. Then forecasting error is measured on each case and used as the estimation of network quality.
Preparing the ANN in Alyuda Forecaster – www.alyuda.com
IMS3001 – BUSINESS INTELLIGENCE SYSTEMS – SEM 1 , 2004 11
Artificial Neural Nets Artificial Neural Nets (ANNs)(ANNs) Effective in problems of image recognition Not suited well for, say, financial or serious
medical applications. highly intricate systems - include dozens of
neurons with a couple hundred connections between them
non-transparency of forecasting models represented by a trained neural network
knowledge reflected in terms of weights of a couple hundred intraneural connections cannot be analysed and interpreted by a human.
Despite of these difficulties neural networks are actively used (with varying success) in different financial applications in the majority of developed countries.
IMS3001 – BUSINESS INTELLIGENCE SYSTEMS – SEM 1 , 2004 12
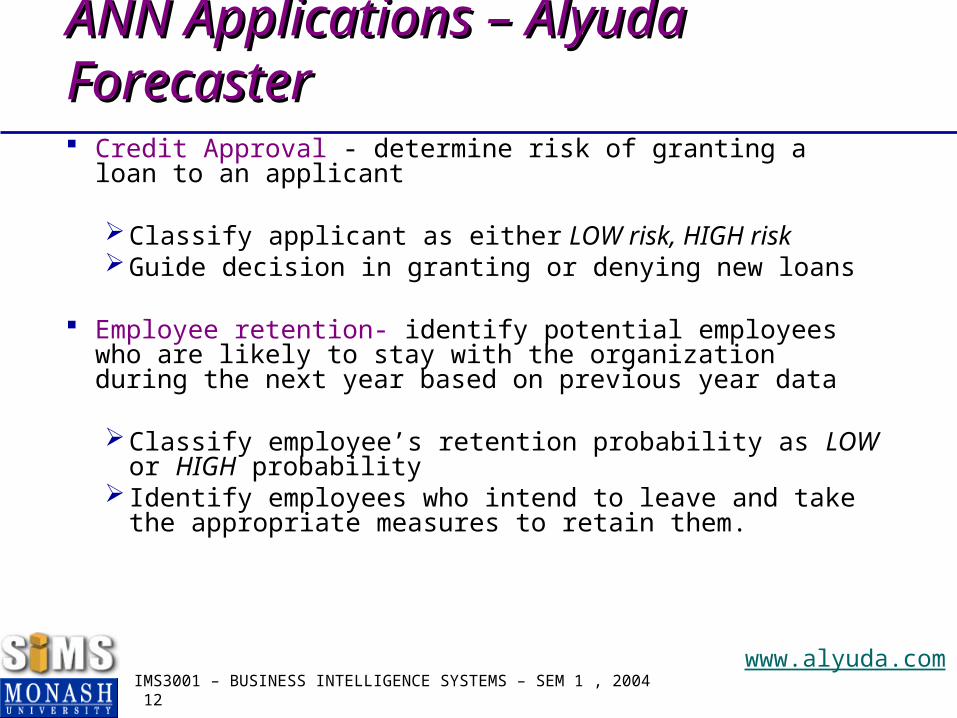
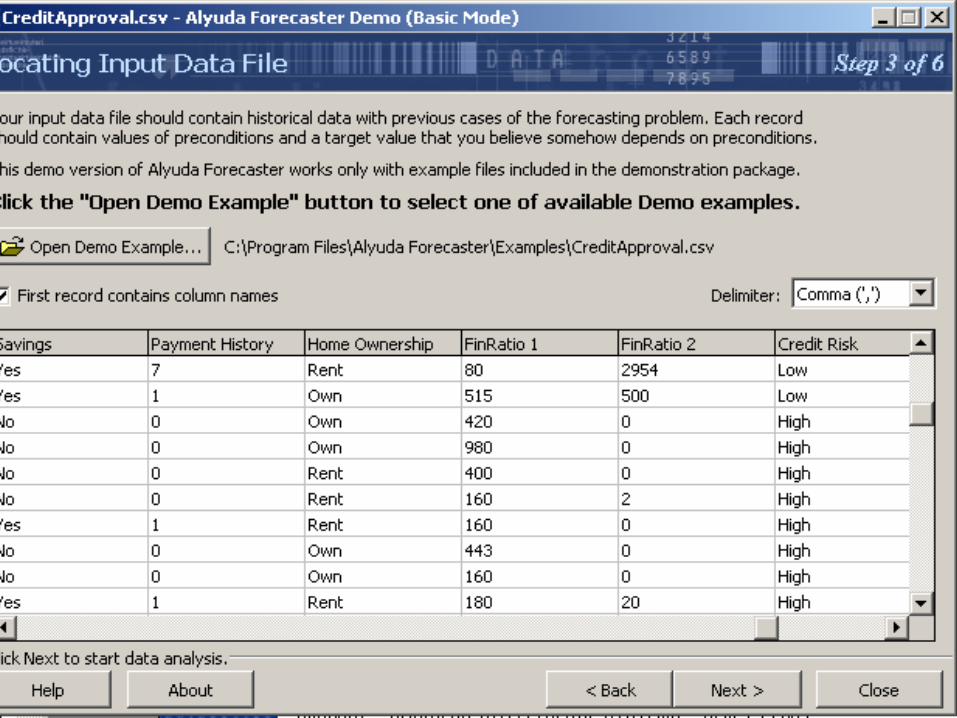
ANN Applications – Alyuda ANN Applications – Alyuda ForecasterForecaster Credit Approval - determine risk of granting a loan to
an applicant
Classify applicant as either LOW risk, HIGH riskGuide decision in granting or denying new loans
Employee retention- identify potential employees who are likely to stay with the organization during the next year based on previous year data
Classify employee’s retention probability as LOW or HIGH probability
Identify employees who intend to leave and take the appropriate measures to retain them.
www.alyuda.com
IMS3001 – BUSINESS INTELLIGENCE SYSTEMS – SEM 1 , 2004 13
ANN Applications – Alyuda ANN Applications – Alyuda ForecasterForecaster

IMS3001 – BUSINESS INTELLIGENCE SYSTEMS – SEM 1 , 2004 14
ANN Applications – Alyuda ANN Applications – Alyuda ForecasterForecaster Gas consumption - forecast gas consumption by
a power plant.
Sales forecasting - forecast weekly sales of a small restaurant chain using the historical data over 109 weeks period
Stock prediction - forecast the percentage of the Close price change for Chevron Corp 4 days in advance
www.alyuda.com
IMS3001 – BUSINESS INTELLIGENCE SYSTEMS – SEM 1 , 2004 15
Data Mining TechnologiesData Mining Technologies
Genetic Algorithms Recognise a good solution, spreads some of that
solution’s features into a population of competing solutions, and “breeds” good solutions
Powerful technique for solving various combinatorial or optimisation problems
Sample Genetic algorithm online demoshttp://math.hws.edu/xJava/GA/
IMS3001 – BUSINESS INTELLIGENCE SYSTEMS – SEM 1 , 2004 16
Genetic AlgorithmGenetic Algorithm First a population of possible solutions to a
problem are developed. Next, the better solutions are recombined with
each other to form some new solutions. Finally the new solutions are used to replace the
poorer of the original solutions and the process is repeated.
IMS3001 – BUSINESS INTELLIGENCE SYSTEMS – SEM 1 , 2004 17
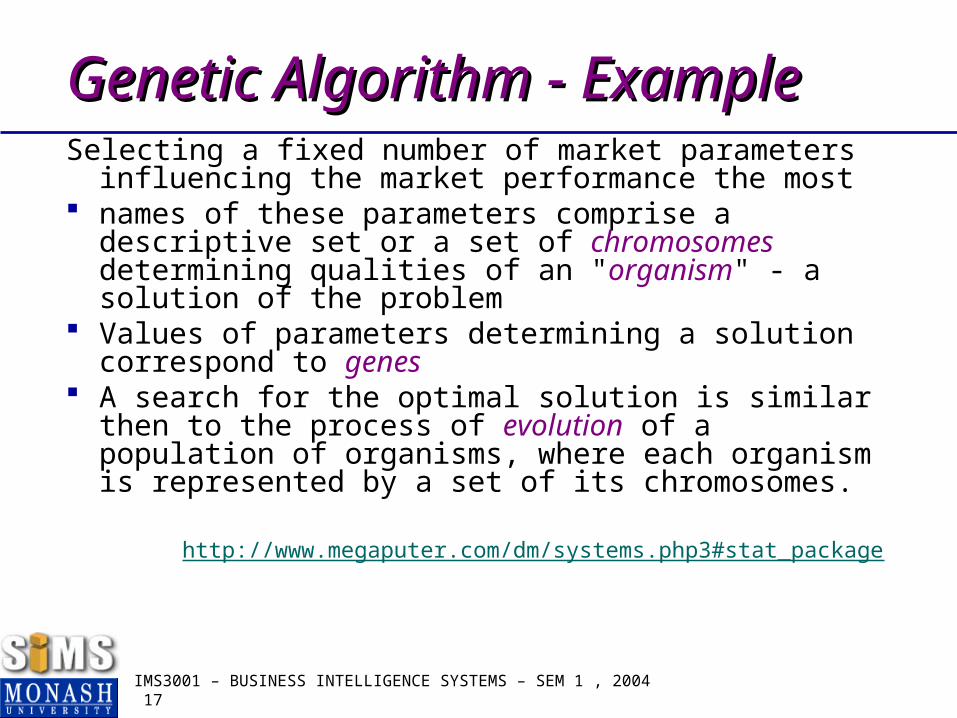
Genetic Algorithm - Genetic Algorithm - ExampleExampleSelecting a fixed number of market parameters
influencing the market performance the most names of these parameters comprise a
descriptive set or a set of chromosomes determining qualities of an "organism" - a solution of the problem
Values of parameters determining a solution correspond to genes
A search for the optimal solution is similar then to the process of evolution of a population of organisms, where each organism is represented by a set of its chromosomes.
http://www.megaputer.com/dm/systems.php3#stat_package
IMS3001 – BUSINESS INTELLIGENCE SYSTEMS – SEM 1 , 2004 18
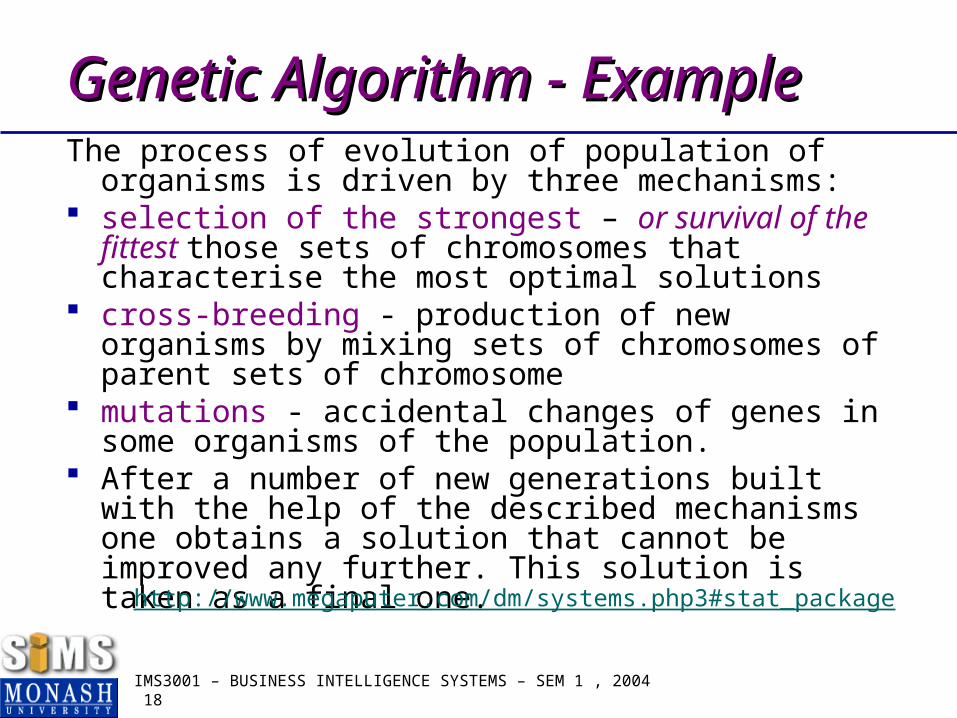
Genetic Algorithm - Genetic Algorithm - ExampleExampleThe process of evolution of population of
organisms is driven by three mechanisms: selection of the strongest – or survival of the
fittest those sets of chromosomes that characterise the most optimal solutions
cross-breeding - production of new organisms by mixing sets of chromosomes of parent sets of chromosome
mutations - accidental changes of genes in some organisms of the population.
After a number of new generations built with the help of the described mechanisms one obtains a solution that cannot be improved any further. This solution is taken as a final one.
http://www.megaputer.com/dm/systems.php3#stat_package
IMS3001 – BUSINESS INTELLIGENCE SYSTEMS – SEM 1 , 2004 19
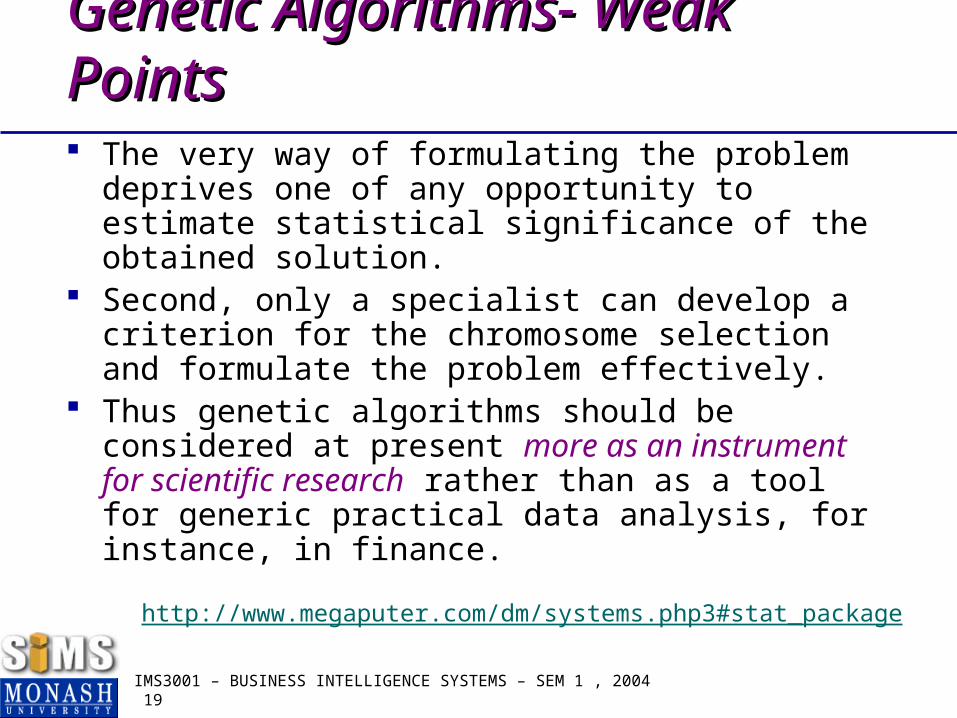
Genetic Algorithms- Weak Genetic Algorithms- Weak PointsPoints The very way of formulating the problem
deprives one of any opportunity to estimate statistical significance of the obtained solution.
Second, only a specialist can develop a criterion for the chromosome selection and formulate the problem effectively.
Thus genetic algorithms should be considered at present more as an instrument for scientific research rather than as a tool for generic practical data analysis, for instance, in finance.
http://www.megaputer.com/dm/systems.php3#stat_package
IMS3001 – BUSINESS INTELLIGENCE SYSTEMS – SEM 1 , 2004 20
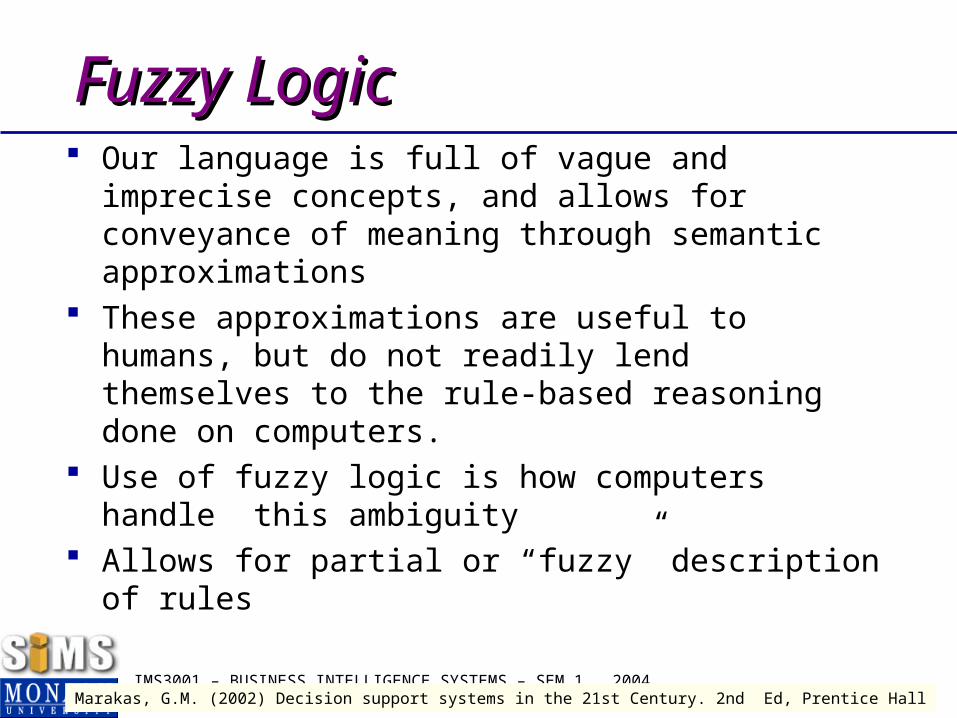
Fuzzy LogicFuzzy Logic Our language is full of vague and imprecise
concepts, and allows for conveyance of meaning through semantic approximations
These approximations are useful to humans, but do not readily lend themselves to the rule-based reasoning done on computers.
Use of fuzzy logic is how computers handle this ambiguity
Allows for partial or “fuzzy” description of rules
Marakas, G.M. (2002) Decision support systems in the 21st Century. 2nd Ed, Prentice Hall
IMS3001 – BUSINESS INTELLIGENCE SYSTEMS – SEM 1 , 2004 21
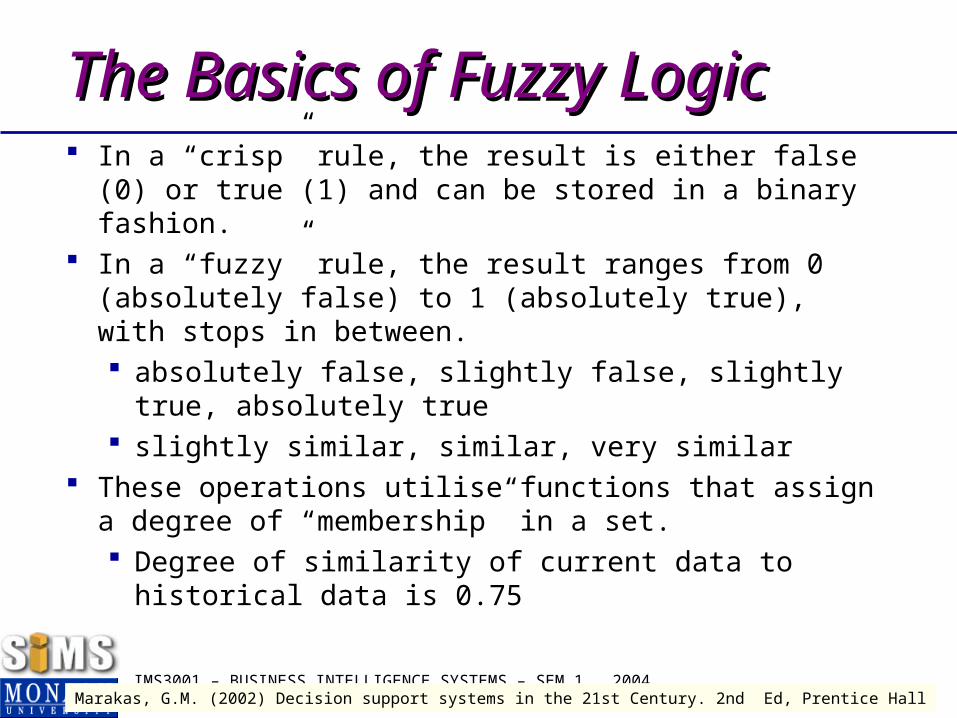
The Basics of Fuzzy LogicThe Basics of Fuzzy Logic In a “crisp” rule, the result is either false (0) or
true (1) and can be stored in a binary fashion. In a “fuzzy” rule, the result ranges from 0
(absolutely false) to 1 (absolutely true), with stops in between. absolutely false, slightly false, slightly true,
absolutely true slightly similar, similar, very similar
These operations utilise functions that assign a degree of “membership” in a set. Degree of similarity of current data to
historical data is 0.75
Marakas, G.M. (2002) Decision support systems in the 21st Century. 2nd Ed, Prentice Hall
IMS3001 – BUSINESS INTELLIGENCE SYSTEMS – SEM 1 , 2004 22
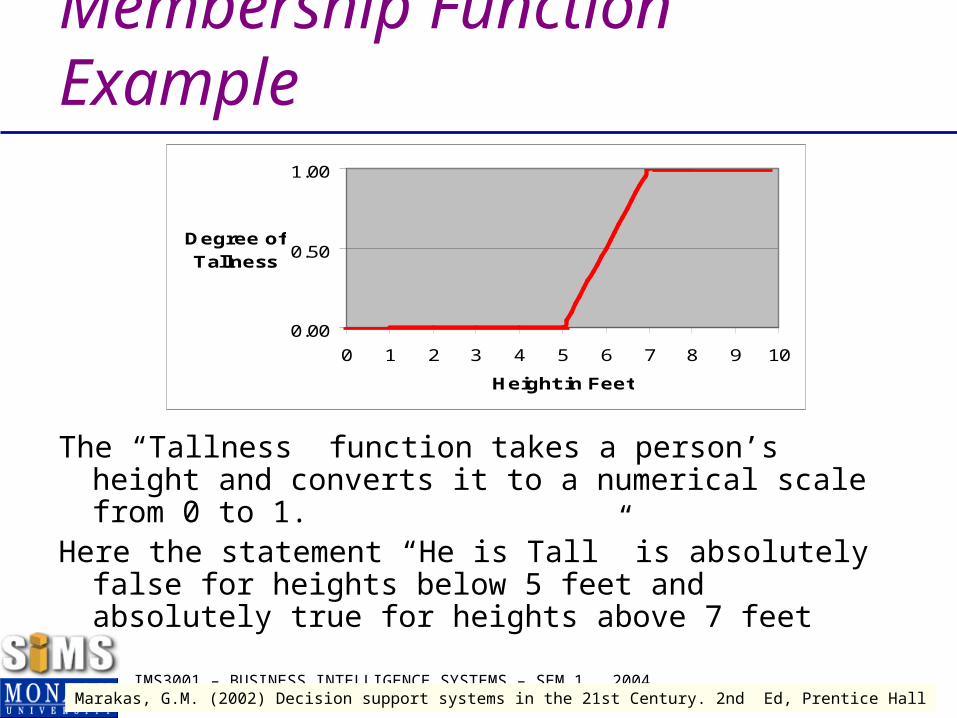
Membership Function Example
The “Tallness” function takes a person’s height and converts it to a numerical scale from 0 to 1.
Here the statement “He is Tall” is absolutely false for heights below 5 feet and absolutely true for heights above 7 feet
Marakas, G.M. (2002) Decision support systems in the 21st Century. 2nd Ed, Prentice Hall
0.00
0.50
1.00
0 1 2 3 4 5 6 7 8 9 10
Height in Feet
Degree of
Tallness
IMS3001 – BUSINESS INTELLIGENCE SYSTEMS – SEM 1 , 2004 23
Inferencing using Fuzzy RulesExample “Well if you’ve got a high margin, price
sensitive product, promoting that product via ads, displays, etc. is likely to have a high impact on sales volume. If the volume impact is high, it’s a good candidate for allocation of promotion dollars.
But you also want to promote products more heavily when they’re relatively new in order to increase market awareness and to establish market share…”
Dhar, V. and Stein, R. (1997)
IMS3001 – BUSINESS INTELLIGENCE SYSTEMS – SEM 1 , 2004 24
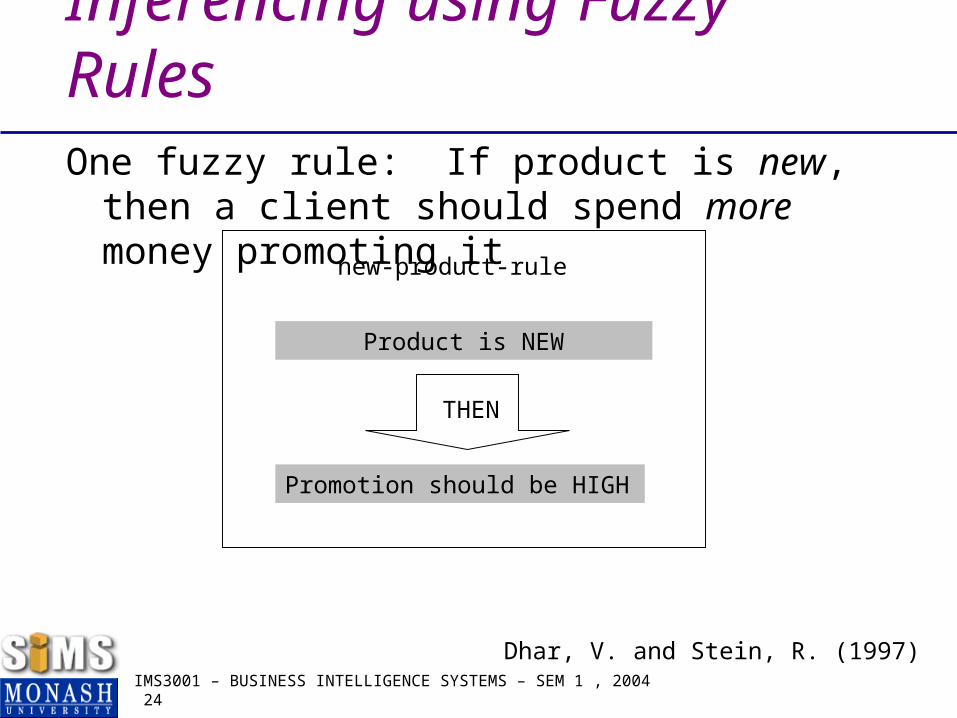
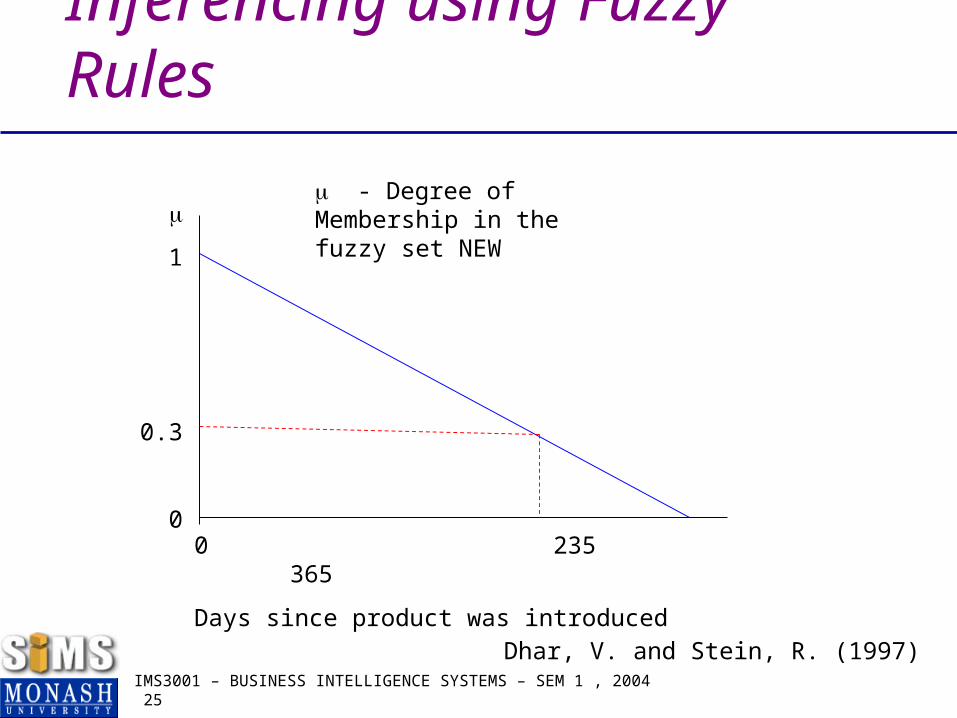
Inferencing using Fuzzy RulesOne fuzzy rule: If product is new, then a
client should spend more money promoting it new-product-rule
Product is NEW
Promotion should be HIGH
THEN
Dhar, V. and Stein, R. (1997)
IMS3001 – BUSINESS INTELLIGENCE SYSTEMS – SEM 1 , 2004 25
Inferencing using Fuzzy Rules
1
0.3
00 235 365
Days since product was introduced
- Degree of Membership in the fuzzy set NEW
Dhar, V. and Stein, R. (1997)
IMS3001 – BUSINESS INTELLIGENCE SYSTEMS – SEM 1 , 2004 26
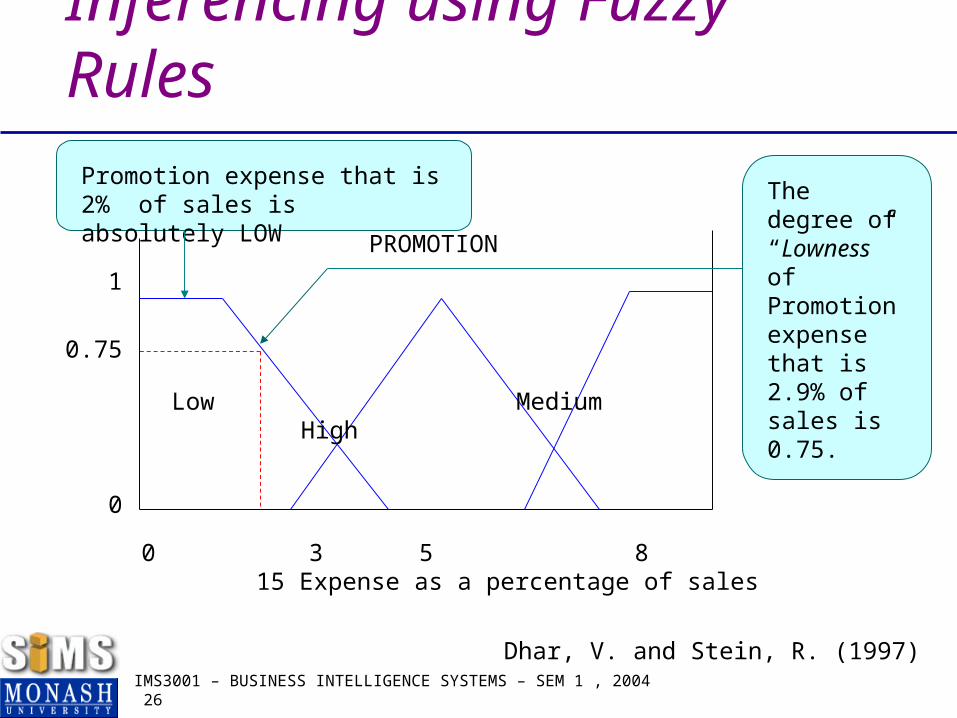
Inferencing using Fuzzy Rules
Low Medium High
0 3 5 8 15 Expense as a percentage of sales
1
0.75
0
PROMOTION
Promotion expense that is 2% of sales is absolutely LOW The
degree of “Lowness” of Promotion expense that is 2.9% of sales is 0.75.
Dhar, V. and Stein, R. (1997)
IMS3001 – BUSINESS INTELLIGENCE SYSTEMS – SEM 1 , 2004 27
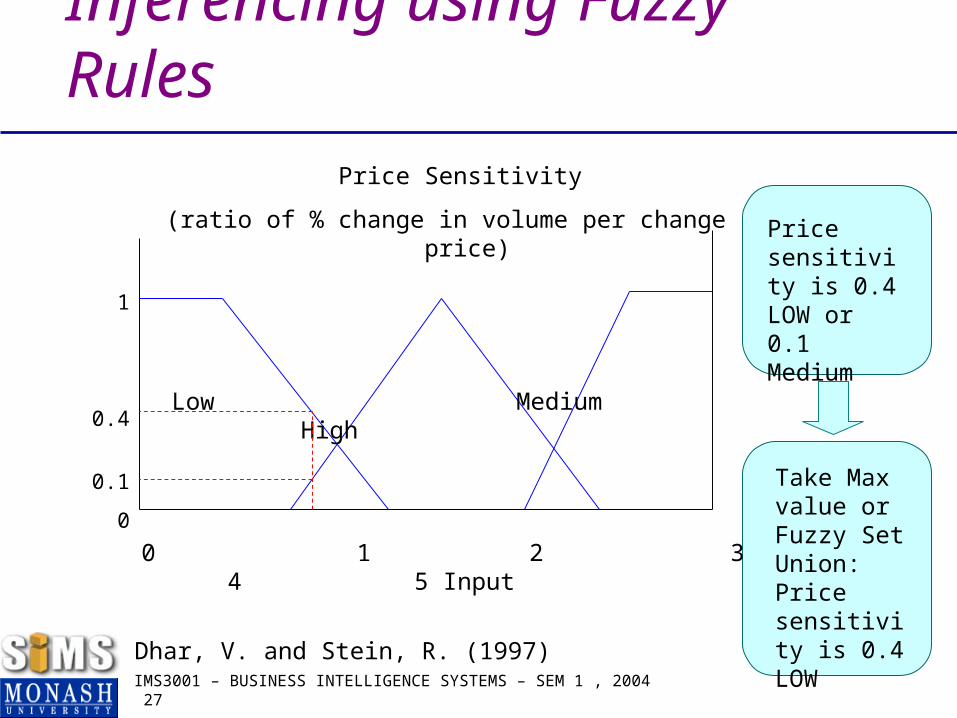
Inferencing using Fuzzy Rules
Low Medium High
0 1 2 3 4 5 Input
1
0.4
0.1
0
Price Sensitivity
(ratio of % change in volume per change in price)Price sensitivity is 0.4 LOW or 0.1 Medium
Take Max value or Fuzzy Set Union: Price sensitivity is 0.4 LOWDhar, V. and Stein, R. (1997)
IMS3001 – BUSINESS INTELLIGENCE SYSTEMS – SEM 1 , 2004 28
Inferencing using Fuzzy RulesOther fuzzy rules: If product is NEW, then a client should spend
MORE money promoting it If the price sensitivity of product is LOW, then
promotion should be LOW If the price sensitivity of product is MEDIUM,
then promotion should be MEDIUM If the price sensitivity of product is HIGH, then
promotion should be HIGH
Dhar, V. and Stein, R. (1997)
IMS3001 – BUSINESS INTELLIGENCE SYSTEMS – SEM 1 , 2004 29
Fuzzy SystemsFuzzy SystemsSome Advantages Great in dealing with qualitative data, as well as
object attribute Offers an attractive trade-off between accuracy
and compactness – express relationships in terms of simple rules
Not computationally expensive – compared to “crisp” rule-based systems
IMS3001 – BUSINESS INTELLIGENCE SYSTEMS – SEM 1 , 2004 30
Fuzzy SystemsFuzzy SystemsSome Disadvantages Saturation of fuzzy sets – fuzzy sets get so full
of inferences that the consequent fuzzy regions are overloaded > system loses the information provided by the fuzzy rules
Needs domain expertise to setup fuzzy sets Only provides approximation to human
reasoning
IMS3001 – BUSINESS INTELLIGENCE SYSTEMS – SEM 1 , 2004 31
Notes on Decision TreesNotes on Decision TreesCART – Classification and Regression Trees Most common decision tree, statistical analysis
data mining tool automatically searches for and finds high
performance classification and prediction key elements are a set of rules for:
splitting each node in a tree; deciding when a tree is complete; and assigning each terminal node to a class
outcome (or predicted value for regression) More info and software demo on
http://www.salford-systems.com/
IMS3001 – BUSINESS INTELLIGENCE SYSTEMS – SEM 1 , 2004 32
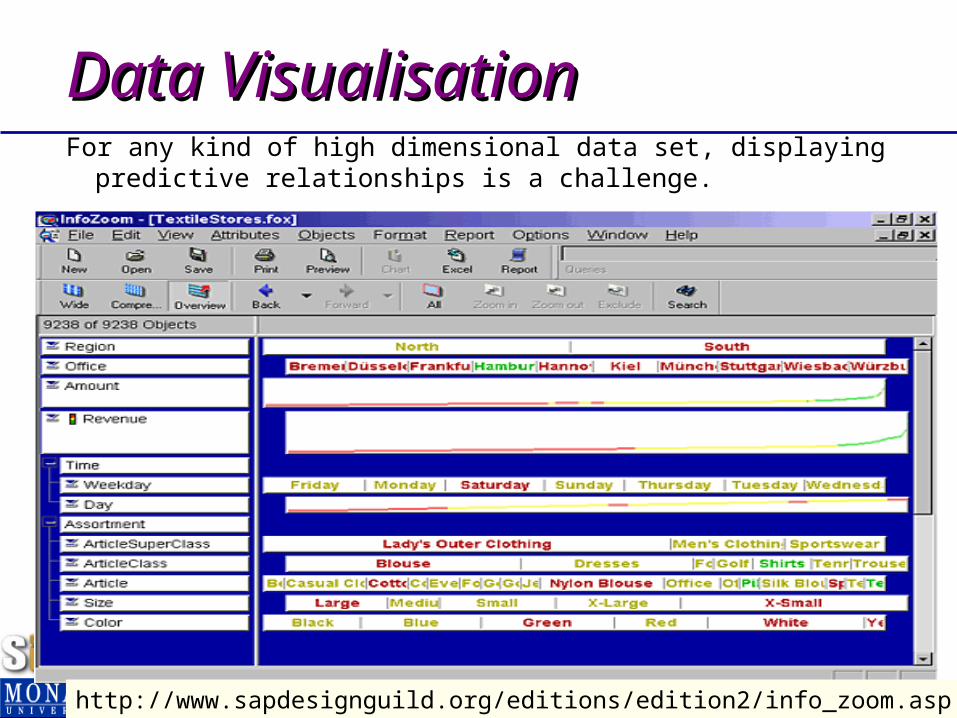
Data VisualisationData VisualisationFor any kind of high dimensional data set,
displaying predictive relationships is a challenge.
http://www.sapdesignguild.org/editions/edition2/info_zoom.asp
IMS3001 – BUSINESS INTELLIGENCE SYSTEMS – SEM 1 , 2004 33
Human Visual Perception and Human Visual Perception and Data VisualisationData Visualisation Data visualisation is so powerful because the
human visual cortex converts objects into information so quickly.
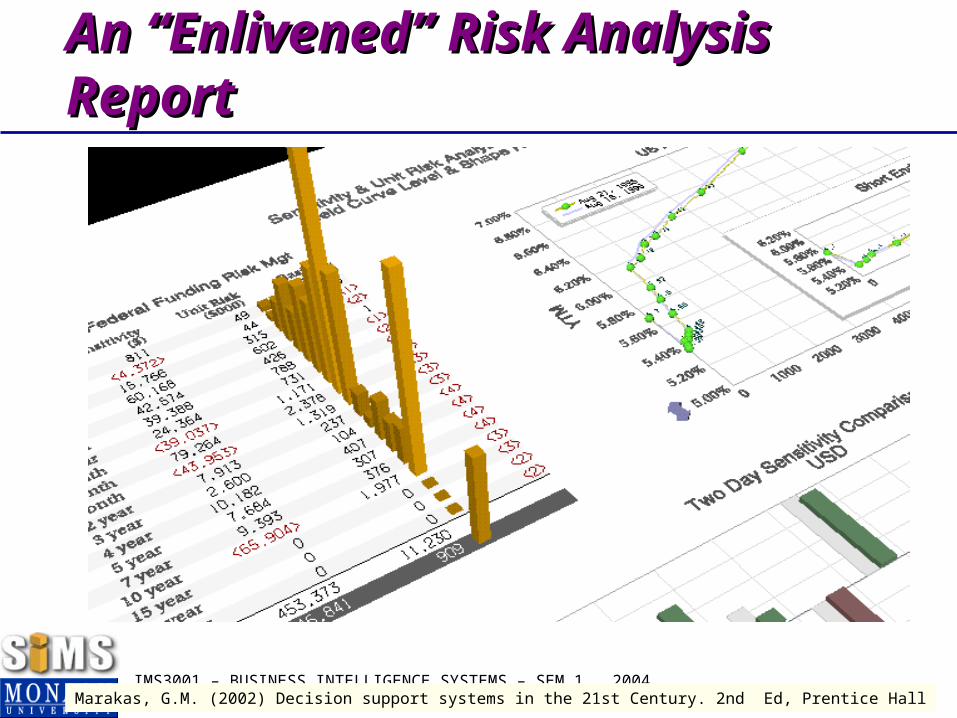
The next three slides show (1) usage of global private networks, (2) flow through natural gas pipelines, and (3) a risk analysis report that permits the user to draw an interactive yield curve.
All three use height or shading to add additional dimensions to the figure.
Marakas, G.M. (2002) Decision support systems in the 21st Century. 2nd Ed, Prentice Hall
IMS3001 – BUSINESS INTELLIGENCE SYSTEMS – SEM 1 , 2004 34
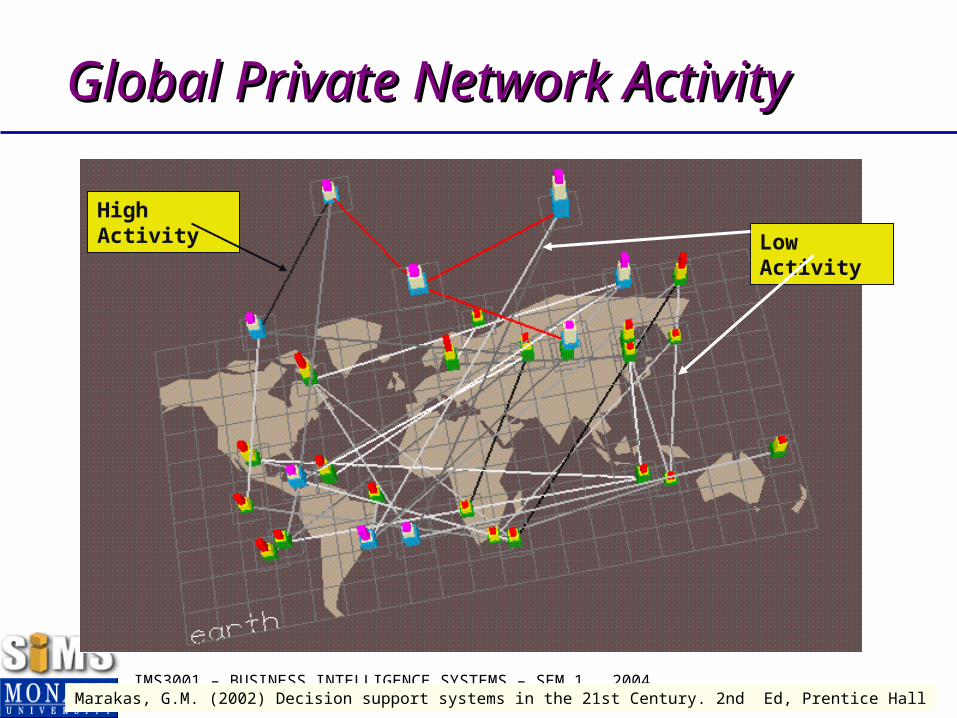
Global Private Network Global Private Network ActivityActivity
High Activity
Low Activity
Marakas, G.M. (2002) Decision support systems in the 21st Century. 2nd Ed, Prentice Hall
IMS3001 – BUSINESS INTELLIGENCE SYSTEMS – SEM 1 , 2004 35
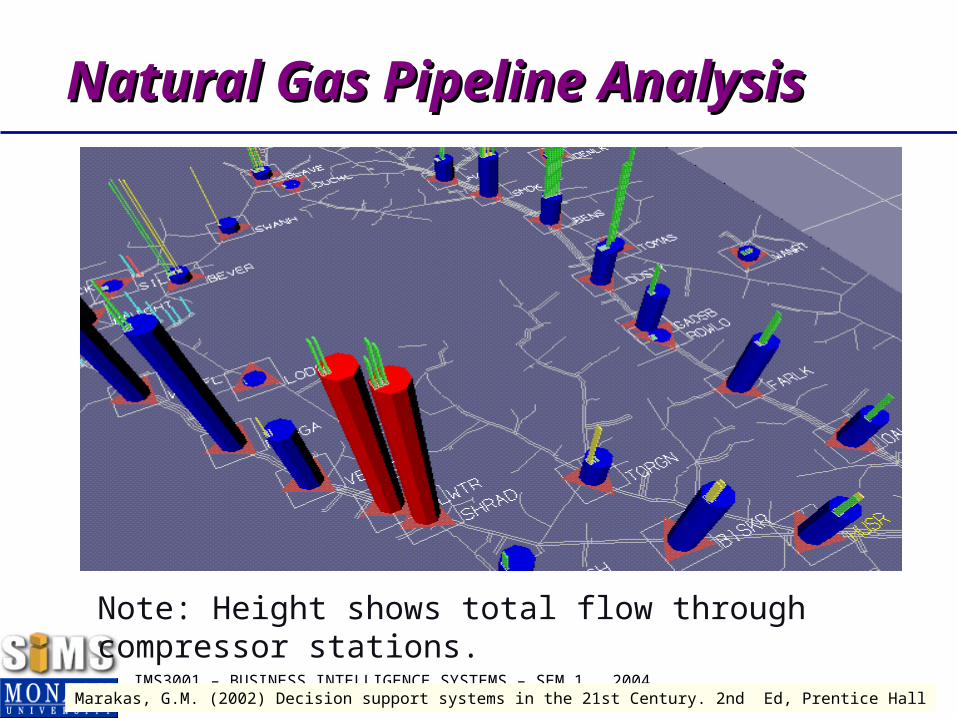
Natural Gas Pipeline Natural Gas Pipeline AnalysisAnalysis
Note: Height shows total flow through compressor stations.
Marakas, G.M. (2002) Decision support systems in the 21st Century. 2nd Ed, Prentice Hall
IMS3001 – BUSINESS INTELLIGENCE SYSTEMS – SEM 1 , 2004 36
An “Enlivened” Risk An “Enlivened” Risk Analysis ReportAnalysis Report
Marakas, G.M. (2002) Decision support systems in the 21st Century. 2nd Ed, Prentice Hall
IMS3001 – BUSINESS INTELLIGENCE SYSTEMS – SEM 1 , 2004 37
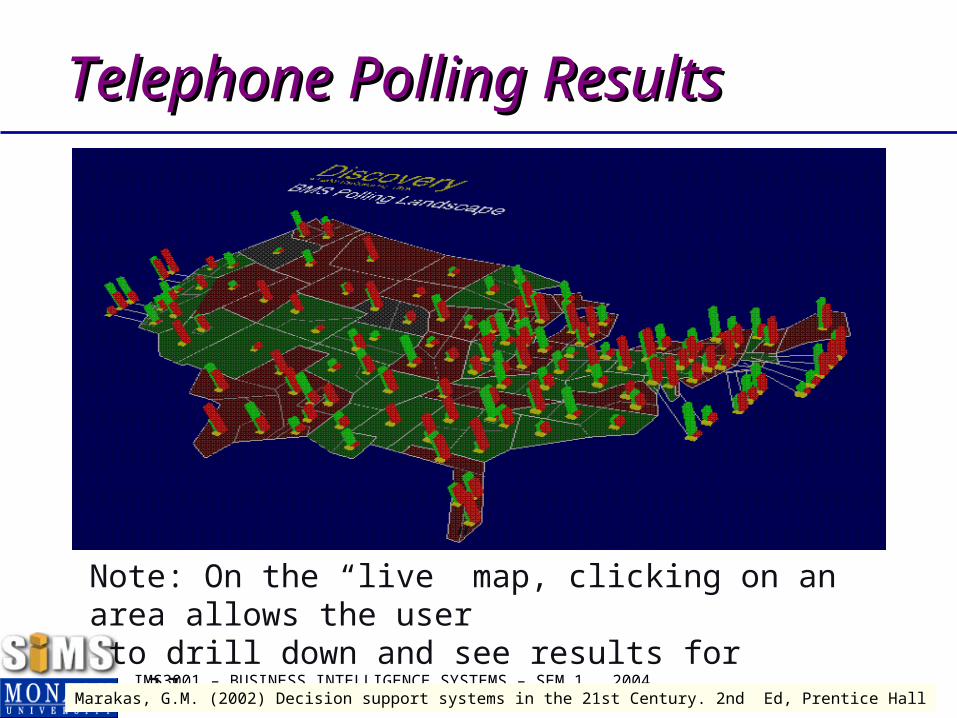
Telephone Polling ResultsTelephone Polling Results
Note: On the “live” map, clicking on an area allows the user to drill down and see results for smaller areas.
Marakas, G.M. (2002) Decision support systems in the 21st Century. 2nd Ed, Prentice Hall
IMS3001 – BUSINESS INTELLIGENCE SYSTEMS – SEM 1 , 2004 38
ReferencesReferencesDhar, V. and Stein, R. (1997) Intelligent decision
Support Methods: the Science of Knowledge Work, Prentice Hall.
Dhar, V. and Stein, R. (1997) Seven methods for transforming corporate data into business intelligence.
Marakas, G.M. (2002) Decision support systems in the 21st Century. 2nd Ed, Prentice Hall (or other editions)
Power, D. (2002) Decision Support Systems: Concepts and Resources for Managers, Quorum Books.
***********Good Online resource on fuzzy sets and operations
http://www.doc.ic.ac.uk/~nd/surprise_96/journal/vol4/sbaa/report.fuzzysets.html
IMS3001 – BUSINESS INTELLIGENCE SYSTEMS – SEM 1 , 2004 39
Questions?
[email protected] of Information Management and
Systems, Monash UniversityT1.28, T Block, Caulfield Campus
9903 2735