Embed Size (px)
Citation preview
In vivo Positron Emission Tomography Imaging Demonstrates Diminished
Microglial Activation after Fingolimod Treatment in an Animal Model of Multiple
Sclerosis
Laura Airas1, Alex M. Dickens2, Petri Elo2, Päivi Marjamäki2, Jarkko Johansson3, Olli
Eskola4, Paul A. Jones5, William Trigg5, Olof Solin4, Merja Haaparanta-Solin2, Daniel C.
Anthony6, Juha Rinne3
1Division of Clinical Neurosciences, Turku University Hospital, Finland; 2Turku PET
Centre, Medicity/Preclinical Imaging, University of Turku, Turku, Finland; 3Turku PET
Centre, Clinical Neurology, Turku, Finland; 4Turku PET Centre, Radiopharmaceutical
Chemistry laboratory, University of Turku, Turku, Finland; 5GE Healthcare Ltd. The
Grove Centre, Amersham, HP7 9LL, UK 6Department of Pharmacology, University of
Oxford, Oxford, UK.
Corresponding author: Dr. Laura Airas
Corresponding and first author address: Division of Clinical Neurosciences, Turku
University Hospital, Kiinamyllynkatu 4-8, 20521 Turku, Finland
Phone: +358503294321, and FAX:+35823132285
Email: [email protected]
Word Count: 5044
Financial support: Finnish Academy, Biocentre Finland, GE Healthcare, ltd. and
European Union's Seventh Framework Programme (FP7/2007-2013) under grant
agreement n°HEALTH-F2-2011-278850 (INMiND).
Running Title: Fingolimod-treatment reduces TSPO expression
Journal of Nuclear Medicine, published on January 8, 2015 as doi:10.2967/jnumed.114.149955by on November 1, 2018. For personal use only. jnm.snmjournals.org Downloaded from
2
ABSTRACT (318/350 words)
There is a great need for the monitoring of microglial activation surrounding multiple
sclerosis lesions as this is thought to be driving the widespread neuronal damage.
Recently, ‘second generation’ positron emission tomography (PET) radioligands have
been developed which can reveal the extent of microglial activation by quantifying the
increased expression of the 18 kDa translocator (TSPO) protein. Here, we investigate
whether PET imaging can be used to demonstrate the reduction in microglial activation
surrounding a chronic focal multiple sclerosis (MS)-like lesion following treatment with
fingolimod, an established MS therapy.
Methods: Chronic focal experimental autoimmune encephalitis (EAE)-like lesions were
induced in Lewis rats (n=24) via stereotaxic intrastriatal injection of heat-killed bacillus
Calmette-Guérin (BCG) and subsequent activation using an intradermal injection of BCG
in complete Freund’s adjuvant. This results in a delayed type hypersensitivity (DTH)-like
EAE-lesion. The extent of neuroinflammation surrounding the lesion was measured using
18F-GE180 as a PET radioligand. The imaging was performed before and after treatment
with fingolimod (0.3 mg/kg/day po, 28 days) or vehicle as a control. In addition to this,
autoradiography and immunohistochemistry experiments were performed to verify the in
vivo results.
Results: The chronic DTH-EAE lesion led to increased ligand binding in the ipsilateral
compared to contralateral hemisphere when PET imaging was performed with the TSPO-
binding radioligand 18F-GE180. Treatment with fingolimod led to highly significant
reduction in the binding potential, which could be demonstrated using both in vivo and ex
by on November 1, 2018. For personal use only. jnm.snmjournals.org Downloaded from
3
vivo imaging (fingolimod vs. vehicle treatment, p<0.0001). The area of increased 18F-
GE180 signal mapped closely to the area of activated microglial cells detected by
immunohistochemistry.
Conclusions: PET-imaging, unlike magnetic resonance imaging (MRI), can be used to
visualise the microglial activation surrounding a chronic DTH-EAE lesion. Importantly,
treatment effect of fingolimod can be monitored in vivo by measuring the degree of
microglial activation surrounding the chronic DTH-EAE lesion. This work gives promise
for introduction of new outcome measures applicable in treatment studies of progressive
MS.
Key Words: Multiple sclerosis, PET imaging, TSPO, fingolimod, neuroinflammation
by on November 1, 2018. For personal use only. jnm.snmjournals.org Downloaded from
4
INTRODUCTION
Endpoints for development of new therapies for multiple sclerosis (MS) have
conventionally been suppression of relapses, reduction in the number of gadolinium-
enhancing or new or enlarging T2 lesions in magnetic resonance imaging (MRI), and
evaluation of disability using the expanded disability status scale (1). However, it is
increasingly clear that evaluation of the diffuse inflammation associated with progressive
MS, and follow-up of the development of neurodegeneration need more accurate and
sensitive imaging methods than can be achieved using MRI (2). Recent work suggests
that neuronal damage in MS brain is associated with microglial activation, and is more
widespread than previously envisaged. In particular, axonal damage occurs not only in
MS lesions, but also within the normal appearing white matter, and spatially correlates to
regions of activated microglia (3). In addition, it is clear that current MRI techniques are
insensitive to the detection of pathologies associated with progression of MS (4). There is
thus urgent need to develop novel imaging methods for the detection and monitoring of
these processes. Methods that can accurately report on extra-lesional pathological
processes may then be used to establish what therapies, if any, are able to modify this
more widespread, extralesional damage (5).
It has been long recognised that microglial activation is associated with the increased
expression of the 18kDa translocator protein (TSPO), previously known as the peripheral
benzodiazepine receptor (5). Thus an increase in expression of TSPO has been proposed
as a surrogate marker for neuroinflammation (6). The increase in expression of TSPO can
be visualised using positron emission tomography (PET) and an appropriate radiotracer
such as 11C-PK11195 (7-9). Recent years have seen the development of so-called
by on November 1, 2018. For personal use only. jnm.snmjournals.org Downloaded from
5
second-generation TSPO-radioligands, which have better signal-to-noise ratio, and other
more favourable physicochemical characteristics compared to the 11C-PK11195 ligand
(10). One such radioligand in development is 18F-GE180 (11, 12).
Fingolimod (FTY720, Gilenya®) was the first oral therapy to be approved for treatment
of MS (13). Fingolimod is phosphorylated in vivo to fingolimod-phosphate (fingolimod-
P), which is a broad Sphingosine 1-Phosphate receptor (S1PR) antagonist and binds to all
S1PR apart from the S1P2R (14). The primary mechanism of action of fingolimod in MS
therapy is thought to be that by modulating the S1P1 receptor expression on T cells, it
blocks the T-cells from exiting lymph nodes and thus reduces the T-cell mediated
autoimmune reaction in the central nervous system (CNS) (15). However, fingolimod
also readily enters the CNS where it can bind to neurons, oligodendrocyte progenitor
cells, astrocytes and microglia (13, 16). It has been demonstrated in vitro that fingolimod
can suppress the activation of microglia (17). The primary aim of this study was to
evaluate whether fingolimod reduces microglial activation in an MS animal model when
administered to the animals, and whether 18F-GE180 can be used to monitor the impact of
treatment on microglial activation in vivo. To study this, we used a delayed type
hypersensitivity (DTH) model of a pattern I type MS lesion characterized by a T-cell and
macrophage-dominated lesion (18, 19). Using this animal model we aimed to investigate
the microglial activation within the lesion area, and in the area surrounding the lesion.
The formation of stratified lesions in terms of spatial distribution and kinetics
distinguishes this model from other types of experimental autoimmune encephalomyelitis
(EAE), where lesion presentation is random and variable and hence not quantifiable (20).
Regarding lesion pathology, the DTH-lesion closely resembles lesions seen in MS,
by on November 1, 2018. For personal use only. jnm.snmjournals.org Downloaded from
6
including blood-brain-barrier (BBB) breakdown at the height of the disease,
demyelination, T-cell and macrophage infiltration, and widespread microglial activation
(18).
MATERIALS AND METHODS
Animals
All animal experiments were carried out with the required ethical approval from the
Southern Finland ethics board, application number ESAVI/6360/04.10.03/2011. Male
Lewis rats (50-100g, n=18) were obtained from Charles River (Germany) and allowed to
acclimatise for one week prior to the start of any experiments. All animals were housed in
accordance with the Amsterdam protocol for animal experiments (21), food and water
was available ad libitum.
Intrastriatal Injection of Bacillus Calmette-Guérin (BCG)
Prior to stereotaxic surgery the animals were anaesthetised using isoflurane (Baxter
Medical AB, 4%) in air. Anaesthesia was maintained with 2.5% isoflurane and body
temperature was maintained using a heating blanket. The rats were placed onto a
stereotaxic frame (Kopf Instruments, US) and the skull was exposed. The brain of the
animal was exposed via a hole which was drilled though the skull. Heat killed BCG
(1x10⁵ cells in 2 μL of PBS) was injected into the left striatum using a Hamilton syringe
(10 μL, Sigma Aldrich). The acute inflammatory response to the intracranial injection of
BCG resolves rapidly. The BCG remains sequestered behind the BBB and will escape
recognition by the immune system (22).
by on November 1, 2018. For personal use only. jnm.snmjournals.org Downloaded from
7
Activation of the Lesion
28 days following the intracerebral BCG injection the lesions were activated by an
intradermal injection of BCG (1.5 mg, Difco) in an emulsion of complete Freud’s
adjuvant (100 μL, Sigma Aldrich, USA) mixed with phosphate-buffered saline (PBS; 100
μL). This peripheral sensitization of the immune system provokes an immune cell-
mediated attack towards the intracranial BCG deposit, resulting in the formation of focal
DTH lesions and bystander damage in the CNS (22).
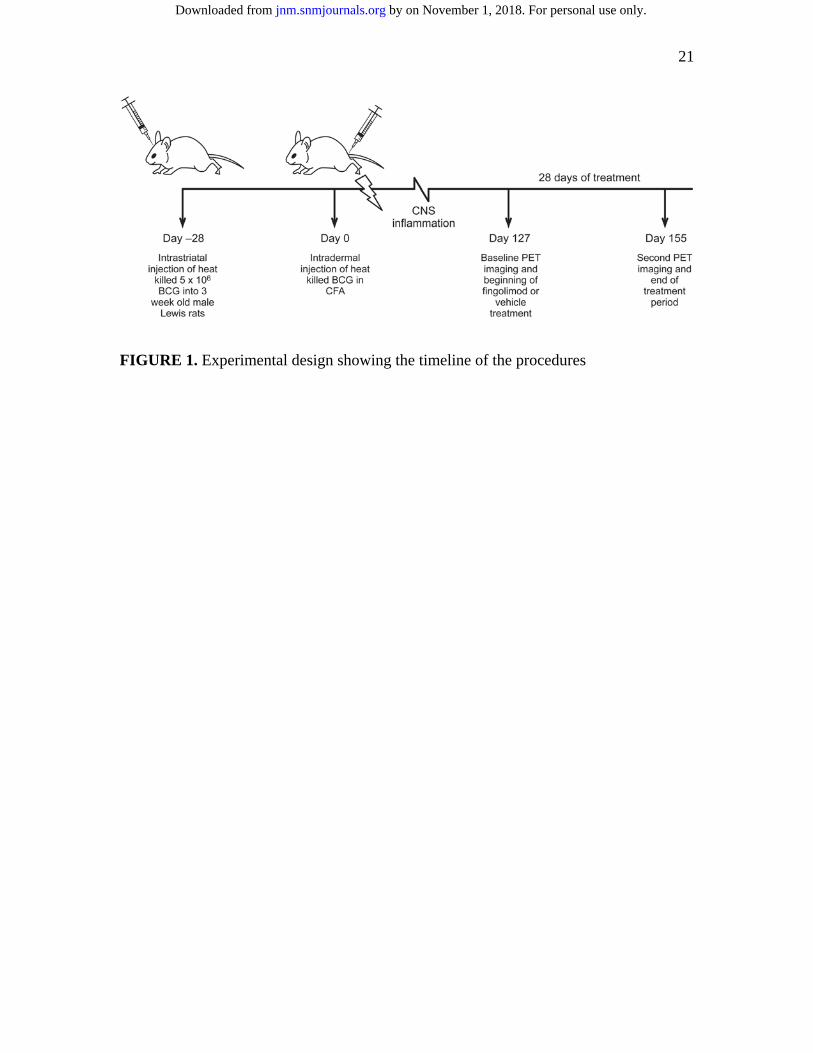
Experimental Design
After the peripheral activation of the lesion, the DTH-EAE lesions were allowed to
develop until day 127 to generate large chronic lesions and the animals were then treated
for 28 days with either fingolimod (n=7) or vehicle (n=7; Figure 1). The fingolimod
treatment was given daily (0.3 mg/kg in 0.5mL of water). Control group was given water
(0.5 mL) as a vehicle control. The animals were dosed via oral gavage to ensure accurate
dosing. In this model, the acute inflammation subsides after day 20 of activation of the
lesion, and the BBB damage subsides (23). Thus, at day 127 the lesion clearly represents
a well-developed chronic MS-lesion. PET imaging was performed immediately before
initiation of treatment and at the end of the treatment period.
Radiotracer Production
18F-GE180 was synthesised using a previously published method (12). Briefly, [18F]F-
was generated by proton irradiation of 18O-enriched H2O (97% enrichment). After
suitable workup the [18F]F-anion was then reacted with the precursor molecule (GE
Healthcare, Oslo, Norway) resulting in the formation of 18F-GE180. Finally, the tracer
by on November 1, 2018. For personal use only. jnm.snmjournals.org Downloaded from
8
was purified with semi-preparative high performance liquid chromatography and
formulated for injection (12).
In-vivo Imaging
In vivo imaging was performed using an Inveon multimodality PET/computer
tomography (CT; Siemens Medical Solutions, USA) small animal scanner with 1.2 mm3
resolution. The device generates images with 159 transaxial slices with a field of view
with a 10 cm transaxial field of view and a 12.7 cm axial field of view. A CT scan was
performed in order to correct for signal attenuation in the PET scan and provide
anatomical references. Emission scans (40 min) were acquired for these studies. The data
was acquired in list mode with an emission window from 350 to 650 MeV. The scans
were initiated immediately after the intravenous injection of 18F-GE180. For the baseline
scan, the amount of radioactivity given to animals in the control group was 49.0±3.1
MBq (mean±SD), and in the fingolimod-treated group 46.5±6.3 MBq. In the second scan,
the amounts were 46.6±5.2 and 45.7±8.6 MBq, respectively.
Digital Autoradiography
Rats were killed for autoradiography analysis (n = 3) following the 40 minute in vivo
PET imaging. The animals were killed 45 minutes post tracer injection, the anaesthetic
was increased to a terminal level (5% in air), and the thoracic cavity was opened. Blood
was collected via a cardiac puncture and the animals were transcardially perfused with
heparinised saline (20 mL). The brains were removed, frozen and sectioned (20 μm) in a
cryostat (Leica, Germany). Coronal sections were taken from different brain regions
(olfactory bulbs, striatum, cerebellum) and exposed to a phosphor imaging plate (Fuji
by on November 1, 2018. For personal use only. jnm.snmjournals.org Downloaded from
9
Imaging Plate BAS-TR2025, Fuji Photo Film Co., Ltd., Japan) for a period of two half-
lives of the radiotracer (220 min). The plates were then read in a phosphor imaging plate
reader (BAS-5000, Fuji, Japan; 25 mm2 resolution). Finally, the sections were frozen.
Regions of interest (ROI) were drawn in the left and right striatal and cortical areas on the
images obtained from the autoradiography. The digital autoradiography images were
analyzed for count densities (photo-stimulated luminescence per unit area, PSL/mm2)
with a computerized image analysis program (Aida 2D densitometry program, Raytest
Isotopenmessgeräte GmbH, Straubenhardt, Germany). ROI were drawn over the left and
right hemisphere at the level of the striatum, and cerebellum. In order to quantify the
binding potential of the radioligand the following calculation was performed:
Bnd = (ROI(Lesion)-ROI(Contralateral))/ROI(Contralateral)
This was then averaged across the whole striatum to get an overall binding ratio for each
injected animal. This binding potential was then normalised to the total lesion volume
estimated from the cresyl staining (see below).
The 3D surface plots were generated in Image j, using the interactive 3D surface plot
add-in.
In addition to the sections used in the autoradiography some sections were directly cut
from the striatum and frozen for immunohistochemistry analysis. The fresh sections were
post fixed with periodate-lysine-paraformaldehyde as previously described (24).
Endogenous peroxide activity was quenched by placing the sections in a 1% H2O2
solution in MeOH for 20 minutes. The sections were then incubated with horse serum for
one hour prior to the addition of the primary antibody (polyclonal goat anti-IBA-1,
by on November 1, 2018. For personal use only. jnm.snmjournals.org Downloaded from
10
Abcam (Cambridge, UK)) for overnight at 4 ˚C. The sections were then incubated with a
biotinylated secondary antibody (Vector labs, CA, USA). The signal was amplified using
avidin biotin system, (ABC kit, Vector Labs, CA, USA) and then developed using 3,3-
diaminobenzidine. The sections were finally counterstained using cresyl violet. Serial
sections were stained with the Bielschowsky silver impregnation method to demonstrate
neuronal processes according to the standard Bancroft and Stevens protocol.
The sections which had been used for autoradiography were only stained with cresyl
violet as this tissue was not suitable for immunohistochemistry. This allowed
quantification of the lesion volume for the autoradiography analysis.
In vivo Data Analysis
The data was reconstructed using the ordered-subsets expectation maximization
algorithm in three dimensions (OSEM3D) plus fastMAP iterative reconstruction
protocols in the InveonTM acquisition software (Siemens Medical Solutions, USA). All
data sets were aligned to a standard rat template (Sciffer, Pmod) using the rigid matching
tool within Pmod v3.4 (PMOD Technologies Ltd., Switzerland). The images were then
evaluated by drawing a spherical ROI in the injected striatum. This ROI was then
mirrored in the contralateral hemisphere to act as a reference region. ROI analysis and
segmentation was performed in Pmod. The time activity curve (TAC) from the VOI
drawn in the lesioned hemisphere was subtracted from the TAC from the contralateral
hemisphere to examine the point of maximal binding (25-50 minutes) during the imaging
timeframe. The bound to free ratio was then calculated over the period of maximal
binding, as described by Farde et al. (25). Briefly, the area under the curve was calculated
by on November 1, 2018. For personal use only. jnm.snmjournals.org Downloaded from
11
by integrating between the defined time limits during the maximal binding period for
both the lesioned TAC and the contralateral TAC. In order to get the bound to free ratio
the following calculation was performed:
Bnd = (TAC(Lesion)-TAC(Contralateral))/TAC(Contralateral)
Pixelwise Modelling of in-vivo Images
The images were reconstructed into 3D using the in-built tool within Pmod and then auto
segmentation of the lesions was performed using the threshold tool and placing a seed
point in the lesion area.
Statistical Analysis
All statistical analysis was performed using Prism (5.01, Graph Pad software inc, USA).
A result was considered significant if p < 0.05. Images were co-registered using
Photoshop (CS4, Adobe, USA) to resize and overlay the images.
RESULTS
Fingolimod Reduced Microglial Activation and ex-vivo 18F-GE180 Binding in a
Chronic DTH-EAE Lesion
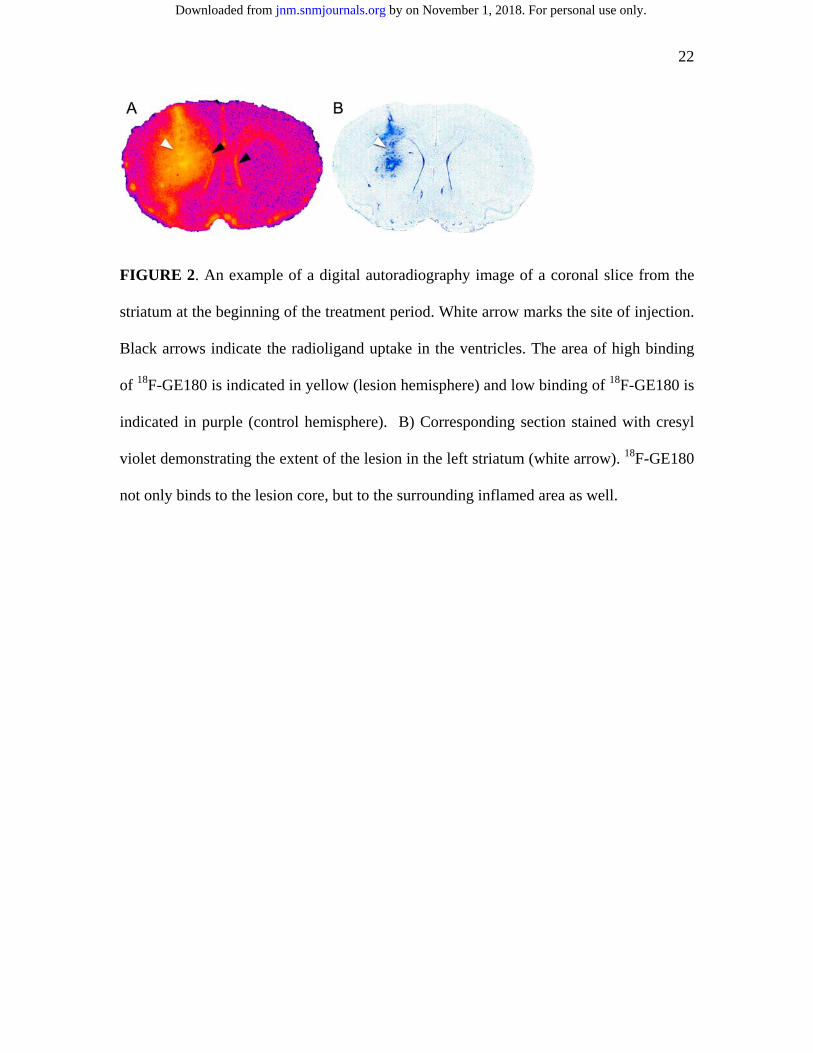
The chronic focal EAE-lesion produced by intrastriatal injection of BCG and subsequent
peripheral activation caused a large inflammatory lesion in the ipsilateral hemisphere,
which was well visualized after 127 days of lesion induction. This late lesion had a wide
area of microglial activation depicted by increased uptake of 18F-GE180 in the ipsilateral
hemisphere (Fig. 2A), and a hypercellular core visualized by cresyl violet staining (Fig
2B). No inflammation was observed in the contralateral hemisphere (Fig. 2A and 2B).
by on November 1, 2018. For personal use only. jnm.snmjournals.org Downloaded from
12
The increased ipsilateral microglial activation was not solely limited to the area of hyper-
cellularity but continued into the normal appearing brain tissue surrounding the lesion,
and was demonstrated by an increase in perilesional 18F-GE180 binding (Figure 2A and
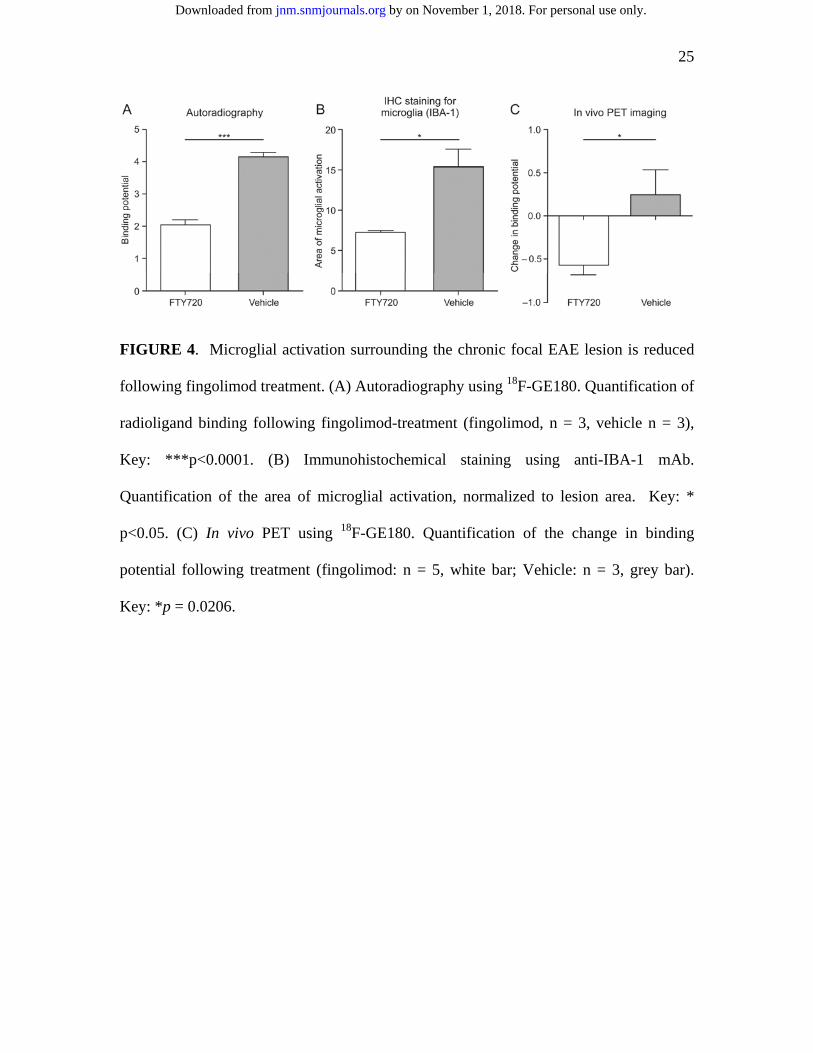
2B). Treatment of the animals with fingolimod for 28 days resulted with clear reduction
in the binding of 18F-GE180 when compared to vehicle-treated animals and evaluated by
ex vivo autoradiography (Fig. 3A). Quantification of the binding of the radiotracer
revealed a significant reduction in the binding potential of 18F-GE180 (p < 0.0001)
following treatment with fingolimod (Figure 4A).
Evaluation of Microglial Activation and Axonal Integrity in Chronic Focal EAE
Using Immunohistochemistry
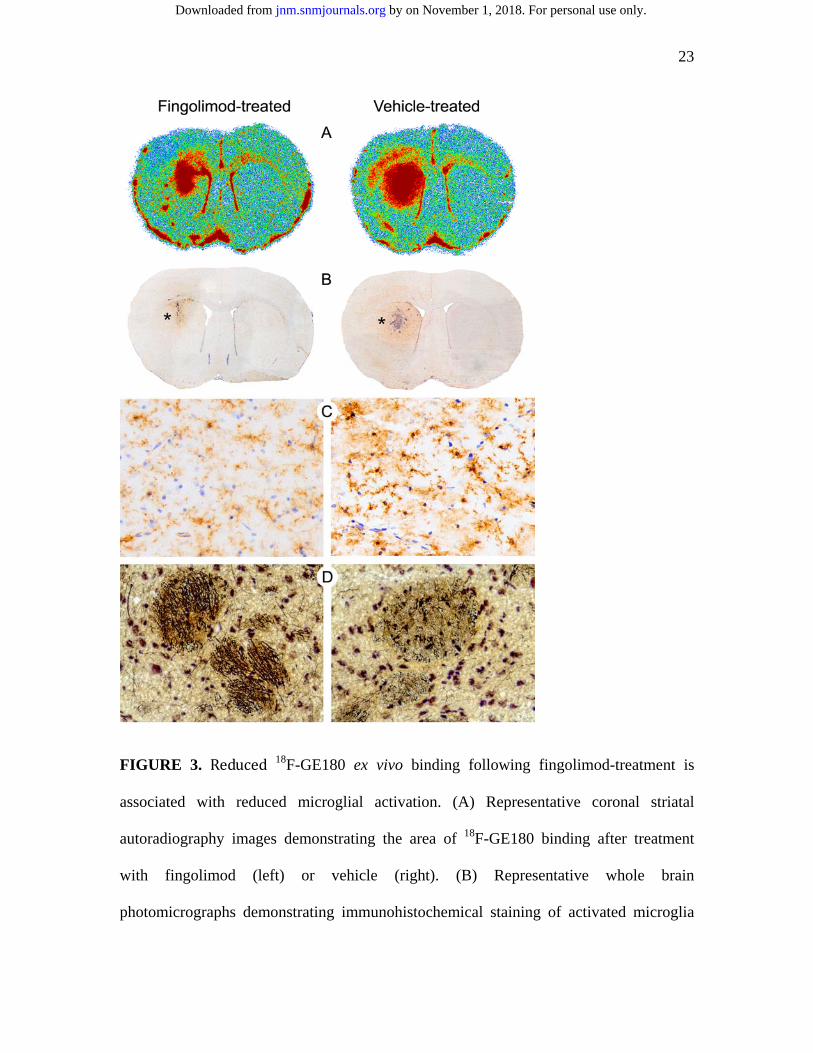
The area of increased uptake of the radiotracer corresponded to the area of activated
microglia observed by immunohistochemistry (Figure 3A-C). Fingolimod-treatment
prevented lesion expansion, demonstrated by diminished area of microglial activation
surrounding the lesion in immunohistochemical staining (Figure 4B; for fingolimod-
treatment; 7.22 arbitrary units (arb. unit) ± 3.40 vs. vehicle-treatment; 15.35 arb. unit ±
2.18, p = 0.0264). Closer examination of the appearance of the IBA-1-stained microglia
revealed that the cellular processes were more elongated in the fingolimod-treated
animals at equivalent extralesional sites compared to the vehicle-treated aniamls (3C).
Silver staining revealed the presence of dystrophic axons surrounding the lesions. At
equivalent sites, the silver stain demonstrated axon sparing in the fingolimod-treated-
animals compared to vehicle-treated animals (3D).
by on November 1, 2018. For personal use only. jnm.snmjournals.org Downloaded from
13
Effect of Fingolimod on Microglial Activation in Chronic Focal EAE Evaluated
using in vivo TSPO-PET Imaging
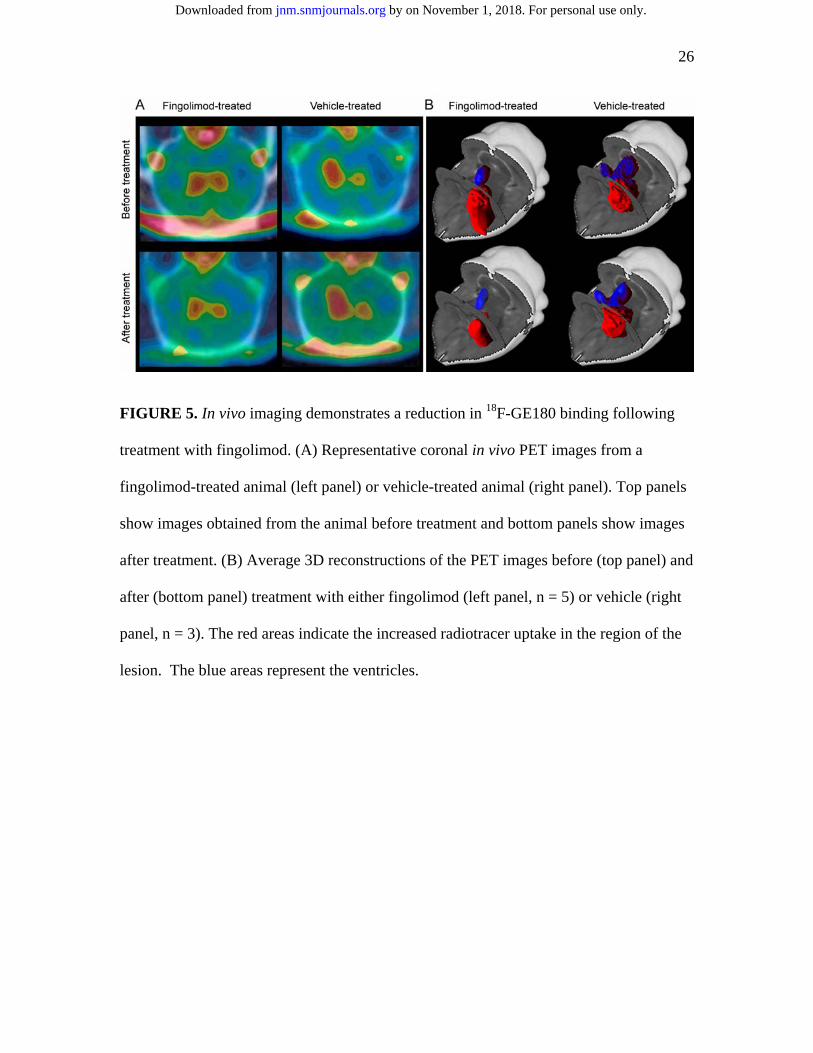
From the in vivo PET images it was possible to observe binding of the 18F-GE180
radioligand in the ipsilateral but not contralateral striatum (Figure 5). When comparing a
pre-treatment scan to a post-treatment scan a decrease in the size of the volume of 18F-
GE180 binding following treatment with fingolimod was observed (Figure 5). A similar
reduction was not observed in the vehicle-treated group, in fact the lesion actually
increased in size (Figure 5B). Quantification of the PET data revealed a significant
reduction in the Bnd in the fingolimod-treated group (-0.634 ± .141 arb. unit) compared to
the vehicle-treated group (0.266 ± 0.281 arb. unit), p = 0.021 (Figure 4C).
DISCUSSION
In this study, we have demonstrated for the first time that in vivo PET imaging using a
TSPO-binding radioligand can be used to quantify microglial activation in a chronic focal
EAE model in rat. Importantly, fingolimod treatment of the animals resulted with
diminished microglial activation, demonstrable as a reduction both in lesion volume and
in binding potential in in vivo PET. Furthermore, this reduction in TSPO binding was
observed in autoradiography and could be attributed to reduction in the activation of the
microglia, confirmed by anti-IBA-1 immunostaining. Importantly, earlier extensive work
has validated the expression of TSPO to be localized in activated microglial cells and
macrophages, and to some degree also in astrocytes in abnormal brain both in humans
and in rodents (6, 26).
by on November 1, 2018. For personal use only. jnm.snmjournals.org Downloaded from
14
Fingolimod efficacy in the treatment of MS has been well demonstrated (27). The impact
of fingolimod on the immune system is immunomodulatory, and dependent on the
retention of lymphocytes within the lymph nodes (28). Due to its lipophilicity,
fingolimod crosses the BBB, and pharmacologically relevant concentrations are found in
the brain and spinal cord following oral administration (16). There is good evidence from
MRI that fingolimod reduces brain atrophy development compared to placebo and
interferon-beta therapy, an observation suggestive of neuroprotective action of this drug
(27). S1PR are expressed on all CNS cell types, and binding of fingolimod-P to these
results with intracellular signaling and potentially beneficial outcome effects in terms of
preventing progression of MS (29).
Microglial activation is critical in MS pathogenesis. In secondary progressive MS, there
is increased microglial activation and accumulating neurodegeneration throughout the
white matter and gray matter (30). The observed correlation between diffuse
inflammation and axonal injury suggests that inflammation likely contributes to
neurodegeneration and disease progression, and thus therapeutic targeting of microglial
activation might also reduce the axonal injury (30-32). The present work using the
chronic focal EAE model mimicking progressive MS, and our earlier human PET
imaging study on secondary progressive MS patients (9) together demonstrate that
evaluation of microglial activation using TSPO-binding PET-ligands allows assessment
of the diffuse brain inflammation and perilesional activity in progressive MS and animal
models of the progressive disease in vivo. Importantly, our present work also
demonstrates the close correlation between axonal damage and microglial activation.
by on November 1, 2018. For personal use only. jnm.snmjournals.org Downloaded from
15
MS is traditionally seen as an inflammatory autoimmune disease, but also
neurodegeneration is present from early on. A plethora of medications has emerged in
recent years for treatment of relapsing-remitting MS, but there is still no single treatment
dedicated for progressive MS. Finding a treatment that would result with diminished
microglial cell activity in progressive MS would be an attractive way towards drug
development for the progressive forms of the disease. MRI imaging has been the ‘gold
standard’ for imaging MS-related changes, but conventional MRI has a low detection
threshold for detecting diffuse white matter changes typical for progressive disease.
Hence, other functional imaging methods, such as advanced MRI imaging methods and
PET imaging using TSPO-radioligands, are needed to complement conventional MRI.
Our work supports the notion that TSPO-PET-imaging, together with conventional and
non-conventional MRI could potentially be used as an imaging biomarker e.g. in proof-
of-concept treatment studies of progressive MS, where reduced radioligand binding could
be interpreted as a quantifiable sign of reduced microglial activation. Interestingly, an in
vivo 11C-PK11195-study has already shown that glatiramer acetate-treatment leads to
reduced microglial activation in relapsing remitting MS (33). Future studies will have to
elucidate the prognostic significance of increased microglial activation in the normal
appearing white matter, and the implications of being able to therapeutically reduce
microglial activation.
The utility of focal DTH-EAE model to demonstrate both novel diagnostic techniques
and treatment effects has been demonstrated in earlier studies (23, 34). The advantage of
using a focal model over the more commonly used disseminated models, is that it is
possible to monitor a specific lesion without the interference from new or neighbouring
by on November 1, 2018. For personal use only. jnm.snmjournals.org Downloaded from
16
lesions. This is especially important in micro-PET experiments due to the inherent low
spatial resolution of the resultant image (35). The previous studies focused on the
prevention of new lesion formation within the CNS as the treatment was already started
simultaneously when the lesion was activated peripherally (23). In the present study we
examined the effects of fingolimod on a well-established DTH-EAE lesion, which is a
more clinically relevant paradigm, also in terms of progressive MS. The reduction of
microglial activation surrounding the lesion occurred relatively quickly, after only 28
days of treatment, highlighting the efficacy of fingolimod in this model. This is probably
due the direct effects of fingolimod within the CNS rather than the depletion of T-cells at
this short time point.
Conclusions
This study demonstrates the effectiveness of 18F-GE180 as a ‘second generation’ TSPO-
ligand in detecting the treatment effect of fingolimod in reducing microglial activation in
a chronic focal rodent model of MS. The ability to visualise the reduction of microglia in
vivo using PET imaging potentially provides a key tool in following this surrogate marker
for diffuse inflammation in progressive MS.
ACKNOWLEDGEMENTS
We thank professor David Leppert for fruitful discussions. The staff participating in
executing the studies at the Turku PET Centre are gratefully acknowledged.
by on November 1, 2018. For personal use only. jnm.snmjournals.org Downloaded from
17
DISCLOSURE
This study was financially supported by the Finnish Academy, Biocentre Finland, GE
Healthcare, ltd. and European Union's Seventh Framework Programme (FP7/2007-2013)
under grant agreement n°HEALTH-F2-2011-278850 (INMiND). None of the authors
declare any conflicts of interest.
by on November 1, 2018. For personal use only. jnm.snmjournals.org Downloaded from
18
REFERENCES
1. Sormani MP, Bruzzi P. MRI lesions as a surrogate for relapses in multiple sclerosis: a meta-analysis of randomised trials. Lancet Neurol. 2013;12:669-676.
2. Confavreux C, Vukusic S, Moreau T, Adeleine P. Relapses and progression of disability in multiple sclerosis. N Engl J Med. 2000;343:1430-1438.
3. Howell OW, Rundle JL, Garg A, Komada M, P.J. B, Reynolds R. Activated microglia mediate axoglial disruption that contributes to axonal injury in multiple sclerosis. J Neuropathol Exp Neurol. 2010;69:1017-1033.
4. Barkhof F. The clinico-radiological paradox in multiple sclerosis revisited. Curr Opin Neurol. 2002;15:239-245.
5. Papadopoulos V, Baraldi M, Guilarte TR, et al. Translocator protein (18kDa): new nomenclature for the peripheral-type benzodiazepine receptor based on its structure and molecular function. Trends Pharmacol Sci. 2006;27:402-409.
6. Chen MK, Baidoo K, Verina T, Guilarte TR. Peripheral benzodiazepine receptor imaging in CNS demyelination: functional implications of anatomical and cellular localization. Brain. 2004;127:1379-1392.
7. Politis M, Giannetti P, Su P, et al. Increased PK11195 PET binding in the cortex of patients with MS correlates with disability. Neurology. 2012;79:523-530.
8. Banati RB. Visualising microglial activation in vivo. Glia. 2002;40:206-217. 9. Rissanen E, Tuisku J, Rokka J, et al. In vivo Detection of Diffuse Inflammation in
Secondary Progressive Multiple Sclerosis Using Positron Emission Tomography Imaging and Radioligand [11C]PK11195. J Nucl Med. 2014;55:939-944.
10. Ching AS, Kuhnast B, Damont A, Roeda D, Tavitian B, Dolle F. Current paradigm of the 18-kDa translocator protein (TSPO) as a molecular target for PET imaging in neuroinflammation and neurodegenerative diseases. Insights Imaging. 2012;3:111-119.
11. Dickens AM, Vainio S, Marjamaki P, et al. Detection of microglial activation in an acute model of neuroinflammation using PET and radiotracers 11C-(R)-PK11195 and 18F-GE-180. J Nucl Med. 2013;55:466-472.
12. Wickstrøm T, A. C, Gausemel I, et al. The development of an automated and GMP compliant FASTlab™ synthesis of [18F]GE-180; a radiotracer for imaging translocator protein (TSPO). J Label Compd Radiopharm. 2014;57:42-48.
13. Jeffery DR. Recent advances in treating multiple sclerosis: efficacy, risks and place in therapy. Ther Adv Chron Dis. 2013;4:45-51.
14. Brinkmann V, Davis MD, Heise CE, et al. The immune modulator FTY720 targets sphingosine 1-phosphate receptors. J Biol Chem. 2002;277:21453-21457.
15. Cohen JA, Chun J. Mechanisms of fingolimod's efficacy and adverse effects in multiple sclerosis. Ann Neurol. 2011;69:759-777.
16. Foster CA, Howard LM, Schweitzer A, et al. Brain penetration of the oral immunomodulatory drug FTY720 and its phosphorylation in the central nervous system during experimental autoimmune encephalomyelitis: consequences for mode of action in multiple sclerosis. J Pharmacol Exp Ther. 2007;323:469-475.
17. Coelho RP, Payne SG, Bittman R, Spiegel S, Sato-Bigbee C. The Immunomodulator FTY720 Has a Direct Cytoprotective Effect in Oligodendrocyte Progenitors. J Pharmacol Exp The. 2007;323:626-635.
by on November 1, 2018. For personal use only. jnm.snmjournals.org Downloaded from
19
18. Serres S, Anthony DC, Jiang Y, et al. Comparison of MRI signatures in pattern I and II multiple sclerosis models. NMR Biomed. 2009;22:1014-1024.
19. Lucchinetti C, Bruck W, Parisi J, Scheithauer B, Rodriguez M, Lassmann H. Heterogeneity of multiple sclerosis lesions: implications for the pathogenesis of demyelination. Ann Neurol. 2000;47:707-717.
20. Anthony DC, Miller KM, Fearn S, et al. Matrix metalloproteinase expression in an experimentally-induced DTH model of multiple sclerosis in the rat CNS. J Neuroimmunol. 1998;87:62-72.
21. Caporale V, Alessandrini B, Villa P, Del Papa S. Global perspectives on animal welfare: Europe. Rev Scient Tech-Off Int Epiz. 2005;24:567.
22. Matyszak MK, Perry VH. Demyelination in the central nervous system following a delayed-type hypersensitivity response to bacillus Calmette-Guérin. Neuroscience. 1995;64:967-977.
23. Anthony DC, Sibson NR, Losey P, Meier DP, Leppert D. Investigation of immune and CNS-mediated effects of fingolimod in the focal delayed-type hypersensitivity multiple sclerosis model. Neuropharmacology. 2014;79:543-541.
24. McLean I, Nakane PK. Periodate-lysine-paraformaldehyde fixative a new fixative for immunoelectron microscopy. J Histochem Cytochem. 1974;22:1077-1083.
25. Farde L, Eriksson L, Blomqvist G, Halldin C. Kinetic Analysis of Central 11C-Raclopride Binding to D2-Dopamine Receptors Studied by PET—A Comparisonto the Equilibrium Analysis. J Cereb Blood Flow Metabol. 1989;9:696-708.
26. Cosenza-Nashat M, Zhao ML, Suh HS, et al. Expression of the translocator protein of 18 kDa by microglia, macrophages and astrocytes based on immunohistochemical localization in abnormal human brain. Neuropathol Appl Neurobiol. 2009;35:306-328.
27. Cohen JA, Barkhof F, Comi G, et al. Oral fingolimod or intramuscular interferon for relapsing multiple sclerosis. N Engl J Med. 2010;362:402-415.
28. Mehling M, Kappos L, Derfuss T. Fingolimod for multiple sclerosis: mechanism of action, clinical outcomes, and future directions. Curr Neurol Neurosci Rep. 2011;11:492-497.
29. Groves A, Kihara Y, Chun J. Fingolimod: direct CNS effects of sphingosine 1-phosphate (S1P) receptor modulation and implications in multiple sclerosis therapy. J Neurol Sci. 2013;328:9-18.
30. Frischer JM, Bramow S, Dal-Bianco A, et al. The relation between inflammation and neurodegeneration in multiple sclerosis brains. Brain. 2009;132:1175-1189.
31. Prineas JW, Kwon EE, Cho ES, et al. Immunopathology of secondary-progressive multiple sclerosis. Ann Neurol. 2001;50:646-657.
32. Magliozzi R, Howell OW, Reeves C, et al. A Gradient of neuronal loss and meningeal inflammation in multiple sclerosis. Ann Neurol. 2010;68:477-493.
33. Ratchford JN, Endres CJ, Hammoud DA, et al. Decreased microglial activation in MS patients treated with glatiramer acetate. J Neurol. 2012;259:1199-1205.
34. Serres S, Anthony DC, Jiang Y, et al. Systemic inflammatory response reactivates immune-mediated lesions in rat brain. J Neurosci. 2009;29:4820-4828.
by on November 1, 2018. For personal use only. jnm.snmjournals.org Downloaded from

20
35. Levin CS, Hoffman EJ. Calculation of positron range and its effect on the fundamental limit of positron emission tomography system spatial resolution. Phys Med Biol. 1999;44:781-782.
by on November 1, 2018. For personal use only. jnm.snmjournals.org Downloaded from
21
FIGURE 1. Experimental design showing the timeline of the procedures
by on November 1, 2018. For personal use only. jnm.snmjournals.org Downloaded from
22
FIGURE 2. An example of a digital autoradiography image of a coronal slice from the
striatum at the beginning of the treatment period. White arrow marks the site of injection.
Black arrows indicate the radioligand uptake in the ventricles. The area of high binding
of 18F-GE180 is indicated in yellow (lesion hemisphere) and low binding of 18F-GE180 is
indicated in purple (control hemisphere). B) Corresponding section stained with cresyl
violet demonstrating the extent of the lesion in the left striatum (white arrow). 18F-GE180
not only binds to the lesion core, but to the surrounding inflamed area as well.
by on November 1, 2018. For personal use only. jnm.snmjournals.org Downloaded from
23
FIGURE 3. Reduced 18F-GE180 ex vivo binding following fingolimod-treatment is
associated with reduced microglial activation. (A) Representative coronal striatal
autoradiography images demonstrating the area of 18F-GE180 binding after treatment
with fingolimod (left) or vehicle (right). (B) Representative whole brain
photomicrographs demonstrating immunohistochemical staining of activated microglia
by on November 1, 2018. For personal use only. jnm.snmjournals.org Downloaded from

24
(anti-IBA-1) in a fingolimod-treated (left) and vehicle treated animals (right). (C)
Highpowered photo micrographs taken from the border of the lesion (marked with * in
B). (D). In fingolimod-treated animals, silver-staining shows normal-appearing axons at
the site of * in B (left), whereas in vehicle-treated animals the axons are dystrophic and
reduced in density at the corresponding site (right). High power scale bar = 20 μm.
by on November 1, 2018. For personal use only. jnm.snmjournals.org Downloaded from
25
FIGURE 4. Microglial activation surrounding the chronic focal EAE lesion is reduced
following fingolimod treatment. (A) Autoradiography using 18F-GE180. Quantification of
radioligand binding following fingolimod-treatment (fingolimod, n = 3, vehicle n = 3),
Key: ***p<0.0001. (B) Immunohistochemical staining using anti-IBA-1 mAb.
Quantification of the area of microglial activation, normalized to lesion area. Key: *
p<0.05. (C) In vivo PET using 18F-GE180. Quantification of the change in binding
potential following treatment (fingolimod: n = 5, white bar; Vehicle: n = 3, grey bar).
Key: *p = 0.0206.
by on November 1, 2018. For personal use only. jnm.snmjournals.org Downloaded from
26
FIGURE 5. In vivo imaging demonstrates a reduction in 18F-GE180 binding following
treatment with fingolimod. (A) Representative coronal in vivo PET images from a
fingolimod-treated animal (left panel) or vehicle-treated animal (right panel). Top panels
show images obtained from the animal before treatment and bottom panels show images
after treatment. (B) Average 3D reconstructions of the PET images before (top panel) and
after (bottom panel) treatment with either fingolimod (left panel, n = 5) or vehicle (right
panel, n = 3). The red areas indicate the increased radiotracer uptake in the region of the
lesion. The blue areas represent the ventricles.
by on November 1, 2018. For personal use only. jnm.snmjournals.org Downloaded from
Doi: 10.2967/jnumed.114.149955Published online: January 8, 2015.J Nucl Med. Olof Solin, Merja Haaparanta-Solin, Daniel Anthony and Juha RinneLaura Airas, Alex Dickens, Petri Elo, Päivi Marianne Marjamäki, Jarkko Johansson, Olli Eskola, Paul Jones, william Trigg, Activation after Fingolimod Treatment in an Animal Model of Multiple Sclerosis
Positron Emission Tomography Imaging Demonstrates Diminished MicroglialIn vivo
http://jnm.snmjournals.org/content/early/2015/01/08/jnumed.114.149955This article and updated information are available at:
http://jnm.snmjournals.org/site/subscriptions/online.xhtml
Information about subscriptions to JNM can be found at:
http://jnm.snmjournals.org/site/misc/permission.xhtmlInformation about reproducing figures, tables, or other portions of this article can be found online at:
and the final, published version.proofreading, and author review. This process may lead to differences between the accepted version of the manuscript
ahead of print area, they will be prepared for print and online publication, which includes copyediting, typesetting,JNMcopyedited, nor have they appeared in a print or online issue of the journal. Once the accepted manuscripts appear in the
. They have not beenJNM ahead of print articles have been peer reviewed and accepted for publication in JNM
(Print ISSN: 0161-5505, Online ISSN: 2159-662X)1850 Samuel Morse Drive, Reston, VA 20190.SNMMI | Society of Nuclear Medicine and Molecular Imaging
is published monthly.The Journal of Nuclear Medicine
© Copyright 2015 SNMMI; all rights reserved.
by on November 1, 2018. For personal use only. jnm.snmjournals.org Downloaded from