Embed Size (px)
Citation preview
Tree Genetics & Genomes (2014) 10:203–212DOI 10.1007/s11295-013-0676-y
ORIGINAL PAPER
Inbreeding depression in intra-provenance crosses drivenby founder relatedness in white spruce
T. K. Doerksen · J. Bousquet · J. Beaulieu
Received: 18 April 2013 / Revised: 29 August 2013 / Accepted: 16 October 2013 / Published online: 1 November 2013© Springer-Verlag Berlin Heidelberg 2013
Abstract Genetic means for height growth differed bet-ween intra- and inter-provenance crosses, which we hy-pothesized was due partly to unidentified relatedness amongintra-provenance base parents resulting in mild inbreedingand inbreeding depression among their offspring. A densearray of 5,844 single nucleotide polymorphisms was usedto directly construct a genomic relationship matrix (G)that had four elements ranging from 0.17 to 0.24, betweenfive intra-provenance base parents. Adjusting the numer-ator relationship matrix for this relatedness among baseparents produced inbreeding coefficients of Fi ≈ 0.1 intheir offspring, which displayed depressed height growth.Accounting for inbreeding level as a covariate in a mixedmodel decreased grossly overestimated (up to 2×) domi-nance variance in models without the covariate adjustment.Height growth decreased 39 cm (∼ 6 %) for every 0.1increase in Fi .
Keywords Inbreeding · Inbreeding depression ·Relatedness · Dominance · Genomic relationship matrix
Communicated by D. Neale
T. K. Doerksen (�) · J. BeaulieuNatural Resources Canada, Canadian Forest Service,Canadian Wood Fibre Centre, 1055 du P.E.P.S.,Stn Sainte-Foy, P.O. Box 10380,Quebec, QC, G1V 4C7, Canadae-mail: [email protected]
J. Beaulieue-mail: [email protected]
T. K. Doerksen · J. Beaulieu · J. BousquetCanada Research Chair in Forest and Environmental Genomics,Institute for Systems and Integrative Biology, Universite Laval,Quebec, QC, G1V0A6, Canada
Introduction
Forest tree improvement in Canada is still primarily basedon recurrent selection of individuals with superior additivegenetic (breeding) values (BV) with deployment throughseed orchards. Genetic material chosen for evaluation isimportant because it defines the founder or base popula-tion upon which variance components, genetic effects, andgenetic gains are inferred. Ancestors traced back to a non-inbred base population are assumed to have a commonvariance and a genetic mean of zero (Mrode 2006), whichis violated in the presence of subpopulations with differentgenetic means, potentially causing bias in the estimated BVsif modeled incorrectly.
Genetic means differing among subpopulations can arisesimply due to the random occurrence (or allocation) of indi-viduals with superior/inferior genetic worth in the differentsubpopulations under outbred mating. Genetic differencesamong subpopulations may be further exacerbated underinbreeding, if within-subpopulation inbreeding results ininbreeding depression (ID). In a typical forest geneticsexperiment, inbreeding in the most recent generation (e.g.,progenies being evaluated) can only result from (1) preex-isting inbreeding in the ancestors or (2) relatedness amongancestors, causing inbreeding in their descendants.
Inbreeding depression is thought to be caused by domi-nance (Ritland 1996), yet the large ID effects observed forinbred individuals in conifer species (Durel et al. 1996; Wuet al. 1998; Wang et al. 1999) do not necessarily translateinto substantial dominance variance when those same indi-viduals are outcrossed (Kumar 2004). In fact, the degreeof dominance detected in (presumably) outbred populationswas limited (Namkoong and Kang 1990) or varied acrosspopulations, ages, or environments (Yanchuk 1996; Wuet al. 2004). This difficulty in detecting dominance may be
204 Tree Genetics & Genomes (2014) 10:203–212
partly due to confounding with maternal or common envi-ronmental effects (Falconer and Mackay 1996), the needfor much more data (Misztal 1997), or advanced techniques(Waldmann et al. 2008) to estimate it reliably. However,in the presence of cryptic, ancestral relatedness, inbreedingand ID will go undetected, cannot be modeled, and maycontribute to biased genetic parameters.
Genetic markers can be used to uncover unobservedrelatedness at the individual level, but most techniqueswill suffer if sampling size is small, incomplete, or ifexpected relatedness is weak (Sillanpaa 2011). For exam-ple, parent assignment requires samples from both offspringand parental generations, and group partitioning methodsassume strong family structure in a sample of cohorts (Joneset al. 2010). Pairwise relatedness estimators have largevariances at the individual level (Blouin 2003) and maynot result in positive-definite relationship matrices neces-sary for quantitative analysis. Relatedness estimators canperform better by increasing the number of markers butthere is a point of diminishing returns if loci are not inde-pendent (Santure et al. 2010). Alternatively, with densemarker information, Legarra et al. (2009) showed howa genomic relationship matrix (GRM or G) constructeddirectly among genotyped individuals (VanRaden 2008) canbe blended with the numerator relationship matrix (NRM orA) built from pedigree information to yield positive-definitematrices appropriate for genetic evaluation. This combinedmatrix corrects not only off-diagonal relatedness elements,but also inbreeding coefficients (Fi) on the diagonal.
If a population is determined to be undergoing inbreed-ing, care must be taken to correctly account for dominanceand inbreeding effects. Under inbreeding, the phenotype isexpected to decrease linearly with increasing Fi and shouldbe included as a covariate in the model (White and Hodge1989, p. 295). Furthermore, elements in the dominance rela-tionship matrix (D) are no longer simple functions of valuesin the A matrix and must be computed from Jacquard’s pair-wise identity coefficients (Lynch and Walsh 1998, Ch. 7) orvia simulation (Ovaskainen et al. 2008). In addition, threeadditional (co)variances arise between additive and domi-nance effects and dominance effects related to inbreeding(Walsh 2005) that should be modeled unless they exhibit nodetectable effects, in which case they can be safely ignored(Shaw et al. 1998; Abney et al. 2000; Maki-Tanila 2007)without causing bias in the remaining genetic parameters.
In the province of Quebec, Canada, a white spruce breed-ing population has been established from selections madein provenances originating in eastern Ontario and westernQuebec (Beaulieu 1996). The breeding population is subdi-vided into breeding groups (Burdon and Namkoong 1983)so as to limit any potential coancestry to within group,where group members come from the same provenance or
geographic region. Thus if intra-provenance (within breed-ing group) individuals are related to each other, one mightexpect their offspring to display depressed phenotypescompared with inter-provenance (among breeding group)crosses. This is relevant because first-generation geneticgains in white spruce may have come in part from recap-turing, via heterosis in outcrosses, what was lost throughwithin-population inbreeding depression (Coles and Fowler1976).
In this study, experimental crosses within (intra-) andbetween (inter-) provenances were made to mimic cross-ing within and between breeding groups, respectively. Theobjectives were to (1) test for relatedness using geneticmarkers in a base population consisting of two geneticgroups, (2) determine if modeling the uncovered related-ness and inbreeding coefficients result in better model fitfor height growth, and (3) examine the potential bias ingenetic parameters caused by ignoring inbreeding depres-sion effects.
Materials and methods
Data
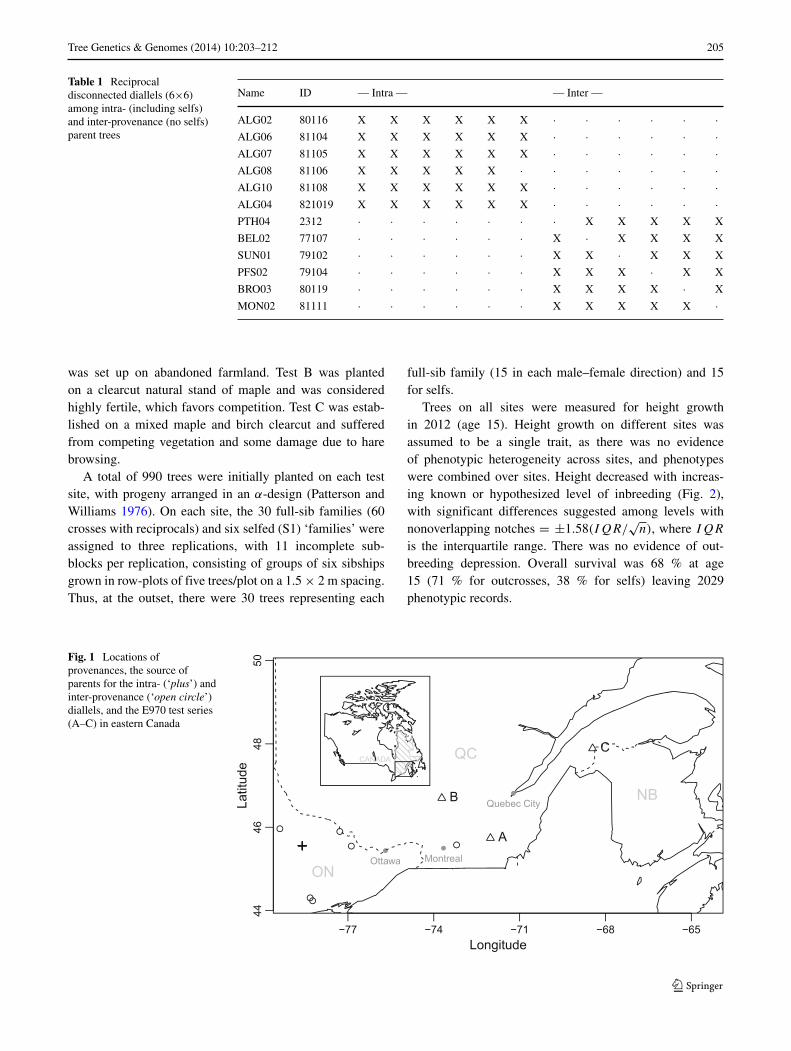
Phenotypes Open-pollinated seed lots had previously beencollected from natural stands, bulked, and used to establishprovenance tests. Based on superior phenotypic perfor-mance in the provenance tests, six trees were selected withina single provenance and another six trees were drawn fromsix different, unique provenances to act as parents in dis-connected intra- and inter-provenance diallels (Table 1). Inthe first diallel, intra-provenance crosses were made recip-rocally (including selfs, n×n = 36) between six parent treesfrom Algonquin Park, ON (ALG). Selfed progenies (S1)were used as a reference of known level of inbreeding. In thesecond diallel, inter-population crosses were made recipro-cally (without selfs, n(n − 1) = 30) between parent treesfrom six unique provenances (Beloeil, QC (BEL02); Brom-ley, ON (BRO03); Monaghan, ON (MON02); Petawawa,ON (PFS02); Peterborough, ON (PTH04); Sundridge, ON(SUN01)) in eastern Ontario and western Quebec (Fig. 1).These provenances acted as the source of part of the first-generation breeding program for the province of Quebec,where selected individuals were subdivided into breedinggroups delineated by geographic region (Beaulieu 1996).One female (seed) parent (ALG08) was mistakenly polli-nated twice with two different males, and its progeny wereconsidered a half-sib family with an unknown male donor(Table 1).
The two diallels were planted on three sites in 1997near Danville (site A), Saint-Michel-des-Saints (site B),and Biencourt (site C), Quebec, Canada (Fig. 1). Test A
Tree Genetics & Genomes (2014) 10:203–212 205
Table 1 Reciprocaldisconnected diallels (6×6)among intra- (including selfs)and inter-provenance (no selfs)parent trees
Name ID — Intra — — Inter —
ALG02 80116 X X X X X X · · · · · ·ALG06 81104 X X X X X X · · · · · ·ALG07 81105 X X X X X X · · · · · ·ALG08 81106 X X X X X · · · · · · ·ALG10 81108 X X X X X X · · · · · ·ALG04 821019 X X X X X X · · · · · ·PTH04 2312 · · · · · · · X X X X X
BEL02 77107 · · · · · · X · X X X X
SUN01 79102 · · · · · · X X · X X X
PFS02 79104 · · · · · · X X X · X X
BRO03 80119 · · · · · · X X X X · X
MON02 81111 · · · · · · X X X X X ·
was set up on abandoned farmland. Test B was plantedon a clearcut natural stand of maple and was consideredhighly fertile, which favors competition. Test C was estab-lished on a mixed maple and birch clearcut and sufferedfrom competing vegetation and some damage due to harebrowsing.
A total of 990 trees were initially planted on each testsite, with progeny arranged in an α-design (Patterson andWilliams 1976). On each site, the 30 full-sib families (60crosses with reciprocals) and six selfed (S1) ‘families’ wereassigned to three replications, with 11 incomplete sub-blocks per replication, consisting of groups of six sibshipsgrown in row-plots of five trees/plot on a 1.5 × 2 m spacing.Thus, at the outset, there were 30 trees representing each
full-sib family (15 in each male–female direction) and 15for selfs.
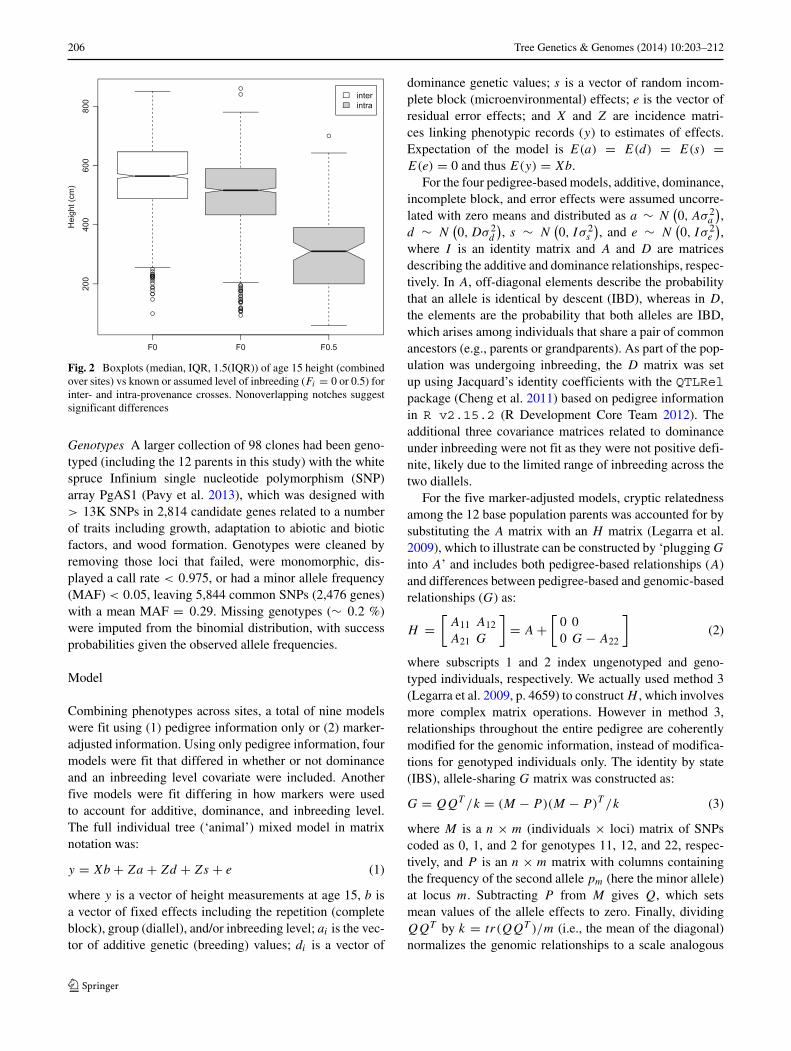
Trees on all sites were measured for height growthin 2012 (age 15). Height growth on different sites wasassumed to be a single trait, as there was no evidenceof phenotypic heterogeneity across sites, and phenotypeswere combined over sites. Height decreased with increas-ing known or hypothesized level of inbreeding (Fig. 2),with significant differences suggested among levels withnonoverlapping notches = ±1.58(IQR/
√n), where IQR
is the interquartile range. There was no evidence of out-breeding depression. Overall survival was 68 % at age15 (71 % for outcrosses, 38 % for selfs) leaving 2029phenotypic records.
Fig. 1 Locations ofprovenances, the source ofparents for the intra- (‘plus’) andinter-provenance (‘open circle’)diallels, and the E970 test series(A–C) in eastern Canada
206 Tree Genetics & Genomes (2014) 10:203–212
Fig. 2 Boxplots (median, IQR, 1.5(IQR)) of age 15 height (combinedover sites) vs known or assumed level of inbreeding (Fi = 0 or 0.5) forinter- and intra-provenance crosses. Nonoverlapping notches suggestsignificant differences
Genotypes A larger collection of 98 clones had been geno-typed (including the 12 parents in this study) with the whitespruce Infinium single nucleotide polymorphism (SNP)array PgAS1 (Pavy et al. 2013), which was designed with> 13K SNPs in 2,814 candidate genes related to a numberof traits including growth, adaptation to abiotic and bioticfactors, and wood formation. Genotypes were cleaned byremoving those loci that failed, were monomorphic, dis-played a call rate < 0.975, or had a minor allele frequency(MAF) < 0.05, leaving 5,844 common SNPs (2,476 genes)with a mean MAF = 0.29. Missing genotypes (∼ 0.2 %)were imputed from the binomial distribution, with successprobabilities given the observed allele frequencies.
Model
Combining phenotypes across sites, a total of nine modelswere fit using (1) pedigree information only or (2) marker-adjusted information. Using only pedigree information, fourmodels were fit that differed in whether or not dominanceand an inbreeding level covariate were included. Anotherfive models were fit differing in how markers were usedto account for additive, dominance, and inbreeding level.The full individual tree (‘animal’) mixed model in matrixnotation was:
y = Xb + Za + Zd + Zs + e (1)
where y is a vector of height measurements at age 15, b isa vector of fixed effects including the repetition (completeblock), group (diallel), and/or inbreeding level; ai is the vec-tor of additive genetic (breeding) values; di is a vector of
dominance genetic values; s is a vector of random incom-plete block (microenvironmental) effects; e is the vector ofresidual error effects; and X and Z are incidence matri-ces linking phenotypic records (y) to estimates of effects.Expectation of the model is E(a) = E(d) = E(s) =E(e) = 0 and thus E(y) = Xb.
For the four pedigree-based models, additive, dominance,incomplete block, and error effects were assumed uncorre-lated with zero means and distributed as a ∼ N
(0, Aσ 2
a
),
d ∼ N(0, Dσ 2
d
), s ∼ N
(0, Iσ 2
s
), and e ∼ N
(0, Iσ 2
e
),
where I is an identity matrix and A and D are matricesdescribing the additive and dominance relationships, respec-tively. In A, off-diagonal elements describe the probabilitythat an allele is identical by descent (IBD), whereas in D,the elements are the probability that both alleles are IBD,which arises among individuals that share a pair of commonancestors (e.g., parents or grandparents). As part of the pop-ulation was undergoing inbreeding, the D matrix was setup using Jacquard’s identity coefficients with the QTLRelpackage (Cheng et al. 2011) based on pedigree informationin R v2.15.2 (R Development Core Team 2012). Theadditional three covariance matrices related to dominanceunder inbreeding were not fit as they were not positive defi-nite, likely due to the limited range of inbreeding across thetwo diallels.
For the five marker-adjusted models, cryptic relatednessamong the 12 base population parents was accounted for bysubstituting the A matrix with an H matrix (Legarra et al.2009), which to illustrate can be constructed by ‘plugging G
into A’ and includes both pedigree-based relationships (A)and differences between pedigree-based and genomic-basedrelationships (G) as:
H =[
A11 A12
A21 G
]= A +
[0 00 G − A22
](2)
where subscripts 1 and 2 index ungenotyped and geno-typed individuals, respectively. We actually used method 3(Legarra et al. 2009, p. 4659) to construct H , which involvesmore complex matrix operations. However in method 3,relationships throughout the entire pedigree are coherentlymodified for the genomic information, instead of modifica-tions for genotyped individuals only. The identity by state(IBS), allele-sharing G matrix was constructed as:
G = QQT /k = (M − P)(M − P)T /k (3)
where M is a n × m (individuals × loci) matrix of SNPscoded as 0, 1, and 2 for genotypes 11, 12, and 22, respec-tively, and P is an n × m matrix with columns containingthe frequency of the second allele pm (here the minor allele)at locus m. Subtracting P from M gives Q, which setsmean values of the allele effects to zero. Finally, dividingQQT by k = tr(QQT )/m (i.e., the mean of the diagonal)normalizes the genomic relationships to a scale analogous
Tree Genetics & Genomes (2014) 10:203–212 207
to elements in the A matrix. The choice of different nor-malizing constants (e.g., k = 2
∑pm(1 − pm)) seems
particularly important where one has not genotyped the basepopulation making allele frequencies unknown (VanRaden2008), which was not the case in this study. All 98 cloneswere used to compute G and subsequently the sub-matrixof 12 parent clones used in this study were extracted. Theinbreeding coefficient (Fi) on the diagonal of H was usedto model inbreeding depression two different ways (seesection “Results”).
Model parameters (and effects) were sampled from theposterior distribution in a Bayesian implementation of themixed model using the MCMCglmm v2.16 package (Had-field 2010) in R v2.15.2 (R Development Core Team2012). Each model was run for 260,000 iterations with aburn-in of 60,000 and thinning interval of 200, resulting in1,000 samples saved per chain. ‘Fixed’ effect priors weredrawn from the default normal distribution with large (108)variance. For ‘random’ effects, priors were drawn from theinverse Wishart distribution with expected variances equalto the phenotypic variance divided by the number of ran-dom effects and the degree of belief parameter set to 1.The random effect priors are informative, but posterior sam-ples moved away from initial values indicating informationfrom the data was overcoming the prior and drasticallyshortened chain length required to reach stationarity usingthe default priors. Mixing and stationarity of the chainswas assessed with trace plots of samples from the poste-rior distribution using the coda package (Plummer et al.2006). The deviance information criterion (Spiegelhalteret al. 2002, DIC,) was used to compare model fit, wherea lower value indicates a better fit. Summary statistics andhighest probability density (HPD) intervals (95 %) of theposterior samples were obtained with the MCMCglmm andcoda packages. Proportions of additive, dominance, andincomplete block variance were calculated from the poste-rior distributions of the ‘random’ effects as: h2 or d2 ors2 = σ 2
a or σ 2d or σ 2
s /(σ 2
a + σ 2d + σ 2
s + σ 2e
), respectively.
Results
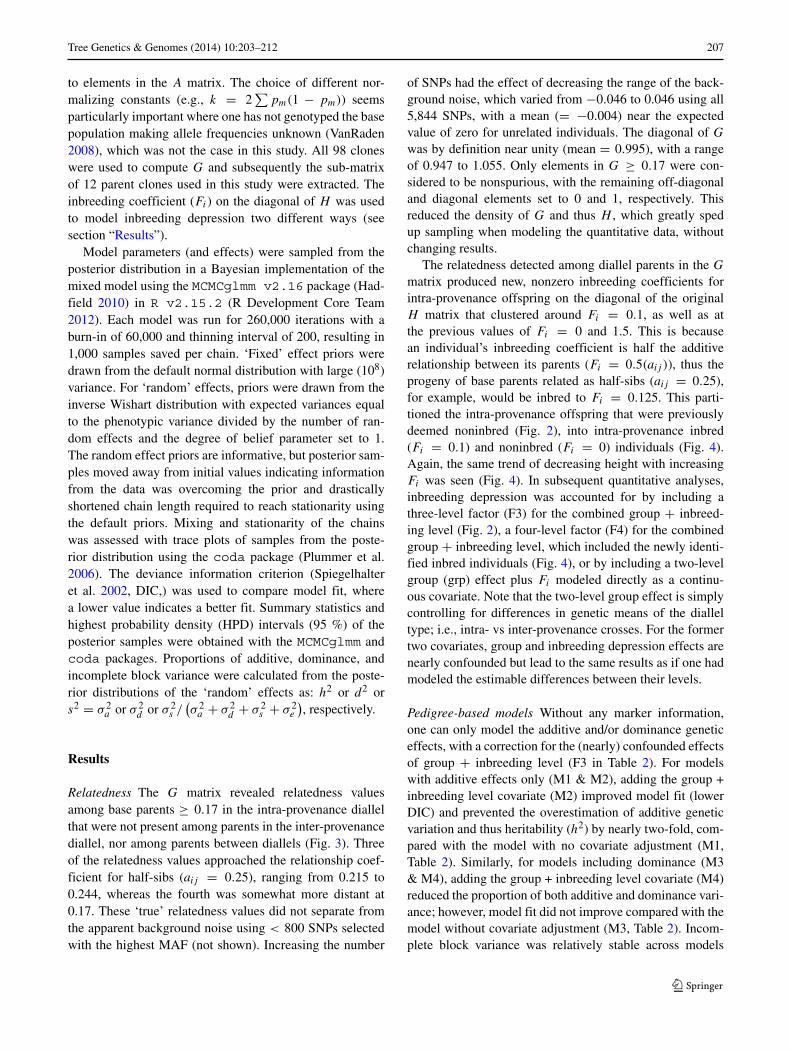
Relatedness The G matrix revealed relatedness valuesamong base parents ≥ 0.17 in the intra-provenance diallelthat were not present among parents in the inter-provenancediallel, nor among parents between diallels (Fig. 3). Threeof the relatedness values approached the relationship coef-ficient for half-sibs (aij = 0.25), ranging from 0.215 to0.244, whereas the fourth was somewhat more distant at0.17. These ‘true’ relatedness values did not separate fromthe apparent background noise using < 800 SNPs selectedwith the highest MAF (not shown). Increasing the number
of SNPs had the effect of decreasing the range of the back-ground noise, which varied from −0.046 to 0.046 using all5,844 SNPs, with a mean (= −0.004) near the expectedvalue of zero for unrelated individuals. The diagonal of G
was by definition near unity (mean = 0.995), with a rangeof 0.947 to 1.055. Only elements in G ≥ 0.17 were con-sidered to be nonspurious, with the remaining off-diagonaland diagonal elements set to 0 and 1, respectively. Thisreduced the density of G and thus H , which greatly spedup sampling when modeling the quantitative data, withoutchanging results.
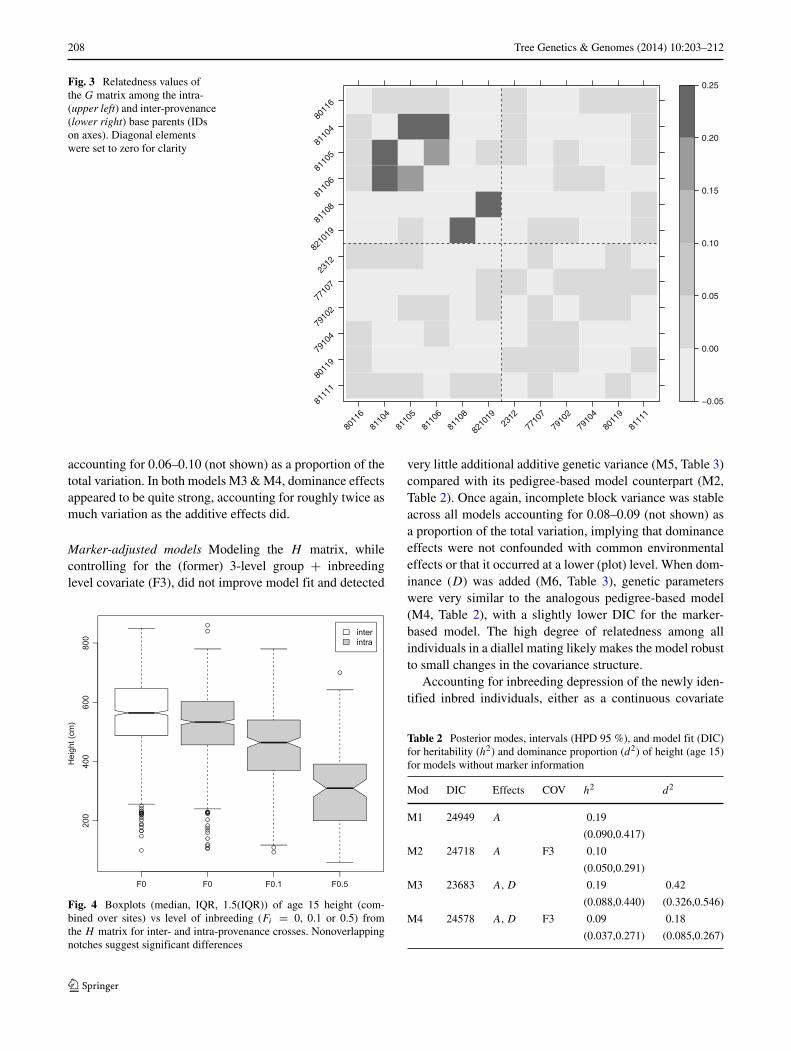
The relatedness detected among diallel parents in the G
matrix produced new, nonzero inbreeding coefficients forintra-provenance offspring on the diagonal of the originalH matrix that clustered around Fi = 0.1, as well as atthe previous values of Fi = 0 and 1.5. This is becausean individual’s inbreeding coefficient is half the additiverelationship between its parents (Fi = 0.5(aij )), thus theprogeny of base parents related as half-sibs (aij = 0.25),for example, would be inbred to Fi = 0.125. This parti-tioned the intra-provenance offspring that were previouslydeemed noninbred (Fig. 2), into intra-provenance inbred(Fi = 0.1) and noninbred (Fi = 0) individuals (Fig. 4).Again, the same trend of decreasing height with increasingFi was seen (Fig. 4). In subsequent quantitative analyses,inbreeding depression was accounted for by including athree-level factor (F3) for the combined group + inbreed-ing level (Fig. 2), a four-level factor (F4) for the combinedgroup + inbreeding level, which included the newly identi-fied inbred individuals (Fig. 4), or by including a two-levelgroup (grp) effect plus Fi modeled directly as a continu-ous covariate. Note that the two-level group effect is simplycontrolling for differences in genetic means of the dialleltype; i.e., intra- vs inter-provenance crosses. For the formertwo covariates, group and inbreeding depression effects arenearly confounded but lead to the same results as if one hadmodeled the estimable differences between their levels.
Pedigree-based models Without any marker information,one can only model the additive and/or dominance geneticeffects, with a correction for the (nearly) confounded effectsof group + inbreeding level (F3 in Table 2). For modelswith additive effects only (M1 & M2), adding the group +inbreeding level covariate (M2) improved model fit (lowerDIC) and prevented the overestimation of additive geneticvariation and thus heritability (h2) by nearly two-fold, com-pared with the model with no covariate adjustment (M1,Table 2). Similarly, for models including dominance (M3& M4), adding the group + inbreeding level covariate (M4)reduced the proportion of both additive and dominance vari-ance; however, model fit did not improve compared with themodel without covariate adjustment (M3, Table 2). Incom-plete block variance was relatively stable across models
208 Tree Genetics & Genomes (2014) 10:203–212
Fig. 3 Relatedness values ofthe G matrix among the intra-(upper left) and inter-provenance(lower right) base parents (IDson axes). Diagonal elementswere set to zero for clarity
81111
80119
79104
79102
77107
2312
821019
81108
81106
81105
81104
80116
80116
81104
81105
81106
81108
821019
2312
77107
79102
79104
80119
81111
−0.05
0.00
0.05
0.10
0.15
0.20
0.25
accounting for 0.06–0.10 (not shown) as a proportion of thetotal variation. In both models M3 & M4, dominance effectsappeared to be quite strong, accounting for roughly twice asmuch variation as the additive effects did.
Marker-adjusted models Modeling the H matrix, whilecontrolling for the (former) 3-level group + inbreedinglevel covariate (F3), did not improve model fit and detected
Fig. 4 Boxplots (median, IQR, 1.5(IQR)) of age 15 height (com-bined over sites) vs level of inbreeding (Fi = 0, 0.1 or 0.5) fromthe H matrix for inter- and intra-provenance crosses. Nonoverlappingnotches suggest significant differences
very little additional additive genetic variance (M5, Table 3)compared with its pedigree-based model counterpart (M2,Table 2). Once again, incomplete block variance was stableacross all models accounting for 0.08–0.09 (not shown) asa proportion of the total variation, implying that dominanceeffects were not confounded with common environmentaleffects or that it occurred at a lower (plot) level. When dom-inance (D) was added (M6, Table 3), genetic parameterswere very similar to the analogous pedigree-based model(M4, Table 2), with a slightly lower DIC for the marker-based model. The high degree of relatedness among allindividuals in a diallel mating likely makes the model robustto small changes in the covariance structure.
Accounting for inbreeding depression of the newly iden-tified inbred individuals, either as a continuous covariate
Table 2 Posterior modes, intervals (HPD 95 %), and model fit (DIC)for heritability (h2) and dominance proportion (d2) of height (age 15)for models without marker information
Mod DIC Effects COV h2 d2
M1 24949 A 0.19
(0.090,0.417)
M2 24718 A F3 0.10
(0.050,0.291)
M3 23683 A, D 0.19 0.42
(0.088,0.440) (0.326,0.546)
M4 24578 A, D F3 0.09 0.18
(0.037,0.271) (0.085,0.267)
Tree Genetics & Genomes (2014) 10:203–212 209
Table 3 Posterior modes, intervals (HPD 95 %), and model fit (DIC)for heritability (h2) and dominance proportion (d2) of height (age 15)for models including marker information
Mod DIC Effects COV h2 d2
M5 24723 H F3 0.11
(0.045,0.254)
M6 24561 H, D F3 0.11 0.18
(0.032,0.304) (0.088,0.272)
M7 24636 H, D grp,Fi 0.08 0.07
(0.024,0.23) (0.03,0.158)
M8 24627 H, D F4 0.10 0.06
(0.040,0.267) (0.026,0.144)
M9 24595 A2, D2 F4 0.10 0.06
(0.041,0.330) (0.033,0.144)
(Fi , M7) or a four-level group + inbreeding level factor(F4, M8), resulted in a marked reduction in the proportionof dominance variance compared with model M6, whereasadditive variance remained stable (Table 3). Although mod-els M7 & M8 correctly account for group, inbreeding leveland additive effects through the H matrix, both models hadsomewhat higher DIC values compared with M6 (Table 3).These higher DIC values may have been due to noise intro-duced by the modeling of inbreeding levels with too limiteda range, too few individuals per level or an incorrectly spec-ified response that was nonlinear instead of linear (for M7).However, the mean standard deviation of model M6 off-spring BVs were slightly higher (38 cm) than those of M7(32 cm) or M8 (35 cm), suggesting that not accountingfor inbreeding depression decreased BV precision. Thus bynot accounting for inbreeding depression effects, it wouldappear that mean dominance effects differed between theintra- and inter-provenance groups, when in fact they didnot.
Model M7, while simultaneously controlling for groupdifferences, also returned the coefficient (95 % HPD) forregressing height on Fi which was −394 (−472,−360),indicating that age 15 height decreased 39 cm (∼ 6 %) forevery 0.1 increase in Fi . Model M7 would be advantageousover M8 where pedigrees are more complex and inbreedingcoefficients do not fall into discrete, clustered levels.
Another reason for the higher DIC values in models M7& M8, might have been that the D matrix had not beenupdated to account for founder relatedness. To properly con-struct the dominance matrix under inbreeding, one needs apedigree whose relationship matrix elements are consistentwith those in the G matrix, which could be formed countlessways. We assigned five ghost parents to approximate whatappeared to be an isolated pair of half-sibs (aij = 0.25)between two founders, plus a circular structure of half-sibs between three founders (Fig. 3), with one pair being
Table 4 Correlations between additive (upper) and dominance (lower)genetic values for models M4, M8, and M9 (see text)
M4 M8 M9
M4 − 0.70 0.70
M8 0.55 − 0.78
M9 0.54 0.60 −
more distantly related, closer to a half-sib ‘once removed’(aij = 0.125). The new pedigree was used to construct addi-tive (A2) and dominance (D2) relationship matrices thatresulted in lower DIC values (M9) compared with M7 orM8, with variance components identical to M8 (Table 3).
BV rankings Three models were assessed as to how selec-tion decisions would be affected if (1) founder relatednesswas unknown or ignored (M4) and (2) marker informa-tion was used to better account for relatedness, inbreedinglevel, and dominance (M8, M9). If the diallels were usedsolely to assess the genetic worth of the original founderparents (backward selection), little could be gained fromthe extra modeling effort. Correlations between the 12 baseparent BVs for models M4, M8, and M9 were high (r =0.85 − 0.96) and only model M4 misidentified one of thetop six parents (not shown).
At the individual level (forward selection), correlationsbetween genetic values among models were much lower,highlighting the different sources of information in themodels (Table 4). For example, selection on additive val-ues (posterior modes) identified at best a common subsetof the top 30 and 52 % of individuals between models(M4, M8, M9) at intensities of 2.5 and 10 %, respectively.Furthermore, model M4 did not identify any individualsinbred to Fi = 0.1 at 2.5 % selection intensity becausethere was no adjustment for inbreeding level. This may beimportant if one were to screen for inbred individuals thatmay have purged deleterious recessive alleles (Williams andSavolainen 1996). Genetic gain at 2.5 % selection intensitywas comparable between models adjusting for inbreedinglevel (M8 49 cm; M9 51 cm), suggesting that the dif-ferent subsets of individuals selected by each model hadonly minor differences in additive genetic value. However,genetic gain was lower for the model (M4 40 cm) withoutadjustment for inbreeding level.
Discussion
The individual genetic model is based on tracing all indi-viduals back to a single random mating, noninbred basepopulation with common variance, and zero genetic mean(Mrode 2006). In this study, genetic means differed among
210 Tree Genetics & Genomes (2014) 10:203–212
groups of intra- and inter-provenance crosses, which wehypothesized was due not only to base parents of differinggenetic worth, but to unidentified relatedness among intra-provenance base parents resulting in mild inbreeding andinbreeding depression among their offspring.
The dense marker array used to calculate IBS related-ness among founders (G) represents the observed ratherthan the average (theoretical) relationship values in A andthus markers potentially capture distant relationships andthe variation around close relationships due to Mendeliansampling (VanRaden 2008; Legarra et al. 2009). The lackof genetic structure found between base parents of the dis-connected diallels is not surprising as most genetic diversityin conifers resides within population (Hamrick et al. 1992)due to their highly outcrossing nature, making them behaveas a single population(s) spanning large areas. White spruceprovenances display differentiation for quantitative growthtraits even when little is seen at individual loci (Jaramillo-Correa et al. 2001; Namroud et al. 2008), suggesting thatindividual (or a limited number of) markers are inadequateto capture the complexities of quantitative genetic (adaptive)variation.
Similarly, the close relatedness found among some of theintra-provenance diallel parents, which were offspring ofortets sampled within a single provenance (natural stand),is not unexpected as mating probability increases withdecreasing distance among mates with similar (synchro-nized) flower phenology (Doerksen et al. 2011). Further-more, this relatedness structure was maintained in the prove-nance test from which the diallel parents were selected, asthere was no (artificial) selection pressure against depressedphenotypes because they were not inbred. Although directcomputation of relatedness appeared to improve with a largeand increasing number of SNPs, unlike for relatedness esti-mators (Santure et al. 2010), the underlying relatednesswas unknown and thus the combined effect of known andinferred relatedness was tested in the quantitative model.
Relatedness detected among the intra-provenance dial-lel parents and subsequently propagated to their offspringin the H matrix had only a small direct impact on quanti-tative genetic parameters per se. This occurred because theH matrix (1) did not capture distant relatedness betweendiallels because none was present and (2) although addi-tive relatedness estimates were corrected among foundersand offspring, within-diallel relatedness was already high,suggesting the model was robust to small changes in theinformation content of the covariance structure. A greaterimpact might be expected in mating designs where small,disconnected families (e.g., open-pollinated half-sibs or sin-gle pair mates), become more connected following markeradjustment. Instead, the marker-adjusted relatedness wasindirectly advantageous by identifying inbred individuals
and adjusting their records for inbreeding level, implyingthat dominance is expressed for growth traits.
For traits largely under additive genetic control such asdensity (Wu et al. 2002; Kumar 2004), one would expecta perfect correlation (Williams and Savolainen 1996) orcorrelated response (Burdon and Russell 1998) betweenparental BV estimates of selfed vs outcrossed progenies.However, for growth traits, dominance plays a role whereits variance, while variable, is usually equal to or less thanthe additive variance in black spruce (Boyle 1987; Mullinand Park 1994), Douglas-fir (Yanchuk 1996), loblolly pine(Jansson and Li 2004), and Scots pine (Waldmann et al.2008). In some outlying tests, the dominance proportion isparticularly high (Wu et al. 2004), which may be the resultof undetected inbreeding and inbreeding depression caus-ing bias in genetic parameters, as was found in this study.Following adjustment for inbreeding level, dominance pro-portion was equal to or less than the proportion of additivevariance (h2) found in other studies and mean dominancevalues did not differ between groups as found elsewhere(Hodge et al. 1996). After correcting simultaneously forother effects in the model, inbreeding depression for age 15height growth was ∼6 % per 0.1 increase in Fi , of simi-lar magnitude to ∼3 % for diameter (Wu et al. 1998), 4 %for height (Durel et al. 1996), and 4–5 % for growth traits(Wang et al. 1999) in other species.
The information in the H matrix is coherent for all indi-viduals being genetically evaluated and includes inbreedingcoefficients (Fi) on the diagonal, that can be extractedand modeled as a covariate for inbreeding depression. Thisis important because direct measures of marker heterozy-gosity at (a limited number of) neutral loci act as poorproxies for inbreeding coefficients (Fi) derived from pedi-grees (Pemberton 2004) and thus would be inappropriate formodeling inbreeding depression effects. In another study,directly estimating inbreeding levels with markers and sub-sequently modifying the rules for constructing the A matrixhad some success in quantitative analyses at the family and(sub)population levels, but not at the individual level (Bushet al. 2011). Similarly, the use of pseudo-data (standardizedoffspring means) to regress pairwise phenotypic similarityon (a carefully chosen subset of) marker-based relatednesswas effective (Kumar and Richardson 2005), but the use ofpseudo-data only returns BV estimates for individuals withprogeny, not the entire population.
An interesting alternative way to account for ID wouldbe to treat outcrossed and selfed individuals as different,genetically correlated traits (Burdon and Russell 1998). Inthis way, potentially heterogeneous variance components,as well as correction for trait means and thus inbreedingdepression, would be accounted for. However, levels ofinbreeding other than selfs could not easily be introducedinto the model. Furthermore, as the proportion of selfs to
Tree Genetics & Genomes (2014) 10:203–212 211
outcrossed individuals would likely be very small (as in thisstudy), the 2× 2 (co)variance matrix between selfs and out-crosses might be poorly estimated. This problem would beexacerbated if extending the model to include dominanceand epistatic effects or heterogeneous variances across sites.
Although we genotyped only the parental generation inthis study, any intrapopulation individuals (parents or off-spring) could have been genotyped and the informationwould have been propagated consistently throughout theentire pedigree, adjusting for the unaccounted relatednessamong intra-provenance parents. In addition, when individ-uals with records (here progeny) are genotyped, a multitudeof techniques is opened up that may better separate additivegenetic effects from common environmental effects (Leeet al. 2010), dominance effects (Su et al. 2012), or higherorder interactions of genetic effects via nonlinear functionsof genotype distance (Piepho 2009; de los Campos et al.2010), although at greater cost.
A practical implication for the Quebec breeding programis that by pooling individuals across breeding groups intoa seed orchard, additional short-term genetic gain due toheterosis (release of inbreeding depression) could be real-ized in their offspring (i.e., a production population) that isnot predicted based on (additive) genetic evaluation withineach of the separate breeding groups. Inbreeding as a breed-ing tool has many attractive properties (Lindgren 1975;Williams and Savolainen 1996), which if certain challengesare overcome by careful modeling, could increase its use inforestry.
Acknowledgments We thank D. Plourde and E. Dussault for sitemaintenance and data collection; S. Blais and F. Gagnon (U. Laval) formanaging the genotype data; and K. Gardner, S. Carles, P. Cheers, andthe anonymous reviewers for comments on previous versions of themanuscript. This work was made possible by funding from the NaturalResources Canada Genomics R&D Initiative and the Canadian WoodFibre Centre to JBe and from Genome Quebec and Genome Canada toJBo.
Data archiving statement Data available from the Dryad DigitalRepository: http://dx.doi.org/10.5061/dryad.9m63g
References
Abney M, McPeek MS, Ober C (2000) Estimation of variance compo-nents of quantitative traits in inbred populations. Am J Hum Genet66(2):629–650
Beaulieu J (1996) Breeding program and strategy for white sprucein Quebec. Information Report LAU-X-117E. Natural ResourcesCanada, Canadian Forest Service, Quebec
Blouin MS (2003) DNA-based methods for pedigree reconstructionand kinship analysis in natural populations. Trends Ecol Evol18(10):503–511
Boyle T (1987) A diallel cross in black spruce. Genome 29(1):180–186
Burdon RD, Namkoong G (1983) Multiple populations and sublines.Silvae Genet 5–6:221–222
Burdon RD, Russell JH (1998) Inbreeding depression in selfing exper-iments: statistical issues. For Genet 5(3):179–189
Bush D, Kain D, Matheson C, Kanowski P (2011) Marker-basedadjustment of the additive relationship matrix for estimation ofgenetic parameters—an example using Eucalyptus cladocalyx.Tree Genet Genomes 7(1):23–35
Cheng R, Abney M, Palmer A, Skol A (2011) QTLRel: an R pack-age for genome-wide association studies in which relatedness is aconcern. BMC Genet 12(1):66
Coles JF, Fowler DP (1976) Inbreeding in neighboring trees in twowhite spruce populations. Silvae Genet 25(1):29–34
de los Campos G, Gianola D, Rosa GJM, Weigel KA, Crossa J(2010) Semi-parametric genomic-enabled prediction of geneticvalues using reproducing kernel Hilbert spaces methods. GenetRes 92(04):295–308
Doerksen TK, Deslauriers M, Beaulieu J (2011) Ecological and bio-logical information improves inferred paternity in a white sprucebreeding orchard. Can J For Res 41:1344–1351
Durel CE, Bertin P, Kremer A (1996) Relationship between inbreed-ing depression and inbreeding coefficient in maritime pine (Pinuspinaster). Theor Appl Genet 92(3–4):347–356
Falconer DS, Mackay TFC (1996) Introduction to quantitative genet-ics, 3rd edn. Longman, Harlow, England
Hadfield JD (2010) MCMC methods for multi-response generalizedlinear mixed models: the MCMCglmm R package. J Stat Softw33(2):1–22
Hamrick JL, Godt MJW, Sherman-Broyles SL (1992) Factors influ-encing levels of genetic diversity in woody plant species. New For6(1–4):95–124
Hodge GR, Volker PW, Potts BM, Owen JV (1996) A comparison ofgenetic information from open-pollinated and control-pollinatedprogeny tests in two eucalypt species. Theor Appl Genet 92(1):53–63
Jansson G, Li B (2004) Genetic gains of full-sib families fromdisconnected diallels in loblolly pine. Silvae Genet 53(2):60–64
Jaramillo-Correa JP, Beaulieu J, Bousquet J (2001) Contrasting evolu-tionary forces driving population structure at expressed sequencetag polymorphisms, allozymes and quantitative traits in whitespruce. Mol Ecol 10(11):2729–2740
Jones AG, Small CM, Paczolt KA, Ratterman NL (2010) A practicalguide to methods of parentage analysis. Mol Ecol Resour 10(1):6–30
Kumar S (2004) Effect of selfing on various economic traits in Pinusradiata and some implications for breeding strategy. For Sci50(5):571–578
Kumar S, Richardson TE (2005) Inferring relatedness and heritabilityusing molecular markers in radiata pine. Mol Breeding 15(1):55–64
Lee SH, Goddard ME, Visscher PM, Van Der Werf JHJ (2010) Usingthe realized relationship matrix to disentangle confounding fac-tors for the estimation of genetic variance components of complextraits. Genet Sel Evol 42:22
Legarra A, Aguilar I, Misztal I (2009) A relationship matrix includingfull pedigree and genomic information. J Dairy Sci 92(9):4656–4663
Lindgren D (1975) Use of selfed material in forest tree improvement.Research Notes 15, The Royal College of Forestry. Department ofForest Genetics, Stockholm
Lynch M, Walsh B (1998) Genetics and analysis of quantitative traits.Sinauer Associates Inc., Sunderland, MA
Maki-Tanila A (2007) An overview on quantitative and genomic toolsfor utilising dominance genetic variation in improving animalproduction. Agr Food Sci 16(2):188–198
212 Tree Genetics & Genomes (2014) 10:203–212
Misztal I (1997) Estimation of variance components with large-scaledominance models. J Dairy Sci 80(5):965–974
Mrode R (2006) Linear models for the prediction of animal breedingvalues. CABI, Wallingford
Mullin TJ, Park YS (1994) Genetic parameters and age–age correla-tions in a clonally replicated test of black spruce after 10 years.Can J For Res 24(12):2330–2341
Namkoong G, Kang H (1990) Quantitative genetics of forest trees.Plant Breed Rev 8:139–188
Namroud MC, Beaulieu J, Juge N, Laroche J, Bousquet J (2008)Scanning the genome for gene single nucleotide polymorphismsinvolved in adaptive population differentiation in white spruce.Mol Ecol 17(16):3599–3613
Ovaskainen O, Cano JM, Merila J (2008) A Bayesian framework forcomparative quantitative genetics. P R Soc B 275:669–678
Patterson HD, Williams ER (1976) A new class of resolvable incom-plete block designs. Biometrika 63(1):83–92
Pavy N, Gagnon F, Rigault P, Blais S, Deschenes A, Boyle B, PelgasB, Deslauriers M, Clement S, Lavigne P, Lamothe M, Cooke JEK,Jaramillo-Correa JP, Beaulieu J, Isabel N, MacKay J, Bousquet J(2013) Development of high-density SNP genotyping arrays forwhite spruce (Picea glauca) and transferability to subtropical andnordic congeners. Mol Ecol Resour 13:324–336
Pemberton J (2004) Measuring inbreeding depression in the wild: theold ways are the best. Trends Ecol Evol 19(12):613–615
Piepho HP (2009) Ridge regression and extensions for genomewideselection in maize. Crop Sci 49(4):1165–1176
Plummer M, Best N, Cowles K, Vines K (2006) CODA: conver-gence diagnosis and output analysis for MCMC. R News 6(1):7–11
R Development Core Team (2012) R: A language and environmentfor statistical computing. R Foundation for Statistical Computing,Vienna
Ritland K (1996) Inferring the genetic basis of inbreeding depressionin plants. Genome 39(1):1–8
Santure AW, Stapley J, Ball AD, Birkhead TR, Burke T, Slate J(2010) On the use of large marker panels to estimate inbreedingand relatedness: empirical and simulation studies of a pedigreedzebra finch population typed at 771 SNPs. Mol Ecol 19(7):1439–1451
Shaw RG, Byers DL, Shaw FH (1998) Genetic components of varia-tion in Nemophila menziesii undergoing inbreeding: morphologyand flowering time. Genetics 150(4):1649–1661
Sillanpaa MJ (2011) On statistical methods for estimating heritabilityin wild populations. Mol Ecol 20:1324–1332
Spiegelhalter DJ, Best NG, Carlin BP, van der Linde A (2002)Bayesian measures of model complexity and fit. J R Stat Soc SerB 64(4):583–639
Su G, Christensen OF, Ostersen T, Henryon M, Lund MS (2012)Estimating additive and non-additive genetic variances and pre-dicting genetic merits using genome-wide dense single nucleotidepolymorphism markers. PLoS ONE 7(9):e45293
VanRaden P (2008) Efficient methods to compute genomic predic-tions. J Dairy Sci 91(11):4414–4423
Waldmann P, Hallander J, Hoti F, Sillanpaa MJ (2008) EfficientMarkov chain Monte Carlo implementation of Bayesian anal-ysis of additive and dominance genetic variances in noninbredpedigrees. Genetics 179(2):1101–1112
Walsh B (2005) The struggle to exploit non-additive variation. Aust JAgr Res 56(9):873–881
Wang T, Hagqvist R, Tigerstedt PMA (1999) Inbreeding depressionin three generations of selfed families of silver birch (Betulapendula). Can J For Res 29(6):662–668
White TL, Hodge GR (1989) Predicting breeding values with applica-tions in forest tree improvement. Kluwer, Dordrecht, The Nether-lands
Williams CG, Savolainen O (1996) Inbreeding depression in conifers:implications for breeding strategy. For Sci 42(1):102–117
Wu HX, Matheson AC, Spencer D (1998) Inbreeding in Pinus radiata.I. The effect of inbreeding on growth, survival and variance. TheorAppl Genet 97(8):1256–1268
Wu HX, Matheson AC, Abarquez A (2002) Inbreeding in Pinus radi-ata. IV: the effect of inbreeding on wood density. Ann For Sci59(5–6):557–562
Wu HX, Owen JV, Abarquez A, Matheson AC (2004) Inbreeding inPinus radiata - V. The effects of inbreeding on fecundity. SilvaeGenet 53(2):80–87
Yanchuk AD (1996) General and specific combining ability fromdisconnected partial diallels of coastal Douglas-fir. Silvae Genet45(1):37–45