Embed Size (px)
Citation preview
Incentive Pay Practices: Nonprofit/Government
Organizations
A Report by WorldatWork and Vivient Consulting
February 2016
About WorldatWork® – The Total Rewards AssociationWorldatWork (www.worldatwork.org) is a nonprofit human resources association forprofessionals and organizations focused on compensation, benefits, work-life effec-tiveness and total rewards – strategies to attract, motivate and retain an engaged andproductive workforce. WorldatWork and its affiliates provide comprehensive education,certification, research, advocacy and community, enhancing careers of professionalsand, ultimately, achieving better results for the organizations they serve. WorldatWorkhas more than 65,000 members and subscribers worldwide; 80 percent of Fortune 500companies employ a WorldatWork member. Founded in 1955, WorldatWork is affiliatedwith more than 70 local human resources associations and has offices in Scottsdale,Ariz., and Washington, D.C.
WorldatWork Society of Certified Professionals® is the certifying body for six presti-gious designations: the Certified Compensation Professional® (CCP®), Certified BenefitsProfessional® (CBP), Global Remuneration Professional (GRP®), Work-Life CertifiedProfessional® (WLCP®), Certified Sales Compensation Professional (CSCP)™ andCertified Executive Compensation Professional (CECP)™.
The WorldatWork group of registered marks also includes: Alliance for Work-LifeProgress or AWLP, workspan and WorldatWork Journal.
Contact:
WorldatWork Customer Relations
14040 N. Northsight Blvd.
Scottsdale, Arizona USA
85260-3601
Toll free: 877-951-9191
Fax 480-483-8352
©2016 WorldatWork Any laws, regulations or other legal requirements noted in this publication are, to the best of the publisher’s knowledge, accurate and currentas of this report’s publishing date. WorldatWork is providing this information with the understanding that WorldatWork is not engaged, directly or by implication, inrendering legal, accounting or other related professional services. You are urged to consult with an attorney, accountant or other qualified professional concerningyour own specific situation and any questions that you may have related to that.
No portion of this publication may be reproduced in any form without express written permission from WorldatWork.
About Vivient ConsultingSince 2002, Vivient Consulting has provided independent compensation expertise toboard compensation committees, chief executive officers and human resourceprofessionals. Vivient works with public and private companies, and non-profitorganizations. Clients represent many different industries, sizes and stages of growth.The firm’s partners deliver high-quality solutions in the areas of compensation strategy,executive and board pay, incentive-compensation plan design and communications.
For more information about this study, contact Bonnie Schindler [email protected] or (847) 636-8919.
WorldatWork and Vivient Consulting | 1 “Incentive Pay Practices: Nonprofit/Government Organizations”
METHODOLOGY In November 2015, Vivient Consulting and WorldatWork invited a sample of WorldatWork’s nonpublicly traded members to answer an online survey about their incentive pay practices. More than 125 nonprofit and government organizations responded to the survey, as did 200 private for-profit companies. The survey results for the private for-profit companies appear in a separate report. Of the respondents, 70% are nonprofits, such as charitable and education organizations. The remaining 30% are public-sector organizations, such as state, local and federal government entities. The most common industries represented in the survey are health care and social assistance (29%); educational services (15%); public administration (14%); finance and insurance (12%); and consulting, professional, scientific and technical services (10%). The size of nonprofit and government organizations responding to the survey tends to be large. Of the respondents, 75% have more than 1,000 full-time equivalent (FTE) employees. Organizational budgets range from more than $20 billion to less than $100 million. About half of the respondents reported budgets of more than $1 billion, and one-third reported budgets of $100 million to $1 billion. This report provides a high-level summary of the survey results. For detailed results, including the sample size by question, please see the Detailed Survey Results section beginning on page 9.
WorldatWork and Vivient Consulting | 2 “Incentive Pay Practices: Nonprofit/Government Organizations”
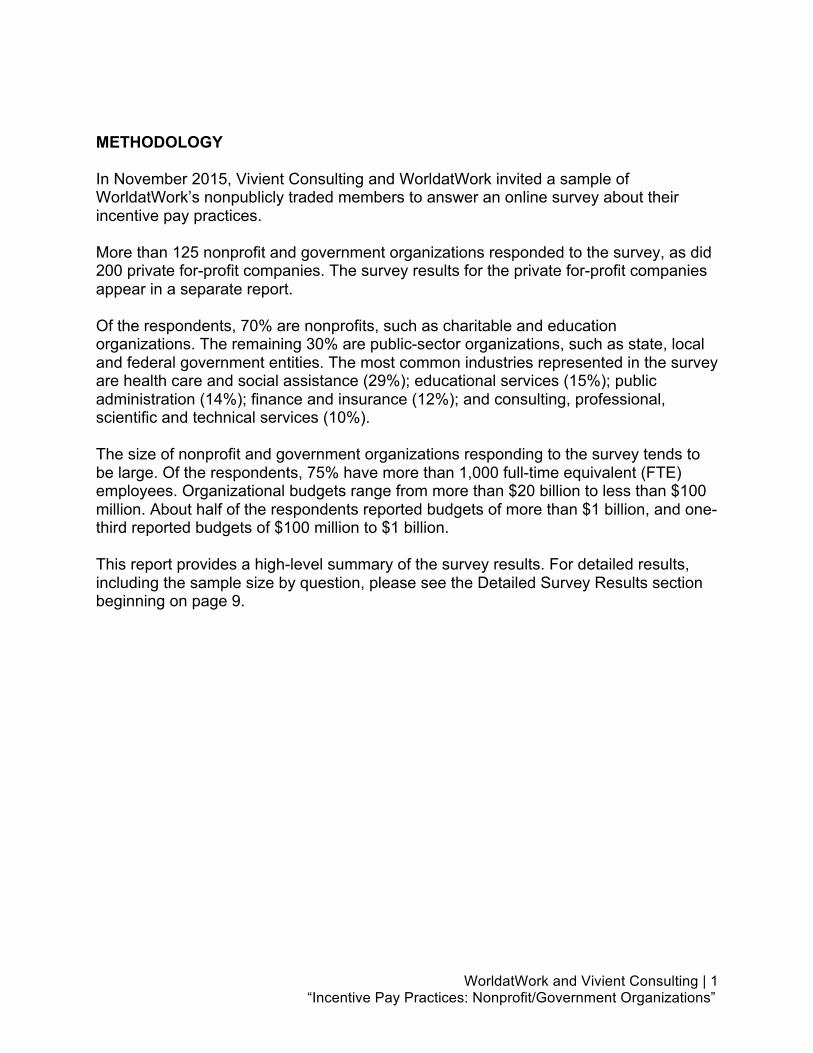
OVERVIEW U.S. nonprofit and government organizations continue to make significant use of short-term cash incentives to motivate and reward employees, according to the 2016 Vivient Consulting and WorldatWork survey of incentive compensation programs at these organizations. Short-term cash incentives are more prevalent at nonprofits than at government organizations, and the incentive budgets are larger. Long-term incentive usage continues to be rare at both types of organizations. The incentive compensation survey was first conducted in 2007 and targeted private companies. It was conducted again in 2011, where nonprofit and government participation grew. In 2013, Vivient and WorldatWork created a special report for these organizations because of the increasing interest in incentive pay practices. This is the second iteration of that report. Short-term incentive (STI) and long-term incentive (LTI) usage have remained steady at nonprofits and government organizations over the past two years.
Graph 1
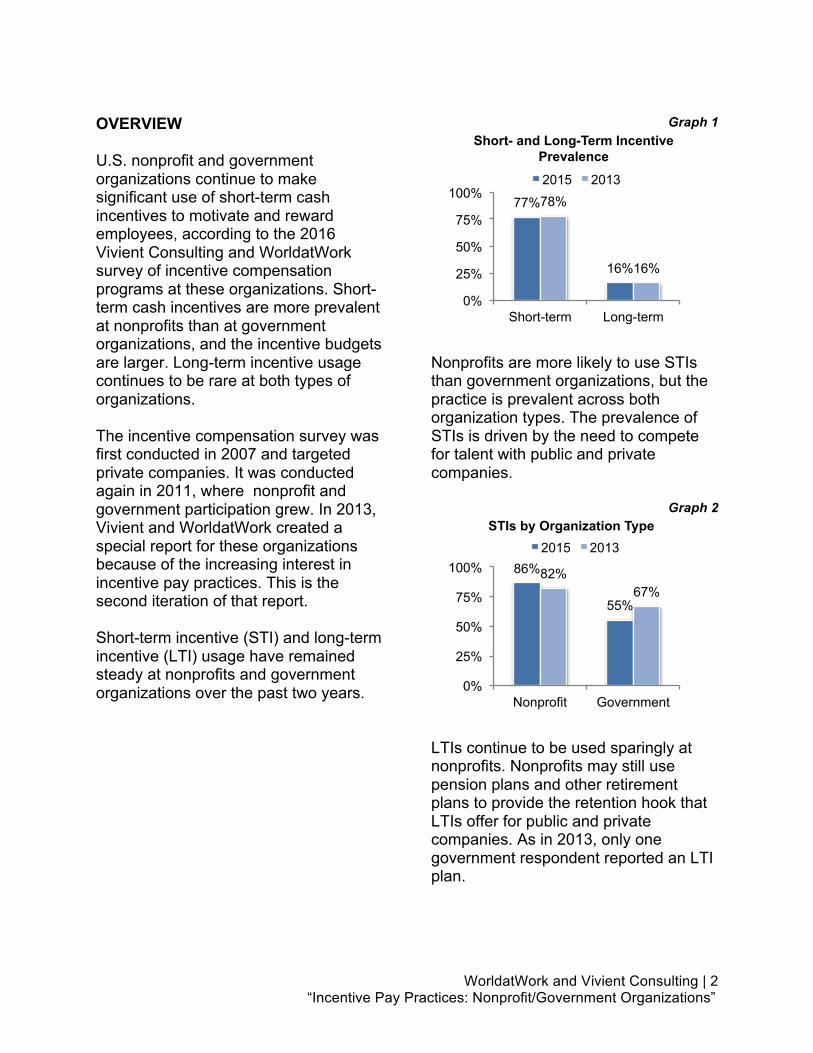
Nonprofits are more likely to use STIs than government organizations, but the practice is prevalent across both organization types. The prevalence of STIs is driven by the need to compete for talent with public and private companies.
Graph 2
LTIs continue to be used sparingly at nonprofits. Nonprofits may still use pension plans and other retirement plans to provide the retention hook that LTIs offer for public and private companies. As in 2013, only one government respondent reported an LTI plan.
77%
16%
78%
16%
0%
25%
50%
75%
100%
Short-term Long-term
Short- and Long-Term Incentive Prevalence
2015 2013
86%
55%
82% 67%
0%
25%
50%
75%
100%
Nonprofit Government
STIs by Organization Type 2015 2013
WorldatWork and Vivient Consulting | 3 “Incentive Pay Practices: Nonprofit/Government Organizations”
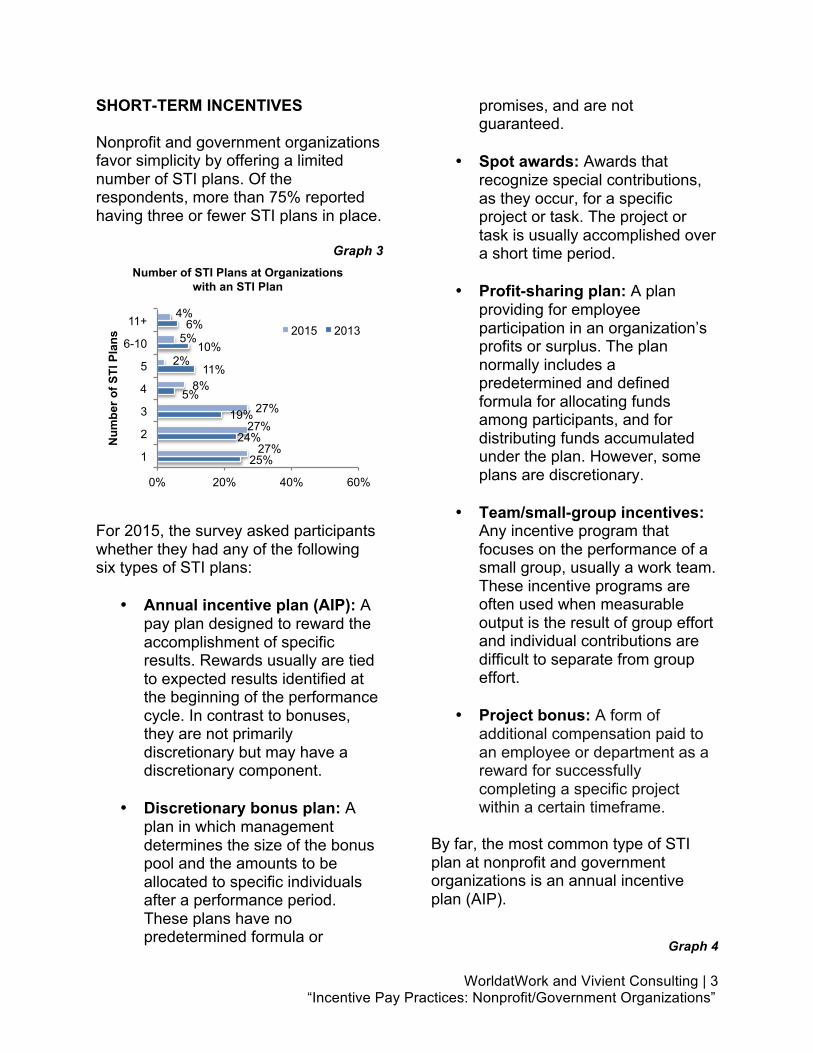
SHORT-TERM INCENTIVES Nonprofit and government organizations favor simplicity by offering a limited number of STI plans. Of the respondents, more than 75% reported having three or fewer STI plans in place.
Graph 3
For 2015, the survey asked participants whether they had any of the following six types of STI plans:
• Annual incentive plan (AIP): A pay plan designed to reward the accomplishment of specific results. Rewards usually are tied to expected results identified at the beginning of the performance cycle. In contrast to bonuses, they are not primarily discretionary but may have a discretionary component.
• Discretionary bonus plan: A
plan in which management determines the size of the bonus pool and the amounts to be allocated to specific individuals after a performance period. These plans have no predetermined formula or
promises, and are not guaranteed.
• Spot awards: Awards that
recognize special contributions, as they occur, for a specific project or task. The project or task is usually accomplished over a short time period.
• Profit-sharing plan: A plan
providing for employee participation in an organization’s profits or surplus. The plan normally includes a predetermined and defined formula for allocating funds among participants, and for distributing funds accumulated under the plan. However, some plans are discretionary.
• Team/small-group incentives:
Any incentive program that focuses on the performance of a small group, usually a work team. These incentive programs are often used when measurable output is the result of group effort and individual contributions are difficult to separate from group effort.
• Project bonus: A form of
additional compensation paid to an employee or department as a reward for successfully completing a specific project within a certain timeframe.
By far, the most common type of STI plan at nonprofit and government organizations is an annual incentive plan (AIP).
Graph 4
25%
24%
19%
5%
11%
10%
6%
27%
27% 27%
8%
2%
5%
4%
0% 20% 40% 60%
1
2
3
4
5
6-10
11+
Num
ber o
f STI
Pla
ns
Number of STI Plans at Organizations with an STI Plan
2015 2013
WorldatWork and Vivient Consulting | 4 “Incentive Pay Practices: Nonprofit/Government Organizations”
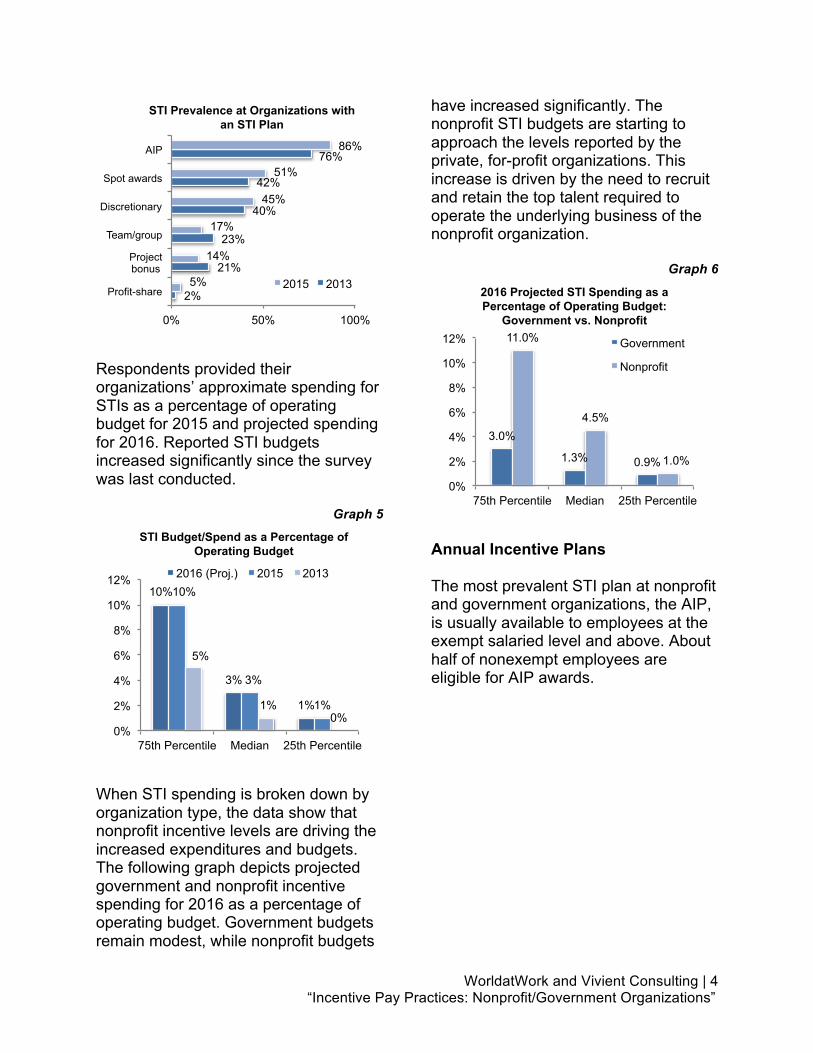
Respondents provided their organizations’ approximate spending for STIs as a percentage of operating budget for 2015 and projected spending for 2016. Reported STI budgets increased significantly since the survey was last conducted.
Graph 5
When STI spending is broken down by organization type, the data show that nonprofit incentive levels are driving the increased expenditures and budgets. The following graph depicts projected government and nonprofit incentive spending for 2016 as a percentage of operating budget. Government budgets remain modest, while nonprofit budgets
have increased significantly. The nonprofit STI budgets are starting to approach the levels reported by the private, for-profit organizations. This increase is driven by the need to recruit and retain the top talent required to operate the underlying business of the nonprofit organization.
Graph 6
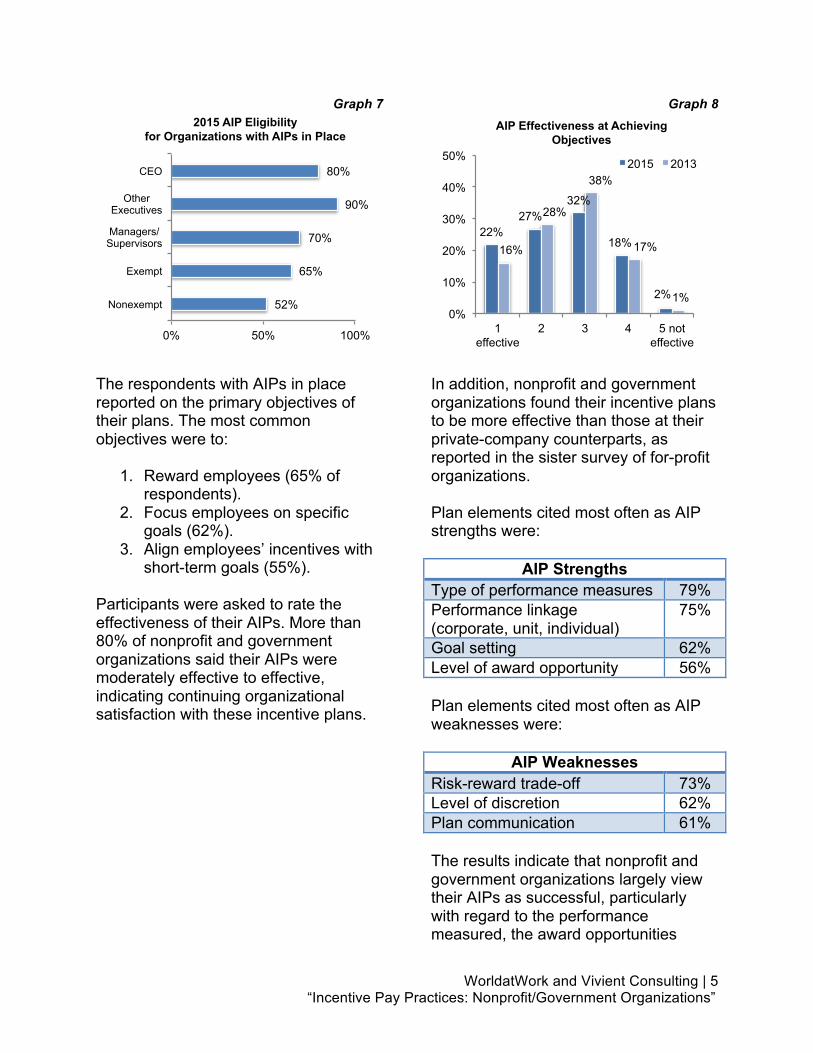
Annual Incentive Plans The most prevalent STI plan at nonprofit and government organizations, the AIP, is usually available to employees at the exempt salaried level and above. About half of nonexempt employees are eligible for AIP awards.
2%
21%
23%
40%
42%
76%
5%
14%
17%
45%
51%
86%
0% 50% 100%
Profit-share
Project bonus
Team/group
Discretionary
Spot awards
AIP
STI Prevalence at Organizations with an STI Plan
2015 2013
10%
3%
1%
10%
3%
1%
5%
1% 0%
0%
2%
4%
6%
8%
10%
12%
75th Percentile Median 25th Percentile
STI Budget/Spend as a Percentage of Operating Budget
2016 (Proj.) 2015 2013
3.0%
1.3% 0.9%
11.0%
4.5%
1.0%
0%
2%
4%
6%
8%
10%
12%
75th Percentile Median 25th Percentile
2016 Projected STI Spending as a Percentage of Operating Budget:
Government vs. Nonprofit
Government
Nonprofit
WorldatWork and Vivient Consulting | 5 “Incentive Pay Practices: Nonprofit/Government Organizations”
Graph 7
The respondents with AIPs in place reported on the primary objectives of their plans. The most common objectives were to:
1. Reward employees (65% of respondents).
2. Focus employees on specific goals (62%).
3. Align employees’ incentives with short-term goals (55%).
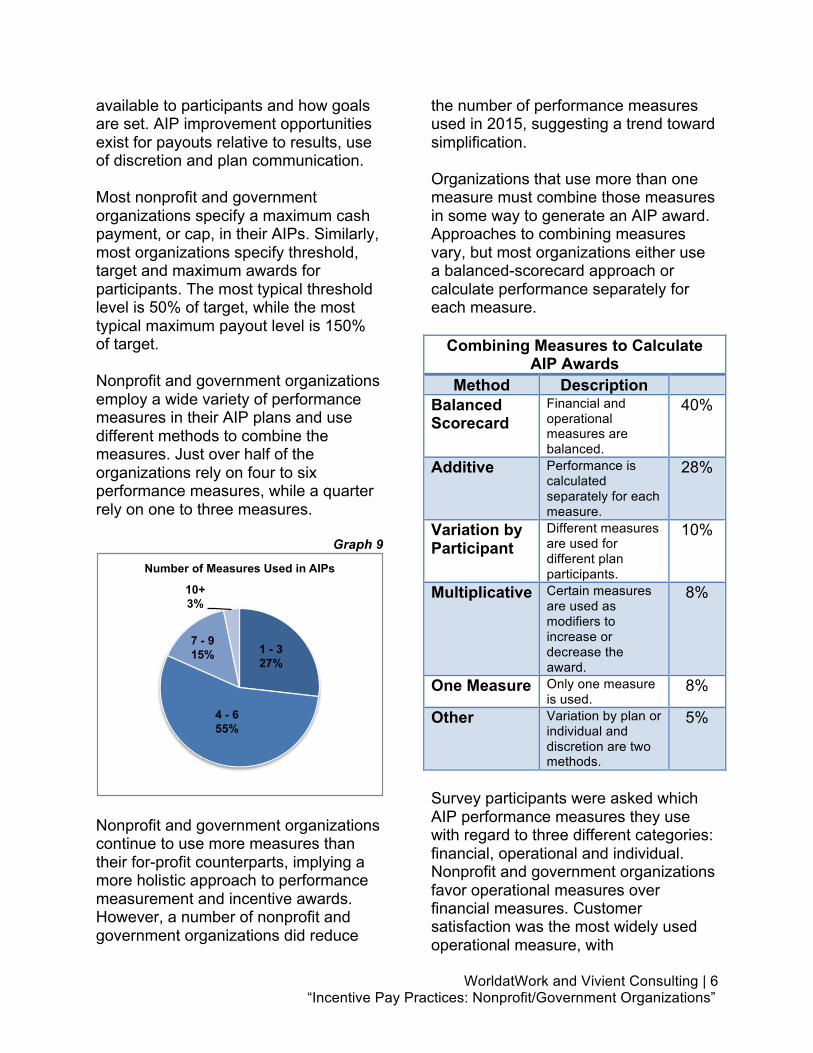
Participants were asked to rate the effectiveness of their AIPs. More than 80% of nonprofit and government organizations said their AIPs were moderately effective to effective, indicating continuing organizational satisfaction with these incentive plans.
Graph 8
In addition, nonprofit and government organizations found their incentive plans to be more effective than those at their private-company counterparts, as reported in the sister survey of for-profit organizations. Plan elements cited most often as AIP strengths were:
AIP Strengths Type of performance measures 79% Performance linkage (corporate, unit, individual)
75%
Goal setting 62% Level of award opportunity 56% Plan elements cited most often as AIP weaknesses were:
AIP Weaknesses Risk-reward trade-off 73% Level of discretion 62% Plan communication 61% The results indicate that nonprofit and government organizations largely view their AIPs as successful, particularly with regard to the performance measured, the award opportunities
52%
65%
70%
90%
80%
0% 50% 100%
Nonexempt
Exempt
Managers/Supervisors
Other Executives
CEO
2015 AIP Eligibility for Organizations with AIPs in Place
22% 27%
32%
18%
2%
16%
28%
38%
17%
1% 0%
10%
20%
30%
40%
50%
1 effective
2 3 4 5 not effective
AIP Effectiveness at Achieving Objectives
2015 2013
WorldatWork and Vivient Consulting | 6 “Incentive Pay Practices: Nonprofit/Government Organizations”
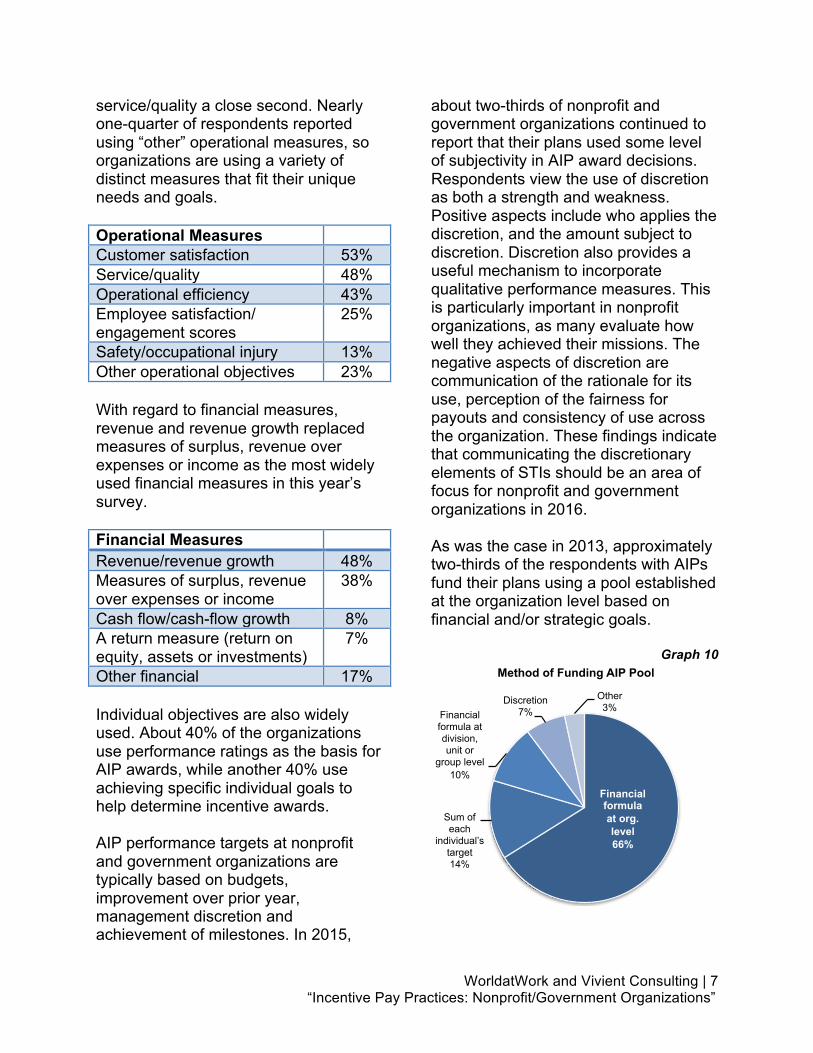
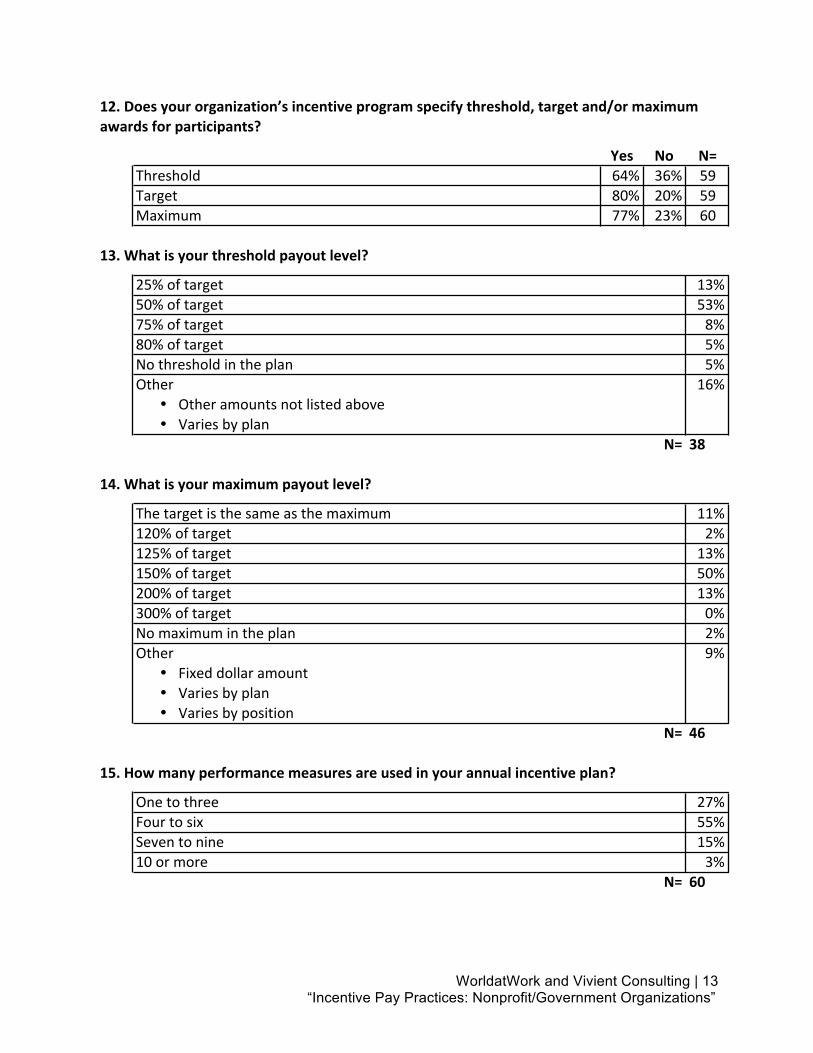
available to participants and how goals are set. AIP improvement opportunities exist for payouts relative to results, use of discretion and plan communication. Most nonprofit and government organizations specify a maximum cash payment, or cap, in their AIPs. Similarly, most organizations specify threshold, target and maximum awards for participants. The most typical threshold level is 50% of target, while the most typical maximum payout level is 150% of target. Nonprofit and government organizations employ a wide variety of performance measures in their AIP plans and use different methods to combine the measures. Just over half of the organizations rely on four to six performance measures, while a quarter rely on one to three measures.
Graph 9
Nonprofit and government organizations continue to use more measures than their for-profit counterparts, implying a more holistic approach to performance measurement and incentive awards. However, a number of nonprofit and government organizations did reduce
the number of performance measures used in 2015, suggesting a trend toward simplification. Organizations that use more than one measure must combine those measures in some way to generate an AIP award. Approaches to combining measures vary, but most organizations either use a balanced-scorecard approach or calculate performance separately for each measure.
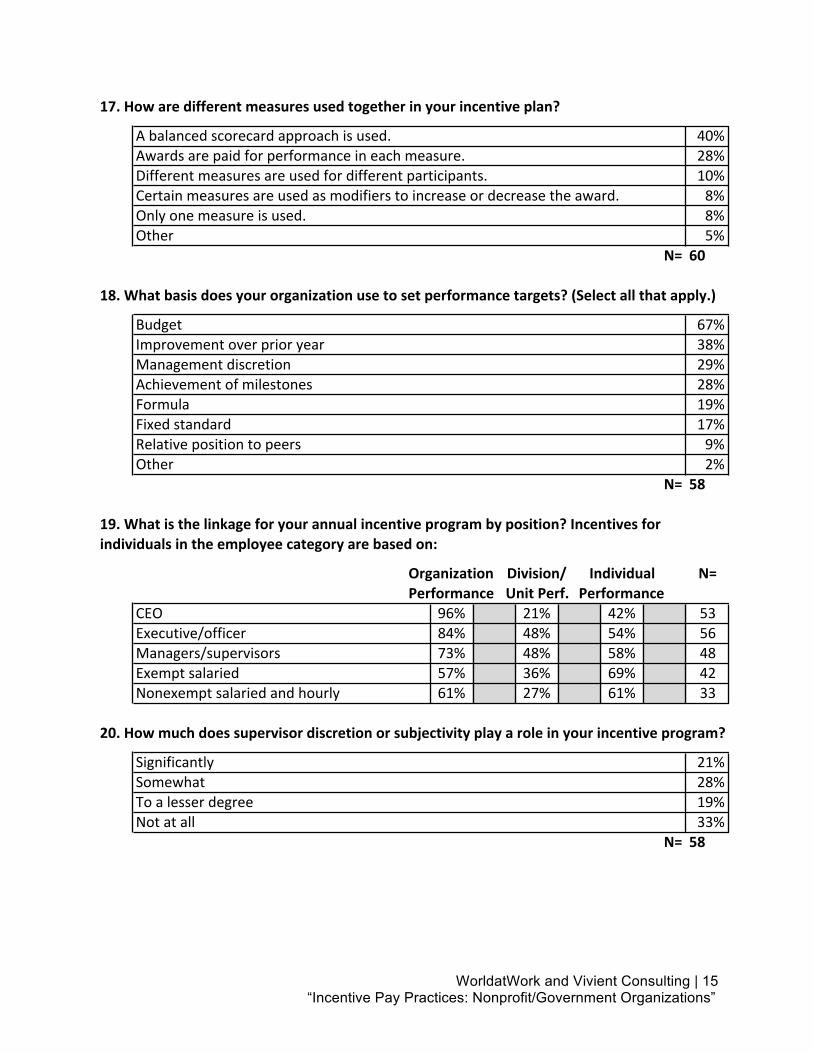
Combining Measures to Calculate AIP Awards
Method Description Balanced Scorecard
Financial and operational measures are balanced.
40%
Additive Performance is calculated separately for each measure.
28%
Variation by Participant
Different measures are used for different plan participants.
10%
Multiplicative Certain measures are used as modifiers to increase or decrease the award.
8%
One Measure Only one measure is used.
8%
Other Variation by plan or individual and discretion are two methods.
5%
Survey participants were asked which AIP performance measures they use with regard to three different categories: financial, operational and individual. Nonprofit and government organizations favor operational measures over financial measures. Customer satisfaction was the most widely used operational measure, with
1 - 3 27%
4 - 6 55%
7 - 9 15%
10+ 3%
Number of Measures Used in AIPs
WorldatWork and Vivient Consulting | 7 “Incentive Pay Practices: Nonprofit/Government Organizations”
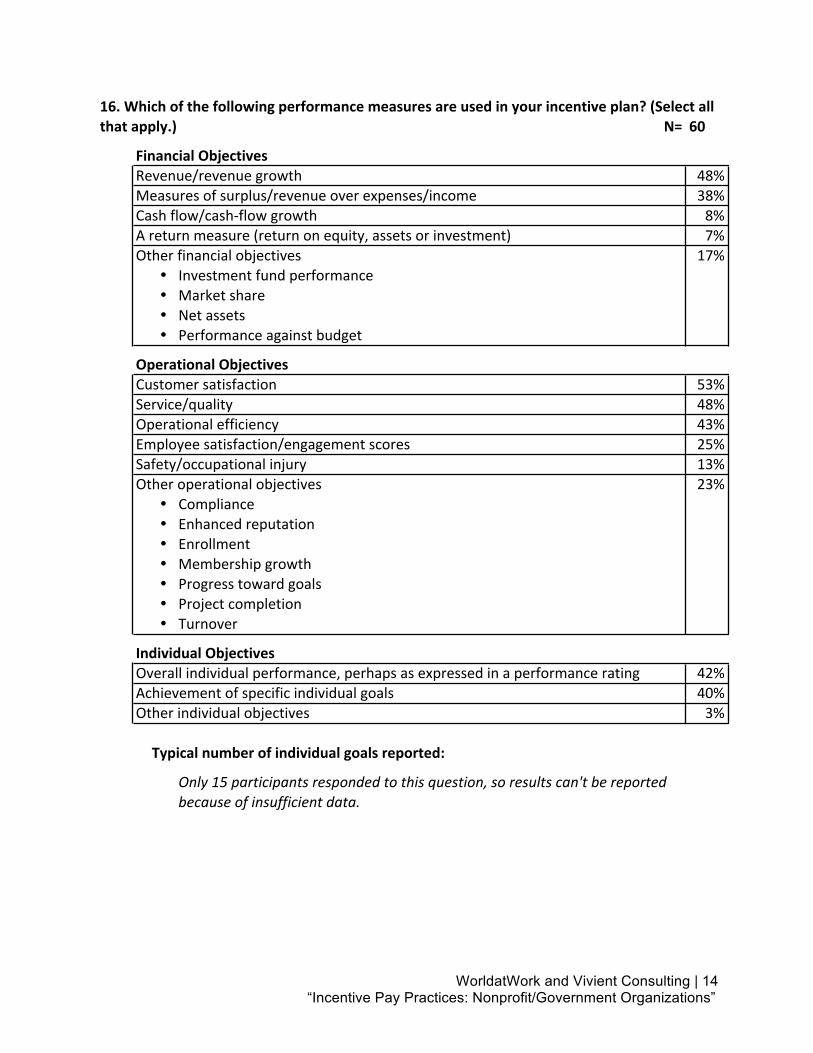
service/quality a close second. Nearly one-quarter of respondents reported using “other” operational measures, so organizations are using a variety of distinct measures that fit their unique needs and goals. Operational Measures Customer satisfaction 53% Service/quality 48% Operational efficiency 43% Employee satisfaction/ engagement scores
25%
Safety/occupational injury 13% Other operational objectives 23% With regard to financial measures, revenue and revenue growth replaced measures of surplus, revenue over expenses or income as the most widely used financial measures in this year’s survey. Financial Measures Revenue/revenue growth 48% Measures of surplus, revenue over expenses or income
38%
Cash flow/cash-flow growth 8% A return measure (return on equity, assets or investments)
7%
Other financial 17% Individual objectives are also widely used. About 40% of the organizations use performance ratings as the basis for AIP awards, while another 40% use achieving specific individual goals to help determine incentive awards. AIP performance targets at nonprofit and government organizations are typically based on budgets, improvement over prior year, management discretion and achievement of milestones. In 2015,
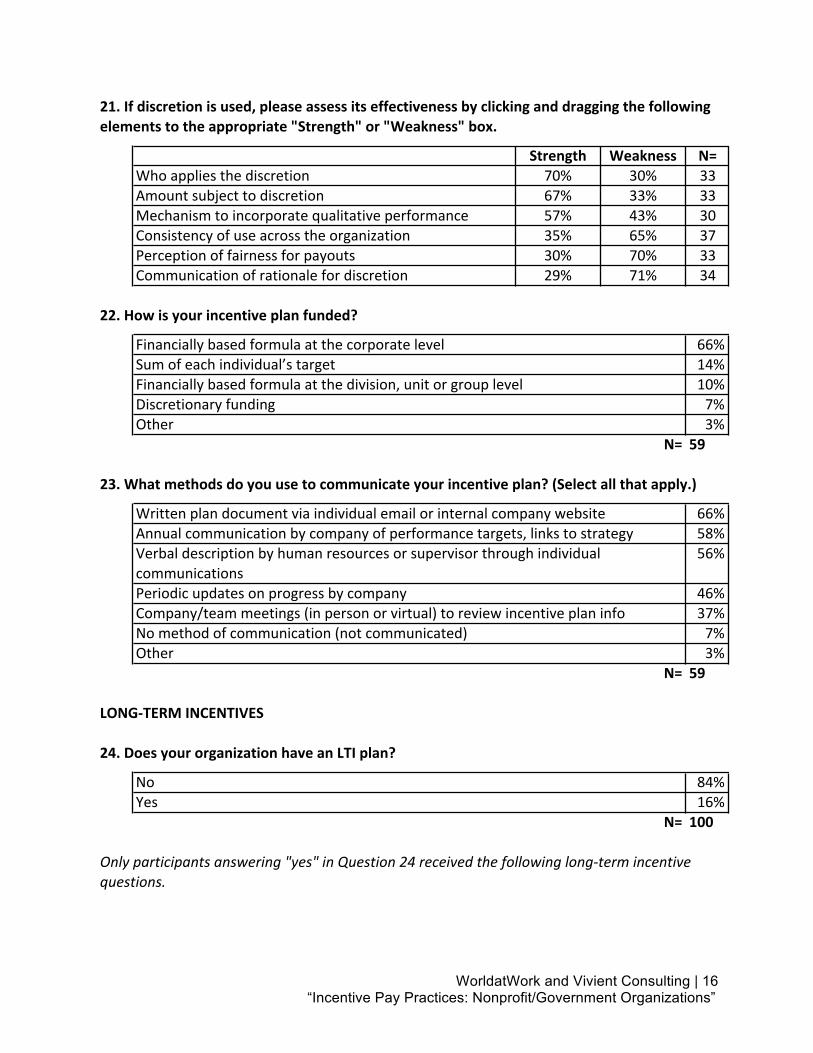
about two-thirds of nonprofit and government organizations continued to report that their plans used some level of subjectivity in AIP award decisions. Respondents view the use of discretion as both a strength and weakness. Positive aspects include who applies the discretion, and the amount subject to discretion. Discretion also provides a useful mechanism to incorporate qualitative performance measures. This is particularly important in nonprofit organizations, as many evaluate how well they achieved their missions. The negative aspects of discretion are communication of the rationale for its use, perception of the fairness for payouts and consistency of use across the organization. These findings indicate that communicating the discretionary elements of STIs should be an area of focus for nonprofit and government organizations in 2016. As was the case in 2013, approximately two-thirds of the respondents with AIPs fund their plans using a pool established at the organization level based on financial and/or strategic goals.
Graph 10
Financial formula at org. level 66%
Sum of each
individual’s target 14%
Financial formula at division, unit or
group level 10%
Discretion 7%
Other 3%
Method of Funding AIP Pool
WorldatWork and Vivient Consulting | 8 “Incentive Pay Practices: Nonprofit/Government Organizations”
LONG-TERM INCENTIVES Long-term incentive (LTI) plans are scarce at nonprofit and government organizations, with only 16% of organizations reporting an LTI plan. The only types of LTI plans reported were performance awards, which include long-term cash and performance units:
• Long-term cash plan: Cash awards where payment is contingent on performance as measured against predetermined financial or strategic objectives over a multiyear period of time (typically three years).
• Performance units: Grants of
dollar-dominated units with value that is contingent on performance against predetermined objectives over a multiyear period of time.
Government organizations rely on retirement plans as a long-term component of compensation, as do nonprofits to a lesser degree. It will be interesting to see if more nonprofits adopt long-term performance award plans — which are basically multiyear bonus plans — in the future.
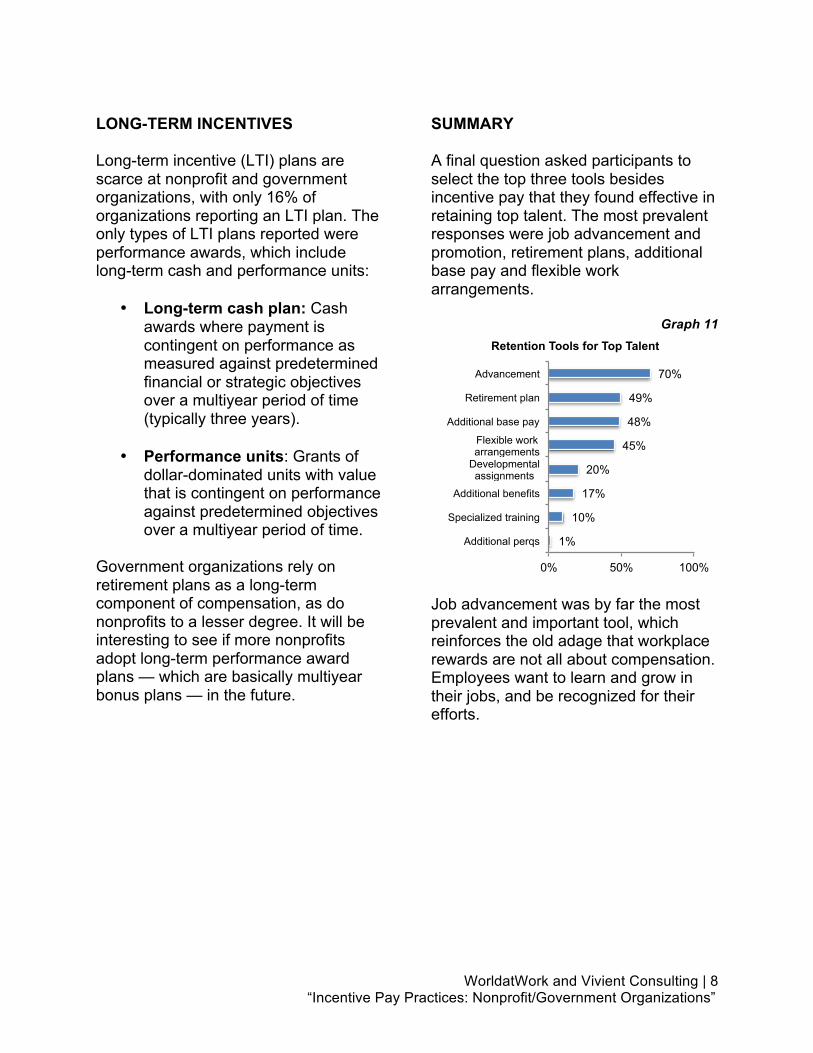
SUMMARY A final question asked participants to select the top three tools besides incentive pay that they found effective in retaining top talent. The most prevalent responses were job advancement and promotion, retirement plans, additional base pay and flexible work arrangements.
Graph 11
Job advancement was by far the most prevalent and important tool, which reinforces the old adage that workplace rewards are not all about compensation. Employees want to learn and grow in their jobs, and be recognized for their efforts.
1%
10%
17%
20%
45%
48%
49%
70%
0% 50% 100%
Additional perqs
Specialized training
Additional benefits
Developmental assignments
Flexible work arrangements
Additional base pay
Retirement plan
Advancement
Retention Tools for Top Talent
WorldatWork and Vivient Consulting | 9 “Incentive Pay Practices: Nonprofit/Government Organizations”
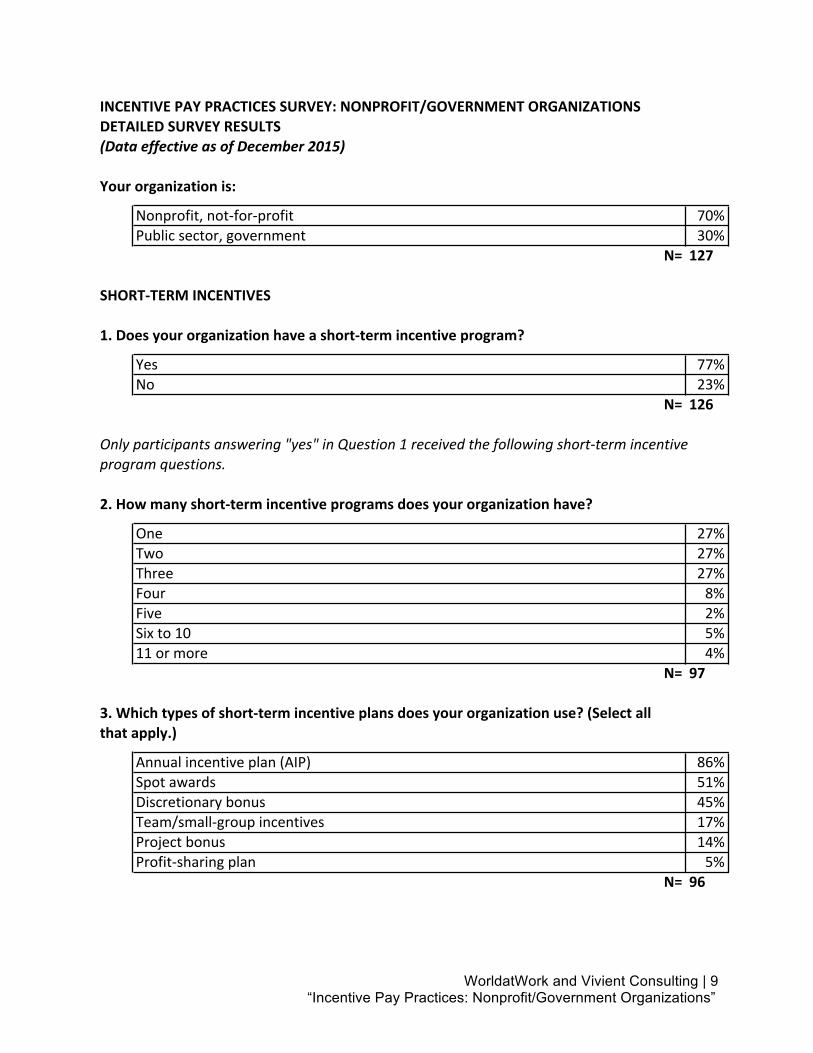
INCENTIVEPAYPRACTICESSURVEY:NONPROFIT/GOVERNMENTORGANIZATIONSDETAILEDSURVEYRESULTS(DataeffectiveasofDecember2015)
Yourorganizationis:
Nonprofit,not-for-profit 89 70%Publicsector,government 38 30%
N= 127
SHORT-TERMINCENTIVES
1.Doesyourorganizationhaveashort-termincentiveprogram?
Yes 97 77%No 29 23%
N= 126
Onlyparticipantsanswering"yes"inQuestion1receivedthefollowingshort-termincentiveprogramquestions.
2.Howmanyshort-termincentiveprogramsdoesyourorganizationhave?
One 26 27%Two 26 27%Three 26 27%Four 8 8%Five 2 2%Sixto10 5 5%11ormore 4 4%
N= 97
3.Whichtypesofshort-termincentiveplansdoesyourorganizationuse?(Selectallthatapply.)
Annualincentiveplan(AIP) 83 86%Spotawards 49 51%Discretionarybonus 43 45%Team/small-groupincentives 16 17%Projectbonus 13 14%Profit-sharingplan 5 5%Blank 31 N= 96
WorldatWork and Vivient Consulting | 10 “Incentive Pay Practices: Nonprofit/Government Organizations”
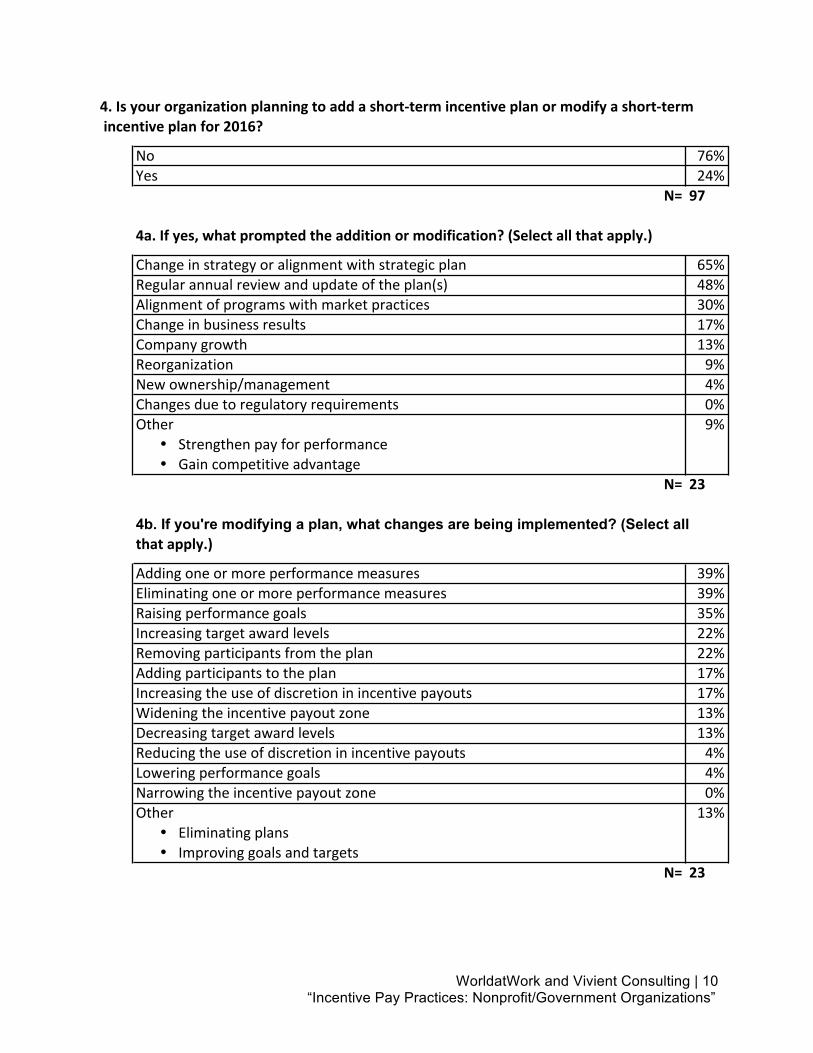
4.Isyourorganizationplanningtoaddashort-termincentiveplanormodifyashort-termincentiveplanfor2016?
No 74 76%Yes 23 24%
N= 97
4a.Ifyes,whatpromptedtheadditionormodification?(Selectallthatapply.)
Changeinstrategyoralignmentwithstrategicplan 15 65%Regularannualreviewandupdateoftheplan(s) 11 48%Alignmentofprogramswithmarketpractices 7 30%Changeinbusinessresults 4 17%Companygrowth 3 13%Reorganization 2 9%Newownership/management 1 4%Changesduetoregulatoryrequirements 0 0%Other 2 9%
� Strengthenpayforperformance� Gaincompetitiveadvantage
Blank 104 N= 23
4b. If you're modifying a plan, what changes are being implemented? (Select allthatapply.)
Addingoneormoreperformancemeasures 9 39%Eliminatingoneormoreperformancemeasures 9 39%Raisingperformancegoals 8 35%Increasingtargetawardlevels 5 22%Removingparticipantsfromtheplan 5 22%Addingparticipantstotheplan 4 17%Increasingtheuseofdiscretioninincentivepayouts 4 17%Wideningtheincentivepayoutzone 3 13%Decreasingtargetawardlevels 3 13%Reducingtheuseofdiscretioninincentivepayouts 1 4%Loweringperformancegoals 1 4%Narrowingtheincentivepayoutzone 0 0%Other 3 13%
� Eliminatingplans� Improvinggoalsandtargets
Blank 104 N= 23
WorldatWork and Vivient Consulting | 11 “Incentive Pay Practices: Nonprofit/Government Organizations”
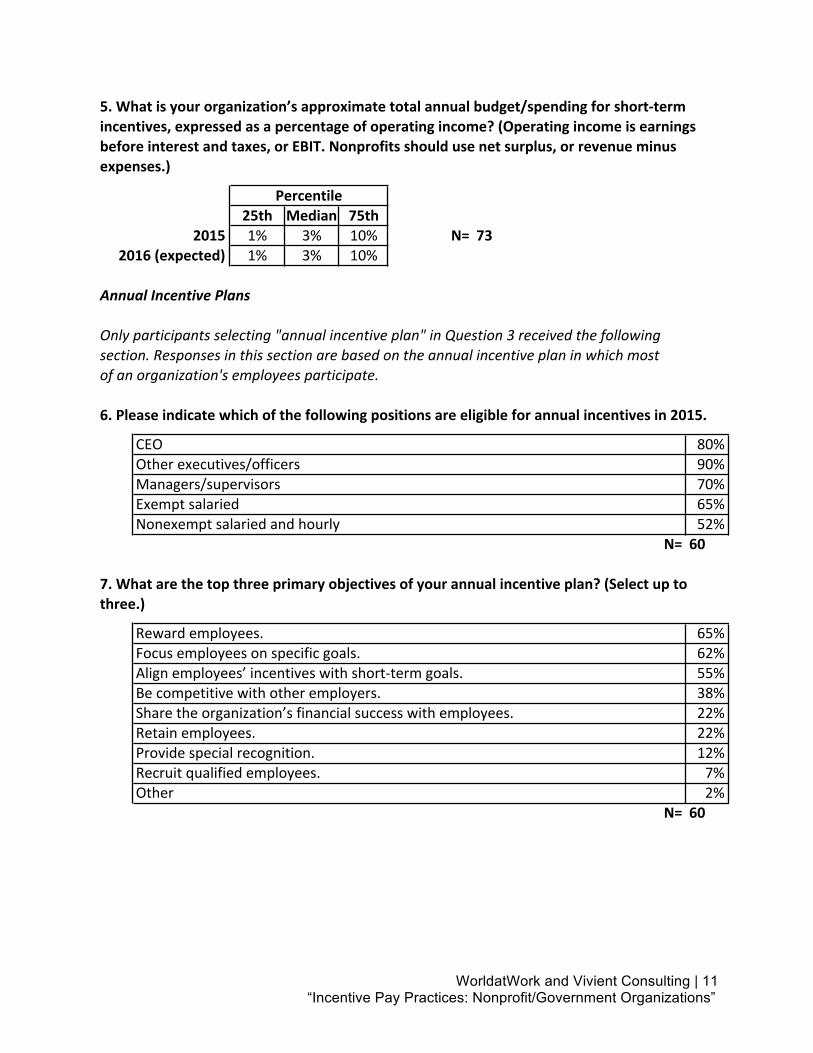
5.Whatisyourorganization’sapproximatetotalannualbudget/spendingforshort-termincentives,expressedasapercentageofoperatingincome?(Operatingincomeisearningsbeforeinterestandtaxes,orEBIT.Nonprofitsshouldusenetsurplus,orrevenueminusexpenses.)
Percentile25th Median 75th Blank
2015 1% 3% 10% 54 N= 732016(expected) 1% 3% 10%
AnnualIncentivePlans
Onlyparticipantsselecting"annualincentiveplan"inQuestion3receivedthefollowingsection.Responsesinthissectionarebasedontheannualincentiveplaninwhichmostofanorganization'semployeesparticipate.
6.Pleaseindicatewhichofthefollowingpositionsareeligibleforannualincentivesin2015.
CEO 48 80%
Otherexecutives/officers 54 90%
Managers/supervisors 42 70%
Exemptsalaried 39 65%
Nonexemptsalariedandhourly 31 52%
Blank 67 N= 60
7.Whatarethetopthreeprimaryobjectivesofyourannualincentiveplan?(Selectuptothree.)
Rewardemployees. 39 65%
Focusemployeesonspecificgoals. 37 62%
Alignemployees’incentiveswithshort-termgoals. 33 55%
Becompetitivewithotheremployers. 23 38%
Sharetheorganization’sfinancialsuccesswithemployees. 13 22%
Retainemployees. 13 22%
Providespecialrecognition. 7 12%
Recruitqualifiedemployees. 4 7%
Other 1 2%
Blank 67 N= 60
WorldatWork and Vivient Consulting | 12 “Incentive Pay Practices: Nonprofit/Government Organizations”
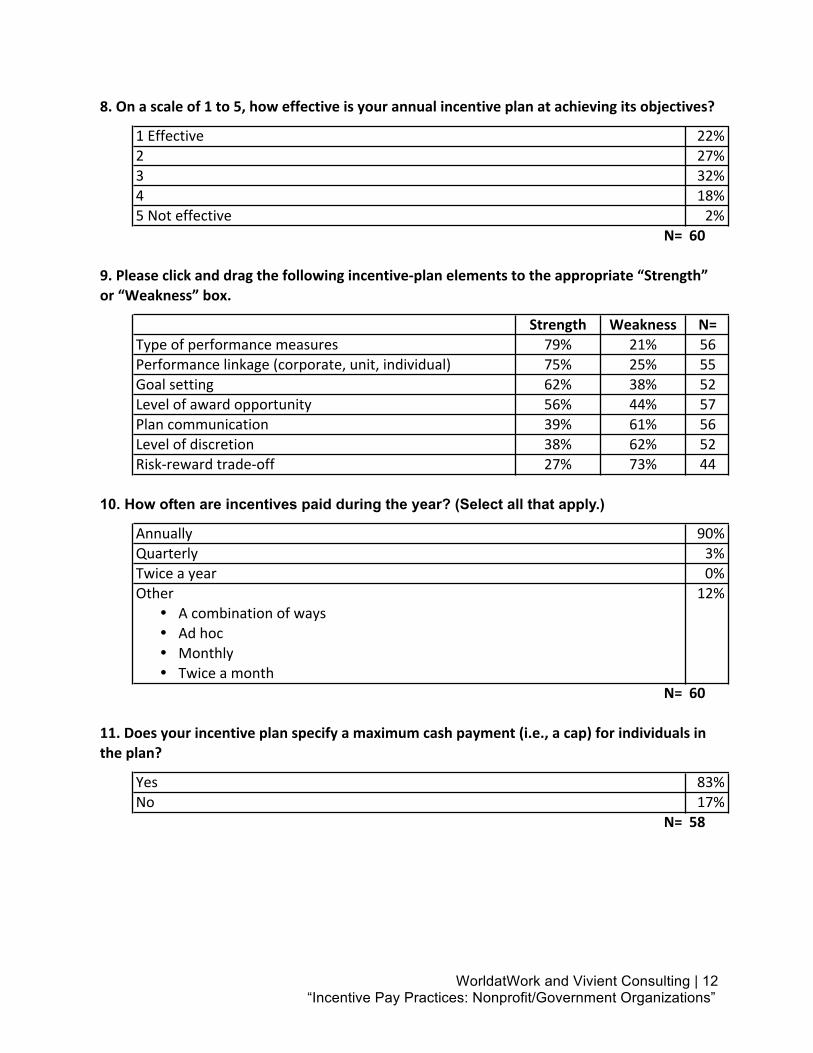
8.Onascaleof1to5,howeffectiveisyourannualincentiveplanatachievingitsobjectives?
1Effective 13 22%2 16 27%3 19 32%4 11 18%5Noteffective 1 2%
N= 60
9.Pleaseclickanddragthefollowingincentive-planelementstotheappropriate“Strength”or“Weakness”box.
Strength Weakness N=Typeofperformancemeasures 79% 21% 56Performancelinkage(corporate,unit,individual) 75% 25% 55Goalsetting 62% 38% 52Levelofawardopportunity 56% 44% 57Plancommunication 39% 61% 56Levelofdiscretion 38% 62% 52Risk-rewardtrade-off 27% 73% 44
10. How often are incentives paid during the year? (Select all that apply.)
Annually 54 90%Quarterly 2 3%Twiceayear 0 0%Other 7 12%
� Acombinationofways� Adhoc� Monthly� Twiceamonth
Blank 67 N= 60
11.Doesyourincentiveplanspecifyamaximumcashpayment(i.e.,acap)forindividualsintheplan?
Yes 48 83%No 10 17%
N= 58
WorldatWork and Vivient Consulting | 13 “Incentive Pay Practices: Nonprofit/Government Organizations”
12.Doesyourorganization’sincentiveprogramspecifythreshold,targetand/ormaximumawardsforparticipants?
Yes No N=Threshold 64% 36% 59Target 80% 20% 59Maximum 77% 23% 60
13.Whatisyourthresholdpayoutlevel?
25%oftarget 5 13%50%oftarget 20 53%75%oftarget 3 8%80%oftarget 2 5%Nothresholdintheplan 2 5%Other 6 16%
� Otheramountsnotlistedabove� Variesbyplan
N= 38
14.Whatisyourmaximumpayoutlevel?
Thetargetisthesameasthemaximum 5 11%120%oftarget 1 2%125%oftarget 6 13%150%oftarget 23 50%200%oftarget 6 13%300%oftarget 0 0%Nomaximumintheplan 1 2%Other 4 9%
� Fixeddollaramount� Variesbyplan� Variesbyposition
N= 46
15.Howmanyperformancemeasuresareusedinyourannualincentiveplan?
Onetothree 16 27%Fourtosix 33 55%Seventonine 9 15%10ormore 2 3%
N= 60
WorldatWork and Vivient Consulting | 14 “Incentive Pay Practices: Nonprofit/Government Organizations”
16.Whichofthefollowingperformancemeasuresareusedinyourincentiveplan?(Selectallthatapply.) N= 60
FinancialObjectivesRevenue/revenuegrowth 29 48%Measuresofsurplus/revenueoverexpenses/income 23 38%Cashflow/cash-flowgrowth 5 8%Areturnmeasure(returnonequity,assetsorinvestment) 4 7%Otherfinancialobjectives 10 17%
� Investmentfundperformance� Marketshare� Netassets� Performanceagainstbudget
OperationalObjectivesCustomersatisfaction 32 53%Service/quality 29 48%Operationalefficiency 26 43%Employeesatisfaction/engagementscores 15 25%Safety/occupationalinjury 8 13%Otheroperationalobjectives 14 23%
� Compliance� Enhancedreputation� Enrollment� Membershipgrowth� Progresstowardgoals� Projectcompletion� Turnover
IndividualObjectivesOverallindividualperformance,perhapsasexpressedinaperformancerating 25 42%Achievementofspecificindividualgoals 24 40%Otherindividualobjectives 2 3%
Typicalnumberofindividualgoalsreported:
Only15participantsrespondedtothisquestion,soresultscan'tbereportedbecauseofinsufficientdata.
WorldatWork and Vivient Consulting | 15 “Incentive Pay Practices: Nonprofit/Government Organizations”
17.Howaredifferentmeasuresusedtogetherinyourincentiveplan?
Abalancedscorecardapproachisused. 24 40%Awardsarepaidforperformanceineachmeasure. 17 28%Differentmeasuresareusedfordifferentparticipants. 6 10%Certainmeasuresareusedasmodifierstoincreaseordecreasetheaward. 5 8%Onlyonemeasureisused. 5 8%Other 3 5%
N= 60
18.Whatbasisdoesyourorganizationusetosetperformancetargets?(Selectallthatapply.)
Budget 39 67%Improvementoverprioryear 22 38%Managementdiscretion 17 29%Achievementofmilestones 16 28%Formula 11 19%Fixedstandard 10 17%Relativepositiontopeers 5 9%Other 1 2%Blank 69 N= 58
19.Whatisthelinkageforyourannualincentiveprogrambyposition?Incentivesforindividualsintheemployeecategoryarebasedon:
Organization Division/ Individual N=Performance UnitPerf. Performance
CEO 96% 21% 42% 53Executive/officer 84% 48% 54% 56Managers/supervisors 73% 48% 58% 48Exemptsalaried 57% 36% 69% 42Nonexemptsalariedandhourly 61% 27% 61% 33
20.Howmuchdoessupervisordiscretionorsubjectivityplayaroleinyourincentiveprogram?
Significantly 12 21%Somewhat 16 28%Toalesserdegree 11 19%Notatall 19 33%
N= 58
WorldatWork and Vivient Consulting | 16 “Incentive Pay Practices: Nonprofit/Government Organizations”
21.Ifdiscretionisused,pleaseassessitseffectivenessbyclickinganddraggingthefollowingelementstotheappropriate"Strength"or"Weakness"box.
Strength Weakness N=Whoappliesthediscretion 70% 30% 33Amountsubjecttodiscretion 67% 33% 33Mechanismtoincorporatequalitativeperformance 57% 43% 30Consistencyofuseacrosstheorganization 35% 65% 37Perceptionoffairnessforpayouts 30% 70% 33Communicationofrationalefordiscretion 29% 71% 34
22.Howisyourincentiveplanfunded?
Financiallybasedformulaatthecorporatelevel 39 66%Sumofeachindividual’starget 8 14%Financiallybasedformulaatthedivision,unitorgrouplevel 6 10%Discretionaryfunding 4 7%Other 2 3%
N= 59
23.Whatmethodsdoyouusetocommunicateyourincentiveplan?(Selectallthatapply.)
Writtenplandocumentviaindividualemailorinternalcompanywebsite 39 66%Annualcommunicationbycompanyofperformancetargets,linkstostrategy 34 58%Verbaldescriptionbyhumanresourcesorsupervisorthroughindividual 33 56%communicationsPeriodicupdatesonprogressbycompany 27 46%Company/teammeetings(inpersonorvirtual)toreviewincentiveplaninfo 22 37%Nomethodofcommunication(notcommunicated) 4 7%Other 2 3%Blank 68 N= 59
LONG-TERMINCENTIVES
24.DoesyourorganizationhaveanLTIplan?
No 84 84%Yes 16 16%
N= 100
Onlyparticipantsanswering"yes"inQuestion24receivedthefollowinglong-termincentivequestions.
WorldatWork and Vivient Consulting | 17 “Incentive Pay Practices: Nonprofit/Government Organizations”
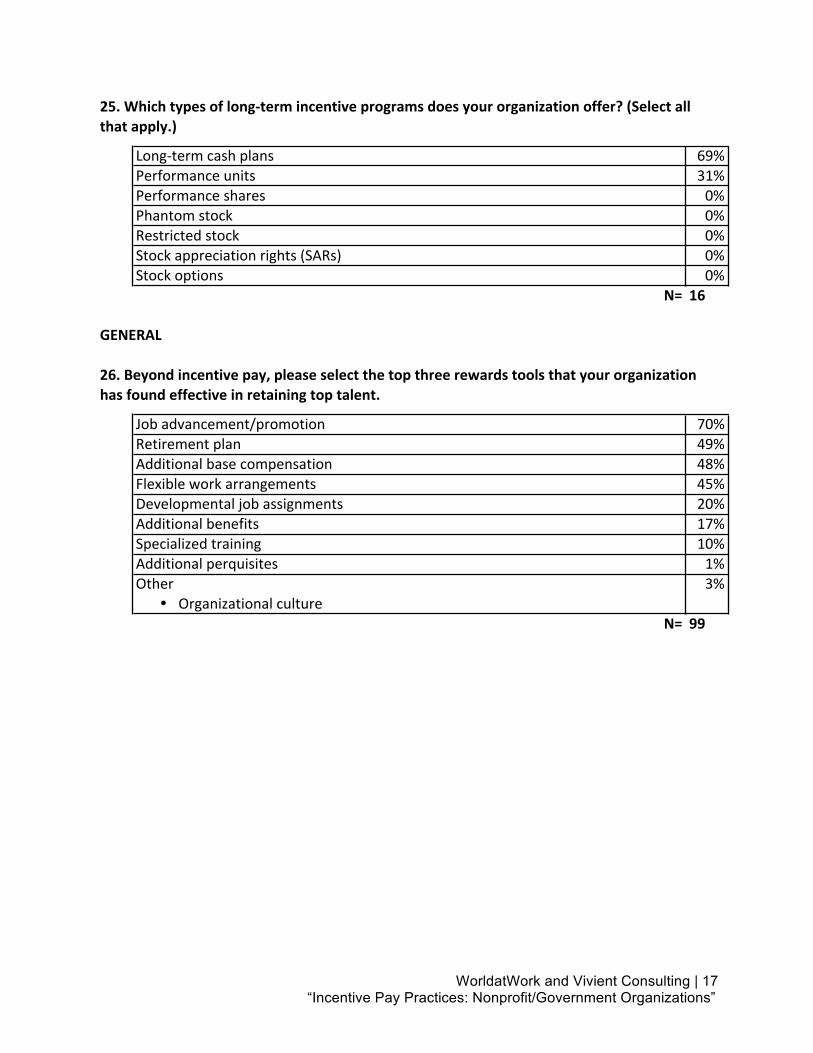
25.Whichtypesoflong-termincentiveprogramsdoesyourorganizationoffer?(Selectallthatapply.)
Long-termcashplans 11 69%Performanceunits 5 31%Performanceshares 0 0%Phantomstock 0 0%Restrictedstock 0 0%Stockappreciationrights(SARs) 0 0%Stockoptions 0 0%Blank 111 N= 16
GENERAL
26.Beyondincentivepay,pleaseselectthetopthreerewardstoolsthatyourorganizationhasfoundeffectiveinretainingtoptalent.
Jobadvancement/promotion 69 70%Retirementplan 49 49%Additionalbasecompensation 48 48%Flexibleworkarrangements 45 45%Developmentaljobassignments 20 20%Additionalbenefits 17 17%Specializedtraining 10 10%Additionalperquisites 1 1%Other 3 3%
� OrganizationalcultureBlank 28 N= 99
WorldatWork and Vivient Consulting | 18 “Incentive Pay Practices: Nonprofit/Government Organizations”
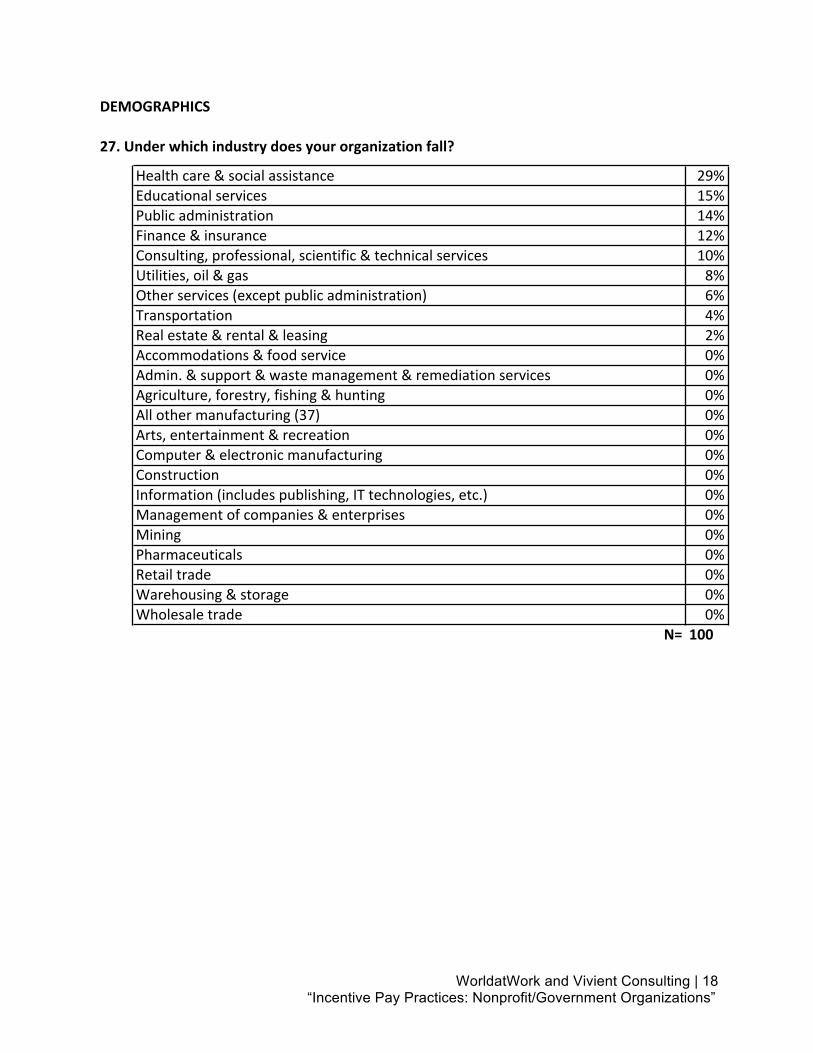
DEMOGRAPHICS
27.Underwhichindustrydoesyourorganizationfall?
Healthcare&socialassistance 29 29%Educationalservices 15 15%Publicadministration 14 14%Finance&insurance 12 12%Consulting,professional,scientific&technicalservices 10 10%Utilities,oil&gas 8 8%Otherservices(exceptpublicadministration) 6 6%Transportation 4 4%Realestate&rental&leasing 2 2%Accommodations&foodservice 0 0%Admin.&support&wastemanagement&remediationservices 0 0%Agriculture,forestry,fishing&hunting 0 0%Allothermanufacturing(37) 0 0%Arts,entertainment&recreation 0 0%Computer&electronicmanufacturing 0 0%Construction 0 0%Information(includespublishing,ITtechnologies,etc.) 0 0%Managementofcompanies&enterprises 0 0%Mining 0 0%Pharmaceuticals 0 0%Retailtrade 0 0%Warehousing&storage 0 0%Wholesaletrade 0 0%
N= 100
WorldatWork and Vivient Consulting | 19 “Incentive Pay Practices: Nonprofit/Government Organizations”
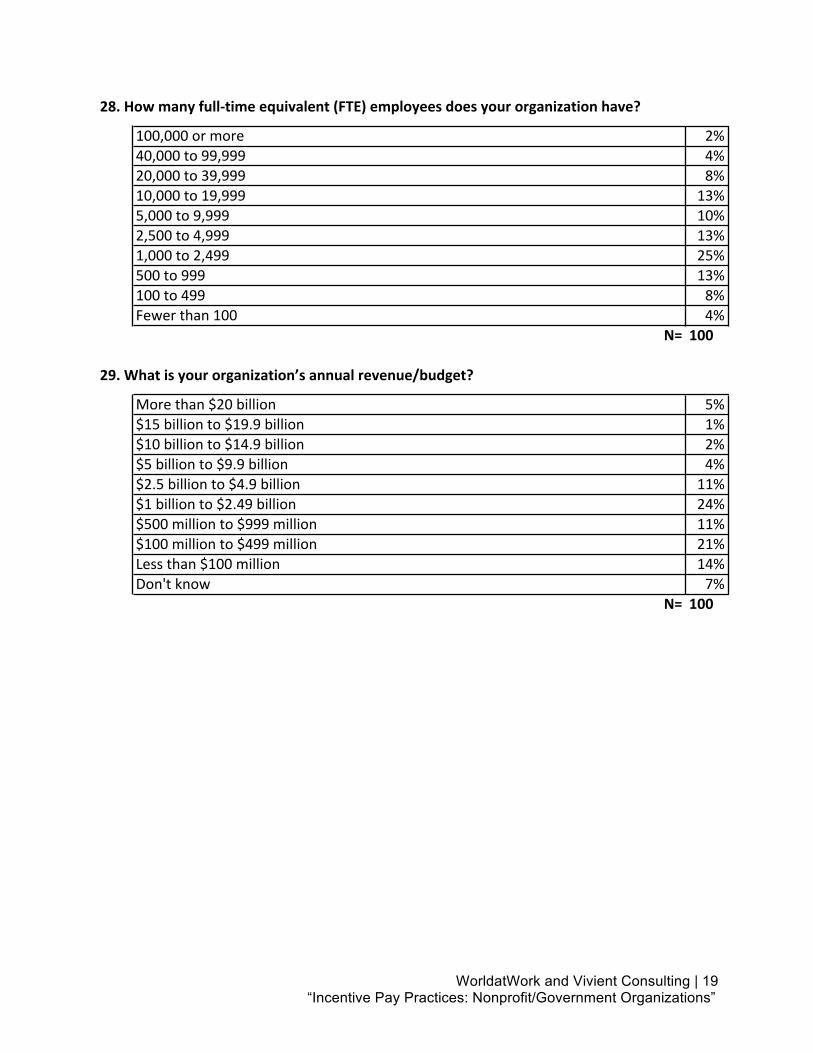
28.Howmanyfull-timeequivalent(FTE)employeesdoesyourorganizationhave?
100,000ormore 2 2%40,000to99,999 4 4%20,000to39,999 8 8%10,000to19,999 13 13%5,000to9,999 10 10%2,500to4,999 13 13%1,000to2,499 25 25%500to999 13 13%100to499 8 8%Fewerthan100 4 4%
N= 100
29.Whatisyourorganization’sannualrevenue/budget?
Morethan$20billion 5 5%$15billionto$19.9billion 1 1%$10billionto$14.9billion 2 2%$5billionto$9.9billion 4 4%$2.5billionto$4.9billion 11 11%$1billionto$2.49billion 24 24%$500millionto$999million 11 11%$100millionto$499million 21 21%Lessthan$100million 14 14%Don'tknow 7 7%
N= 100
WorldatWork and Vivient Consulting | 20 “Incentive Pay Practices: Nonprofit/Government Organizations”
Participating Organizations AAA National Office Affinity Health Plan AlloSource American Red Cross Arapahoe County Government Ascension Health Blue Cross Blue Shield of Minnesota Brown University Cape Cod Healthcare Inc. Choctaw Nation of Oklahoma City of Naperville City of Seattle Clemson University County of Kent Delta Dental Plan of Michigan Denver Public Schools Economic Resources Corp. EmblemHealth Emory Healthcare Employers Resource Association Energy Northwest Fallon Health Federal Housing Finance Agency Fiat Chrysler Automobiles LLC Geisinger Health System General Board of Pension and Health Benefits of The UMC Harrisburg Area Community College Idaho National Laboratory Indiana State University IRC JEA Lancaster General Health LL Global MaineGeneral Health Maricopa County Maryland Department of Transportation Memphis Light, Gas and Water Milwaukee County MidMichigan Health Mountain America Credit Union
MRA - The Management Association Northwestern University NRUCFC NSF International OhioHealth Omaha Public Power District Orange County Transportation Authority Oregon Health & Science University Otterbein Homes Port of Seattle Princeton University Providence Health & Services Provincial Government of BC Salt River Project Security Service Federal Credit Union Spectrum Health SRC Inc. St. Mary's Hospital Madison State of New Mexico Summa Health Sutter Health Teacher Retirement System of Texas Texas Mutual Insurance The Johns Hopkins U/Applied Physics Laboratory The University of Alabama at Birmingham The University of Texas Health Science Center at San Antonio UMass Memorial Health Care Union County Local Government University of Dayton University of Notre Dame University of Pennsylvania Village of Glenview Washington Metro Area Transit Authority Wellstar Health System

![TZ PUBLIC SERVICE PAY AND INCENTIVE POLICY.[1] · PDF filePUBLIC SERVICE PAY AND INCENTIVE POLICY ... 1.3 The Medium Term Pay Policy ... To adopt a compensation structure where allowances](https://img.pdfslide.net/doc/110x75/5ab933e67f8b9ac10d8de8de/tz-public-service-pay-and-incentive-policy1-service-pay-and-incentive-policy.jpg)


![Incentive pay and productivity[4]](https://img.pdfslide.net/doc/110x75/577d2f201a28ab4e1eb0dd23/incentive-pay-and-productivity4.jpg)