Embed Size (px)
Citation preview
1
Incentives and Firms’ Productivity: Exploring Multidimensional Fiscal Incentives in a
Developing Country
EFOBI UCHENNA Rapuluchukwu1, TANANKEM VOUFO Belmondo2 and
BEECROFT Ibukun 3
Abstract
This paper investigates the impact of fiscal incentives on firms’ productivity using
Cameroonian firms as a case. We use data from the World Bank Enterprise Survey for over
300 firms to calculate the productivity of firms. The Enterprise Survey also contains unique
measures of assessing firms’ beneficiary status from different categories of fiscal incentives
such as import duty exemption, profit tax exemption and export financing. The availability of
these measures at the firm level allows us to conduct an impact analysis using the propensity
score matching technique. Our results show a significant and positive impact of the
productivity of firms that benefit from profit tax exemption and export financing. However,
when considering import duty exemption, the significance of this variable was not consistent.
The paper thus provides support for the argument that the government’s involvement in the
firm should be targeted at rewarding outputs and not supporting processes, and thus provides
an essential element of a strategy for industrialisation.
JEL Code: F13. 038. 053
1 College of Business and Social Sciences, Covenant University, Nigeria. Email-
[email protected] 2 Ministry of Economy, Planning and Regional Development – Cameroon, Department of Analysis and
Economic Policies. Email – [email protected] 3 Department of Economics, Covenant University, Nigeria, Ghana. Email -
2
Incentives and Firms’ Productivity: Exploring Multidimensional Fiscal Incentives in a
Developing Country
1. Introduction
Industrialisation culminates from the sustenance of the productivity of firms over a period. It
implies the value addition on factor input and its efficiency, where additional input should
yield more firm output. It is expected that with increasing industrialisation, the cumulative
effect be seen in the creation of jobs for sustained growth and economic diversification. More
so, industrialisation brings about increased household consumption through improvement in
the value of product and price efficiency, and the development of other primary sectors
through backward linkages that come with the demand for intermediate goods. Despite these
identified benefits, most African countries have relied heavily on primary products as their
main export commodity (UNECA, 2013) and the productivity of other sectors (apart from the
primary sector- i.e. agriculture) have remained a source of concern to both the policy and
research community. For instance, there have been several calls for structural transformation
of African economies from low value-added activities and sectors to higher value-addition
(IMF, 2012).
To sustain this transformation, some studies have sought to identify appropriate and
alternative source of funding (see Gui-Diby and Renard, 2015), focus on improving the
institutional structure – in terms of corruption (McArthur and Teal, 2002), as well as
encouraging infrastructural development (Arnold, Mattoo and Narciso, 2008; Escribano,
Guasch and Pena, 2010). Among the competing explanations for the sustenance of Africa’s
industrialisation drive, those focusing on public institutions have gathered particular
momentum in recent years, suggesting that the reasons why African countries have not been
able to enjoy industrialisation, despite the presence of some catalysing factors like FDI, is
that the government support is slack and has failed to establish an enabling environment
(Gui-Diby and Renard, 2015). This conclusion points directly to the fact that government
involvement is a precursor for firms’ productivity and sustained industrialisation process in
Africa.
An important aspect of government involvement is incentives, either fiscal or non-fiscal.
Paying attention to fiscal incentives, they include those fiscal measures that are used by the
government to extend some measurable advantages to specific firms or categories of firms
(UNCTAD, 2000; Fletcher, 2002). These may be tax holidays, investment allowances and tax
credits, reduced corporate income taxes, exemption from indirect taxes and export processing
zones. There are arguments explicating the importance of fiscal incentive in improving firms’
productivity. Some proponents argue that under certain conditions, they improve investment,
create jobs and other socio-economic benefits (Bora, 2002). While the opponents believe that
the cost of fiscal incentives (such as deteriorating governance and increasing corruption)
outweighs its benefits (see Cleeve, 2008). Our study is situated along the proponents, noting
that fiscal incentives can compensate for possible market failures, and can easily be
implemented by African governments for achieving their industrialisation drive. Some
African countries are already considering this as a viable policy option. For instance, the
Nigerian Government has continued over the years to provide some tax incentives to improve
investments into various sectors of the economy (Central Bank of Nigeria-CBN, 2013). The
Ghanaian Government is involved in granting rebates for corporate income tax of
3
manufacturing firms located in some specific regions of the country, carry-forward losses for
up to five years, investment guarantees and exemption of import duties (Action Aid, 2014).
Also, South Africa, Cameroon, and a host of others apply specific fiscal incentives.
With the increasing commitment of African political leaders to improve the productivity of
investment - via fiscal incentives - it is worthwhile to empirically understand how this action
impacts on the productivity of firms. In this spirit, we investigate how fiscal incentives affect
firms’ productivity, as well as the distributional impact of these incentives across different
categories of fiscal incentives. To achieve this objective, firm level data are gathered from the
World Bank Enterprise Surveys, which consists of survey for over 300 manufacturing firms
in Cameroon. We use information on firm inputs and outputs to calculate productivity of
firms. The enterprise survey also contains unique measures of fiscal incentives such as the
benefits from exemptions from duties on imported inputs, benefit from profit tax exemptions,
VAT reimbursement, benefits from export financing scheme and benefits from other
export/investment incentive scheme. The availability of these measures at the firm level, both
as subjective and objective indicators, allows us to exploit the variation in fiscal incentives at
the sub-national level across different sectors. Our findings include, among others, that fiscal
incentives are beneficial to manufacturing firms in Cameroon; however, the impact varies
across the type of fiscal incentive that is observed.
Our inquiry and the resultant findings are important based on the following reasons: first, to
our knowledge, there is a lack of econometric studies that analyse the impact of government
incentives on firms’ productivity, with a special attention to African countries. The closest to
our study has focused on how fiscal incentives attract foreign investment to Africa, using
macro data analysis (Cleeve, 2008). Arnold, Mattoo and Narciso (2008) attempted to go
beyond macro analysis to consider firm-level data, but focused on services inputs. This is
way apart from our line of enquiry. At best, there have been policy documents, and with
country specific cases, that have emphasised on the importance of fiscal incentives on
productivity of firms in Africa. They include the CBN (2013) that focused on Nigeria; the
OECD (2007) document that focused, in part, on North African countries; and the IMF
(2012) that focused on growth sustenance of African countries. Second, our study
complements the growing theoretical and policy literature on the importance of developing
countries’ government involvement with the private sector by providing incentives that will
offset the shortcomings of their business environment (see UNCTAD, 2000; UNCTAD,
2004; Cleeve, 2008; IMF, 2012; UNCTAD, 2015) by applying multidimensional measures of
fiscal incentives with a unique empirical application. In particular, apart from considering
multidimensional measures of incentives, we apply the impact evaluation methodology which
has sparsely been introduced in studies of this nature. This approach is relevant since it goes
beyond showing the linear impact of fiscal incentives on firms’ productivity, but goes ahead
to evaluate what could have been the effect of the introduction of fiscal incentives on firms’
productivity assuming they did not benefit from the introduction of the incentives. Third,
using Cameroon as a case is relevant and interesting considering that in 2013, the government
had a radical shift by enacting the investment incentive law No. 2013/004, which establishes
the government’s commitment towards creating an enabling investment climate.
Furthermore, in many respects, the country is representative for developing economies.
Fourth, in the context of developing countries, there has been an aroused interest of African
political leaders towards improving the extent of incentives that are given to firms to promote
industrialisation, and it would be worth having a critical view on an impact evaluation.
4
Knowing the extent to which these policies promote industrialisation would help to set a
direction for a new generation of policies, provided that the political leaders desire to sustain
this momentum and move in this direction.
The remainder of the paper is organised as follows: the next session discusses the review of
literature, and then the stylised facts are included in the third section. Following immediately
is the fourth section that presents an overview of the data used and addresses econometric and
methodological issues, while the fifth section is concerned with the descriptive statistics and
econometric results. The conclusions of the result are included in the sixth section.
2. Review of Literature
There is a growing interest in improving the productivity of firms in countries. At the micro
level, Lee (1996) studied the role of government intervention in enhancing the productivity of
manufacturing firms in Korea. The author found that government policies such as tax
incentives and subsidized credit were not correlated with total factor productivity of sampled
firms. However, he found that government involvement in trade leads to higher productivity.
Arnold, Mattoo and Narciso (2008) linked the productivity of firms to service delivery in
Africa and concluded that for productivity to be enhanced there is the need to improve the
service industries. This is distant from our line of enquiry, although it focuses on
productivity. Closely related to our study – but with a divergent focus – is Escribano, Guasch
and Pena (2010), who observed that African manufacturing firms will require an
improvement in the government commitment to the provision of infrastructure to enhance
their productivity.
Some other studies like Ohaka and Agundu (2012) considered the relevance of tax incentive
for industrial growth in Nigeria. Their results are of the affirmative that this form of incentive
will conscientiously grow critical industries as a result of the productivity impact. Similarly,
Mayende (2013) considered the effect of tax incentives on the performance of Ugandan
manufacturing firms and found that tax incentive recipient firms tend to have higher
performance. Most of the studies highlighted have taken interest in observing the factors that
enhance firms’ productivity because of the impact of the later on both the economy and
development in general.
From the policy perspective, the issue of firms’ productivity is of importance. As noted by
UNCTAD (2015), the improvement of the productivity of firms is one possible way for
developing countries to attain sustainable industrial development. As a result of this, there is
an urgent call to relate this phenomenon with the government commitment in providing fiscal
incentives to firms that will aid in offsetting some unfavourable conditions in the business
environment (see Gui-Diby and Renard, 2015; UNCTAD, 2015). However, the adverse
consequence of incentives is apparent (see Cleeve, 2008). In some cases, it is seen as wasteful
and propelling corruption due to lack of transparency in its administration. Despite these
acclaimed adverse effects from incentives, it is seen as a viable tool for attracting and
sustaining investment. As a result, it is suggested that the effectiveness of incentives can be
enhanced by conditioning incentives to performance, and directing it towards more
development-oriented goals (UNCTAD, 2004). This suggests that not all incentives can
enhance a beneficiary firm’s productivity. The degree of impact may vary across the type of
incentive being observed.
5
3. Stylized Facts
Fiscal incentives in Cameroon have undergone several regimes with varying focus. In 1990,
the investment code in Cameroon was aimed at encouraging and promoting investments in
Cameroon by granting financial concessions to firms, such as free transfer of proceeds from
investment capital. This act also granted exemption from export duties and other export
related expenses, and a rebate from the taxable income of firms involved in the production of
finished or semi-finished products for export.
Another important incentive that is granted by the Cameroonian government is the free zone
regime, which exempts firms from custom duties and paying of taxes for a period of 10 years
of operation. Also, firms in this zone can freely undertake any industrial and commercial
activity like installing own power and telecommunication systems, replacing national security
scheme with an equal or better valued private scheme, as well as freely negotiate wages of
employees. However, a major drawback of this form of incentive is the precarious condition
that for firms to benefit from it, 80 percent of their production must be for foreign
consumption – i.e. export (Bureau of Economic and Business Affairs, 2013).
In 2002 a new investment charter was enacted to replace the 1990 investment code. A major
improvement of the 2002 investment, way beyond the earlier one in 1990 is that it permits
100 percent foreign equity ownership. This is unlike the 1990 code that had some restrictions
on foreign ownership. However, this new charter was not implemented for a long time. In
2013, a new investment incentive law was enacted - law No.2013/004. This law provides two
categories of incentives: common incentives and special incentives. The common incentives
include those benefits that are given in general to firms to promote their productivity and
performance. They include tax and customs incentives such as exemption from registration
duties, exemption from transfer taxes, exemption from VAT on different categories of
provisions, exemption from business licence tax, direct clearing of equipment and materials
related to the investment program, among others.
The special incentives are those forms that involve benefits granted to firms that invest in
certain government priority sectors (like the development of integrated Agriculture, real
estate development and social housing projects, agro-industry, manufacturing and
construction, regional development and decentralisation projects), or to those that promote
innovation and export, among others. Some of the incentives that these firms benefit from
include: exemption from export duty on locally manufactured products, exemption from
custom duties for temporary importation of industrial equipment and materials likely to be re-
exported, as well as direct customs clearance at investor’s request.
To benefit from any of these incentives, however, some criteria are applicable, which include:
the beneficiary firm should be carrying out export activities ranging from 10 to 25 percent of
sales, rule of local capacity utilisation, as well as contribution to value addition. Another
important aspect of the Cameroonian incentives, just like those of some other developing
country, is that it is tied to a period of time. For instance, some of the common incentives are
valid for a period of 5 years during the installation stage, and 10 years maximum during the
operational stage. With this in place, the government’s main intention is to enhance
6
industrialisation and strengthen competitiveness of firms (resident or non-resident) during
these key stages of the lifecycle of an investment venture (see Tabi, 2005; Biya, 2013).
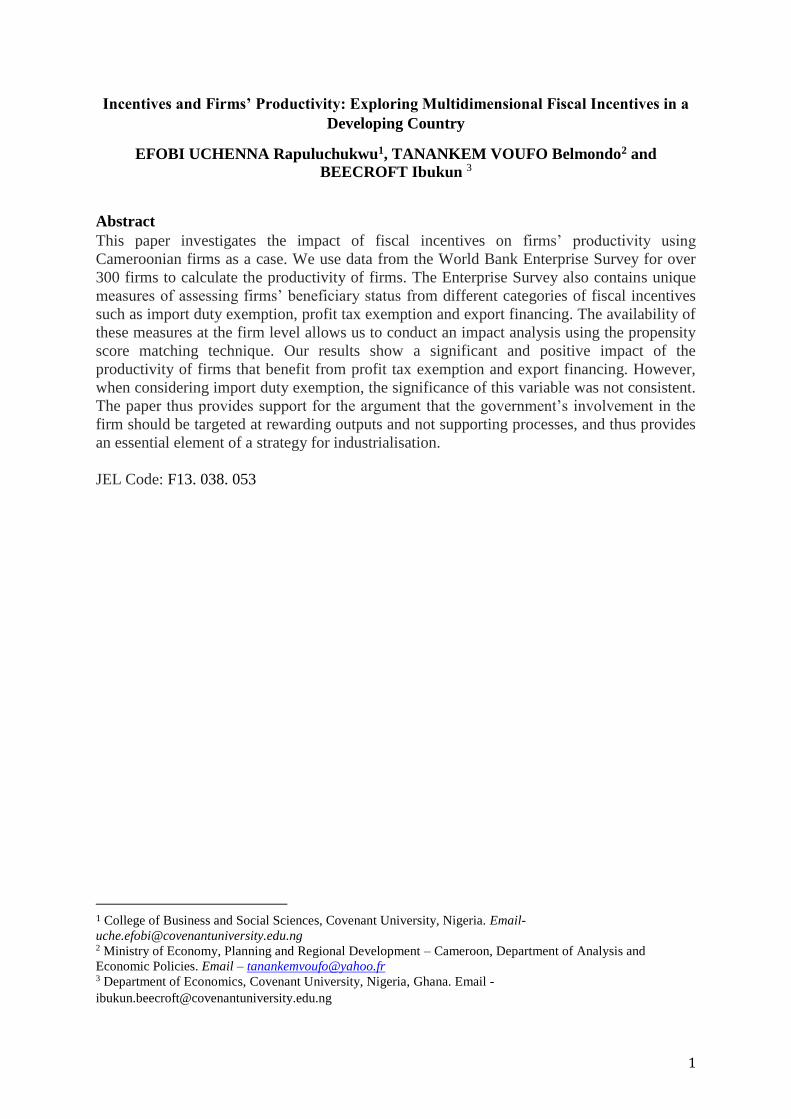
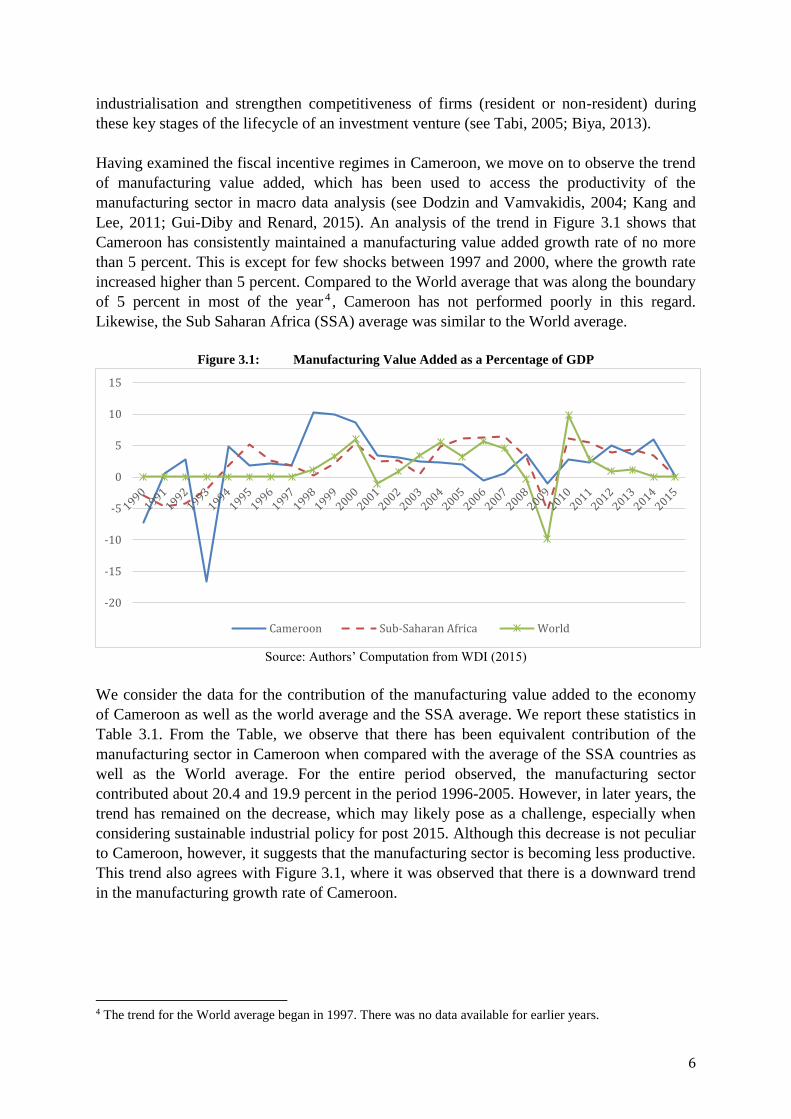
Having examined the fiscal incentive regimes in Cameroon, we move on to observe the trend
of manufacturing value added, which has been used to access the productivity of the
manufacturing sector in macro data analysis (see Dodzin and Vamvakidis, 2004; Kang and
Lee, 2011; Gui-Diby and Renard, 2015). An analysis of the trend in Figure 3.1 shows that
Cameroon has consistently maintained a manufacturing value added growth rate of no more
than 5 percent. This is except for few shocks between 1997 and 2000, where the growth rate
increased higher than 5 percent. Compared to the World average that was along the boundary
of 5 percent in most of the year 4 , Cameroon has not performed poorly in this regard.
Likewise, the Sub Saharan Africa (SSA) average was similar to the World average.
Figure 3.1: Manufacturing Value Added as a Percentage of GDP
Source: Authors’ Computation from WDI (2015)
We consider the data for the contribution of the manufacturing value added to the economy
of Cameroon as well as the world average and the SSA average. We report these statistics in
Table 3.1. From the Table, we observe that there has been equivalent contribution of the
manufacturing sector in Cameroon when compared with the average of the SSA countries as
well as the World average. For the entire period observed, the manufacturing sector
contributed about 20.4 and 19.9 percent in the period 1996-2005. However, in later years, the
trend has remained on the decrease, which may likely pose as a challenge, especially when
considering sustainable industrial policy for post 2015. Although this decrease is not peculiar
to Cameroon, however, it suggests that the manufacturing sector is becoming less productive.
This trend also agrees with Figure 3.1, where it was observed that there is a downward trend
in the manufacturing growth rate of Cameroon.
4 The trend for the World average began in 1997. There was no data available for earlier years.
-20
-15
-10
-5
0
5
10
15
Cameroon Sub-Saharan Africa World
7
Table 3.1: Manufacturing Value Added as a Percentage of GDP
1991-95 1996-00 2001-05 2006-10 2011-15
Cameroon 18.837 20.426 19.946 16.018 14.446
Sub-Saharan Africa 14.410 13.437 12.875 11.304 10.848
World 0.000 19.059 17.484 16.426 15.943
Source: Authors’ Computation from WDI (2015)
Our study is therefore relevant as we seek to carry out an impact analysis of the effect of the
government’s initiative in boosting this trend and ensuring that manufacturing firms in
Cameroon are efficient in utilising their capital inputs.
4. Data and Empirical Strategy
Data and Variables
Data are taken from the panel (2007 to 2009) of firm-level surveys conducted by the World
Bank’s Enterprise Survey project for Cameroon. The survey data contains diverse
information regarding the management structure, ownership and capital structure,
performance and other external factors that may affect the firms’ operations such as
infrastructure facility, government incentives and other institutional bottlenecks like
corruption. We restrict our enquiry to manufacturing firms involved in some form of cross-
border trading. This is because: (i) accounting data is generally collected for only
manufactured firms in the Enterprise Survey program; (ii) these firms are involved in the real
sector and their productivity is what drives the industrialisation process of countries (Gui-
Diby and Renard, 2015); (iii) finally, our incentives measures are geared towards those that
support import and export, as well as profit. This being the case, the focus on manufacturing
firms that are somehow involved in cross-border trade will be most suitable for our type of
analysis. Also, following the wisdom of Clarke (2012), we omit micro-enterprises and
informal enterprises, and focus on manufacturing firms with over 5 employees since these
categories are the ones most likely to be involved in international trade (i.e. export and
import) and their productivity will have a significant impact on the economy of countries in
this region in terms of job creation and economic diversification (see UNECA, 2013).
We identified information on firms’ output (using annual sales) and recorded the value of
firms’ assets (input), which enable us to compute the measure of the natural logarithm of
firms’ productivity based on the ratio of firms’ output to input. The values were converted to
US Dollars using the prevailing exchange rate as at the period of the survey. We use this
measure because of the scantiness of the data on intermediate inputs. With this measure, we
are able to compute the ratio of output that can be generated with the firms’ available input.
Information regarding fiscal incentives given by the government to specific firms is also
captured in the survey. There are five categories of these incentives that are identified in the
survey. They include: exemptions from duties on imported inputs, profit tax exemption, value
added tax (VAT) reimbursement, export financing scheme and export/investment incentive
scheme. The impact of each of these incentives is examined separately in order to observe
their individual effects on productivity, and to enhance our policy recommendations. It is
important to state that these are the popular forms of fiscal incentives that are prevalent
among many African countries, especially our sample - Cameroon.
As identified from the consensus in the literature, firms’ productivity is explained by many
other factors that are either internal or external to the firm. For the internal factors, we pay
attention to the productive capacity of the firm, the size of the firm, the labour input of the
8
firm, and the running cost of the business in generating electricity. Some of these variables
feature in a typical Cobb-Douglas production function and are regarded as important in
explaining the efficiency of a typical manufacturing firm in our context (see Arnold, Mattoo
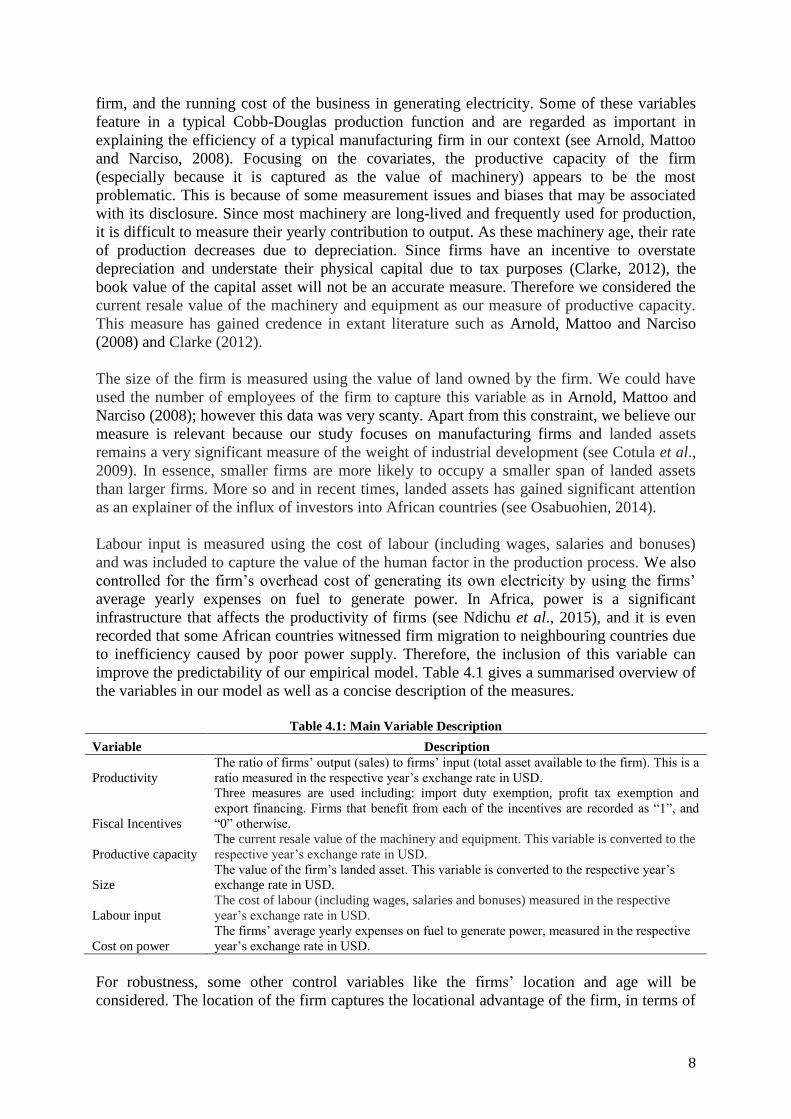
and Narciso, 2008). Focusing on the covariates, the productive capacity of the firm
(especially because it is captured as the value of machinery) appears to be the most
problematic. This is because of some measurement issues and biases that may be associated
with its disclosure. Since most machinery are long-lived and frequently used for production,
it is difficult to measure their yearly contribution to output. As these machinery age, their rate
of production decreases due to depreciation. Since firms have an incentive to overstate
depreciation and understate their physical capital due to tax purposes (Clarke, 2012), the
book value of the capital asset will not be an accurate measure. Therefore we considered the
current resale value of the machinery and equipment as our measure of productive capacity.
This measure has gained credence in extant literature such as Arnold, Mattoo and Narciso
(2008) and Clarke (2012).
The size of the firm is measured using the value of land owned by the firm. We could have
used the number of employees of the firm to capture this variable as in Arnold, Mattoo and
Narciso (2008); however this data was very scanty. Apart from this constraint, we believe our
measure is relevant because our study focuses on manufacturing firms and landed assets
remains a very significant measure of the weight of industrial development (see Cotula et al.,
2009). In essence, smaller firms are more likely to occupy a smaller span of landed assets
than larger firms. More so and in recent times, landed assets has gained significant attention
as an explainer of the influx of investors into African countries (see Osabuohien, 2014).
Labour input is measured using the cost of labour (including wages, salaries and bonuses)
and was included to capture the value of the human factor in the production process. We also
controlled for the firm’s overhead cost of generating its own electricity by using the firms’
average yearly expenses on fuel to generate power. In Africa, power is a significant
infrastructure that affects the productivity of firms (see Ndichu et al., 2015), and it is even
recorded that some African countries witnessed firm migration to neighbouring countries due
to inefficiency caused by poor power supply. Therefore, the inclusion of this variable can
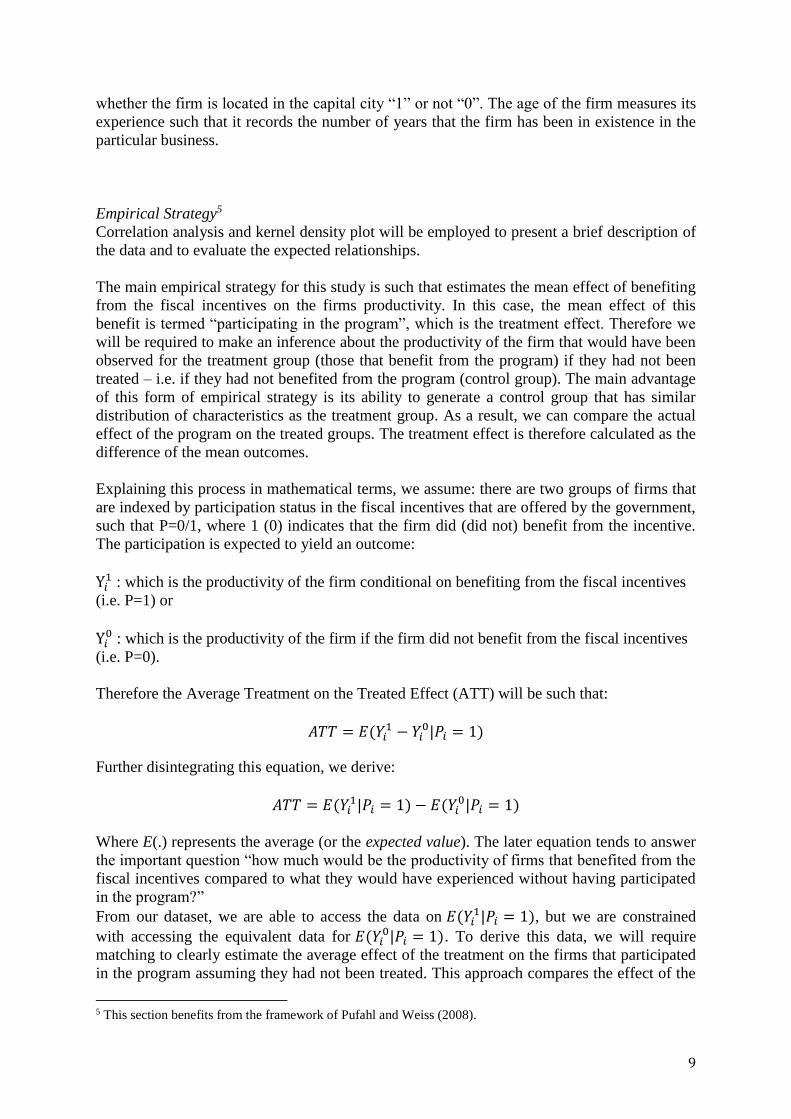
improve the predictability of our empirical model. Table 4.1 gives a summarised overview of
the variables in our model as well as a concise description of the measures.
Table 4.1: Main Variable Description
Variable Description
Productivity
The ratio of firms’ output (sales) to firms’ input (total asset available to the firm). This is a
ratio measured in the respective year’s exchange rate in USD.
Fiscal Incentives
Three measures are used including: import duty exemption, profit tax exemption and
export financing. Firms that benefit from each of the incentives are recorded as “1”, and
“0” otherwise.
Productive capacity
The current resale value of the machinery and equipment. This variable is converted to the
respective year’s exchange rate in USD.
Size
The value of the firm’s landed asset. This variable is converted to the respective year’s
exchange rate in USD.
Labour input
The cost of labour (including wages, salaries and bonuses) measured in the respective
year’s exchange rate in USD.
Cost on power
The firms’ average yearly expenses on fuel to generate power, measured in the respective
year’s exchange rate in USD.
For robustness, some other control variables like the firms’ location and age will be
considered. The location of the firm captures the locational advantage of the firm, in terms of
9
whether the firm is located in the capital city “1” or not “0”. The age of the firm measures its
experience such that it records the number of years that the firm has been in existence in the
particular business.
Empirical Strategy5
Correlation analysis and kernel density plot will be employed to present a brief description of
the data and to evaluate the expected relationships.
The main empirical strategy for this study is such that estimates the mean effect of benefiting
from the fiscal incentives on the firms productivity. In this case, the mean effect of this
benefit is termed “participating in the program”, which is the treatment effect. Therefore we
will be required to make an inference about the productivity of the firm that would have been
observed for the treatment group (those that benefit from the program) if they had not been
treated – i.e. if they had not benefited from the program (control group). The main advantage
of this form of empirical strategy is its ability to generate a control group that has similar
distribution of characteristics as the treatment group. As a result, we can compare the actual
effect of the program on the treated groups. The treatment effect is therefore calculated as the
difference of the mean outcomes.
Explaining this process in mathematical terms, we assume: there are two groups of firms that
are indexed by participation status in the fiscal incentives that are offered by the government,
such that P=0/1, where 1 (0) indicates that the firm did (did not) benefit from the incentive.
The participation is expected to yield an outcome:
Y𝑖1 : which is the productivity of the firm conditional on benefiting from the fiscal incentives
(i.e. P=1) or
Y𝑖0 : which is the productivity of the firm if the firm did not benefit from the fiscal incentives
(i.e. P=0).
Therefore the Average Treatment on the Treated Effect (ATT) will be such that:
𝐴𝑇𝑇 = 𝐸(𝑌𝑖1 − 𝑌𝑖
0|𝑃𝑖 = 1)
Further disintegrating this equation, we derive:
𝐴𝑇𝑇 = 𝐸(𝑌𝑖1|𝑃𝑖 = 1) − 𝐸(𝑌𝑖
0|𝑃𝑖 = 1)
Where E(.) represents the average (or the expected value). The later equation tends to answer
the important question “how much would be the productivity of firms that benefited from the
fiscal incentives compared to what they would have experienced without having participated
in the program?”
From our dataset, we are able to access the data on 𝐸(𝑌𝑖1|𝑃𝑖 = 1), but we are constrained
with accessing the equivalent data for 𝐸(𝑌𝑖0|𝑃𝑖 = 1). To derive this data, we will require
matching to clearly estimate the average effect of the treatment on the firms that participated
in the program assuming they had not been treated. This approach compares the effect of the
5 This section benefits from the framework of Pufahl and Weiss (2008).
10
incentives on firms’ productivity with those of matched non-participants (those that did not
benefit from the incentives) where the matches are chosen on the basis of similarity in
observed characteristics. In this case, the covariates that are earlier discussed will form the
basis for the similarity. This approach was advanced by Rosenbaum and Rubin (1986) who
proposed the use of the propensity score matching (PSM) approach as a reliable technique to
derive the equivalent data from the non-participants.
The main essence for the PSM is to identify those non-participants that are similar to the
participants in all the pre-treatment characteristics and attributes, and then attribute their
outcome differences to the effect of the treatment (see Caliendo and Kopeneig, 2008). A
propensity score is developed, which will be used for the matching. The propensity score is
based on a firm’s probability to participate in the program (fiscal incentives), which is
estimated using a logit or probit model.
It is important to state the main underlining assumptions guiding the PSM analysis. They
include: first, the conditional independence assumption, which is based on the understanding
that the potential outcomes for non-treatment are independent of the participation status of
the firm given a set of observable covariates “X”.
i.e. 𝑌𝑖0 ⊥ 𝑃𝑖|𝑋
Hence, after adjusting for observable differences, the mean of the potential outcome (i.e.
productivity of the firm) is the same for both the participating and non-participating group
(i.e. P = 1 and P = 0). This condition permits for the use of matched non-participating firms to
measure the outcome of participating firms had they not participated in the treatment.
Hence,
(𝐸(𝑌𝑖0|𝑃 = 1, 𝑋) = 𝐸(𝑌𝑖
0|𝑃 = 0, 𝑋))
The second assumption is the common support condition, which is based on the expectation
that for each value of “X”, there is a positive probability of either being treated or untreated.
This assumption supports the overlap condition such that the proportion of treated and
untreated firms must be greater than “0” for every possible value of “X”. Hence, it ensures
that there is a sufficient overlap in the characteristics of the treated and untreated firms to find
adequate matches. Once these two conditions are satisfied, the treatment assignment is said to
be efficient (Rosenbaum and Rubin, 1983). This approach has gained credence in Nkhata,
Jumbe and Mwabumba (2014), among others.
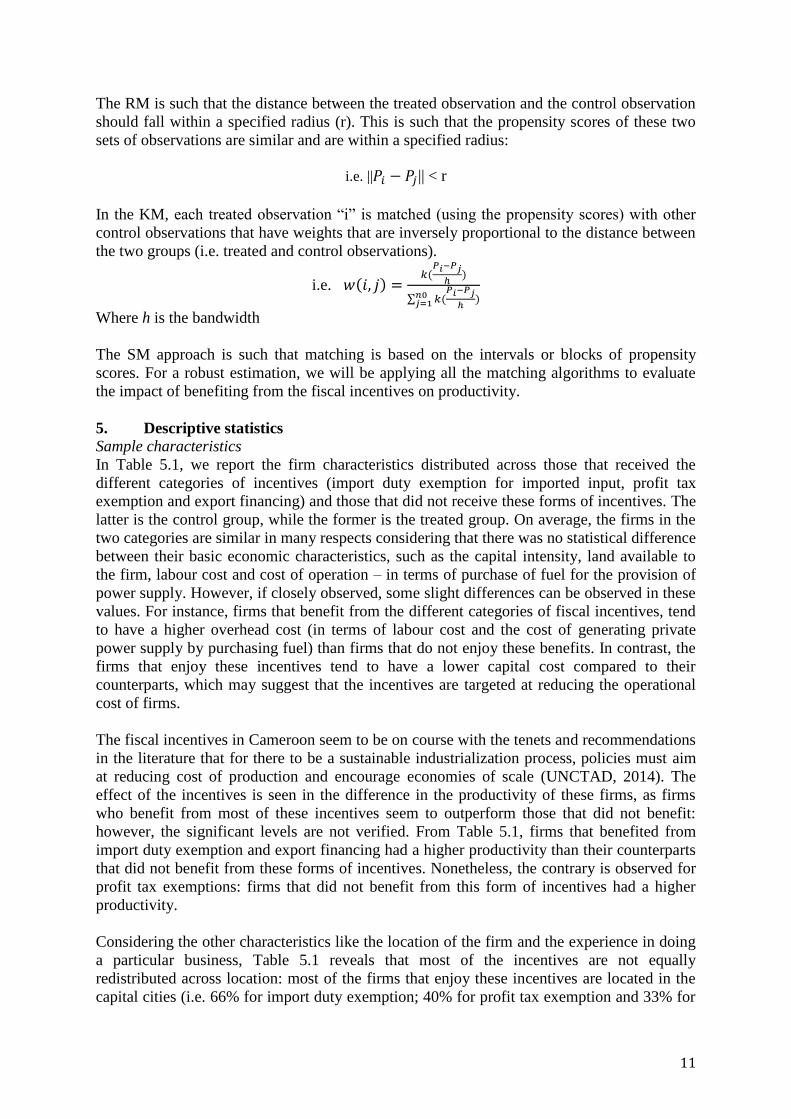
The PSM applies different matching algorithms to derive its predictions. The common
algorithms include: the nearest neighbor matching (NNM), the radius matching (RM), the
kernel matching (KM), and the stratification method (SM). The NNM is such that focuses on
the comparison of the outcome of the participants with the closest and most similar non-
participants in terms of propensity scores. This approach tries to minimize the distance
between the propensity score of the treated observation ( 𝑃𝑖) and that of the control
observation (𝑃𝑗):
i.e. min ||𝑃𝑖 − 𝑃𝑗 ||
11
The RM is such that the distance between the treated observation and the control observation
should fall within a specified radius (r). This is such that the propensity scores of these two
sets of observations are similar and are within a specified radius:
i.e. ||𝑃𝑖 − 𝑃𝑗 || < r
In the KM, each treated observation “i” is matched (using the propensity scores) with other
control observations that have weights that are inversely proportional to the distance between
the two groups (i.e. treated and control observations).
i.e. 𝑤(𝑖, 𝑗) =𝑘(
𝑃𝑖−𝑃𝑗
ℎ)
∑ 𝑘(𝑃𝑖−𝑃𝑗
ℎ)𝑛0
𝑗=1
Where h is the bandwidth
The SM approach is such that matching is based on the intervals or blocks of propensity
scores. For a robust estimation, we will be applying all the matching algorithms to evaluate
the impact of benefiting from the fiscal incentives on productivity.
5. Descriptive statistics
Sample characteristics
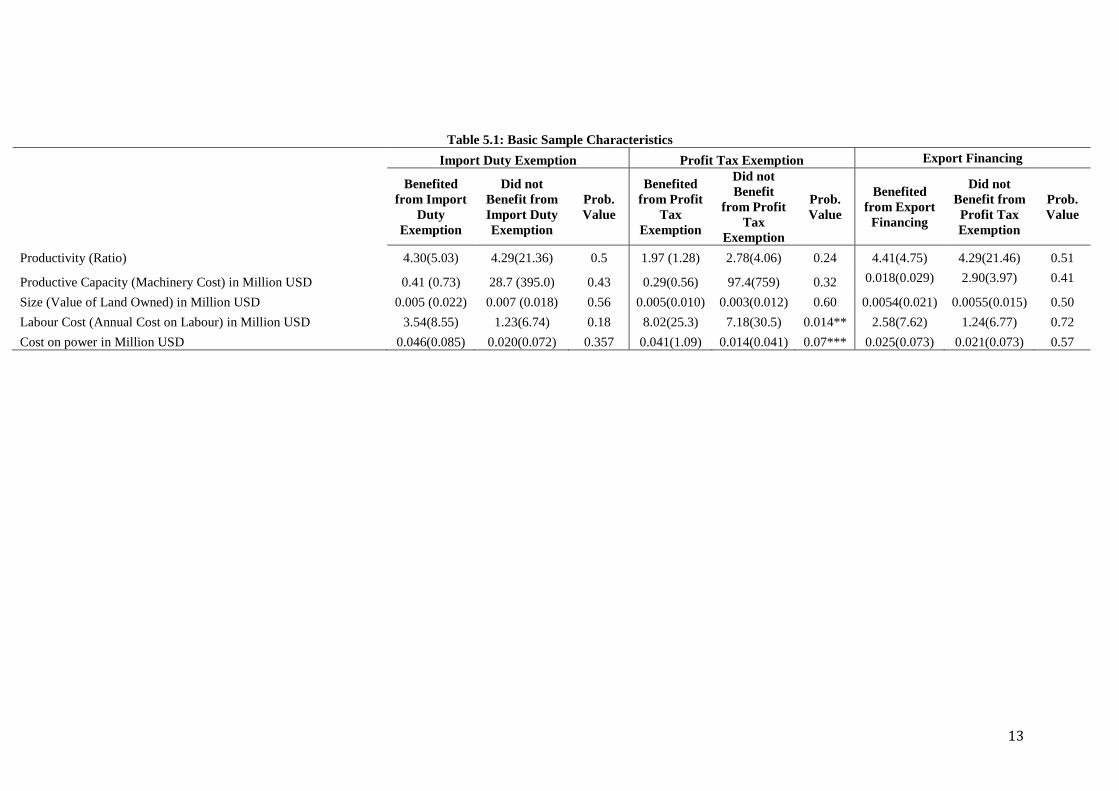
In Table 5.1, we report the firm characteristics distributed across those that received the
different categories of incentives (import duty exemption for imported input, profit tax
exemption and export financing) and those that did not receive these forms of incentives. The
latter is the control group, while the former is the treated group. On average, the firms in the
two categories are similar in many respects considering that there was no statistical difference
between their basic economic characteristics, such as the capital intensity, land available to
the firm, labour cost and cost of operation – in terms of purchase of fuel for the provision of
power supply. However, if closely observed, some slight differences can be observed in these
values. For instance, firms that benefit from the different categories of fiscal incentives, tend
to have a higher overhead cost (in terms of labour cost and the cost of generating private
power supply by purchasing fuel) than firms that do not enjoy these benefits. In contrast, the
firms that enjoy these incentives tend to have a lower capital cost compared to their
counterparts, which may suggest that the incentives are targeted at reducing the operational
cost of firms.
The fiscal incentives in Cameroon seem to be on course with the tenets and recommendations
in the literature that for there to be a sustainable industrialization process, policies must aim
at reducing cost of production and encourage economies of scale (UNCTAD, 2014). The
effect of the incentives is seen in the difference in the productivity of these firms, as firms
who benefit from most of these incentives seem to outperform those that did not benefit:
however, the significant levels are not verified. From Table 5.1, firms that benefited from
import duty exemption and export financing had a higher productivity than their counterparts
that did not benefit from these forms of incentives. Nonetheless, the contrary is observed for
profit tax exemptions: firms that did not benefit from this form of incentives had a higher
productivity.
Considering the other characteristics like the location of the firm and the experience in doing
a particular business, Table 5.1 reveals that most of the incentives are not equally
redistributed across location: most of the firms that enjoy these incentives are located in the
capital cities (i.e. 66% for import duty exemption; 40% for profit tax exemption and 33% for

12
export financing). Likewise, younger firms seem to enjoy import duty and profit tax
exemption. Older firms benefit from the export financing. In addition, the differences in the
experience of the firms across the different categories of the beneficiaries of the incentives
may not necessarily mean a bias towards younger firms, but could also be the result of
participation.
13
Table 5.1: Basic Sample Characteristics
Import Duty Exemption Profit Tax Exemption Export Financing
Benefited
from Import
Duty
Exemption
Did not
Benefit from
Import Duty
Exemption
Prob.
Value
Benefited
from Profit
Tax
Exemption
Did not
Benefit
from Profit
Tax
Exemption
Prob.
Value
Benefited
from Export
Financing
Did not
Benefit from
Profit Tax
Exemption
Prob.
Value
Productivity (Ratio) 4.30(5.03) 4.29(21.36) 0.5 1.97 (1.28) 2.78(4.06) 0.24 4.41(4.75) 4.29(21.46) 0.51
Productive Capacity (Machinery Cost) in Million USD 0.41 (0.73) 28.7 (395.0) 0.43 0.29(0.56) 97.4(759) 0.32 0.018(0.029) 2.90(3.97) 0.41
Size (Value of Land Owned) in Million USD 0.005 (0.022) 0.007 (0.018) 0.56 0.005(0.010) 0.003(0.012) 0.60 0.0054(0.021) 0.0055(0.015) 0.50
Labour Cost (Annual Cost on Labour) in Million USD 3.54(8.55) 1.23(6.74) 0.18 8.02(25.3) 7.18(30.5) 0.014** 2.58(7.62) 1.24(6.77) 0.72
Cost on power in Million USD 0.046(0.085) 0.020(0.072) 0.357 0.041(1.09) 0.014(0.041) 0.07*** 0.025(0.073) 0.021(0.073) 0.57
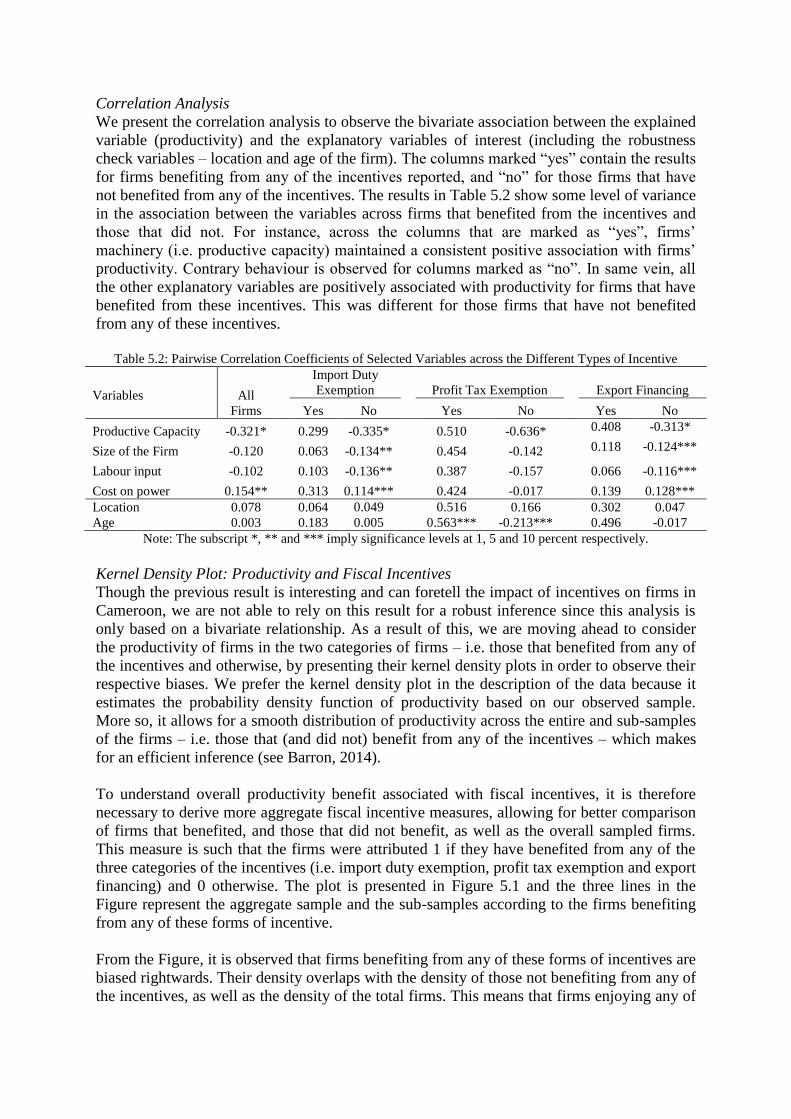
Correlation Analysis
We present the correlation analysis to observe the bivariate association between the explained
variable (productivity) and the explanatory variables of interest (including the robustness
check variables – location and age of the firm). The columns marked “yes” contain the results
for firms benefiting from any of the incentives reported, and “no” for those firms that have
not benefited from any of the incentives. The results in Table 5.2 show some level of variance
in the association between the variables across firms that benefited from the incentives and
those that did not. For instance, across the columns that are marked as “yes”, firms’
machinery (i.e. productive capacity) maintained a consistent positive association with firms’
productivity. Contrary behaviour is observed for columns marked as “no”. In same vein, all
the other explanatory variables are positively associated with productivity for firms that have
benefited from these incentives. This was different for those firms that have not benefited
from any of these incentives.
Table 5.2: Pairwise Correlation Coefficients of Selected Variables across the Different Types of Incentive
Variables
All
Firms
Import Duty
Exemption
Profit Tax Exemption
Export Financing
Yes No Yes No Yes No
Productive Capacity -0.321* 0.299 -0.335* 0.510 -0.636* 0.408 -0.313*
Size of the Firm -0.120 0.063 -0.134** 0.454 -0.142 0.118 -0.124***
Labour input -0.102 0.103 -0.136** 0.387 -0.157 0.066 -0.116***
Cost on power 0.154** 0.313 0.114*** 0.424 -0.017 0.139 0.128***
Location 0.078 0.064 0.049 0.516 0.166 0.302 0.047
Age 0.003 0.183 0.005 0.563*** -0.213*** 0.496 -0.017
Note: The subscript *, ** and *** imply significance levels at 1, 5 and 10 percent respectively.
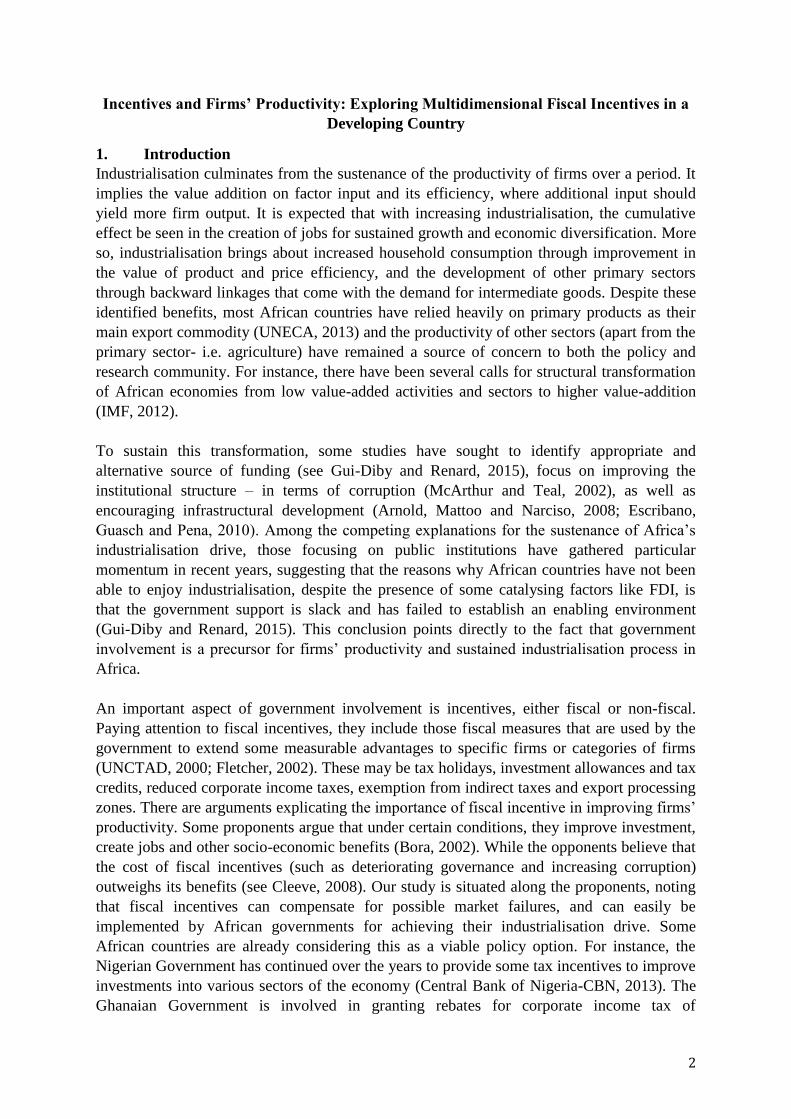
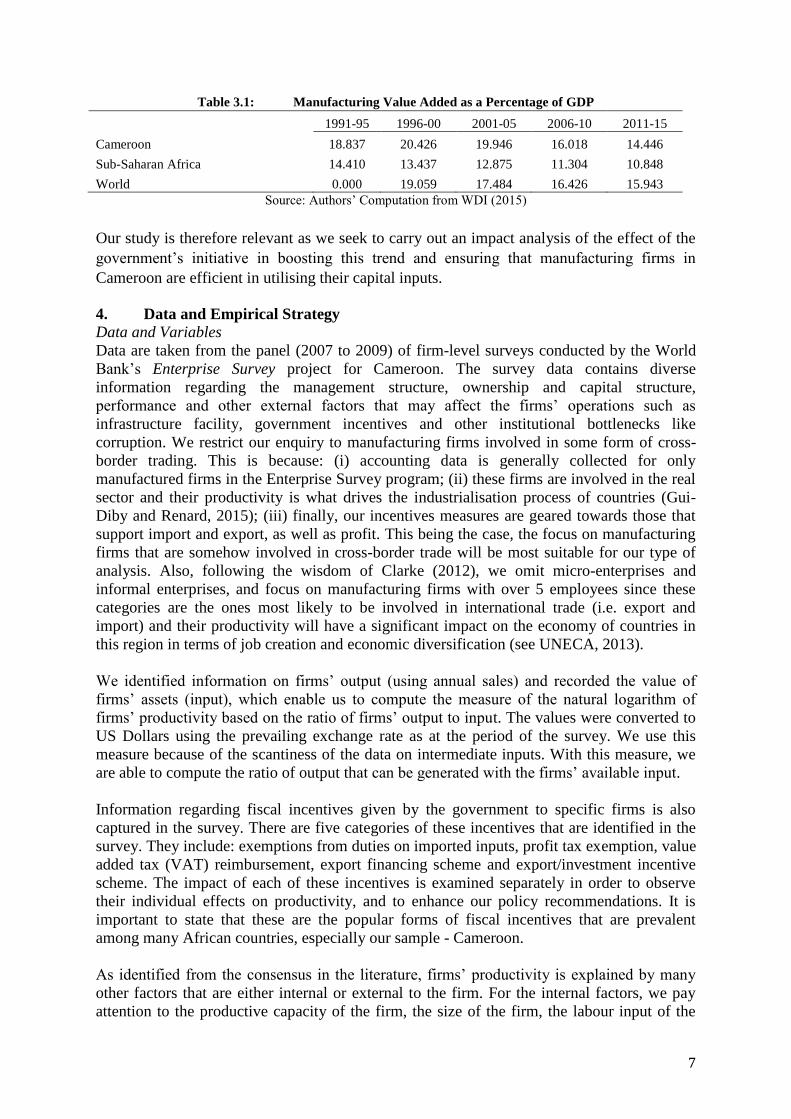
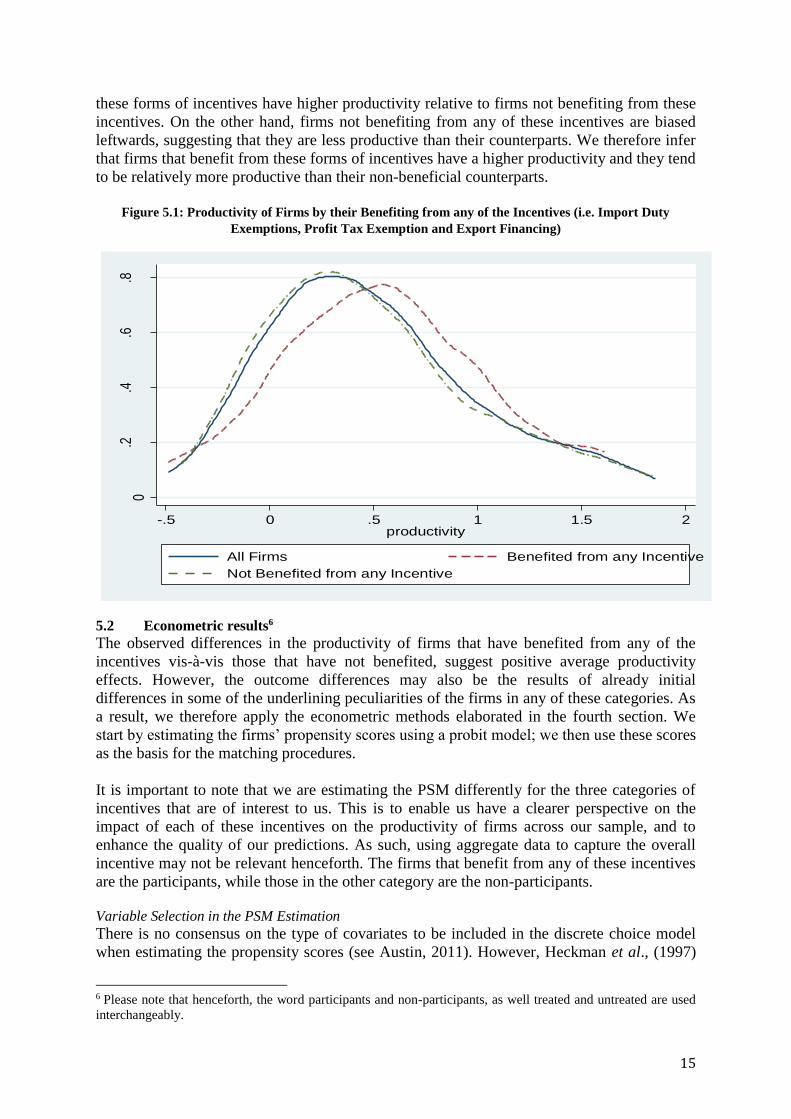
Kernel Density Plot: Productivity and Fiscal Incentives
Though the previous result is interesting and can foretell the impact of incentives on firms in
Cameroon, we are not able to rely on this result for a robust inference since this analysis is
only based on a bivariate relationship. As a result of this, we are moving ahead to consider
the productivity of firms in the two categories of firms – i.e. those that benefited from any of
the incentives and otherwise, by presenting their kernel density plots in order to observe their
respective biases. We prefer the kernel density plot in the description of the data because it
estimates the probability density function of productivity based on our observed sample.
More so, it allows for a smooth distribution of productivity across the entire and sub-samples
of the firms – i.e. those that (and did not) benefit from any of the incentives – which makes
for an efficient inference (see Barron, 2014).
To understand overall productivity benefit associated with fiscal incentives, it is therefore
necessary to derive more aggregate fiscal incentive measures, allowing for better comparison
of firms that benefited, and those that did not benefit, as well as the overall sampled firms.
This measure is such that the firms were attributed 1 if they have benefited from any of the
three categories of the incentives (i.e. import duty exemption, profit tax exemption and export
financing) and 0 otherwise. The plot is presented in Figure 5.1 and the three lines in the
Figure represent the aggregate sample and the sub-samples according to the firms benefiting
from any of these forms of incentive.
From the Figure, it is observed that firms benefiting from any of these forms of incentives are
biased rightwards. Their density overlaps with the density of those not benefiting from any of
the incentives, as well as the density of the total firms. This means that firms enjoying any of
15
these forms of incentives have higher productivity relative to firms not benefiting from these
incentives. On the other hand, firms not benefiting from any of these incentives are biased
leftwards, suggesting that they are less productive than their counterparts. We therefore infer
that firms that benefit from these forms of incentives have a higher productivity and they tend
to be relatively more productive than their non-beneficial counterparts.
Figure 5.1: Productivity of Firms by their Benefiting from any of the Incentives (i.e. Import Duty
Exemptions, Profit Tax Exemption and Export Financing)
5.2 Econometric results6
The observed differences in the productivity of firms that have benefited from any of the
incentives vis-à-vis those that have not benefited, suggest positive average productivity
effects. However, the outcome differences may also be the results of already initial
differences in some of the underlining peculiarities of the firms in any of these categories. As
a result, we therefore apply the econometric methods elaborated in the fourth section. We
start by estimating the firms’ propensity scores using a probit model; we then use these scores
as the basis for the matching procedures.
It is important to note that we are estimating the PSM differently for the three categories of
incentives that are of interest to us. This is to enable us have a clearer perspective on the
impact of each of these incentives on the productivity of firms across our sample, and to
enhance the quality of our predictions. As such, using aggregate data to capture the overall
incentive may not be relevant henceforth. The firms that benefit from any of these incentives
are the participants, while those in the other category are the non-participants.
Variable Selection in the PSM Estimation
There is no consensus on the type of covariates to be included in the discrete choice model
when estimating the propensity scores (see Austin, 2011). However, Heckman et al., (1997)
6 Please note that henceforth, the word participants and non-participants, as well treated and untreated are used
interchangeably.
0.2
.4.6
.8
Den
sity
-.5 0 .5 1 1.5 2productivity
All Firms Benefited from any Incentive
Not Benefited from any Incentive
16
suggest that: to eliminate biases due to variable selection, it will be relevant to include all
variables influencing participation and outcome. Therefore, our variables were carefully
selected by drawing from the available literature (see preceding section) as well as
information available in our database. All the variables had complete data in our main data
source.
Determinants of Participation
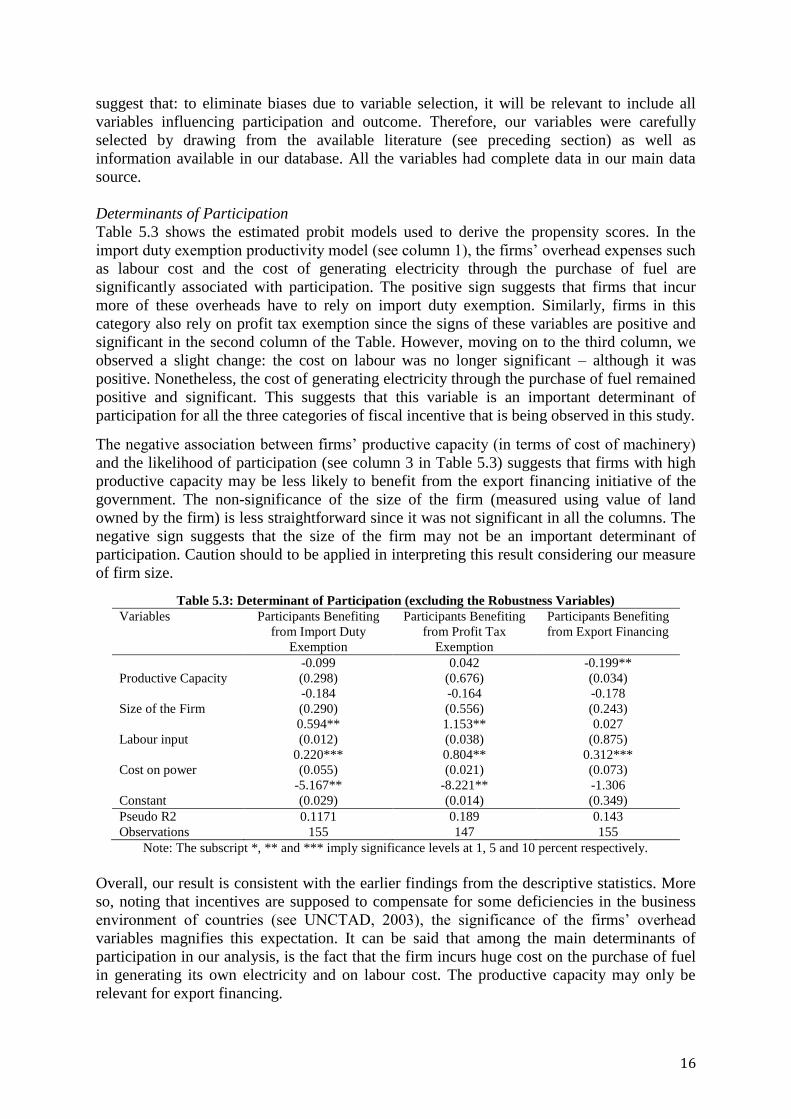
Table 5.3 shows the estimated probit models used to derive the propensity scores. In the
import duty exemption productivity model (see column 1), the firms’ overhead expenses such
as labour cost and the cost of generating electricity through the purchase of fuel are
significantly associated with participation. The positive sign suggests that firms that incur
more of these overheads have to rely on import duty exemption. Similarly, firms in this
category also rely on profit tax exemption since the signs of these variables are positive and
significant in the second column of the Table. However, moving on to the third column, we
observed a slight change: the cost on labour was no longer significant – although it was
positive. Nonetheless, the cost of generating electricity through the purchase of fuel remained
positive and significant. This suggests that this variable is an important determinant of
participation for all the three categories of fiscal incentive that is being observed in this study.
The negative association between firms’ productive capacity (in terms of cost of machinery)
and the likelihood of participation (see column 3 in Table 5.3) suggests that firms with high
productive capacity may be less likely to benefit from the export financing initiative of the
government. The non-significance of the size of the firm (measured using value of land
owned by the firm) is less straightforward since it was not significant in all the columns. The
negative sign suggests that the size of the firm may not be an important determinant of
participation. Caution should to be applied in interpreting this result considering our measure
of firm size.
Table 5.3: Determinant of Participation (excluding the Robustness Variables)
Variables Participants Benefiting
from Import Duty
Exemption
Participants Benefiting
from Profit Tax
Exemption
Participants Benefiting
from Export Financing
Productive Capacity
-0.099
(0.298)
0.042
(0.676)
-0.199**
(0.034)
Size of the Firm
-0.184
(0.290)
-0.164
(0.556)
-0.178
(0.243)
Labour input
0.594**
(0.012)
1.153**
(0.038)
0.027
(0.875)
Cost on power
0.220***
(0.055)
0.804**
(0.021)
0.312***
(0.073)
Constant
-5.167**
(0.029)
-8.221**
(0.014)
-1.306
(0.349)
Pseudo R2 0.1171 0.189 0.143
Observations 155 147 155
Note: The subscript *, ** and *** imply significance levels at 1, 5 and 10 percent respectively.
Overall, our result is consistent with the earlier findings from the descriptive statistics. More
so, noting that incentives are supposed to compensate for some deficiencies in the business
environment of countries (see UNCTAD, 2003), the significance of the firms’ overhead
variables magnifies this expectation. It can be said that among the main determinants of
participation in our analysis, is the fact that the firm incurs huge cost on the purchase of fuel
in generating its own electricity and on labour cost. The productive capacity may only be
relevant for export financing.
17
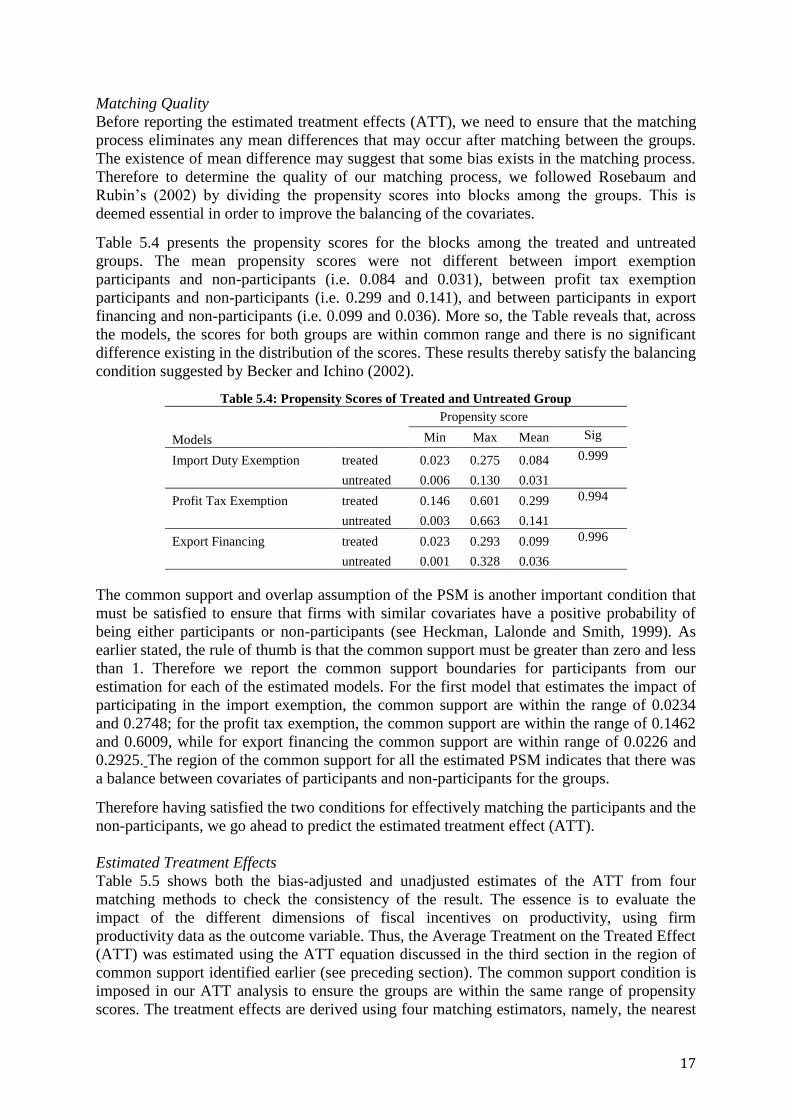
Matching Quality
Before reporting the estimated treatment effects (ATT), we need to ensure that the matching
process eliminates any mean differences that may occur after matching between the groups.
The existence of mean difference may suggest that some bias exists in the matching process.
Therefore to determine the quality of our matching process, we followed Rosebaum and
Rubin’s (2002) by dividing the propensity scores into blocks among the groups. This is
deemed essential in order to improve the balancing of the covariates.
Table 5.4 presents the propensity scores for the blocks among the treated and untreated
groups. The mean propensity scores were not different between import exemption
participants and non-participants (i.e. 0.084 and 0.031), between profit tax exemption
participants and non-participants (i.e. 0.299 and 0.141), and between participants in export
financing and non-participants (i.e. 0.099 and 0.036). More so, the Table reveals that, across
the models, the scores for both groups are within common range and there is no significant
difference existing in the distribution of the scores. These results thereby satisfy the balancing
condition suggested by Becker and Ichino (2002).
Table 5.4: Propensity Scores of Treated and Untreated Group
Propensity score
Models Min Max Mean Sig
Import Duty Exemption treated 0.023 0.275 0.084 0.999
untreated 0.006 0.130 0.031
Profit Tax Exemption treated 0.146 0.601 0.299 0.994
untreated 0.003 0.663 0.141
Export Financing treated 0.023 0.293 0.099 0.996
untreated 0.001 0.328 0.036
The common support and overlap assumption of the PSM is another important condition that
must be satisfied to ensure that firms with similar covariates have a positive probability of
being either participants or non-participants (see Heckman, Lalonde and Smith, 1999). As
earlier stated, the rule of thumb is that the common support must be greater than zero and less
than 1. Therefore we report the common support boundaries for participants from our
estimation for each of the estimated models. For the first model that estimates the impact of
participating in the import exemption, the common support are within the range of 0.0234
and 0.2748; for the profit tax exemption, the common support are within the range of 0.1462
and 0.6009, while for export financing the common support are within range of 0.0226 and
0.2925. The region of the common support for all the estimated PSM indicates that there was
a balance between covariates of participants and non-participants for the groups.
Therefore having satisfied the two conditions for effectively matching the participants and the
non-participants, we go ahead to predict the estimated treatment effect (ATT).
Estimated Treatment Effects
Table 5.5 shows both the bias-adjusted and unadjusted estimates of the ATT from four
matching methods to check the consistency of the result. The essence is to evaluate the
impact of the different dimensions of fiscal incentives on productivity, using firm
productivity data as the outcome variable. Thus, the Average Treatment on the Treated Effect
(ATT) was estimated using the ATT equation discussed in the third section in the region of
common support identified earlier (see preceding section). The common support condition is
imposed in our ATT analysis to ensure the groups are within the same range of propensity
scores. The treatment effects are derived using four matching estimators, namely, the nearest
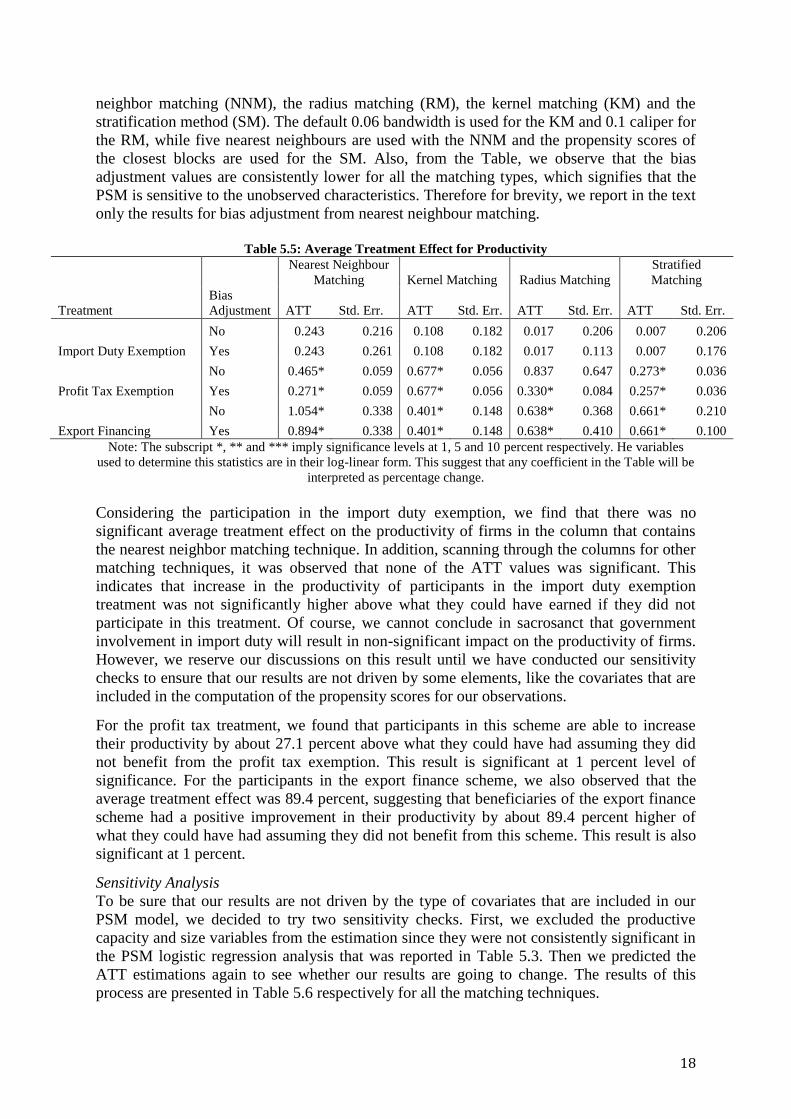
18
neighbor matching (NNM), the radius matching (RM), the kernel matching (KM) and the
stratification method (SM). The default 0.06 bandwidth is used for the KM and 0.1 caliper for
the RM, while five nearest neighbours are used with the NNM and the propensity scores of
the closest blocks are used for the SM. Also, from the Table, we observe that the bias
adjustment values are consistently lower for all the matching types, which signifies that the
PSM is sensitive to the unobserved characteristics. Therefore for brevity, we report in the text
only the results for bias adjustment from nearest neighbour matching.
Table 5.5: Average Treatment Effect for Productivity
Nearest Neighbour
Matching Kernel Matching Radius Matching
Stratified
Matching
Treatment
Bias
Adjustment ATT Std. Err. ATT Std. Err. ATT Std. Err. ATT Std. Err.
No 0.243 0.216 0.108 0.182 0.017 0.206 0.007 0.206
Import Duty Exemption Yes 0.243 0.261 0.108 0.182 0.017 0.113 0.007 0.176
No 0.465* 0.059 0.677* 0.056 0.837 0.647 0.273* 0.036
Profit Tax Exemption Yes 0.271* 0.059 0.677* 0.056 0.330* 0.084 0.257* 0.036
No 1.054* 0.338 0.401* 0.148 0.638* 0.368 0.661* 0.210
Export Financing Yes 0.894* 0.338 0.401* 0.148 0.638* 0.410 0.661* 0.100
Note: The subscript *, ** and *** imply significance levels at 1, 5 and 10 percent respectively. He variables
used to determine this statistics are in their log-linear form. This suggest that any coefficient in the Table will be
interpreted as percentage change.
Considering the participation in the import duty exemption, we find that there was no
significant average treatment effect on the productivity of firms in the column that contains
the nearest neighbor matching technique. In addition, scanning through the columns for other
matching techniques, it was observed that none of the ATT values was significant. This
indicates that increase in the productivity of participants in the import duty exemption
treatment was not significantly higher above what they could have earned if they did not
participate in this treatment. Of course, we cannot conclude in sacrosanct that government
involvement in import duty will result in non-significant impact on the productivity of firms.
However, we reserve our discussions on this result until we have conducted our sensitivity
checks to ensure that our results are not driven by some elements, like the covariates that are
included in the computation of the propensity scores for our observations.
For the profit tax treatment, we found that participants in this scheme are able to increase
their productivity by about 27.1 percent above what they could have had assuming they did
not benefit from the profit tax exemption. This result is significant at 1 percent level of
significance. For the participants in the export finance scheme, we also observed that the
average treatment effect was 89.4 percent, suggesting that beneficiaries of the export finance
scheme had a positive improvement in their productivity by about 89.4 percent higher of
what they could have had assuming they did not benefit from this scheme. This result is also
significant at 1 percent.
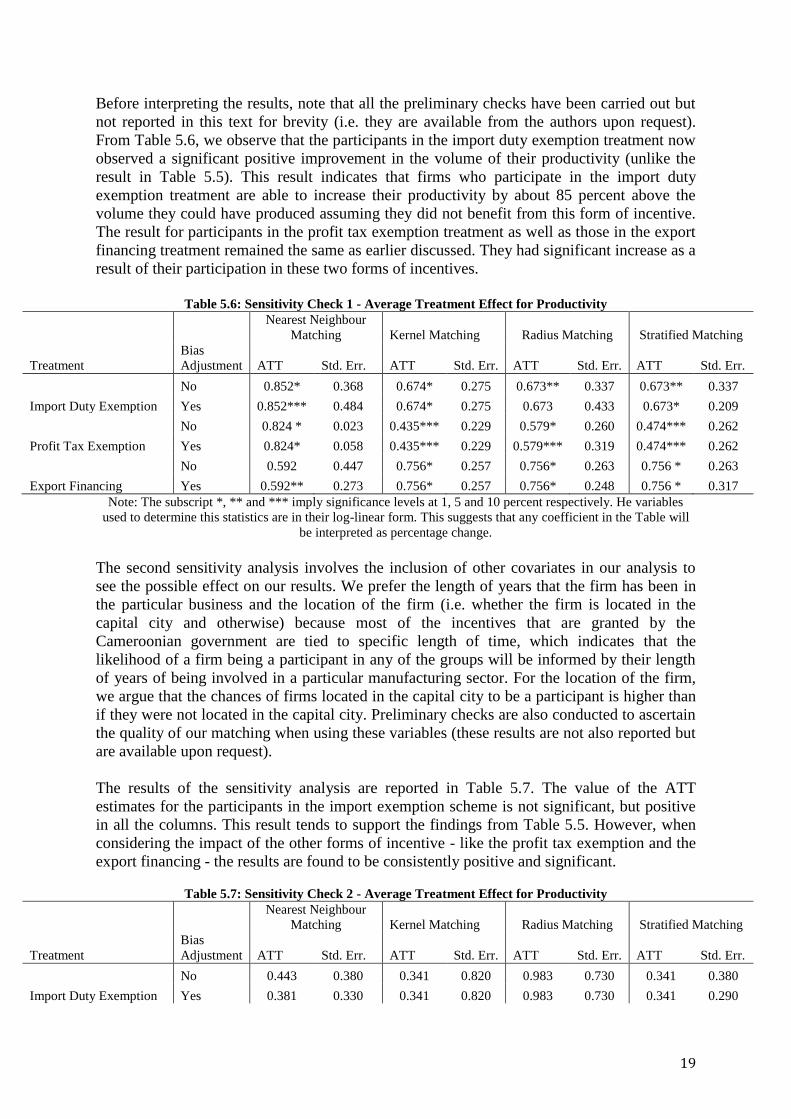
Sensitivity Analysis
To be sure that our results are not driven by the type of covariates that are included in our
PSM model, we decided to try two sensitivity checks. First, we excluded the productive
capacity and size variables from the estimation since they were not consistently significant in
the PSM logistic regression analysis that was reported in Table 5.3. Then we predicted the
ATT estimations again to see whether our results are going to change. The results of this
process are presented in Table 5.6 respectively for all the matching techniques.
19
Before interpreting the results, note that all the preliminary checks have been carried out but
not reported in this text for brevity (i.e. they are available from the authors upon request).
From Table 5.6, we observe that the participants in the import duty exemption treatment now
observed a significant positive improvement in the volume of their productivity (unlike the
result in Table 5.5). This result indicates that firms who participate in the import duty
exemption treatment are able to increase their productivity by about 85 percent above the
volume they could have produced assuming they did not benefit from this form of incentive.
The result for participants in the profit tax exemption treatment as well as those in the export
financing treatment remained the same as earlier discussed. They had significant increase as a
result of their participation in these two forms of incentives.
Table 5.6: Sensitivity Check 1 - Average Treatment Effect for Productivity
Nearest Neighbour
Matching Kernel Matching Radius Matching Stratified Matching
Treatment
Bias
Adjustment ATT Std. Err. ATT Std. Err. ATT Std. Err. ATT Std. Err.
No 0.852* 0.368 0.674* 0.275 0.673** 0.337 0.673** 0.337
Import Duty Exemption Yes 0.852*** 0.484 0.674* 0.275 0.673 0.433 0.673* 0.209
No 0.824 * 0.023 0.435*** 0.229 0.579* 0.260 0.474*** 0.262
Profit Tax Exemption Yes 0.824* 0.058 0.435*** 0.229 0.579*** 0.319 0.474*** 0.262
No 0.592 0.447 0.756* 0.257 0.756* 0.263 0.756 * 0.263
Export Financing Yes 0.592** 0.273 0.756* 0.257 0.756* 0.248 0.756 * 0.317
Note: The subscript *, ** and *** imply significance levels at 1, 5 and 10 percent respectively. He variables
used to determine this statistics are in their log-linear form. This suggests that any coefficient in the Table will
be interpreted as percentage change.
The second sensitivity analysis involves the inclusion of other covariates in our analysis to
see the possible effect on our results. We prefer the length of years that the firm has been in
the particular business and the location of the firm (i.e. whether the firm is located in the
capital city and otherwise) because most of the incentives that are granted by the
Cameroonian government are tied to specific length of time, which indicates that the
likelihood of a firm being a participant in any of the groups will be informed by their length
of years of being involved in a particular manufacturing sector. For the location of the firm,
we argue that the chances of firms located in the capital city to be a participant is higher than
if they were not located in the capital city. Preliminary checks are also conducted to ascertain
the quality of our matching when using these variables (these results are not also reported but
are available upon request).
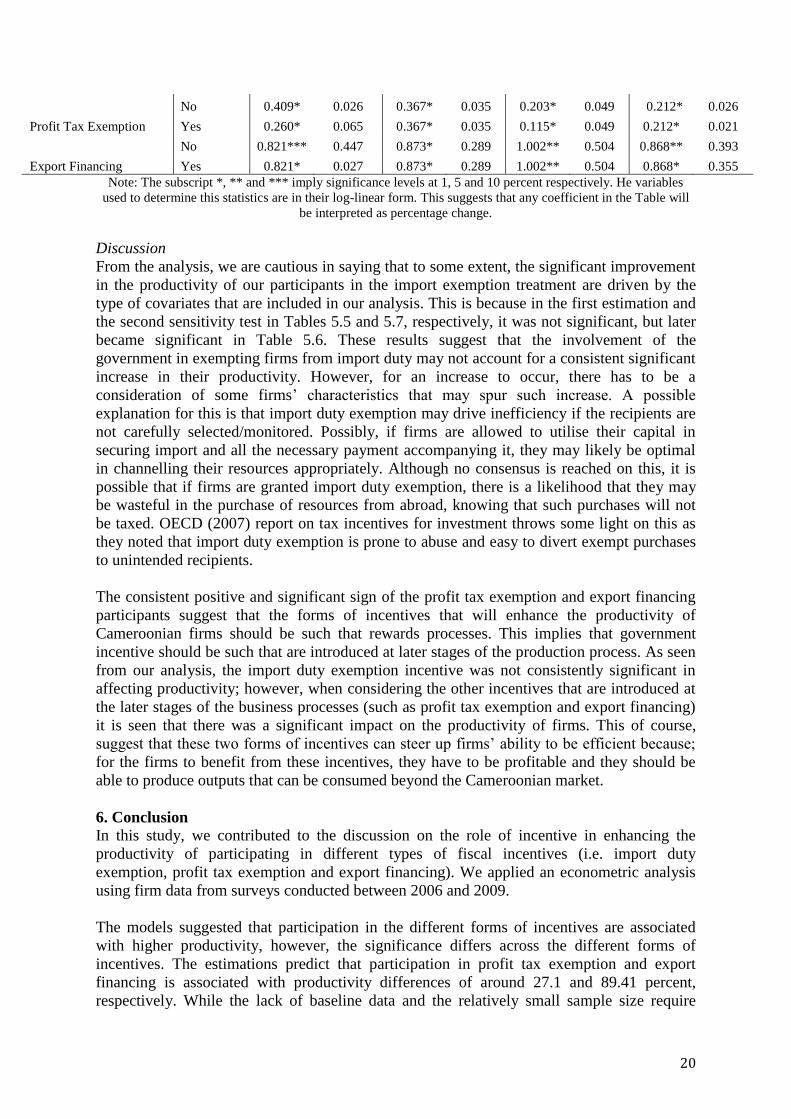
The results of the sensitivity analysis are reported in Table 5.7. The value of the ATT
estimates for the participants in the import exemption scheme is not significant, but positive
in all the columns. This result tends to support the findings from Table 5.5. However, when
considering the impact of the other forms of incentive - like the profit tax exemption and the
export financing - the results are found to be consistently positive and significant.
Table 5.7: Sensitivity Check 2 - Average Treatment Effect for Productivity
Nearest Neighbour
Matching Kernel Matching Radius Matching Stratified Matching
Treatment
Bias
Adjustment ATT Std. Err. ATT Std. Err. ATT Std. Err. ATT Std. Err.
No 0.443 0.380 0.341 0.820 0.983 0.730 0.341 0.380
Import Duty Exemption Yes 0.381 0.330 0.341 0.820 0.983 0.730 0.341 0.290
20
No 0.409* 0.026 0.367* 0.035 0.203* 0.049 0.212* 0.026
Profit Tax Exemption Yes 0.260* 0.065 0.367* 0.035 0.115* 0.049 0.212* 0.021
No 0.821*** 0.447 0.873* 0.289 1.002** 0.504 0.868** 0.393
Export Financing Yes 0.821* 0.027 0.873* 0.289 1.002** 0.504 0.868* 0.355
Note: The subscript *, ** and *** imply significance levels at 1, 5 and 10 percent respectively. He variables
used to determine this statistics are in their log-linear form. This suggests that any coefficient in the Table will
be interpreted as percentage change.
Discussion
From the analysis, we are cautious in saying that to some extent, the significant improvement
in the productivity of our participants in the import exemption treatment are driven by the
type of covariates that are included in our analysis. This is because in the first estimation and
the second sensitivity test in Tables 5.5 and 5.7, respectively, it was not significant, but later
became significant in Table 5.6. These results suggest that the involvement of the
government in exempting firms from import duty may not account for a consistent significant
increase in their productivity. However, for an increase to occur, there has to be a
consideration of some firms’ characteristics that may spur such increase. A possible
explanation for this is that import duty exemption may drive inefficiency if the recipients are
not carefully selected/monitored. Possibly, if firms are allowed to utilise their capital in
securing import and all the necessary payment accompanying it, they may likely be optimal
in channelling their resources appropriately. Although no consensus is reached on this, it is
possible that if firms are granted import duty exemption, there is a likelihood that they may
be wasteful in the purchase of resources from abroad, knowing that such purchases will not
be taxed. OECD (2007) report on tax incentives for investment throws some light on this as
they noted that import duty exemption is prone to abuse and easy to divert exempt purchases
to unintended recipients.
The consistent positive and significant sign of the profit tax exemption and export financing
participants suggest that the forms of incentives that will enhance the productivity of
Cameroonian firms should be such that rewards processes. This implies that government
incentive should be such that are introduced at later stages of the production process. As seen
from our analysis, the import duty exemption incentive was not consistently significant in
affecting productivity; however, when considering the other incentives that are introduced at
the later stages of the business processes (such as profit tax exemption and export financing)
it is seen that there was a significant impact on the productivity of firms. This of course,
suggest that these two forms of incentives can steer up firms’ ability to be efficient because;
for the firms to benefit from these incentives, they have to be profitable and they should be
able to produce outputs that can be consumed beyond the Cameroonian market.
6. Conclusion In this study, we contributed to the discussion on the role of incentive in enhancing the
productivity of participating in different types of fiscal incentives (i.e. import duty
exemption, profit tax exemption and export financing). We applied an econometric analysis
using firm data from surveys conducted between 2006 and 2009.
The models suggested that participation in the different forms of incentives are associated
with higher productivity, however, the significance differs across the different forms of
incentives. The estimations predict that participation in profit tax exemption and export
financing is associated with productivity differences of around 27.1 and 89.41 percent,
respectively. While the lack of baseline data and the relatively small sample size require
21
caution in inferring causation, the results may be suggestive of underlying causal impact of
participating in fiscal incentive regimes as a manufacturing firm in Cameroon.
This study is not an overall assessment of the impact of fiscal incentives on manufacturing
firms’ productivity in Cameroon. However, in order to decide on the overall impact, indirect
effects within firms have to be taken into consideration. Overall, impact depends on intra-
firm decision making of how to utilize such benefits that are derived from the government to
influence its overall productivity. This highlights the need to add further explanatory
variables to address this issue particularly as it relates to individual firm basis, which will be
an advancement to this study.
References
Action Aid (2014), Investment Incentives in Ghana: The Cost to Socio-Economic
Development, Retrieved from
http://www.actionaid.org/sites/files/actionaid/investment-tax_incentives_in_ghana_-
_an_actionaid_research_report.pdf
Arnold, J., Mattoo, A., and Narciso, G., (2008), Services Inputs and Firm Productivity in
Sub-Saharan Africa: Evidence from Firm-Level Data, Journal of African Economies,
17(4): 578-599
Austin, P.C., (2011), An Introduction to Propensity Score Methods for Reducing the Effects
of Confounding in Observational Studies, Multivariate Behavioural Research. London:
Routledge.
Barron, M., (2014), Econometric Tools 1: Non-Parametric Methods, University of California:
Santa Cruz.
Becker, S.O., and Ichino, A., (2002), Estimation of average treatment effects based on
propensity scores, The Stata Journal, 2(4): 358-377.
Biya, P., (2013), Law N° 2013/004 of 18 April 2013 to lay down private investment
incentives n the Republic of Cameroon, Retrieved from
http://turcaba.org/index_htm_files/new-incentive-laws-oninvestment-in-the-republic-
of-cameroon.pdf
Bora, B. (2002) Investment Distortions and the International Policy Architecture, World
Trade Organisation, Working Paper, Geneva. Retrieved from
https://core.ac.uk/download/files/35/272221.pdfBureau of Economic and Business
Affairs (2013), 2013 Investment Climate Statement – Cameroon, Retrieved from
http://www.state.gov/e/eb/rls/othr/ics/2013/204615.htm
Caliendo, M., and Kopeinig, S., (2005), Some Practical Guidance for the Implementation of
Propensity Score Matching. Discussion Paper 1588. Bonn: Institute for the Study of
Labour (IZA).
Central Bank of Nigeria-CBN (2013), Fiscal Incentives in Nigeria: Lessons of Experience,
Abuja:CBN
Clarke, G. (2012). Manufacturing Firms in Africa: Some Stylized Facts about Wages and
Productivity, In Dinh, H.T., and Clarke, G.R.G., (Eds.), Performance of Manufacturing
Firms in Africa: An Empirical Analysis: 47-83, Washington: World Bank.
Cleeve, E., (2008), How Effective Are Fiscal Incentives to Attract FDI to Sub-Saharan
Africa? The Journal of Developing Areas, 42(1): 135-153.
22
Cotula, L., Vermeulen, S., Leonard, R., and Keeley, J., (2009), Land grab or development
opportunity? Agricultural investment and international land deals in Africa,
IIED/FAO/IFAD, London/Rome.
Dodzin, S., and Vamvakidis, A. (2004). Trade and industrialization in developing economies.
Journal of Development Economics, 75,319-328.
Escribano, A., Guasch, J.L., and Pena, J., (2010), Assessing the Impact of Infrastructure
Quality on Firm Productivity in Africa: Cross-Country Comparisons Based on
Investment Climate Surveys from 1999 to 2005, World Bank Policy Research Working
Paper No. 5191.
Fletcher, K., (2002), Tax Incentives in Cambodia, Lao PDR, and Vietnam, IMF Conference of
Foreign Direct Investment: Opportunities and Challenges for Cambodia, Lao PDR and
Vietnam, Vietnam, August 16-17, 2002. Retrieved from
https://www.imf.org/external/pubs/ft/seminar/2002/fdi/eng/pdf/fletcher.pdf
Gui-Diby, S., and Renard, M., (2015), Foreign Direct Investment Inflows and the
Industrialization of African Countries, World Development, 74: 43-57.
Heckman, J., Ichimura, H., Todd, P.E., (1997), Matching as an econometric evaluation
estimator: evidence from evaluating a job training program. Review of Economic
Studies 64:605-654
Heckman, J., La Londe, R., and Smith, J., (1999), The Economics and Econometrics of
Active Labour Market Programs, In Ashenfelter, O., and Card, D., (Eds.), Handbook of
Labour Economics, III: 1865 - 2097. Elsevier, Amsterdam.
IMF (2012), Sub-Saharan Africa-Maintaining Growth in an Uncertain World, Washington:
IMF.
Kang, S. J., and Lee, H. (2011). Foreign direct investment and deindustrialisation. The World
Economy, 313-329.
Lee, J., (1996), Government Interventions and Productivity Growth, Journal of Economic
Growth, 1(3): 391-414.
McArthur, J., and Teal, F., (2002), Corruption and Firm Performance in Africa, Centre for the
Study of African Economies Working Paper, CSAE WPS/2002-10.
Mayende, S., (2013), The Effects of Tax Incentives on Firm Performance: Evidence from
Uganda, Journal of Politics and Law, 6(4): 95-107.
Ndichu, J., Blohmke, J., Kemp, R., Adeoti, J., and Obayelu, A.E., (2015), The adoption of
energy efficiency measures by firms in Africa: case studies of cassava processing in
Nigeria and maize milling in Kenya, Innovation and Development, 5(2): 189-206.
Nkhata, R., Jumbe, C., and Mwabumba, M., (2014), Does irrigation have an impact on food
security and poverty? IFPRI Working Paper 04/June, 2014.
OECD (2007), Tax Incentives for Investment - A Global Perspective: experiences in MENA
and non-MENA countries, OECD.
Ohaka, J., and Agundu, P.U., (2012), Tax Incentives for Industry Synergy in Nigeria: A
Pragmatic Proprietary System Advocacy, African Research Review, 6(3): 42-58.

23
Osabuohien, E.S., (2014), Large-scale agricultural land investments and local institutions in
Africa: The Nigerian case, Land Use Policy, 39: 155-165.
Pufahl, A., and Weiss, C.R., (2008), Evaluating the Effects of Farm Programs: Results from
Propensity Score Matching, 12th Congress of the European Association of Agricultural
Economists – EAAE 2008
Rosenbaum, P.R., and Rubin, D.B., (1983). The central role of propensity score in
observational studies for causal effects, Biometrica, 70:41-55
Tabi, A., (2005), Fiscal Policy and Sectoral Productivity Convergence in Cameroon:
Implications for Poverty Reduction, Washington Conference at the IMF, 15-16
February 2005
UNCTAD (2000), Tax Incentives and Foreign Direct Investment: A Global Survey, Geneva:
UNCTAD
UNCTAD (2004), Incentives, Geneva: UNCTAD
UNCTAD (2014). Investing in the SDGs: An Action Plan, World Investment Report,
Switzerland: United Nations
UNCTAD (2015), Broadening the Sources of Growth in Africa: The Role of Investment,
Geneva: UNCTAD
UNECA. (2013). Making the most of Africa’s commodities: Industrializing for growth, jobs,
and economic transformation. Addis Ababa: United Nations ECA.