Embed Size (px)
Citation preview
Inclusive growth in Russia: Achievements and Challenges
Ana RevengaSenior Director
Poverty and Equity Global Practice, The World Bank
Moscow, 7 April 2015
2
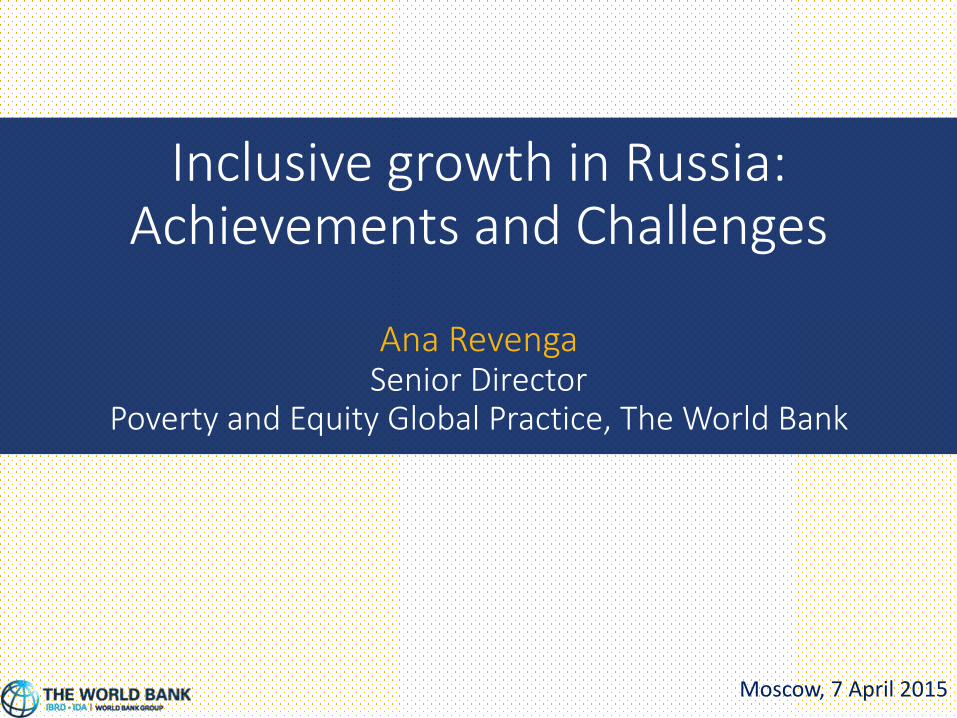
Growth is the main driver of improved economic welfare globally, but the inclusiveness of growth matters too
The World Bank uses the Shared Prosperity indicator to monitor both average growth and growth of the lower quintiles of the population in every country
Shared Prosperity
• Growth has been inclusive globally, with the bottom 40 growing faster than the average in more than 70% of countries for which data is available.
• But in about 1/5 of these cases growth rates are very low (under 2%) limiting progress on this goal.
• And in some high growth countries, including in Europe and Central Asia, shared prosperity has been spurred by social transfers which may not be sustainable.
Source: World Bank, Global Database for Shared Prosperity
3
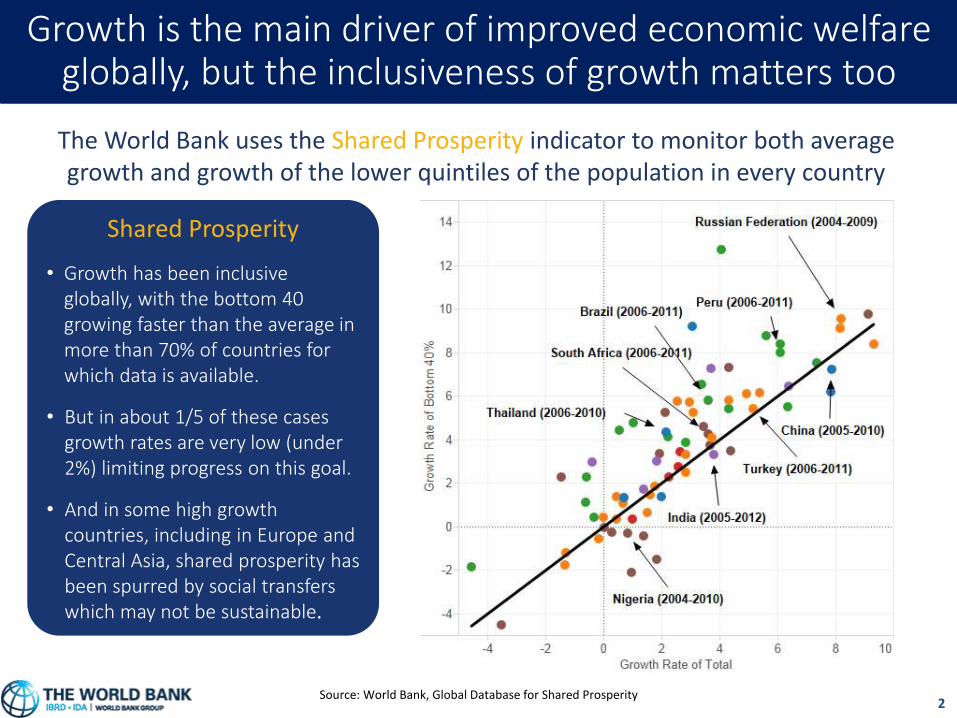
Eastern Europe and Central Asia performed well on shared prosperity, and Russia provided a strong example of this
Shared Prosperity in the Eastern Europe and Central Asia region, circa 2006-2011
An
nu
aliz
ed g
row
th in
inco
me/
con
sum
pti
on
, %
Source: World Bank, Global Database for Shared Prosperity
0
10
20
30
40
50
60
70
80
90
100
2001 2002 2003 2004 2005 2006 2007 2008 2009 2010 2011 2012
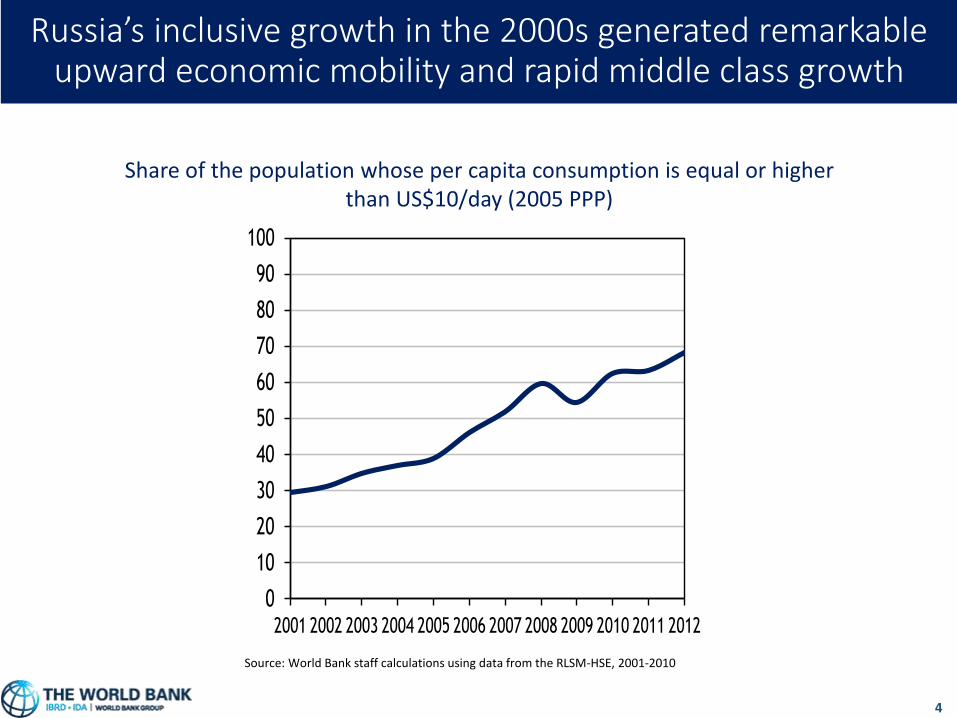
Source: World Bank staff calculations using data from the RLSM-HSE, 2001-2010
Share of the population whose per capita consumption is equal or higher than US$10/day (2005 PPP)
Russia’s inclusive growth in the 2000s generated remarkable upward economic mobility and rapid middle class growth
4
5
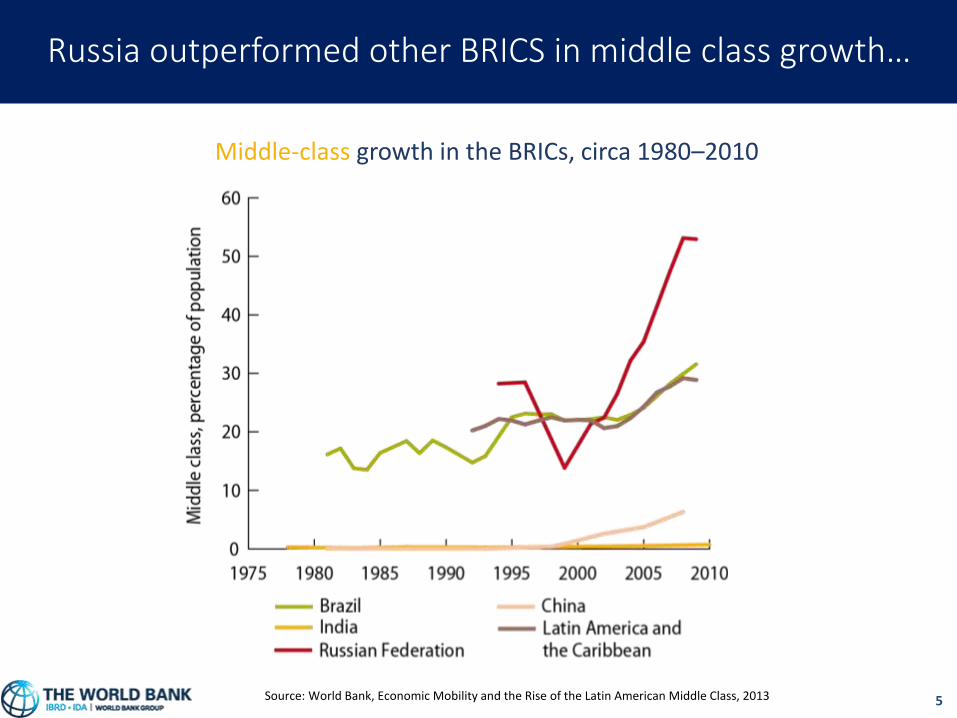
Russia outperformed other BRICS in middle class growth…
Middle-class growth in the BRICs, circa 1980–2010
Source: World Bank, Economic Mobility and the Rise of the Latin American Middle Class, 2013
6
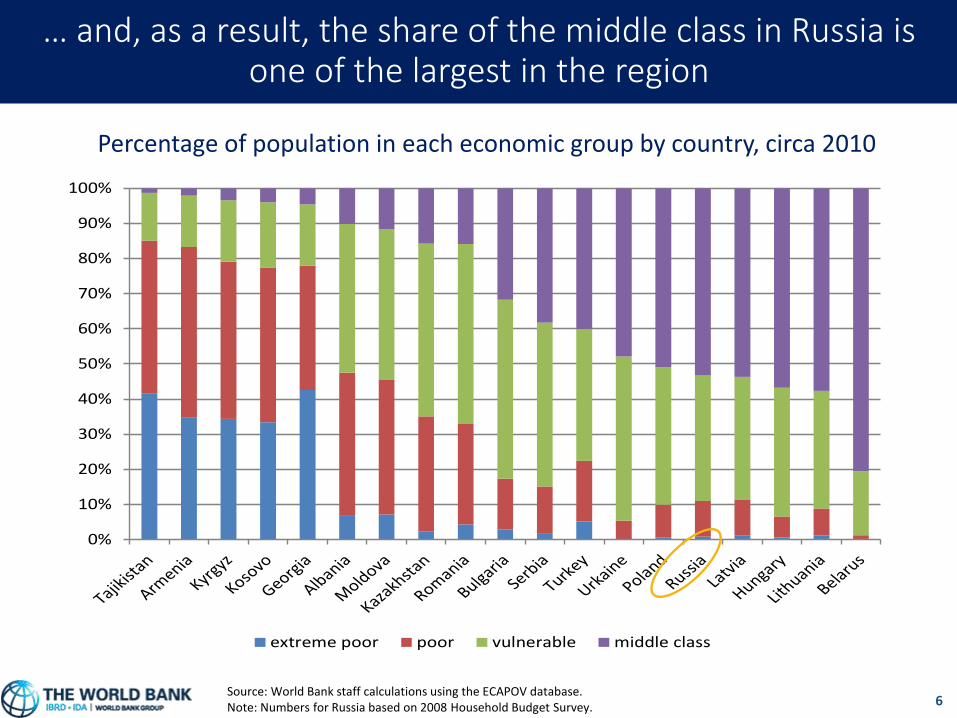
… and, as a result, the share of the middle class in Russia is one of the largest in the region
0%
10%
20%
30%
40%
50%
60%
70%
80%
90%
100%
extreme poor poor vulnerable middle class
Source: World Bank staff calculations using the ECAPOV database. Note: Numbers for Russia based on 2008 Household Budget Survey.
Percentage of population in each economic group by country, circa 2010
7
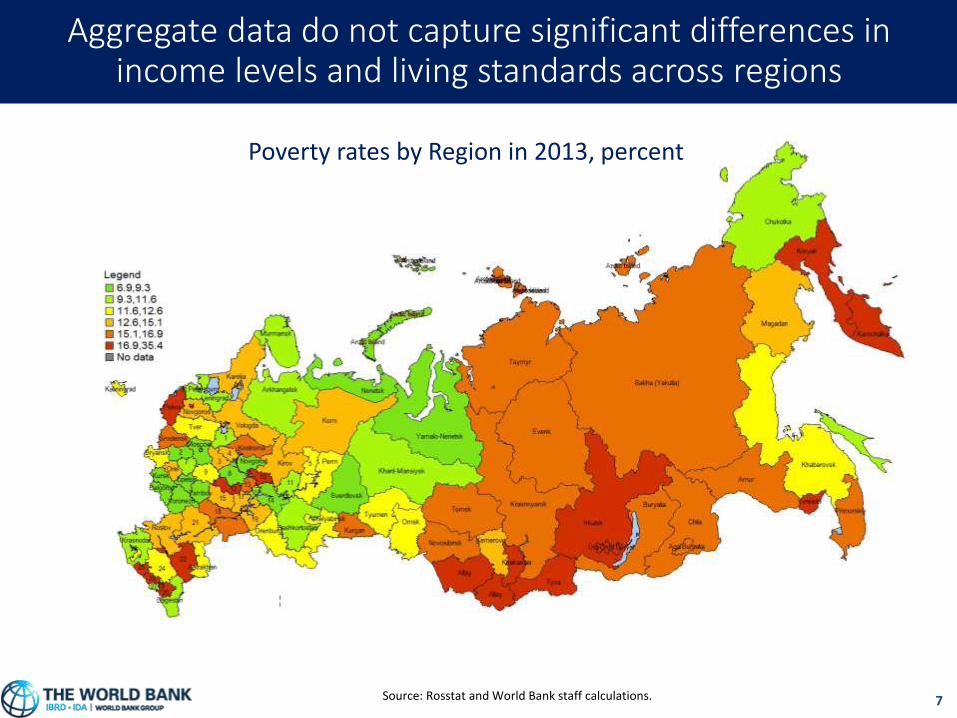
Aggregate data do not capture significant differences in income levels and living standards across regions
Heterogeneity x
Source: Rosstat and World Bank staff calculations.
Poverty rates by Region in 2013, percent
8
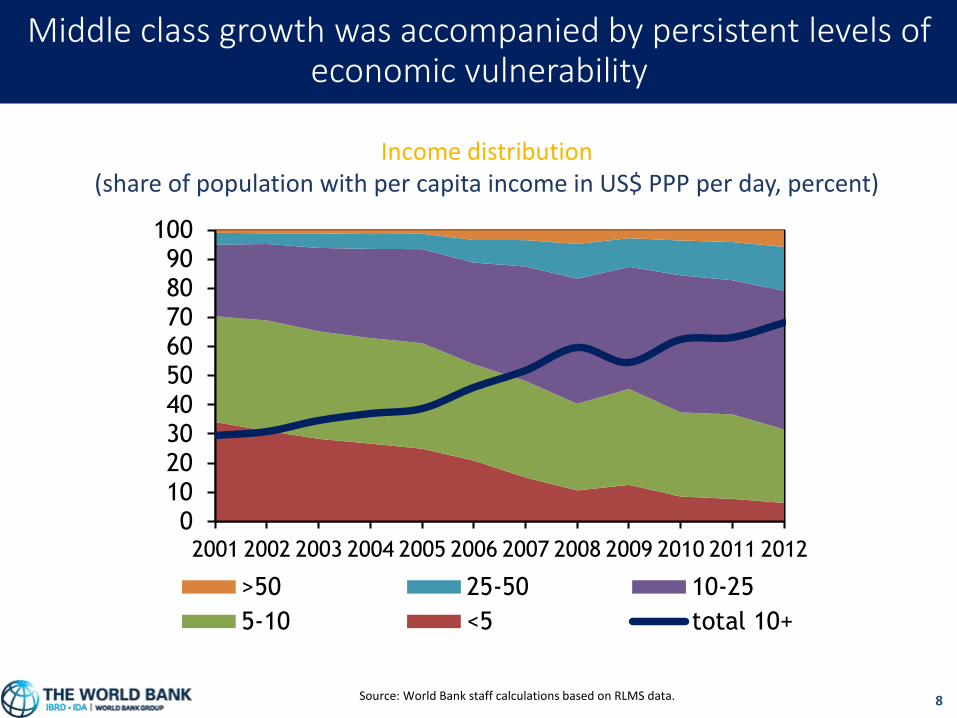
Middle class growth was accompanied by persistent levels of economic vulnerability
Income distribution(share of population with per capita income in US$ PPP per day, percent)
Source: World Bank staff calculations based on RLMS data.
0102030405060708090
100
2001 2002 2003 2004 2005 2006 2007 2008 2009 2010 2011 2012
>50 25-50 10-25
5-10 <5 total 10+
9
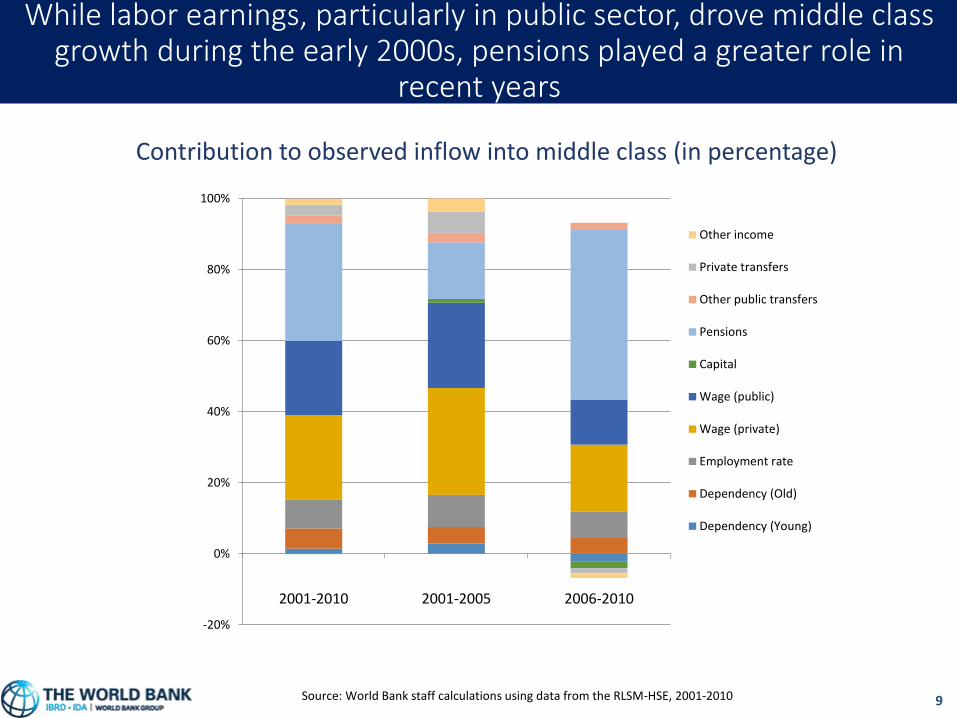
While labor earnings, particularly in public sector, drove middle class growth during the early 2000s, pensions played a greater role in
recent years
Contribution to observed inflow into middle class (in percentage)
Source: World Bank staff calculations using data from the RLSM-HSE, 2001-2010
-20%
0%
20%
40%
60%
80%
100%
2001-2010 2001-2005 2006-2010
Other income
Private transfers
Other public transfers
Pensions
Capital
Wage (public)
Wage (private)
Employment rate
Dependency (Old)
Dependency (Young)
10
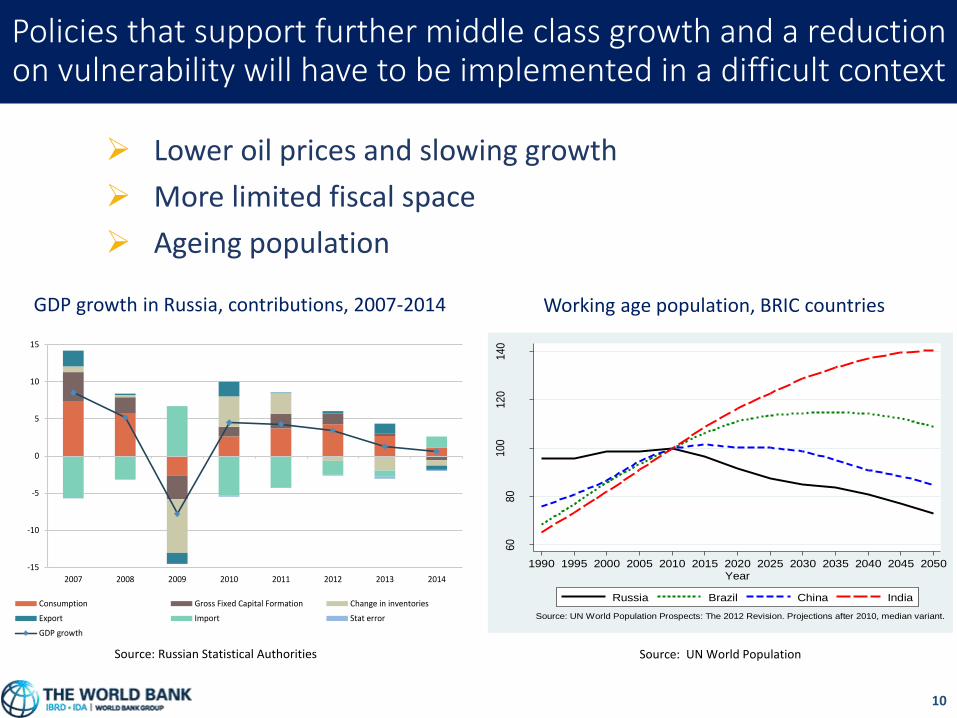
Policies that support further middle class growth and a reduction on vulnerability will have to be implemented in a difficult context
60
80
100
120
140
Popula
tion A
ged
15 t
o 6
4 (
201
0=
100)
1990 1995 2000 2005 2010 2015 2020 2025 2030 2035 2040 2045 2050Year
Russia Brazil China India
Source: UN World Population Prospects: The 2012 Revision. Projections after 2010, median variant.
Working age population, BRIC countries
Source: UN World Population
-15
-10
-5
0
5
10
15
2007 2008 2009 2010 2011 2012 2013 2014
Consumption Gross Fixed Capital Formation Change in inventories
Export Import Stat error
GDP growth
Lower oil prices and slowing growth
More limited fiscal space
Ageing population
GDP growth in Russia, contributions, 2007-2014
Source: Russian Statistical Authorities
11
Russia may benefit from rebalancing its policy strategy in two different dimensions
1. Rebalancing the role of the private vs. public sectors in driving economic activity, productivity growth and job creation, by leveling the playing field
2. Rebalancing the responsibilities and accountability for service delivery between central and regional governments, by strengthening local governance and improving effectiveness
This would need to be done while rationalizing and continuing to provide targeted social insurance and safety net support to
the most vulnerable, the elderly and those unable to work

12
Rebalancing the role of the private vs. public sectorin driving economic activity, productivity growth and
job creation, by leveling the playing field
13
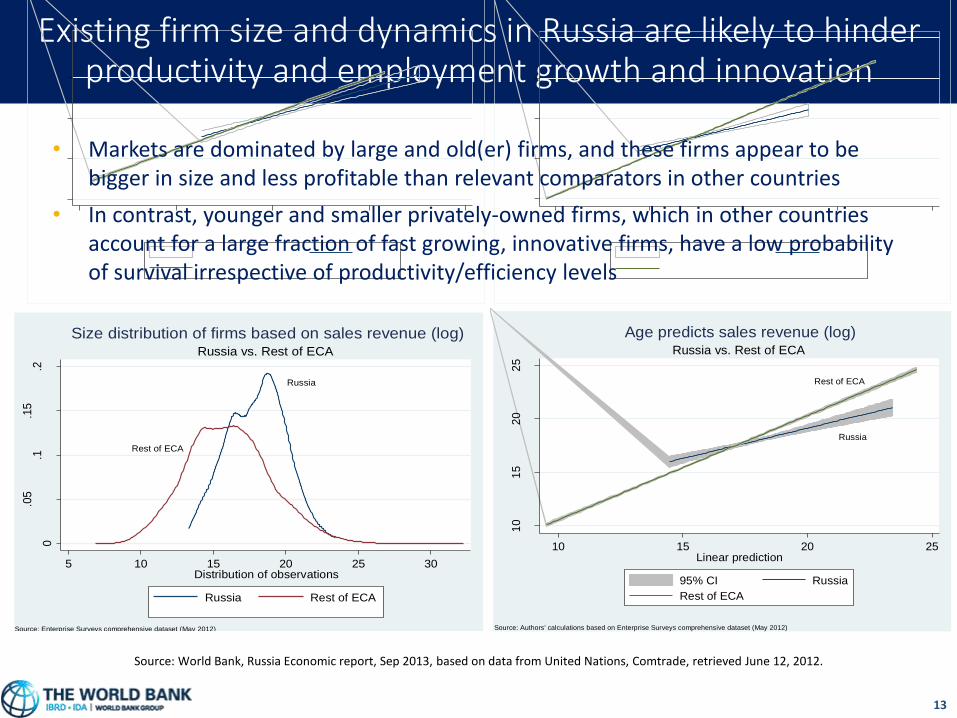
Existing firm size and dynamics in Russia are likely to hinder productivity and employment growth and innovation
RussiaRest of ECA
0
.05
.1.1
5.2
.25
kd
en
sity lab
or
forc
e (
log)
0 2 4 6 8 10Distribution of observations
Russia Rest of ECA
Source: Enterprise Surveys comprehensive dataset (May 2012)
Russia vs. Rest of ECA
Size distribution of firms based on labor force (log)
Russia
Rest of the World
0.1
.2.3
kd
en
sity lab
or
forc
e (
log)
0 5 10Distribution of observations
Russia Rest of the World
Source: Enterprise Surveys comprehensive dataset (May 2012)
Russia vs. Rest of the World
Size distribution of firms based on labor force (log)
Russia
Rest of ECA
0
.05
.1.1
5.2
kd
en
sity s
ale
s r
even
ue
(lo
g)
5 10 15 20 25 30Distribution of observations
Russia Rest of ECA
Source: Enterprise Surveys comprehensive dataset (May 2012)
Russia vs. Rest of ECA
Size distribution of firms based on sales revenue (log)
Russia
Rest of the World
0
.05
.1.1
5.2
kd
en
sity o
f sale
s r
eve
nu
e (
log)
0 10 20 30 40Distribution of observations
Russia Rest of the World
Source: Enteprise Surveys comprehensive dateset (May 2012)
Russia vs. Rest of the World
Size distribution of firms based on sales revenue (log)
Rest of the World
Russia
02
46
8
Actu
al siz
e o
f la
bo
r (l
og
)
0 2 4 6 8Linear prediction
95% CI Russia
Rest of the World
Source: Authors' calculations based on comprehensive dataset of Enterprise Surveys (May 2012)
Russia vs. Rest of the World
Age predicts size of labor force (log)
Rest of the World
Russia
10
15
20
25
30
Actu
al sale
s r
eve
nu
e (
log)
10 15 20 25 30Linear prediction
95% CI Russia
Rest of the World
Source: Authors' calculations based on comprehensive dataset of Enterprise Surveys (May 2012)
Russia vs. Rest of the World
Age predicts sales revenue (log)
Russia
Rest of ECA
02
46
8
Actu
al siz
e o
f la
bo
r fo
rce
(lo
g)
0 2 4 6 8Linear prediction
95% CI Russia
Rest of ECA
Source: Authors' calculatons based on Enterprise Survey comprehensive dataset (May 2012)
Russia vs. Rest of ECA
Age predicts size of labor force (log)
Russia
Rest of ECA
10
15
20
25
Acu
tal sale
s r
eve
nu
e (
log)
10 15 20 25Linear prediction
95% CI Russia
Rest of ECA
Source: Authors' calculations based on Enterprise Surveys comprehensive dataset (May 2012)
Russia vs. Rest of ECA
Age predicts sales revenue (log)
Source: World Bank, Russia Economic report, Sep 2013, based on data from United Nations, Comtrade, retrieved June 12, 2012.
• Markets are dominated by large and old(er) firms, and these firms appear to be bigger in size and less profitable than relevant comparators in other countries
• In contrast, younger and smaller privately-owned firms, which in other countries account for a large fraction of fast growing, innovative firms, have a low probability of survival irrespective of productivity/efficiency levels
14
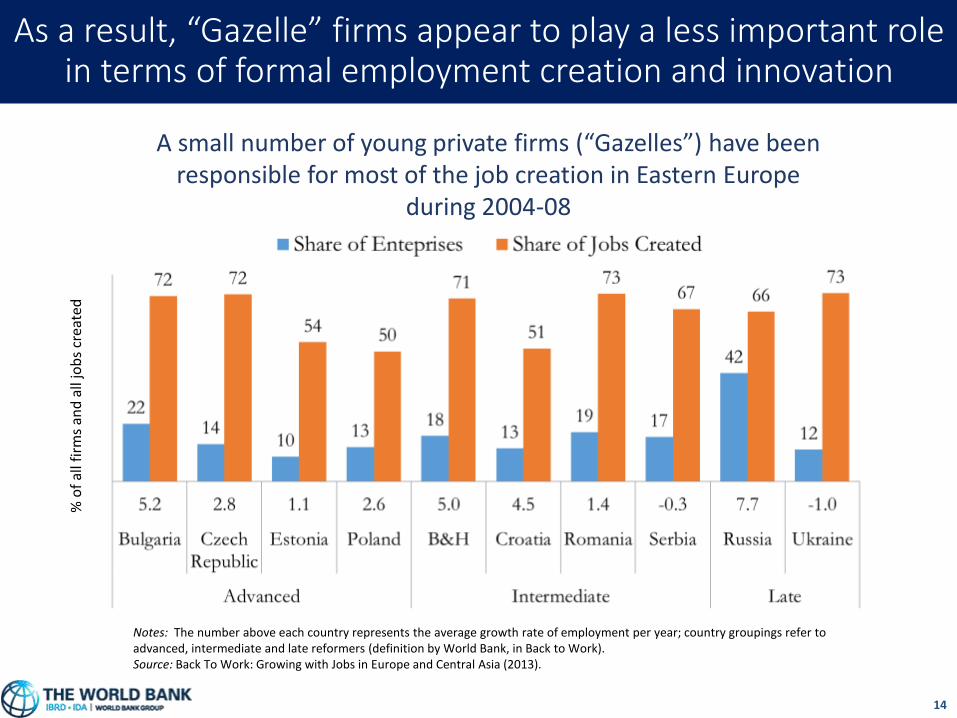
As a result, “Gazelle” firms appear to play a less important role in terms of formal employment creation and innovation
A small number of young private firms (“Gazelles”) have been responsible for most of the job creation in Eastern Europe
during 2004-08
Notes: The number above each country represents the average growth rate of employment per year; country groupings refer to advanced, intermediate and late reformers (definition by World Bank, in Back to Work).Source: Back To Work: Growing with Jobs in Europe and Central Asia (2013).
% o
f al
l fir
ms
and
all
job
s cr
eate
d
15
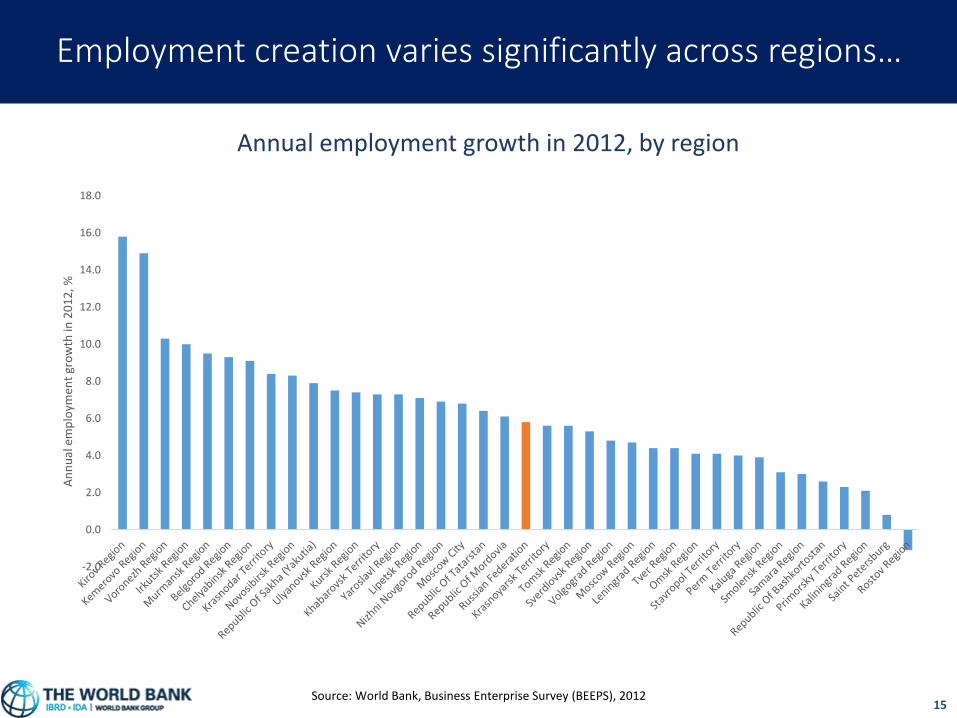
Employment creation varies significantly across regions…
-2.0
0.0
2.0
4.0
6.0
8.0
10.0
12.0
14.0
16.0
18.0
An
nu
al e
mp
loym
ent
gro
wth
in 2
01
2, %
Annual employment growth in 2012, by region
Source: World Bank, Business Enterprise Survey (BEEPS), 2012
16
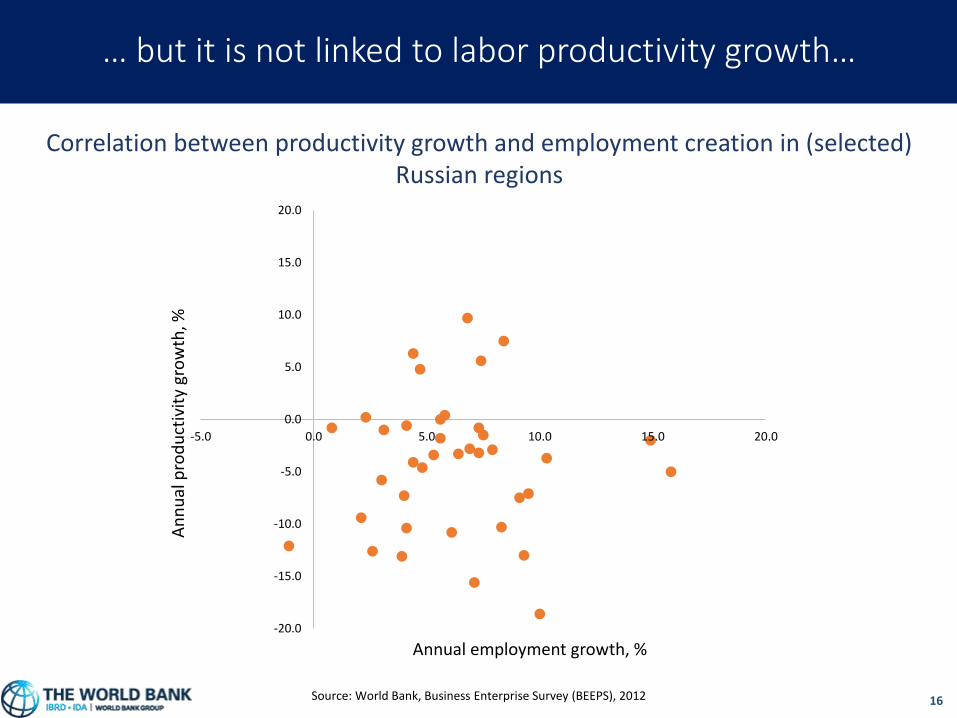
… but it is not linked to labor productivity growth…
Source: World Bank, Business Enterprise Survey (BEEPS), 2012
-20.0
-15.0
-10.0
-5.0
0.0
5.0
10.0
15.0
20.0
-5.0 0.0 5.0 10.0 15.0 20.0
An
nu
al p
rod
uct
ivit
y gr
ow
th, %
Annual employment growth, %
Correlation between productivity growth and employment creation in (selected) Russian regions
17
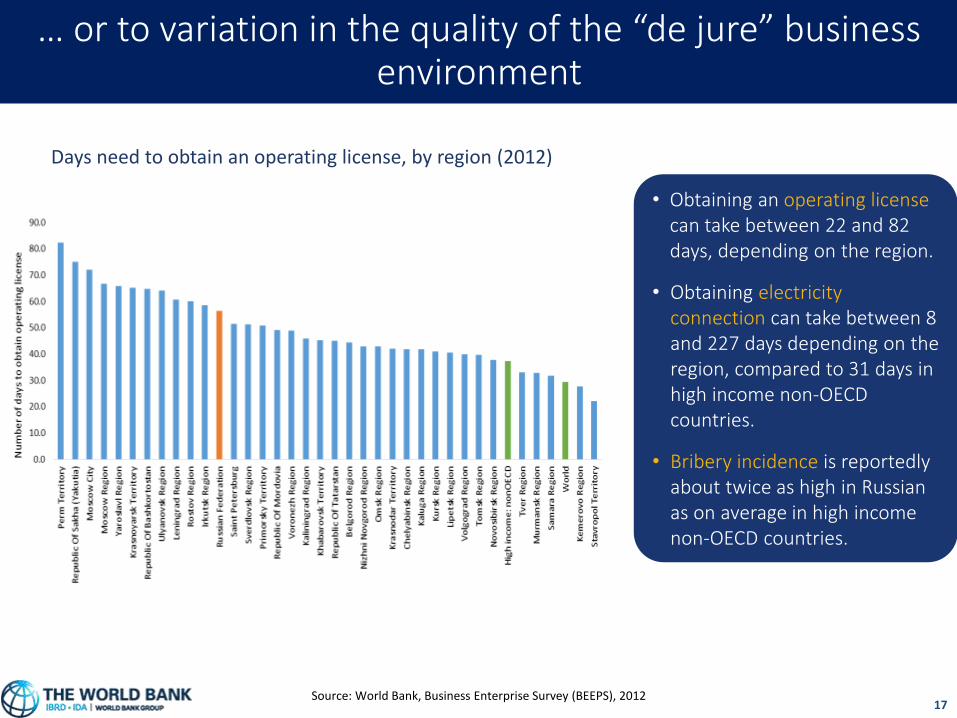
… or to variation in the quality of the “de jure” business environment
Source: World Bank, Business Enterprise Survey (BEEPS), 2012
Days need to obtain an operating license, by region (2012)
• Obtaining an operating license can take between 22 and 82 days, depending on the region.
• Obtaining electricity connection can take between 8 and 227 days depending on the region, compared to 31 days in high income non-OECD countries.
• Bribery incidence is reportedly about twice as high in Russian as on average in high income non-OECD countries.
18
Rebalancing the responsibilities and accountability for service delivery between central and regional
governments, by strengthening local governance while avoiding exacerbating inequalities
19
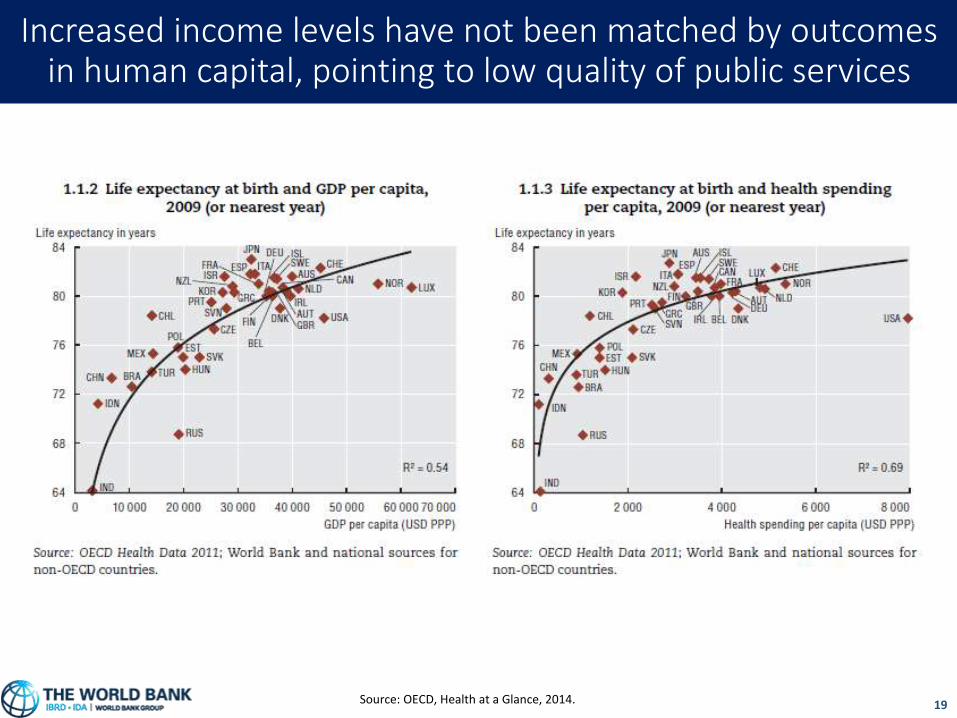
Increased income levels have not been matched by outcomes in human capital, pointing to low quality of public services
Source: OECD, Health at a Glance, 2014.
20
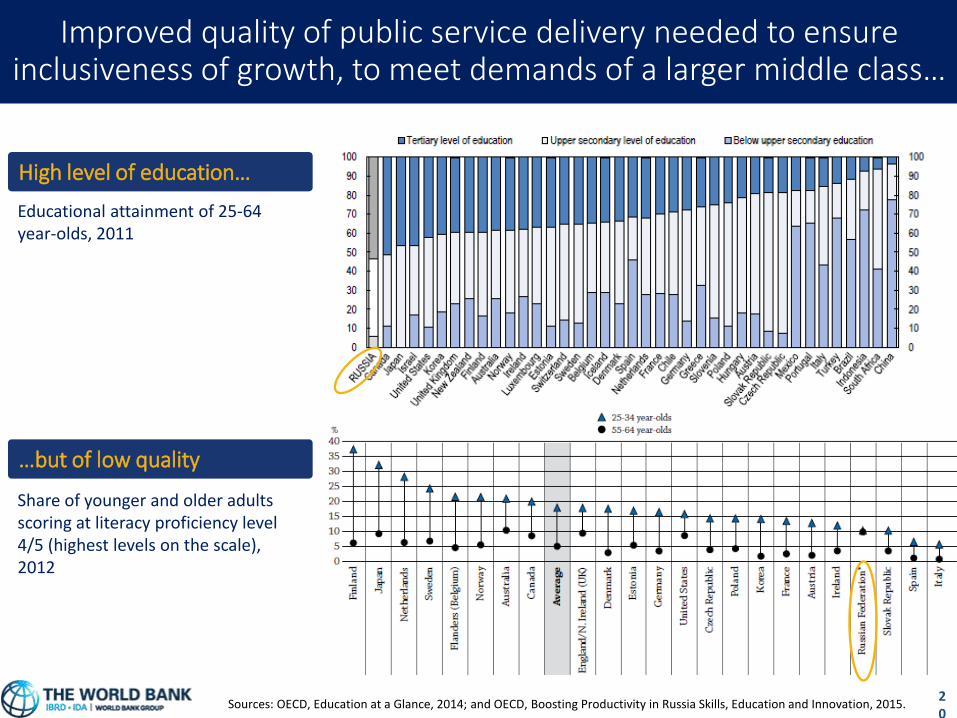
Improved quality of public service delivery needed to ensure inclusiveness of growth, to meet demands of a larger middle class…
Sources: OECD, Education at a Glance, 2014; and OECD, Boosting Productivity in Russia Skills, Education and Innovation, 2015.
High level of education…
…but of low quality
Educational attainment of 25-64 year-olds, 2011
Share of younger and older adults scoring at literacy proficiency level 4/5 (highest levels on the scale), 2012
21
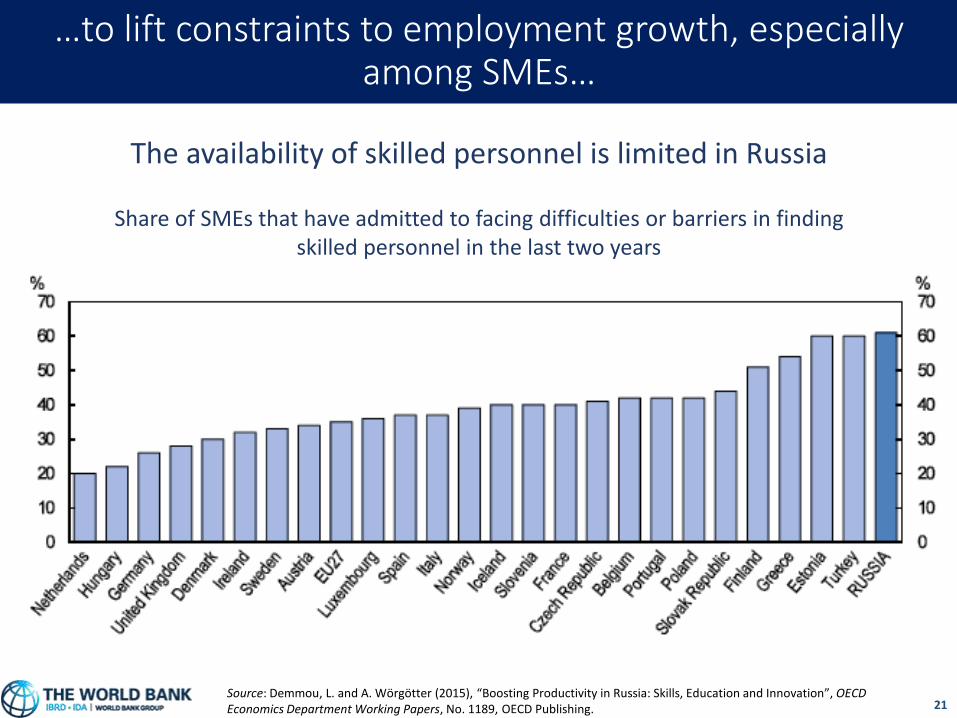
…to lift constraints to employment growth, especially among SMEs…
The availability of skilled personnel is limited in Russia
Share of SMEs that have admitted to facing difficulties or barriers in finding skilled personnel in the last two years
Source: Demmou, L. and A. Wörgötter (2015), “Boosting Productivity in Russia: Skills, Education and Innovation”, OECDEconomics Department Working Papers, No. 1189, OECD Publishing.
22
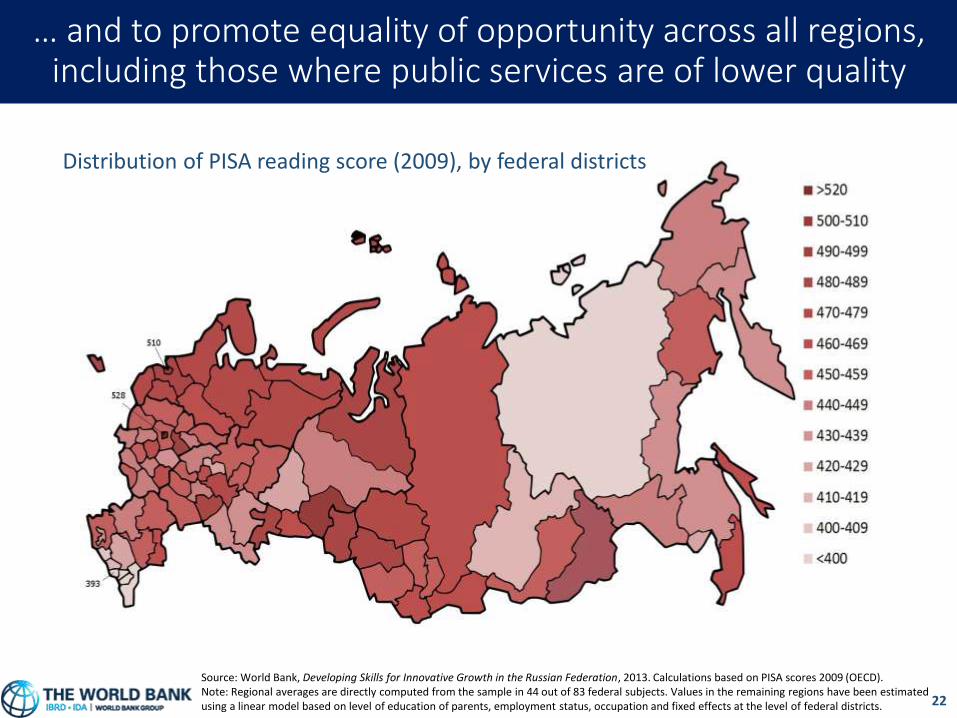
… and to promote equality of opportunity across all regions, including those where public services are of lower quality
Source: World Bank, Developing Skills for Innovative Growth in the Russian Federation, 2013. Calculations based on PISA scores 2009 (OECD).Note: Regional averages are directly computed from the sample in 44 out of 83 federal subjects. Values in the remaining regions have been estimated using a linear model based on level of education of parents, employment status, occupation and fixed effects at the level of federal districts.
Distribution of PISA reading score (2009), by federal districts
23
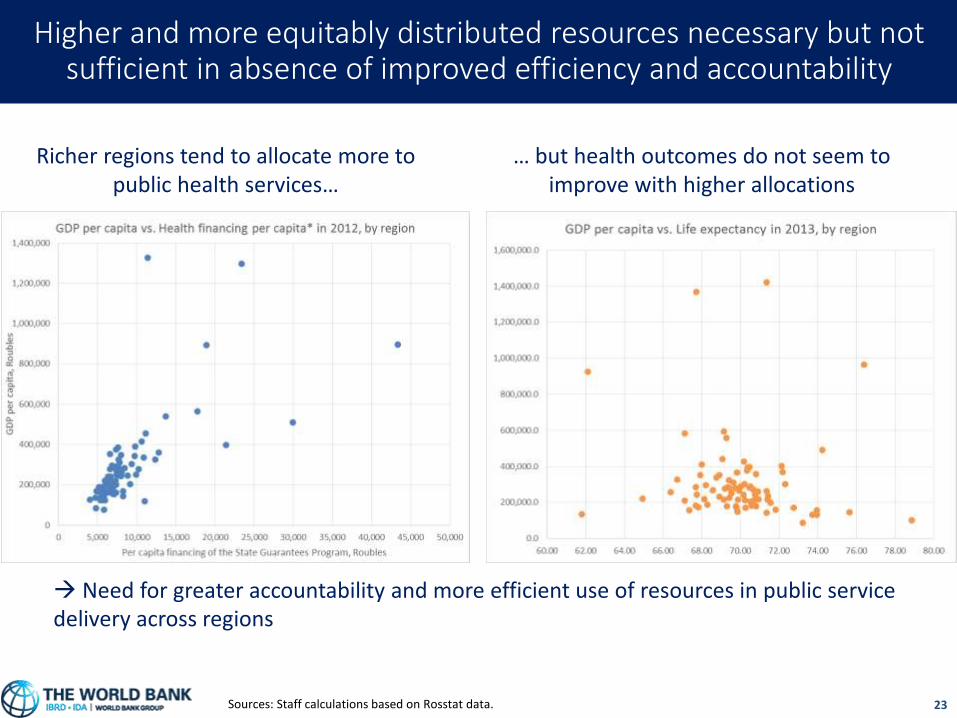
Higher and more equitably distributed resources necessary but not sufficient in absence of improved efficiency and accountability
Sources: Staff calculations based on Rosstat data.
Richer regions tend to allocate more to public health services…
… but health outcomes do not seem to improve with higher allocations
Need for greater accountability and more efficient use of resources in public service delivery across regions
24
Conclusion
Sustaining and deepening progress in income mobility will require:
Improving competitiveness, removing market distortions, and promoting non-oil private sector job creation;
Fostering effectiveness, accountability and responsiveness of public service delivery to needs and demands of several population groups (in terms of income, location etc.).

Thank you