Embed Size (px)
Citation preview
DFI JOURNAL Vol. 2 No. 1 November 2008 [11]
INTRODUCTIONTuttle Creek Dam is part of a system that provides a comprehensive plan for flood control and other functions in the Missouri River Basin. The dam was designed and constructed by the US Army Corps of Engineers, Kansas City District. Tuttle Creek Dam is located on the Big Blue River in the Kansas River Basin. It is located about six miles north of the city of Manhattan in eastern Kansas and provides flood control, recreation, fish and wildlife habitat, water quality, water supply, and supplemental releases for navigation on the Missouri River below Kansas City. The embankment is 2,286 m (7500 ft) long and 41.8 m (137 ft) high. The crest width is 15.2 m (50 ft) and the base width is 475 m (1560 ft). The top of the dam is at elevation 353.3 m (1159 ft), and the original ground surface varies from about 310 m to 313 m (1017 ft to 1027 ft) across the valley. Tuttle Creek Dam is a rolled earthfill dam; details of the fill zones and construction of the
dam can be found in Lane and Fehrman (1960). A typical cross-section of the embankment is provided in Fig. 1.
The main seismic source zones for Tuttle Creek Dam are the Nemaha Ridge uplift zone and the Humboldt Fault zone, both of which are located just to the east of the dam. The maximum credible earthquake (MCE), i.e., the design earthquake, is a magnitude 6.6 event at 20 km (12.5 miles) with a return period of about 3,000 years. The peak ground acceleration, (PGA), of the design earthquake is 0.30 g mean and 0.56 g mean plus one standard deviation (SD). The threshold liquefaction event is a magnitude 5.7 with a return period of about 1,700 years. The Kansas City District has investigated the effects of strong ground motions on the dam and concluded that rehabilitation of the dam is required to prevent an uncontrolled release of the reservoir during or after the design ground motion (U.S. Army Corps of Engineers, Kansas City District, 2002).
Increase in Shear Modulus by Soil Mix and Jet grout Methods Paul J. Axtell, Geotechnical Engineer, Dan Brown and Associates, PLLC, Overland Park, KS; +1 (913) 744-4988; [email protected]
Timothy D. Stark, Professor of Civil and Environmental Engineering, University of Illinois at Urbana-Champaign, Urbana, IL; [email protected]
The results of in-situ geophysical cross-hole tests on improved soil by soil mixing (SM) and jet grouting (JG) are described. This testing was conducted on soil improved by SM and JG columns constructed in the downstream free-field of Tuttle Creek Dam near Manhattan, Kansas as part of the seismic retrofit. Results of similar geophysical testing performed on untreated soil in the vicinity of the Downstream Test Program (DTP) area, as well as beneath the embankment at several locations, are also described and used for comparison purposes. In-situ shear moduli are also compared with those determined in laboratory resonant column tests. The increase in stress wave velocities and associated shear moduli by SM and JG treatment are presented for use in liquefaction potential and seismic deformation analyses of SM or JG treated soil. This data is required to determine the decrease in liquefaction potential and earthquake-induced permanent deformations due to SM or JG with respect to that of untreated soil.
[FIg. 1] Typical Cross-Section of Tuttle Creek Dam
[12] DFI JOURNAL Vol. 2 No. 1 November 2008
As part of the required seismic rehabilitation, a Downstream Test Program (DTP) was constructed in the free-field downstream of the dam to evaluate the application of soil mixing (SM) and jet grouting (JG) for use in the seismic retrofit. Overall, twenty-seven SM and twenty-seven JG columns were constructed and later exhumed to a depth of about 10.7 m (35 ft) to facilitate visual inspection of the completed columns. In July, 2006, prior to exhuming the columns, cross-hole testing was conducted on one SM column, one JG column, and untreated soil near the DTP. In 1982, cross-hole testing also was conducted beneath the crest, downstream mid-slope, and downstream toe of the dam as part of the initial seismic investigation of the dam and prior to any SM or JG.
Laboratory testing was conducted on core samples recovered from the columns before exhumation of the columns and included unit weight, moisture content, unconfined compressive strength, and shear modulus reduction by means of the resonant column testing. Results of the in-situ and laboratory tests are provided herein and quantify the increase in shear modulus caused by SM and JG treatment, as well as the difference between measured in-situ and laboratory properties of the improved soil. Recommended design parameters are also presented.
UNTREATED SOILThe soils in the untreated alluvial foundation of the dam consist of 2.4 to 8.2 m (8 to 27 ft) of silt and clay underlain by sand, silty sand, and gravely sand to a depth of 12.2 to 24.4 m (40 to 80 ft) . The silt and clay form a natural cohesive soil blanket over the more permeable sands. This natural cohesive blanket is an important component of the seepage control system for the dam. The sand deposits vary in thickness from about 7.6 to 18.3 m (25 to 60 ft) and can be separated into two distinct zones. The upper zone consists of a 5 to 6 m (16.5 to 20 ft) thick loose fine to medium sand (SM, SP, and SW) and the lower zone consists of an 8 to 9 m (26 to 29.5 ft) thick dense coarse to gravelly sand (SP, SW, GP, GW).
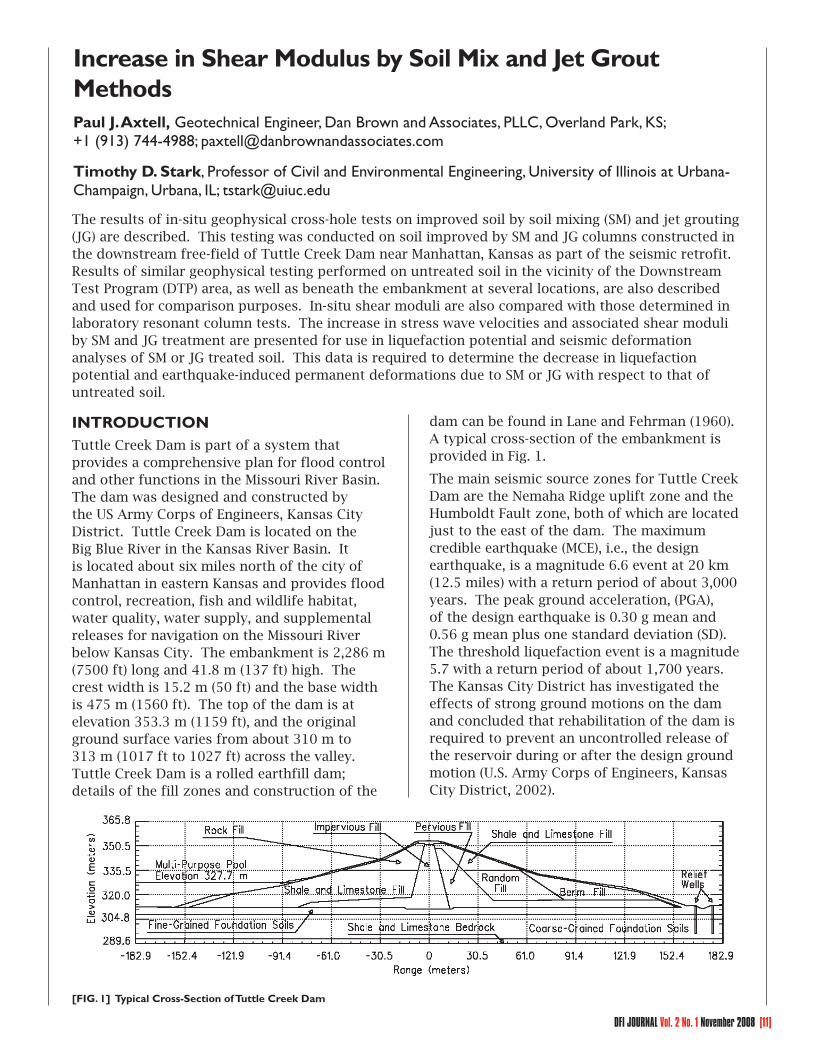
Fig. 2 presents a graphical representation of the soil profile to facilitate understanding the variation of engineering properties with depth. The bedrock consists of alternating layers of shale and limestone (Permian age), with the shale beds varying in thickness between 0.6 and
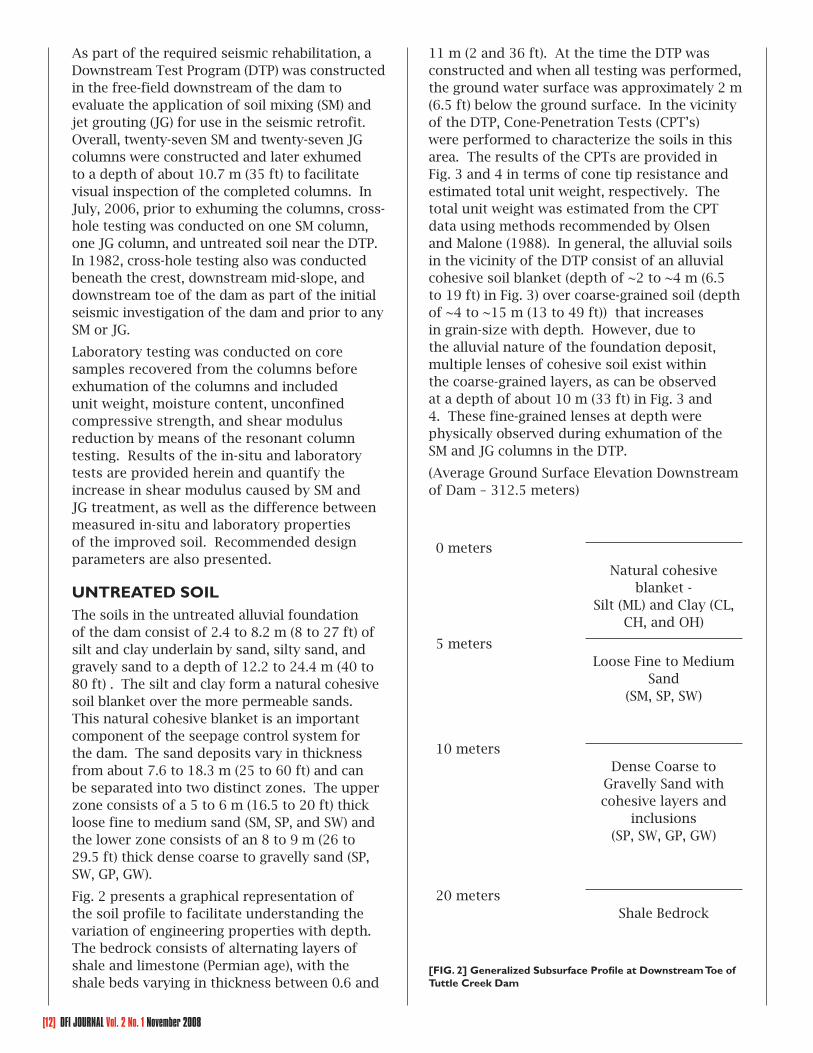
11 m (2 and 36 ft). At the time the DTP was constructed and when all testing was performed, the ground water surface was approximately 2 m (6.5 ft) below the ground surface. In the vicinity of the DTP, Cone-Penetration Tests (CPT’s) were performed to characterize the soils in this area. The results of the CPTs are provided in Fig. 3 and 4 in terms of cone tip resistance and estimated total unit weight, respectively. The total unit weight was estimated from the CPT data using methods recommended by Olsen and Malone (1988). In general, the alluvial soils in the vicinity of the DTP consist of an alluvial cohesive soil blanket (depth of ~2 to ~4 m (6.5 to 19 ft) in Fig. 3) over coarse-grained soil (depth of ~4 to ~15 m (13 to 49 ft)) that increases in grain-size with depth. However, due to the alluvial nature of the foundation deposit, multiple lenses of cohesive soil exist within the coarse-grained layers, as can be observed at a depth of about 10 m (33 ft) in Fig. 3 and 4. These fine-grained lenses at depth were physically observed during exhumation of the SM and JG columns in the DTP.
(Average Ground Surface Elevation Downstream of Dam – 312.5 meters)
0 meters
Natural cohesive blanket -
Silt (ML) and Clay (CL, CH, and OH)
5 meters Loose Fine to Medium
Sand (SM, SP, SW)
10 meters Dense Coarse to
Gravelly Sand with cohesive layers and
inclusions (SP, SW, GP, GW)
20 meters Shale Bedrock
[FIg. 2] generalized Subsurface Profile at Downstream Toe of Tuttle Creek Dam
DFI JOURNAL Vol. 2 No. 1 November 2008 [1�]
In-situ cross-hole testing was performed in 1982 as part of an initial seismic investigation at Station 60+00 prior to any SM or JG. The tests conducted in 1982 were performed at three locations; beneath the crest, the downstream mid-slope, and the downstream toe. As part of the DTP conducted in 2006, in-situ cross-hole tests were performed on untreated soil in the downstream free-field (approximately 150 m (500 ft) from the toe of the dam) at Station 59+00, which is 30 m (98.4 ft) west of Station 60+00. The results of both compression wave and shear wave cross-hole testing are provided in Fig. 5 and 6, respectively, for testing performed in 1982 and 2006. Both sets of tests were conducted near the same station of the dam, i.e., 59+00 to 60+00, but the 2006 testing was conducted about 150 m (500 ft) downstream of the dam toe and thus is not influenced by the stresses imposed by the embankment or the seepage under the dam.
Fig. 5 shows the compression wave velocities from the cross-hole test results in 1982 and 2006 seem to generally agree. Thus, compression wave velocities are not significantly influenced by the stresses imposed by the
embankment or active seepage under the dam. This is attributed to the compression wave velocity being controlled by the compressive wave velocity of water (1500 to 1800 m/s or 5000 to 6000 ft/s) because the ground water is located at a depth of about 2 meters (6.5 ft) at the downstream toe and the DTP. However, at greater depths, and possibly in bedrock, the compression wave velocity of the soil and/or rock seem to exceed that of water.
As expected, the shear wave velocity increases with increasing confining pressure and is independent of the state of saturation because water cannot support shear. The crest and mid-slope locations exhibit higher shear wave velocity profiles than the downstream toe and DTP because of the higher stresses imposed by the embankment. The downstream toe shear wave velocities are also higher than DTP velocities, e.g., 180 to 260 m/s (590 to 850 ft/s) versus 110-160 m/s (360-525 ft/s). The difference between the shear wave velocity measured at the downstream toe and the DTP, i.e., downstream free-field, is likely a result of the following: 1) higher confining pressures at the downstream toe as a result of stress
[FIg. 3] CPT Tip Resistance Versus Depth in the Vicinity of the Test Program.
[FIg. 4] CPT Estimated Unit Weight Versus Depth in the Vicinity of the Test Program.
[FIg. 5] Compression Wave Velocity Measured at Four Untreated Downstream Locations.
[FIg. 6] Shear Wave Velocity Measured at Four Untreated Downstream Locations.
[1�] DFI JOURNAL Vol. 2 No. 1 November 2008
distribution resulting from the presence of the adjacent embankment; 2) higher seepage gradients and forces due to the active see page condition through the foundation soils below the dam; and/or 3) an increased state of static shear stress at the downstream toe resulting from the embankment slope, which is incorporated into liquefaction potential evaluations using the K term (Youd, et. al., 2001).
In summary shear wave velocity of the untreated alluvial foundation soils in the vicinity of the DTP varies with soil type. The shear wave velocity of the natural cohesive soil blanket ranges from 140 to 160 m/s (460 to 525 ft/s). The upper loose fine to medium sand (SM, SP, and SW) exhibits a shear wave velocity of 110 to 120 m/s (360 to 395 ft/s) and is predicted to liquefy during the design earthquake. The underlying dense coarse to gravelly sand (SP, SW, GP, GW) exhibits a shear wave velocity of 130 to 160 m/s (425 to 525 ft/s) and is not predicted to undergo substantial liquefaction during the design earthquake. These reported velocity values for each soil layer agree with visual observations made while the excavation was open, exposing not only the constructed columns, but also the in-situ soils. Thus, the shear wave velocities support the liquefaction assessment of the foundation sands and the liquefaction potential relationship based on shear wave velocity in
Youd et al. (2001).
IMPROVED SOILBoth SM and JG soil improvement techniques were demonstrated in the DTP. Although several different grout mixes were trialed during the DTP, geophysical testing was conducted only on soil mix column No. 23 (SM23) and jet grout column No. 26 (JG26). Both of these columns were constructed with a grout having a cement-to-water ratio of 1.0. No bentonite or other additives were included in the grout mix for these columns. Upon completion of construction, coring and dewatering of the DTP area was complete. The dewatering allowed all DTP columns to be exposed to a depth of 10.7 m (35 ft) to allow visual inspection and testing of the columns.
SM23 Construction
Column SM23 was constructed on 10 May 2006 using jet-assisted soil mixing, called Turbo-Jet by the Contractor. The Turbo-Jet
method introduces pressurized grout to the soil through four 2.5 mm (0.1 in) diameter grout nozzles. A SoilMec CM120 drill rig was used to hold the Turbo-Jet equipment which constructed the nearly uniform 1.83 m (6 ft) diameter column. During advancement of the mixing tool, grout was introduced under a pressure of 250 bars (3625 psi) and a flow rate of 203 l/min (54 gpm). During tool withdraw, grout was injected under a pressure of 50 bars (725 psi) at a rate of 55 l/min (14.5 gpm). The advancement rate is 0.37 m/min (1.2 ft/min) and the withdraw rate is 2.5 m/min (8.2 ft/min). During advance and withdraw, the mixing tool was rotating from 25 to 35 revolutions per minute.
JG26 Construction
Column JG26 was constructed using the double-fluid (air and grout) jet grout method in which pressurized air and grout are injected to the soil on 6 June 2006. A SoilMec SM525 drill rig using 127 mm (5 inch) diameter rods and a 20.3 cm (8 inch) diameter roller bit was used to construct the column. Air was introduced through a 21 mm (7/8 inch) diameter nozzle under a pressure of 10 bars (145 psi) at a flow rate of 7382 l/min (1950 gpm). The grout was introduced through a single 6.5 mm (1/4 inch) diameter nozzle under a pressure of 440 bars (6380 psi) at a flow rate of 476 l/min (125 gpm). The step interval of the nozzles was 4 cm (1.6 in) and the station time at each interval was 21 seconds. The grouting tool was rotated at 4 revolutions per minute. The planned diameter of the column was 2.44 m (8 ft), however, the actual column diameter varied randomly from 2.23 to 2.90 m (7.3 to 9.5 ft).
Core Hole Results
Columns SM26 and JG26 were cored at least 28 days after installation. Coring was performed near the center of each column. Coring was performed with a CME25 rig using the GeoBore system. The GeoBore is a rotary water flush double-barrel wire-line coring device that for this project produced 10 cm (4 in) diameter core. Over the column depth of SM23, the average core recovery was 95 percent with an average Rock Quality Designation (RQD) of 82 percent. Over the column depth of JG26, the average core recovery was 96 percent with an average RQD of 91 percent. The core recovery and RQD for each 1.52 m (5 ft) core run are
DFI JOURNAL Vol. 2 No. 1 November 2008 [1�]
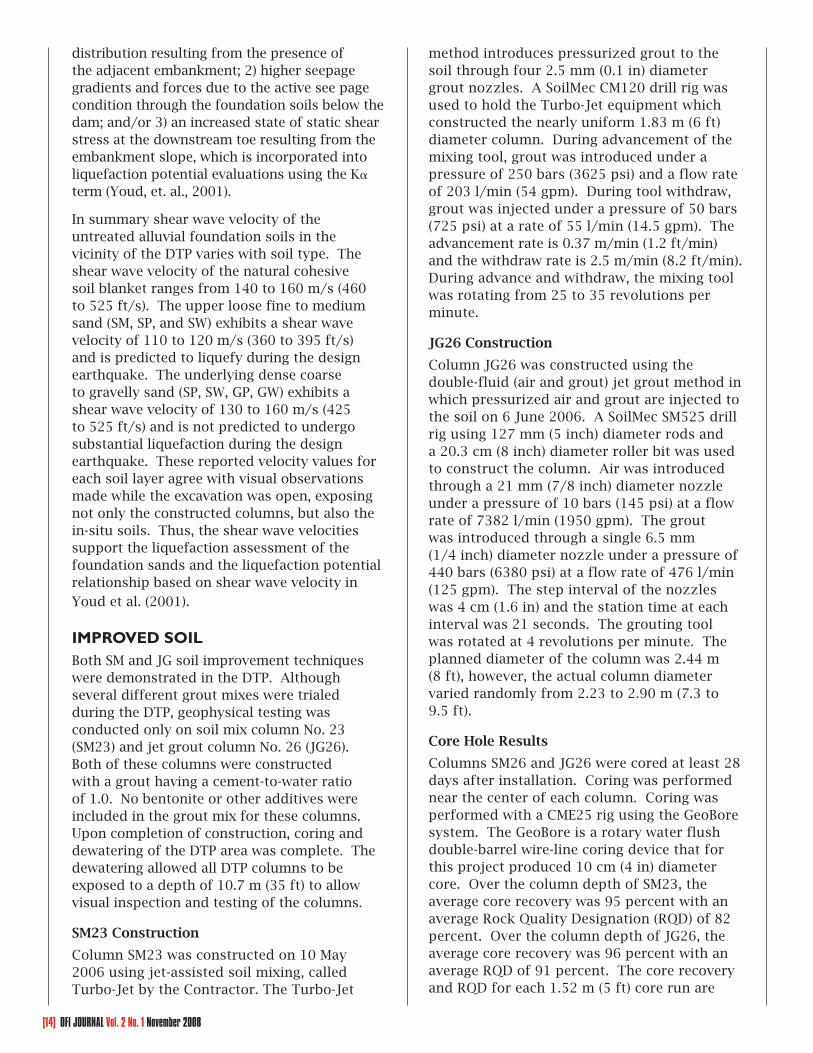
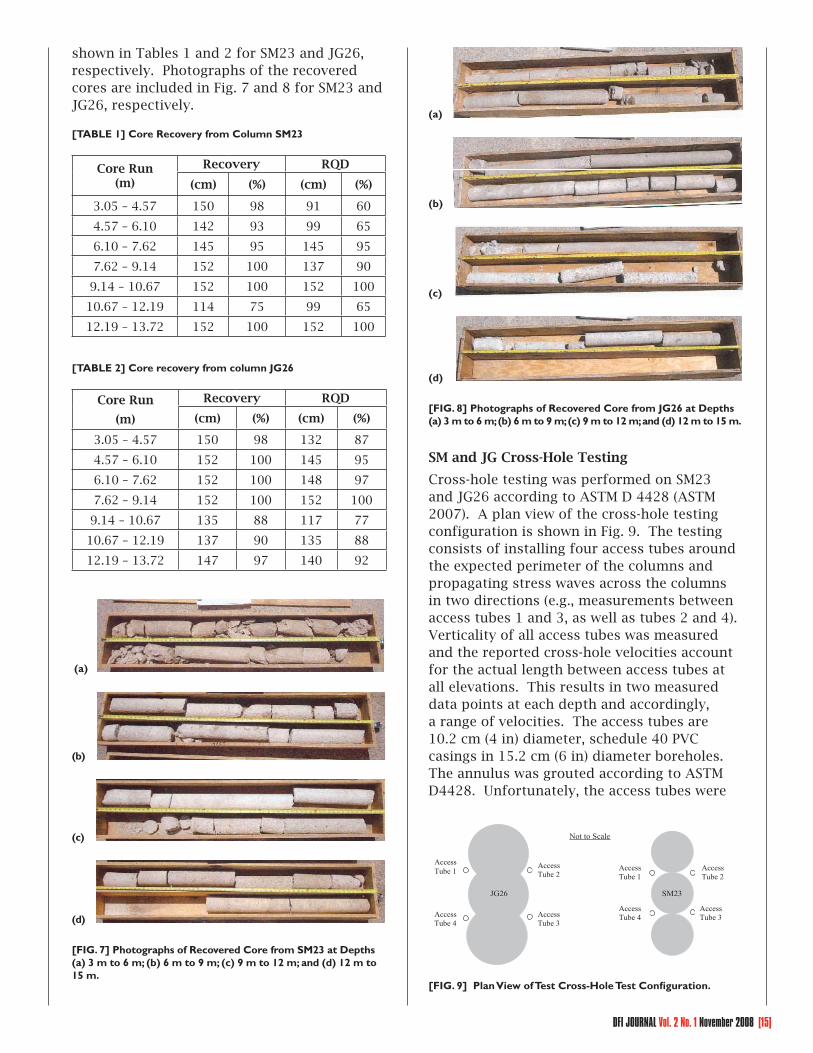
shown in Tables 1 and 2 for SM23 and JG26, respectively. Photographs of the recovered cores are included in Fig. 7 and 8 for SM23 and JG26, respectively.
[TABLE 1] Core Recovery from Column SM23
Core Run (m)
Recovery RQD
(cm) (%) (cm) (%)
3.05 – 4.57 150 98 91 60
4.57 – 6.10 142 93 99 65
6.10 – 7.62 145 95 145 95
7.62 – 9.14 152 100 137 90
9.14 – 10.67 152 100 152 100
10.67 – 12.19 114 75 99 65
12.19 – 13.72 152 100 152 100
[TABLE 2] Core recovery from column Jg26
Core Run
(m)
Recovery RQD
(cm) (%) (cm) (%)
3.05 – 4.57 150 98 132 87
4.57 – 6.10 152 100 145 95
6.10 – 7.62 152 100 148 97
7.62 – 9.14 152 100 152 100
9.14 – 10.67 135 88 117 77
10.67 – 12.19 137 90 135 88
12.19 – 13.72 147 97 140 92
(a)
(b)
(c)
(d)
[FIg. 7] Photographs of Recovered Core from SM23 at Depths (a) 3 m to 6 m; (b) 6 m to 9 m; (c) 9 m to 12 m; and (d) 12 m to 15 m.
(a)
(b)
(c)
(d)
[FIg. 8] Photographs of Recovered Core from Jg26 at Depths (a) 3 m to 6 m; (b) 6 m to 9 m; (c) 9 m to 12 m; and (d) 12 m to 15 m.
SM and JG Cross-Hole Testing
Cross-hole testing was performed on SM23 and JG26 according to ASTM D 4428 (ASTM 2007). A plan view of the cross-hole testing configuration is shown in Fig. 9. The testing consists of installing four access tubes around the expected perimeter of the columns and propagating stress waves across the columns in two directions (e.g., measurements between access tubes 1 and 3, as well as tubes 2 and 4). Verticality of all access tubes was measured and the reported cross-hole velocities account for the actual length between access tubes at all elevations. This results in two measured data points at each depth and accordingly, a range of velocities. The access tubes are 10.2 cm (4 in) diameter, schedule 40 PVC casings in 15.2 cm (6 in) diameter boreholes. The annulus was grouted according to ASTM D4428. Unfortunately, the access tubes were
Not to Scale
JG26 SM23
Access Tube 1
Access Tube 1 Access
Tube 2 AccessTube 2
Access Tube 3
Access Tube 3
Access Tube 4
AccessTube 4Access
Tube 3 AccessTube 3
Access Tube 4
AccessTube 4AccessTube 3
Access Tube 4
Access Tube 2
Access Tube 1 Access
Tube 1 AccessTube 2
AccessTube 3Access
Tube 3
Access Tube 4 Access
Tube 4
[FIg. 9] Plan View of Test Cross-Hole Test Configuration.
[1�] DFI JOURNAL Vol. 2 No. 1 November 2008
not installed inside the perimeter of the columns, so the measured stress wave velocity of the treated soil is likely conservative because the waves propagated through some amount of untreated soil before and after passing through the treated soil. No correction for the existence of the untreated soil was made to the stress wave travel times measured between access tubes because of the short distance between the tube and the columns as shown in Fig. 9. In addition, the column diameters varied with depth, especially JG26, making any correction for untreated soil between the access tubes difficult, if not impossible.
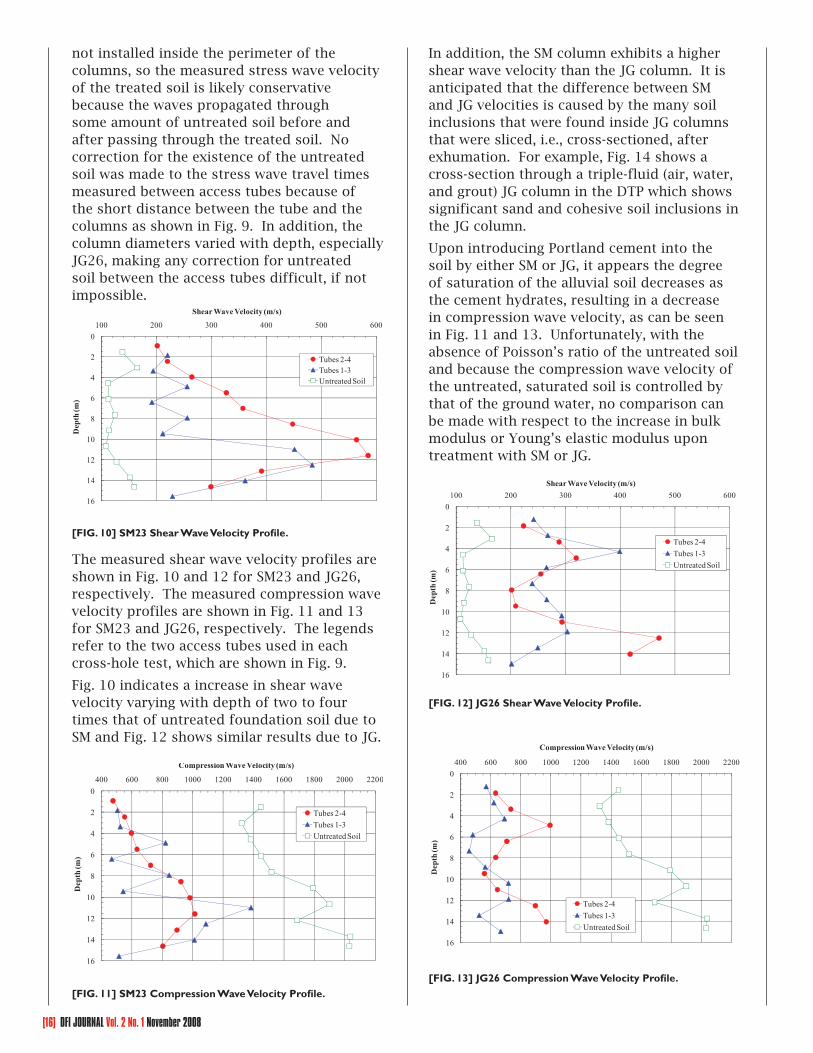
The measured shear wave velocity profiles are shown in Fig. 10 and 12 for SM23 and JG26, respectively. The measured compression wave velocity profiles are shown in Fig. 11 and 13 for SM23 and JG26, respectively. The legends refer to the two access tubes used in each cross-hole test, which are shown in Fig. 9.
Fig. 10 indicates a increase in shear wave velocity varying with depth of two to four times that of untreated foundation soil due to SM and Fig. 12 shows similar results due to JG.
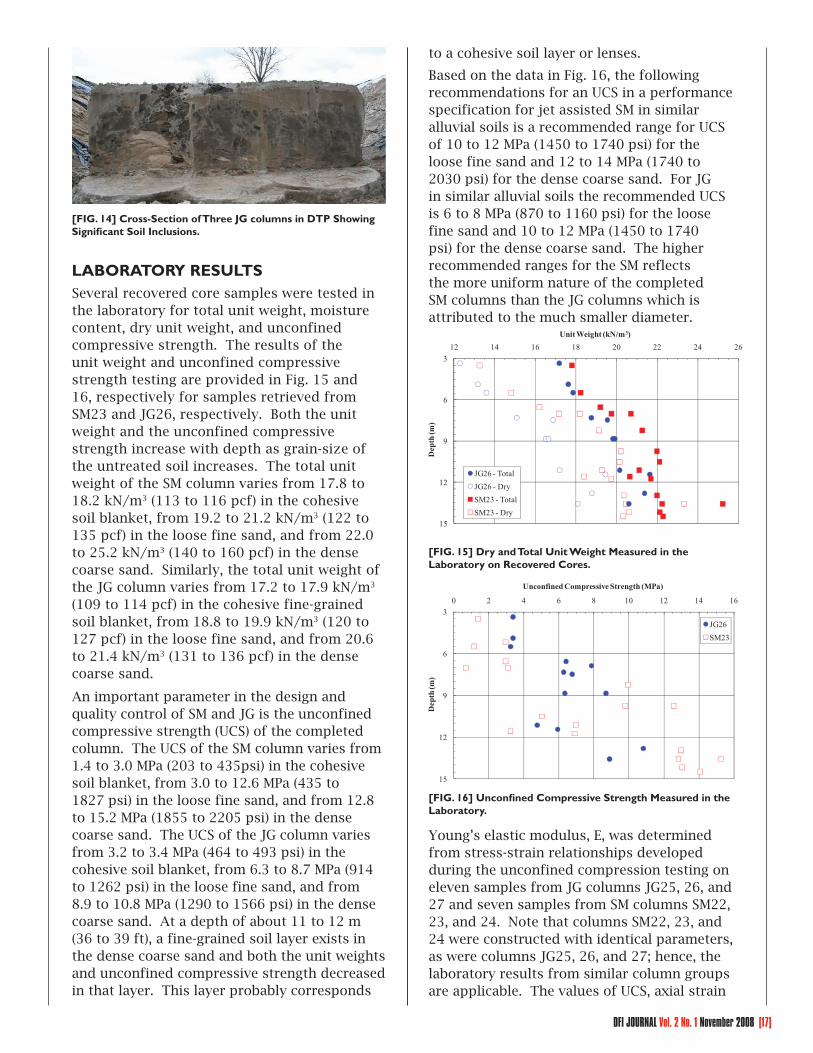
In addition, the SM column exhibits a higher shear wave velocity than the JG column. It is anticipated that the difference between SM and JG velocities is caused by the many soil inclusions that were found inside JG columns that were sliced, i.e., cross-sectioned, after exhumation. For example, Fig. 14 shows a cross-section through a triple-fluid (air, water, and grout) JG column in the DTP which shows significant sand and cohesive soil inclusions in the JG column.
Upon introducing Portland cement into the soil by either SM or JG, it appears the degree of saturation of the alluvial soil decreases as the cement hydrates, resulting in a decrease in compression wave velocity, as can be seen in Fig. 11 and 13. Unfortunately, with the absence of Poisson’s ratio of the untreated soil and because the compression wave velocity of the untreated, saturated soil is controlled by that of the ground water, no comparison can be made with respect to the increase in bulk modulus or Young’s elastic modulus upon treatment with SM or JG.
[FIg. 12] Jg26 Shear Wave Velocity Profile.
[FIg. 13] Jg26 Compression Wave Velocity Profile.
[FIg. 10] SM23 Shear Wave Velocity Profile.
[FIg. 11] SM23 Compression Wave Velocity Profile.
DFI JOURNAL Vol. 2 No. 1 November 2008 [17]
[Fig. 14] Cross-Section of Three Jg columns in DTP Showing Significant Soil inclusions.
LaboraTory reSuLTSSeveral recovered core samples were tested in the laboratory for total unit weight, moisture content, dry unit weight, and unconfined compressive strength. The results of the unit weight and unconfined compressive strength testing are provided in Fig. 15 and 16, respectively for samples retrieved from SM23 and JG26, respectively. Both the unit weight and the unconfined compressive strength increase with depth as grain-size of the untreated soil increases. The total unit weight of the SM column varies from 17.8 to 18.2 kN/m3 (113 to 116 pcf) in the cohesive soil blanket, from 19.2 to 21.2 kN/m3 (122 to 135 pcf) in the loose fine sand, and from 22.0 to 25.2 kN/m3 (140 to 160 pcf) in the dense coarse sand. Similarly, the total unit weight of the JG column varies from 17.2 to 17.9 kN/m3 (109 to 114 pcf) in the cohesive fine-grained soil blanket, from 18.8 to 19.9 kN/m3 (120 to 127 pcf) in the loose fine sand, and from 20.6 to 21.4 kN/m3 (131 to 136 pcf) in the dense coarse sand.
An important parameter in the design and quality control of SM and JG is the unconfined compressive strength (UCS) of the completed column. The UCS of the SM column varies from 1.4 to 3.0 MPa (203 to 435psi) in the cohesive soil blanket, from 3.0 to 12.6 MPa (435 to 1827 psi) in the loose fine sand, and from 12.8 to 15.2 MPa (1855 to 2205 psi) in the dense coarse sand. The UCS of the JG column varies from 3.2 to 3.4 MPa (464 to 493 psi) in the cohesive soil blanket, from 6.3 to 8.7 MPa (914 to 1262 psi) in the loose fine sand, and from 8.9 to 10.8 MPa (1290 to 1566 psi) in the dense coarse sand. At a depth of about 11 to 12 m (36 to 39 ft), a fine-grained soil layer exists in the dense coarse sand and both the unit weights and unconfined compressive strength decreased in that layer. This layer probably corresponds
to a cohesive soil layer or lenses.
Based on the data in Fig. 16, the following recommendations for an UCS in a performance specification for jet assisted SM in similar alluvial soils is a recommended range for UCS of 10 to 12 MPa (1450 to 1740 psi) for the loose fine sand and 12 to 14 MPa (1740 to 2030 psi) for the dense coarse sand. For JG in similar alluvial soils the recommended UCS is 6 to 8 MPa (870 to 1160 psi) for the loose fine sand and 10 to 12 MPa (1450 to 1740 psi) for the dense coarse sand. The higher recommended ranges for the SM reflects the more uniform nature of the completed SM columns than the JG columns which is attributed to the much smaller diameter.
[Fig. 15] Dry and Total unit Weight Measured in the Laboratory on recovered Cores.
Young’s elastic modulus, E, was determined from stress-strain relationships developed during the unconfined compression testing on eleven samples from JG columns JG25, 26, and 27 and seven samples from SM columns SM22, 23, and 24. Note that columns SM22, 23, and 24 were constructed with identical parameters, as were columns JG25, 26, and 27; hence, the laboratory results from similar column groups are applicable. The values of UCS, axial strain
[Fig. 16] unconfined Compressive Strength Measured in the Laboratory.
[18] DFI JOURNAL Vol. 2 No. 1 November 2008
to the UCS, and E are provided in Tables 3 and 4 for SM and JG, respectively. The Young’s modulus values presented in Tables 3 and 4 are considered the “large-strain” modulus values and were calculated by dividing the peak UCS by the associated axial strain at that stress level. Although appreciable, scatter exists, perhaps more so with the SM data, for design purposes it appears E can be estimated from UCS. For JG columns utilizing similar installation parameters as those described previously, E can be estimated as 158*UCS, with an accuracy of plus or minus 21 percent. Similarly, for SM columns utilizing similar installation parameters, E can be estimated as 194*UCS, with an accuracy of plus or minus 47 percent. Additional refinement to the relationships between UCS and E are likely possible if the soil type being treated is considered. The particular index property that appears to control UCS and E is the soil grain size, with larger measured UCS and estimated E being observed with increasing soil grain size.
The ratio of E/UCS has a median value of 152 (see Table 4) for the JG columns. Van der Stoel (2001) presents UCS and E data on jet grouted sand and clay layers from a variety of projects primarily in Europe. These data also suggest that the UCS is a function of the cement content and soil type. This is evident because the ratio of E/UCS is higher for sands (~300) than clays (~200) especially at low values of UCS. It is anticipated that a Tuttle Creek mean ratio of E/UCS of 158 being much lower than the mean ratio (~300) derived from Van der Stoel (2001) is due to the large amount of soil inclusions in the JG columns as shown in Fig. 14.
Laboratory resonant column tests were performed on three core samples retrieved from three separate columns at different depths. Sample locations and some pertinent results are shown in Table 5. The maximum value of E, considered a “small-strain” value of E, is approximately twice that of the “large-strain” E discussed previously for JG columns. Similarly, the maximum E, considered “small-strain”, is approximately 50 percent greater than the “large-strain” E discussed previously for SM columns.
[TABLE 5] Resonant Column Test Results on Cored Samples
Depth Gmax Emax Effective Confining(m) (MPa) (MPa) Stress (MPa)
SM23 8.2 769 1875 0.09 0.22JG25 4.4 706 1722 0.06 0.22
JG26/27 9.3 1060 2586 0.10 0.22
ColumnPoisson's
Ratio
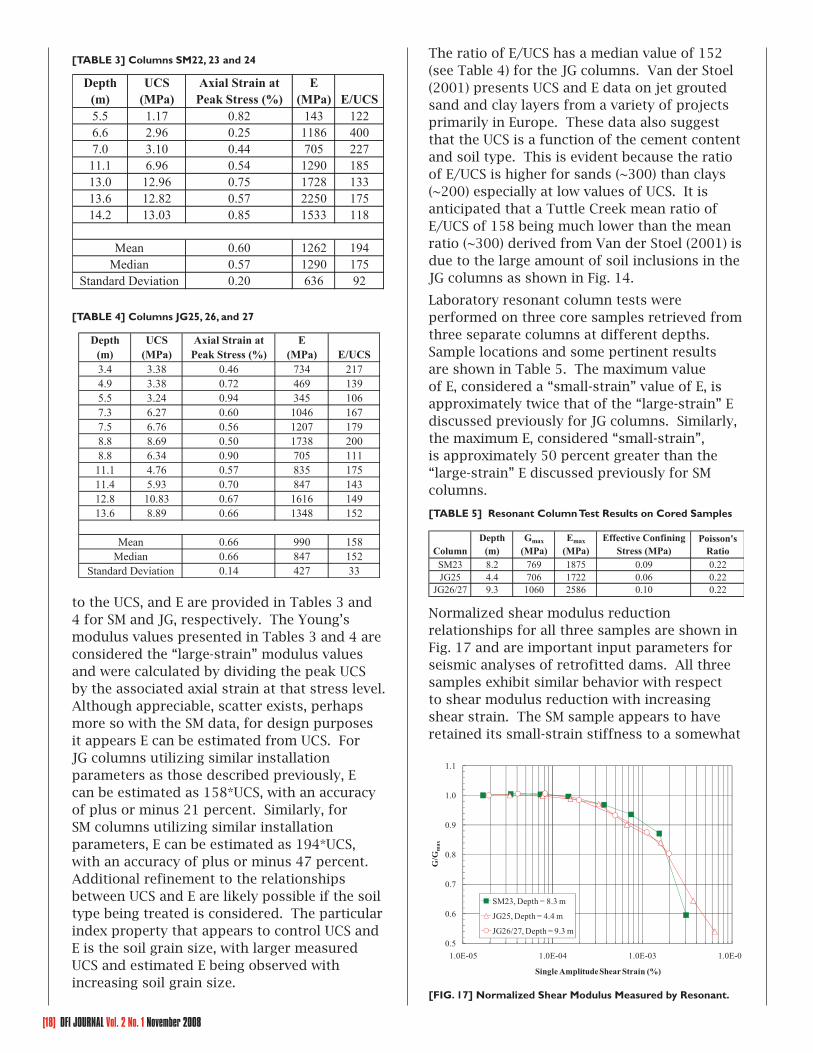
Normalized shear modulus reduction relationships for all three samples are shown in Fig. 17 and are important input parameters for seismic analyses of retrofitted dams. All three samples exhibit similar behavior with respect to shear modulus reduction with increasing shear strain. The SM sample appears to have retained its small-strain stiffness to a somewhat
Depth UCS Axial Strain at E Depth UCS Axial Strain at E(m) (MPa) Peak Stress (%) (MPa) (m) (MPa) Peak Stress (%) (MPa)5.5 1.17 0.82 143 122 3.4 3.38 0.46 734 2176.6 2.96 0.25 1186 400 4.9 3.38 0.72 469 1397.0 3.10 0.44 705 227 5.5 3.24 0.94 345 10611.1 6.96 0.54 1290 185 7.3 6.27 0.60 1046 16713.0 12.96 0.75 1728 133 7.5 6.76 0.56 1207 17913.6 12.82 0.57 2250 175 8.8 8.69 0.50 1738 20014.2 13.03 0.85 1533 118 8.8 6.34 0.90 705 111
11.1 4.76 0.57 835 1750.60 1262 194 11.4 5.93 0.70 847 1430.57 1290 175 12.8 10.83 0.67 1616 1490.20 636 92 13.6 8.89 0.66 1348 152
0.66 990 1580.66 847 1520.14 427 33
MeanMedian
Standard Deviation
MeanMedian
E/UCS E/UCS
Standard Deviation
[TABLE 3] Columns SM22, 23 and 24
Depth UCS Axial Strain at E Depth UCS Axial Strain at E(m) (MPa) Peak Stress (%) (MPa) (m) (MPa) Peak Stress (%) (MPa)5.5 1.17 0.82 143 122 3.4 3.38 0.46 734 2176.6 2.96 0.25 1186 400 4.9 3.38 0.72 469 1397.0 3.10 0.44 705 227 5.5 3.24 0.94 345 10611.1 6.96 0.54 1290 185 7.3 6.27 0.60 1046 16713.0 12.96 0.75 1728 133 7.5 6.76 0.56 1207 17913.6 12.82 0.57 2250 175 8.8 8.69 0.50 1738 20014.2 13.03 0.85 1533 118 8.8 6.34 0.90 705 111
11.1 4.76 0.57 835 1750.60 1262 194 11.4 5.93 0.70 847 1430.57 1290 175 12.8 10.83 0.67 1616 1490.20 636 92 13.6 8.89 0.66 1348 152
0.66 990 1580.66 847 1520.14 427 33
MeanMedian
Standard Deviation
MeanMedian
E/UCS E/UCS
Standard Deviation
[TABLE 4] Columns Jg25, 26, and 27
[FIg. 17] Normalized Shear Modulus Measured by Resonant.
DFI JOURNAL Vol. 2 No. 1 November 2008 [1�]
greater shear strain than the JG samples, but it also appears to have degraded quicker upon achieving a threshold shear strain. The initial higher value of shear modulus for the SM material is again attributed to the large amount of soil inclusion in the cross-sectioned JG shown in Fig. 14.
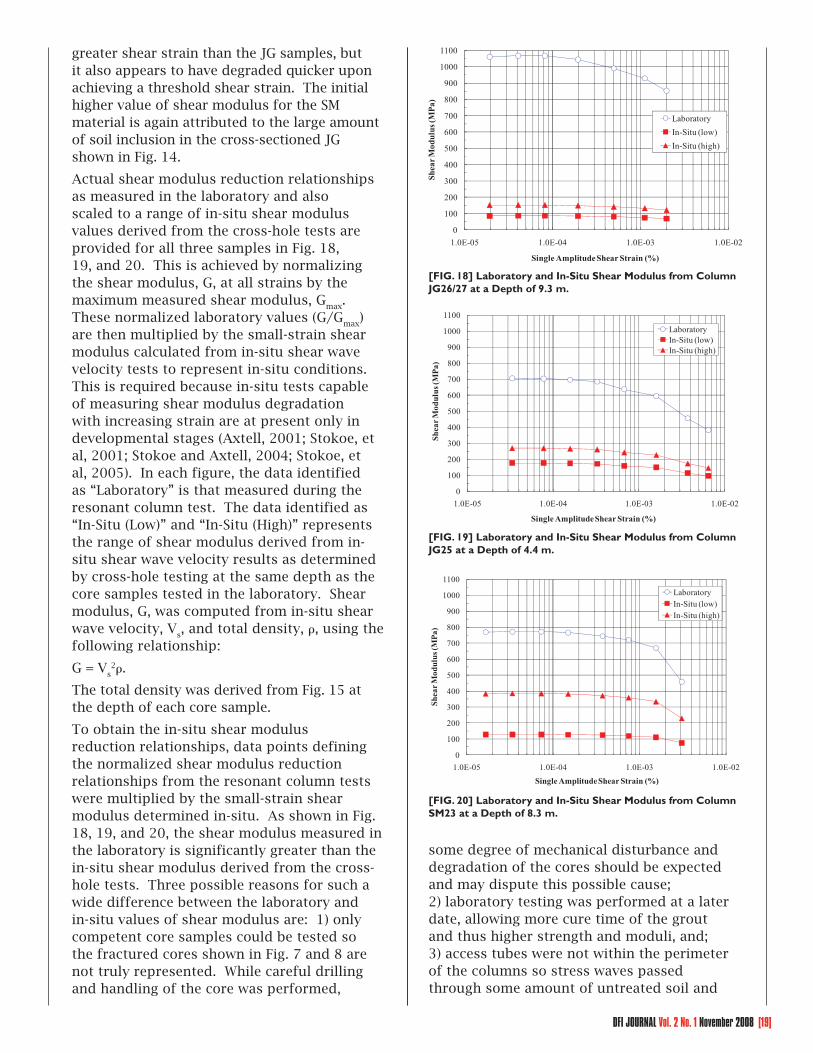
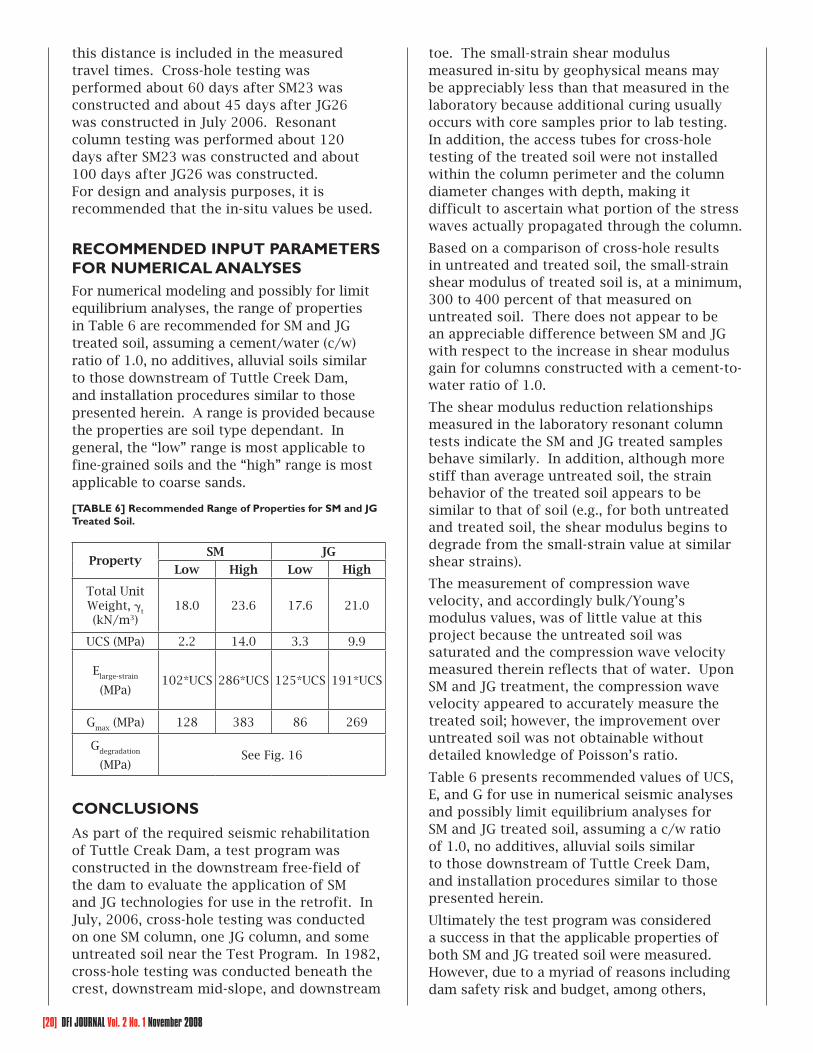
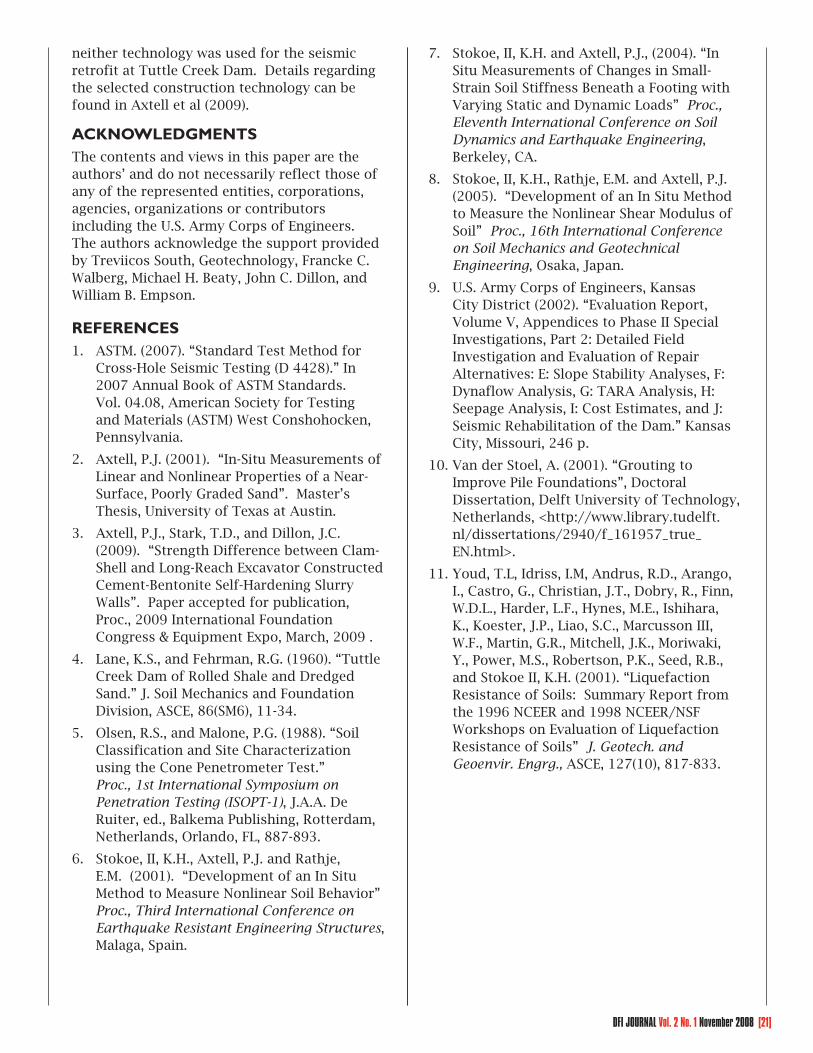
Actual shear modulus reduction relationships as measured in the laboratory and also scaled to a range of in-situ shear modulus values derived from the cross-hole tests are provided for all three samples in Fig. 18, 19, and 20. This is achieved by normalizing the shear modulus, G, at all strains by the maximum measured shear modulus, G
max.
These normalized laboratory values (G/Gmax
) are then multiplied by the small-strain shear modulus calculated from in-situ shear wave velocity tests to represent in-situ conditions. This is required because in-situ tests capable of measuring shear modulus degradation with increasing strain are at present only in developmental stages (Axtell, 2001; Stokoe, et al, 2001; Stokoe and Axtell, 2004; Stokoe, et al, 2005). In each figure, the data identified as “Laboratory” is that measured during the resonant column test. The data identified as “In-Situ (Low)” and “In-Situ (High)” represents the range of shear modulus derived from in-situ shear wave velocity results as determined by cross-hole testing at the same depth as the core samples tested in the laboratory. Shear modulus, G, was computed from in-situ shear wave velocity, V
s, and total density, , using the
following relationship:
G = Vs2.
The total density was derived from Fig. 15 at the depth of each core sample.
To obtain the in-situ shear modulus reduction relationships, data points defining the normalized shear modulus reduction relationships from the resonant column tests were multiplied by the small-strain shear modulus determined in-situ. As shown in Fig. 18, 19, and 20, the shear modulus measured in the laboratory is significantly greater than the in-situ shear modulus derived from the cross-hole tests. Three possible reasons for such a wide difference between the laboratory and in-situ values of shear modulus are: 1) only competent core samples could be tested so the fractured cores shown in Fig. 7 and 8 are not truly represented. While careful drilling and handling of the core was performed,
some degree of mechanical disturbance and degradation of the cores should be expected and may dispute this possible cause; 2) laboratory testing was performed at a later date, allowing more cure time of the grout and thus higher strength and moduli, and; 3) access tubes were not within the perimeter of the columns so stress waves passed through some amount of untreated soil and
[FIg. 18] Laboratory and In-Situ Shear Modulus from Column Jg26/27 at a Depth of 9.3 m.
[FIg. 19] Laboratory and In-Situ Shear Modulus from Column Jg25 at a Depth of 4.4 m.
[FIg. 20] Laboratory and In-Situ Shear Modulus from Column SM23 at a Depth of 8.3 m.
[20] DFI JOURNAL Vol. 2 No. 1 November 2008
this distance is included in the measured travel times. Cross-hole testing was performed about 60 days after SM23 was constructed and about 45 days after JG26 was constructed in July 2006. Resonant column testing was performed about 120 days after SM23 was constructed and about 100 days after JG26 was constructed. For design and analysis purposes, it is recommended that the in-situ values be used.
RECOMMENDED INPUT PARAMETERS FOR NUMERICAL ANALYSESFor numerical modeling and possibly for limit equilibrium analyses, the range of properties in Table 6 are recommended for SM and JG treated soil, assuming a cement/water (c/w) ratio of 1.0, no additives, alluvial soils similar to those downstream of Tuttle Creek Dam, and installation procedures similar to those presented herein. A range is provided because the properties are soil type dependant. In general, the “low” range is most applicable to fine-grained soils and the “high” range is most applicable to coarse sands.
[TABLE 6] Recommended Range of Properties for SM and Jg Treated Soil.
PropertySM JG
Low High Low High
Total Unit Weight,
t
(kN/m3)18.0 23.6 17.6 21.0
UCS (MPa) 2.2 14.0 3.3 9.9
Elarge-strain
(MPa)102*UCS 286*UCS 125*UCS 191*UCS
Gmax
(MPa) 128 383 86 269
Gdegradation
(MPa)See Fig. 16
CONCLUSIONS
As part of the required seismic rehabilitation of Tuttle Creak Dam, a test program was constructed in the downstream free-field of the dam to evaluate the application of SM and JG technologies for use in the retrofit. In July, 2006, cross-hole testing was conducted on one SM column, one JG column, and some untreated soil near the Test Program. In 1982, cross-hole testing was conducted beneath the crest, downstream mid-slope, and downstream
toe. The small-strain shear modulus measured in-situ by geophysical means may be appreciably less than that measured in the laboratory because additional curing usually occurs with core samples prior to lab testing. In addition, the access tubes for cross-hole testing of the treated soil were not installed within the column perimeter and the column diameter changes with depth, making it difficult to ascertain what portion of the stress waves actually propagated through the column.
Based on a comparison of cross-hole results in untreated and treated soil, the small-strain shear modulus of treated soil is, at a minimum, 300 to 400 percent of that measured on untreated soil. There does not appear to be an appreciable difference between SM and JG with respect to the increase in shear modulus gain for columns constructed with a cement-to-water ratio of 1.0.
The shear modulus reduction relationships measured in the laboratory resonant column tests indicate the SM and JG treated samples behave similarly. In addition, although more stiff than average untreated soil, the strain behavior of the treated soil appears to be similar to that of soil (e.g., for both untreated and treated soil, the shear modulus begins to degrade from the small-strain value at similar shear strains).
The measurement of compression wave velocity, and accordingly bulk/Young’s modulus values, was of little value at this project because the untreated soil was saturated and the compression wave velocity measured therein reflects that of water. Upon SM and JG treatment, the compression wave velocity appeared to accurately measure the treated soil; however, the improvement over untreated soil was not obtainable without detailed knowledge of Poisson’s ratio.
Table 6 presents recommended values of UCS, E, and G for use in numerical seismic analyses and possibly limit equilibrium analyses for SM and JG treated soil, assuming a c/w ratio of 1.0, no additives, alluvial soils similar to those downstream of Tuttle Creek Dam, and installation procedures similar to those presented herein.
Ultimately the test program was considered a success in that the applicable properties of both SM and JG treated soil were measured. However, due to a myriad of reasons including dam safety risk and budget, among others,
DFI JOURNAL Vol. 2 No. 1 November 2008 [21]
neither technology was used for the seismic retrofit at Tuttle Creek Dam. Details regarding the selected construction technology can be found in Axtell et al (2009).
ACKNOWLEDgMENTSThe contents and views in this paper are the authors’ and do not necessarily reflect those of any of the represented entities, corporations, agencies, organizations or contributors including the U.S. Army Corps of Engineers. The authors acknowledge the support provided by Treviicos South, Geotechnology, Francke C. Walberg, Michael H. Beaty, John C. Dillon, and William B. Empson.
REFERENCES1. ASTM. (2007). “Standard Test Method for
Cross-Hole Seismic Testing (D 4428).” In 2007 Annual Book of ASTM Standards. Vol. 04.08, American Society for Testing and Materials (ASTM) West Conshohocken, Pennsylvania.
2. Axtell, P.J. (2001). “In-Situ Measurements of Linear and Nonlinear Properties of a Near-Surface, Poorly Graded Sand”. Master’s Thesis, University of Texas at Austin.
3. Axtell, P.J., Stark, T.D., and Dillon, J.C. (2009). “Strength Difference between Clam-Shell and Long-Reach Excavator Constructed Cement-Bentonite Self-Hardening Slurry Walls”. Paper accepted for publication, Proc., 2009 International Foundation Congress & Equipment Expo, March, 2009 .
4. Lane, K.S., and Fehrman, R.G. (1960). “Tuttle Creek Dam of Rolled Shale and Dredged Sand.” J. Soil Mechanics and Foundation Division, ASCE, 86(SM6), 11-34.
5. Olsen, R.S., and Malone, P.G. (1988). “Soil Classification and Site Characterization using the Cone Penetrometer Test.” Proc., 1st International Symposium on Penetration Testing (ISOPT-1), J.A.A. De Ruiter, ed., Balkema Publishing, Rotterdam, Netherlands, Orlando, FL, 887-893.
6. Stokoe, II, K.H., Axtell, P.J. and Rathje, E.M. (2001). “Development of an In Situ Method to Measure Nonlinear Soil Behavior” Proc., Third International Conference on Earthquake Resistant Engineering Structures, Malaga, Spain.
7. Stokoe, II, K.H. and Axtell, P.J., (2004). “In Situ Measurements of Changes in Small-Strain Soil Stiffness Beneath a Footing with Varying Static and Dynamic Loads” Proc., Eleventh International Conference on Soil Dynamics and Earthquake Engineering, Berkeley, CA.
8. Stokoe, II, K.H., Rathje, E.M. and Axtell, P.J. (2005). “Development of an In Situ Method to Measure the Nonlinear Shear Modulus of Soil” Proc., 16th International Conference on Soil Mechanics and Geotechnical Engineering, Osaka, Japan.
9. U.S. Army Corps of Engineers, Kansas City District (2002). “Evaluation Report, Volume V, Appendices to Phase II Special Investigations, Part 2: Detailed Field Investigation and Evaluation of Repair Alternatives: E: Slope Stability Analyses, F: Dynaflow Analysis, G: TARA Analysis, H: Seepage Analysis, I: Cost Estimates, and J: Seismic Rehabilitation of the Dam.” Kansas City, Missouri, 246 p.
10. Van der Stoel, A. (2001). “Grouting to Improve Pile Foundations”, Doctoral Dissertation, Delft University of Technology, Netherlands, <http://www.library.tudelft.nl/dissertations/2940/f_161957_true_EN.html>.
11. Youd, T.L, Idriss, I.M, Andrus, R.D., Arango, I., Castro, G., Christian, J.T., Dobry, R., Finn, W.D.L., Harder, L.F., Hynes, M.E., Ishihara, K., Koester, J.P., Liao, S.C., Marcusson III, W.F., Martin, G.R., Mitchell, J.K., Moriwaki, Y., Power, M.S., Robertson, P.K., Seed, R.B., and Stokoe II, K.H. (2001). “Liquefaction Resistance of Soils: Summary Report from the 1996 NCEER and 1998 NCEER/NSF Workshops on Evaluation of Liquefaction Resistance of Soils” J. Geotech. and Geoenvir. Engrg., ASCE, 127(10), 817-833.