Embed Size (px)
Citation preview
INDABA Exhibitor Briefing
Slide no. 2 © South African Tourism 2012
2
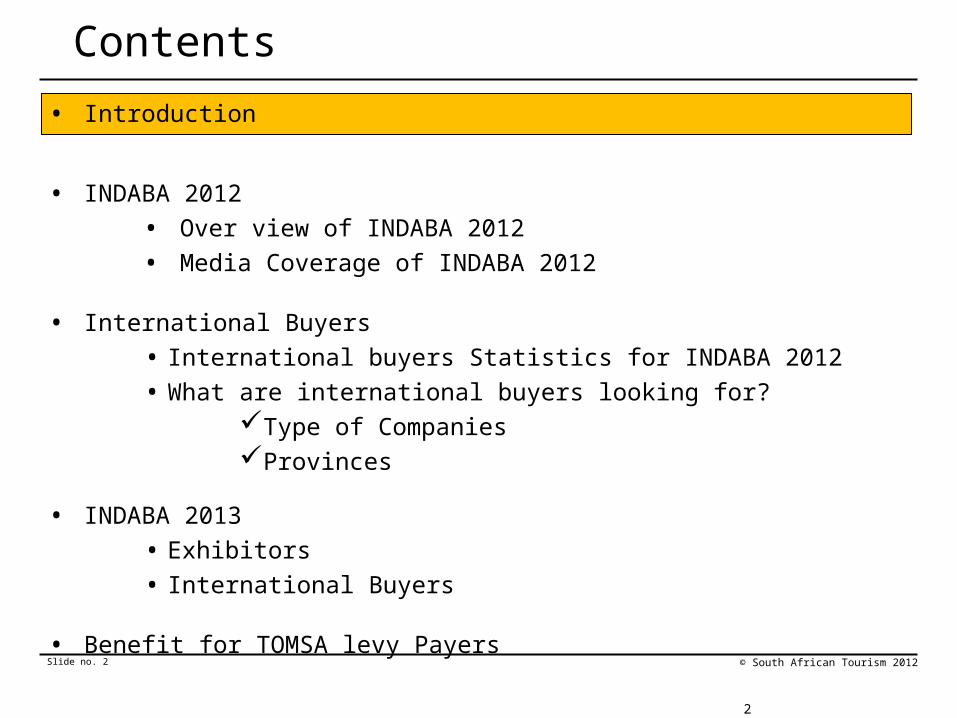
Contents
• Introduction
• INDABA 2012
• Over view of INDABA 2012
• Media Coverage of INDABA 2012
• International Buyers
• International buyers Statistics for INDABA 2012
• What are international buyers looking for?Type of Companies Provinces
• INDABA 2013
• Exhibitors
• International Buyers
• Benefit for TOMSA levy Payers
Slide no. 3 © South African Tourism 2012
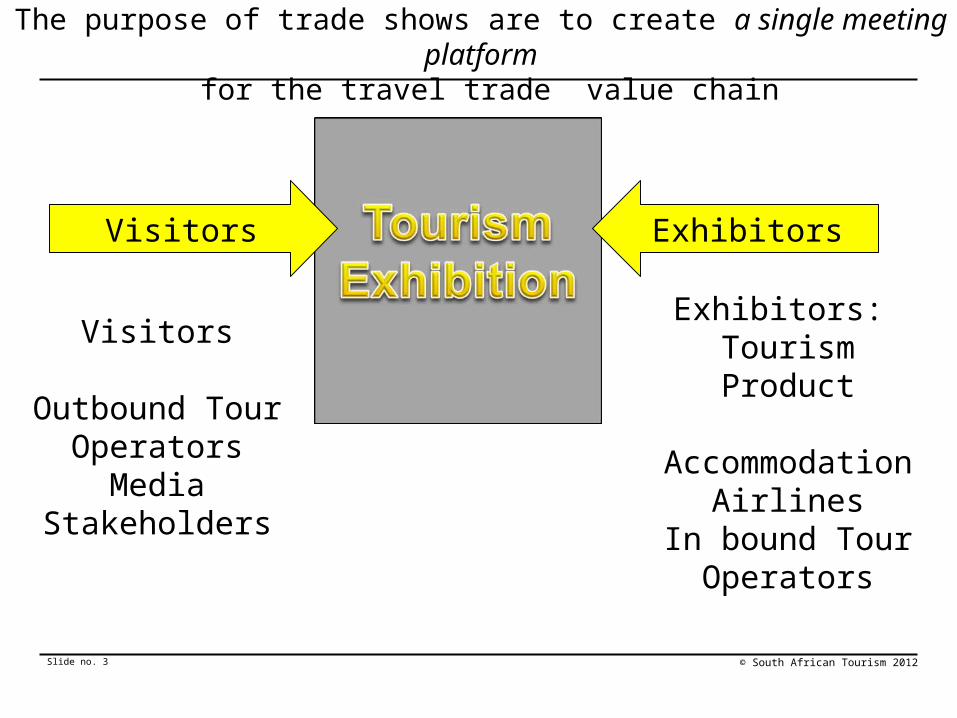
Visitors
The purpose of trade shows are to create a single meeting platform
for the travel trade value chain
Visitors
Outbound Tour Operators
MediaStakeholders
Exhibitors: Tourism Product
AccommodationAirlines
In bound Tour Operators
Exhibitors
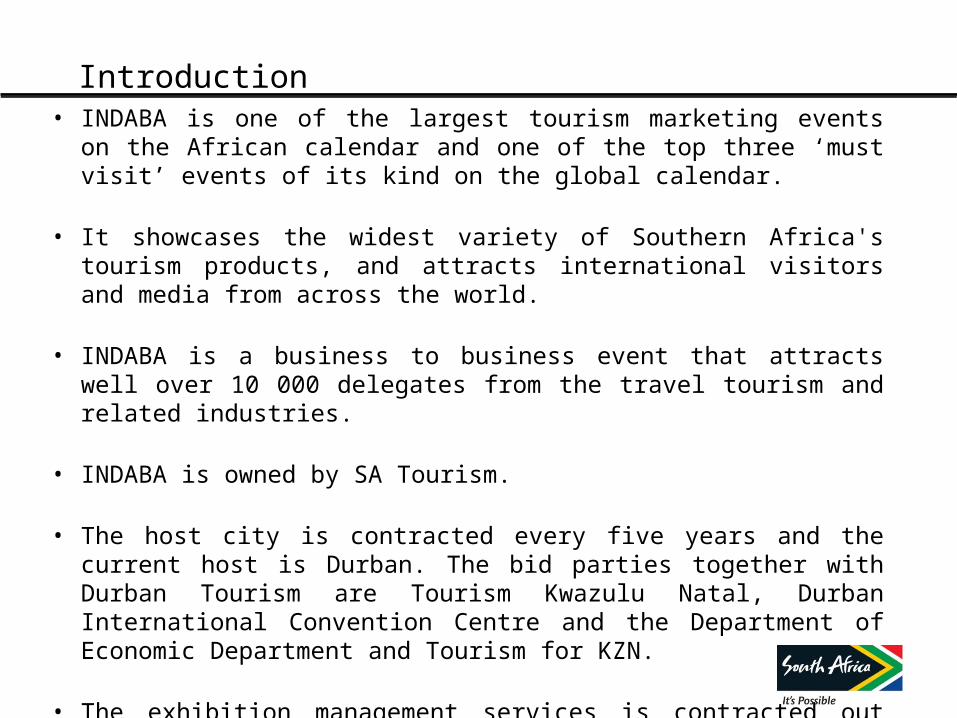
Introduction • INDABA is one of the largest tourism marketing events on the
African calendar and one of the top three ‘must visit’ events of its kind on the global calendar.
• It showcases the widest variety of Southern Africa's tourism products, and attracts international visitors and media from across the world.
• INDABA is a business to business event that attracts well over 10 000 delegates from the travel tourism and related industries.
• INDABA is owned by SA Tourism.
• The host city is contracted every five years and the current host is Durban. The bid parties together with Durban Tourism are Tourism Kwazulu Natal, Durban International Convention Centre and the Department of Economic Department and Tourism for KZN.
• The exhibition management services is contracted out every three years. Currently Witch and Wizard Creative provides this service until 2013
Slide no. 5 © South African Tourism 2012
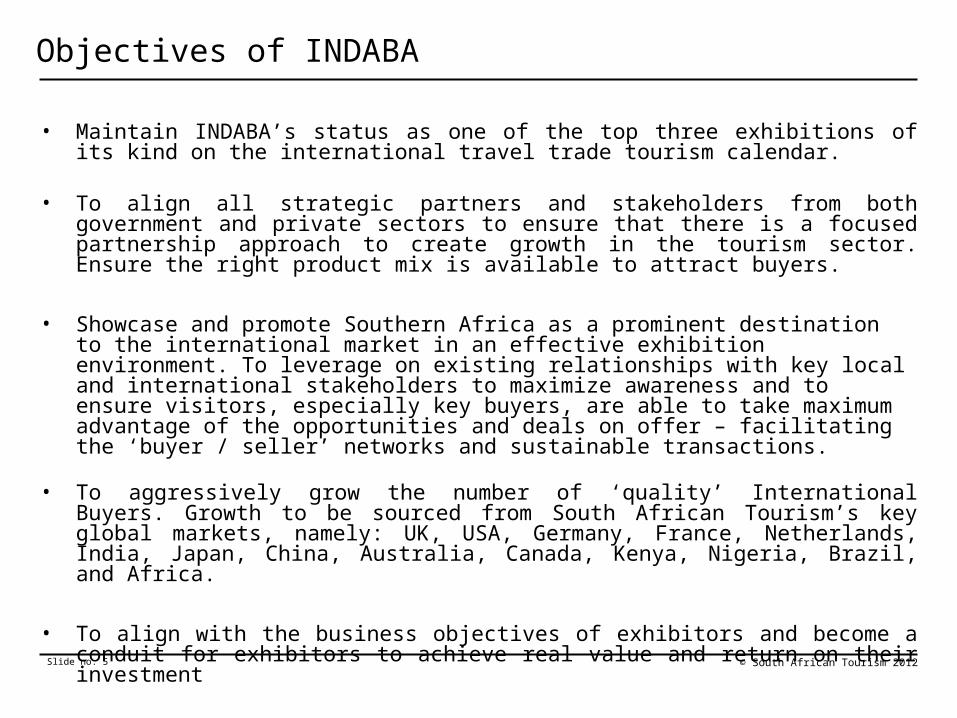
• Maintain INDABA’s status as one of the top three exhibitions of its kind on the international travel trade tourism calendar.
• To align all strategic partners and stakeholders from both government and private sectors to ensure that there is a focused partnership approach to create growth in the tourism sector. Ensure the right product mix is available to attract buyers.
• Showcase and promote Southern Africa as a prominent destination to the international market in an effective exhibition environment. To leverage on existing relationships with key local and international stakeholders to maximize awareness and to ensure visitors, especially key buyers, are able to take maximum advantage of the opportunities and deals on offer – facilitating the ‘buyer / seller’ networks and sustainable transactions.
• To aggressively grow the number of ‘quality’ International Buyers. Growth to be sourced from South African Tourism’s key global markets, namely: UK, USA, Germany, France, Netherlands, India, Japan, China, Australia, Canada, Kenya, Nigeria, Brazil, and Africa.
• To align with the business objectives of exhibitors and become a conduit for exhibitors to achieve real value and return on their investment
Objectives of INDABA
Slide no. 6 © South African Tourism 2012
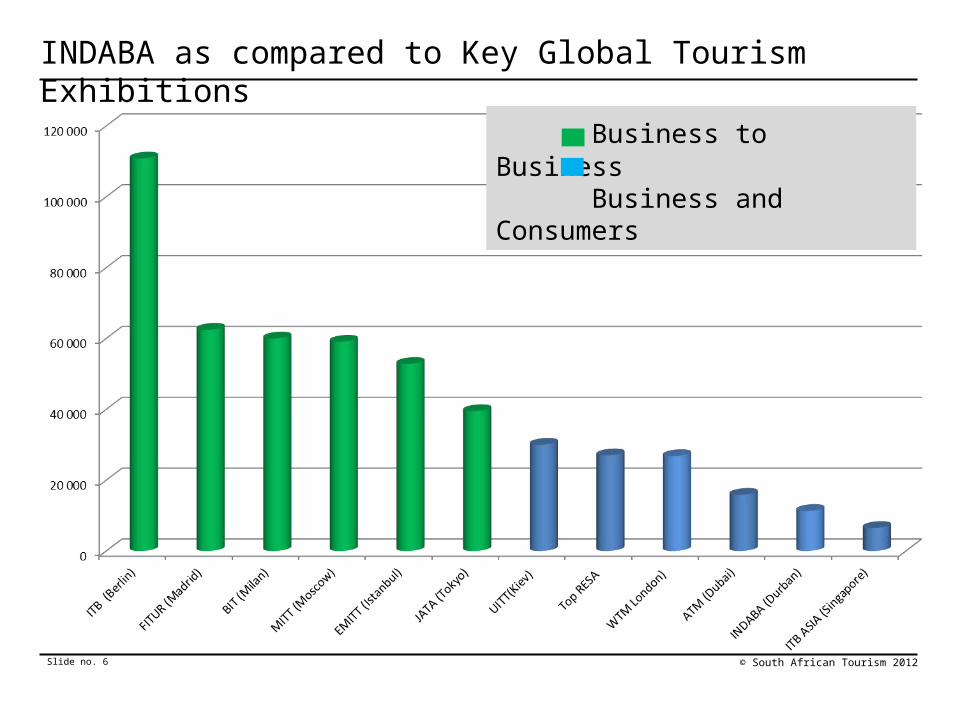
INDABA as compared to Key Global Tourism Exhibitions
Business to BusinessBusiness and
Consumers
Slide no. 7
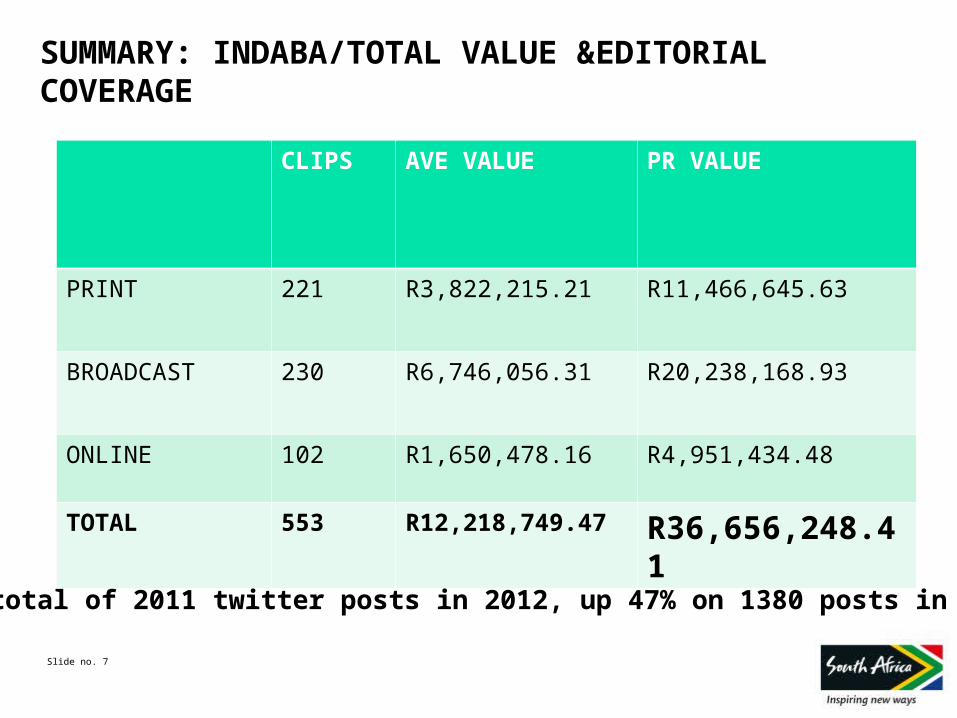
SUMMARY: INDABA/TOTAL VALUE &EDITORIAL COVERAGE
CLIPS AVE VALUE PR VALUE
PRINT 221 R3,822,215.21 R11,466,645.63
BROADCAST 230 R6,746,056.31 R20,238,168.93
ONLINE 102 R1,650,478.16 R4,951,434.48
TOTAL 553 R12,218,749.47 R36,656,248.41
A total of 2011 twitter posts in 2012, up 47% on 1380 posts in 2011
Slide no. 8 © South African Tourism 2012
8
Contents
• Introduction
• INDABA 2012
• Over view of INDABA 2012
• Media Coverage of INDABA 2012
• International Buyers
• International buyers Statistics for INDABA 2012
• What are international buyers looking for?Type of Companies Provinces
• INDABA 2013
• Exhibitors
• International Buyers
• Benefit for TOMSA levy Payers
9
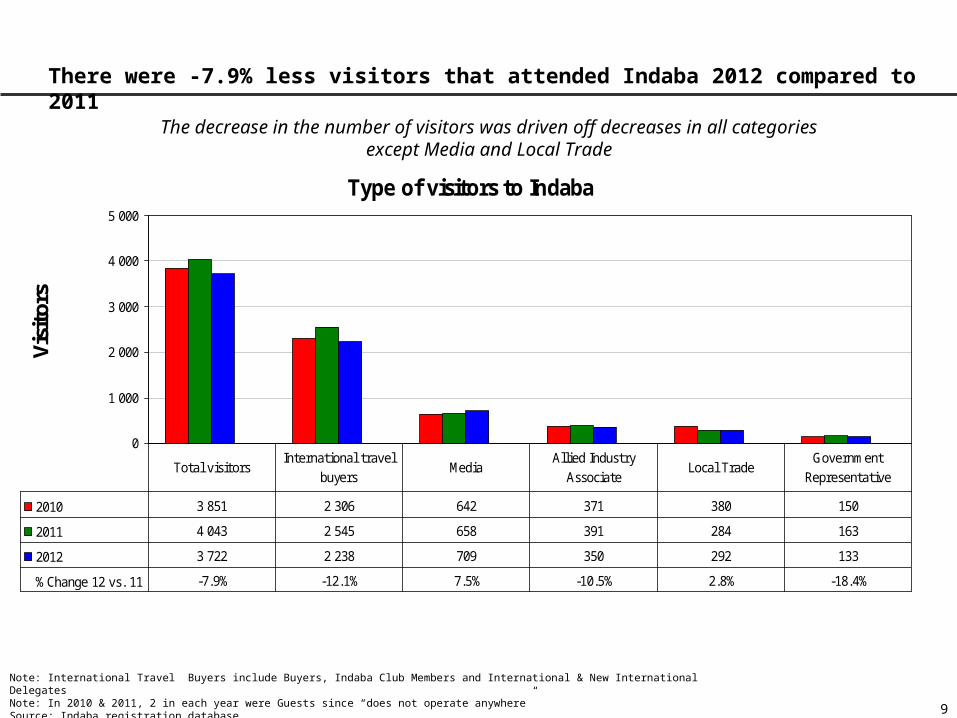
There were -7.9% less visitors that attended Indaba 2012 compared to 2011
Note: International Travel Buyers include Buyers, Indaba Club Members and International & New International DelegatesNote: In 2010 & 2011, 2 in each year were Guests since “does not operate anywhere”Source: Indaba registration database
The decrease in the number of visitors was driven off decreases in all categories except Media and Local Trade
Type of visitors to Indaba
0
1 000
2 000
3 000
4 000
5 000
Visi
tors
2010 3 851 2 306 642 371 380 150
2011 4 043 2 545 658 391 284 163
2012 3 722 2 238 709 350 292 133
% Change 12 vs. 11 -7.9% -12.1% 7.5% -10.5% 2.8% -18.4%
Total visitorsInternational travel
buyersMedia
Allied Industry Associate
Local TradeGovernment
Representative
10
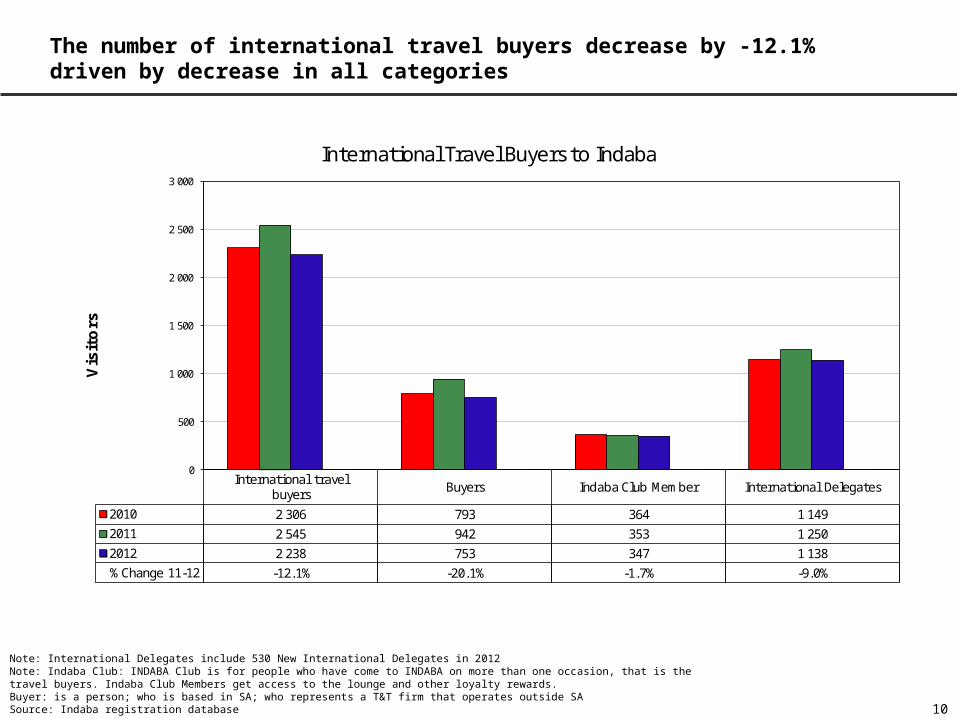
The number of international travel buyers decrease by -12.1% driven by decrease in all categories
International travel buyers
Buyers Indaba Club Member International Delegates
2010 2 306 793 364 1 149
2011 2 545 942 353 1 250
2012 2 238 753 347 1 138
% Change 11-12 -12.1% -20.1% -1.7% -9.0%
0
500
1 000
1 500
2 000
2 500
3 000
Vis
ito
rs
International Travel Buyers to Indaba
Note: International Delegates include 530 New International Delegates in 2012Note: Indaba Club: INDABA Club is for people who have come to INDABA on more than one occasion, that is the travel buyers. Indaba Club Members get access to the lounge and other loyalty rewards.Buyer: is a person; who is based in SA; who represents a T&T firm that operates outside SASource: Indaba registration database
11
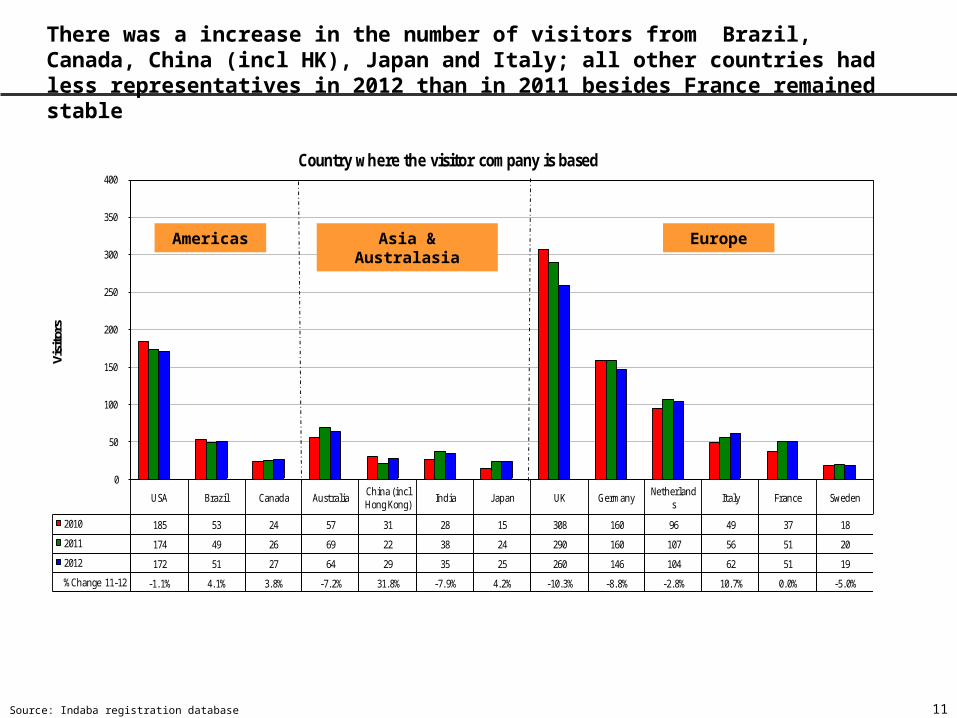
USA Brazil Canada AustraliaChina (incl Hong Kong)
India J apan UK GermanyNetherland
sItaly France Sweden
2010 185 53 24 57 31 28 15 308 160 96 49 37 18
2011 174 49 26 69 22 38 24 290 160 107 56 51 20
2012 172 51 27 64 29 35 25 260 146 104 62 51 19
% Change 11-12 -1.1% 4.1% 3.8% -7.2% 31.8% -7.9% 4.2% -10.3% -8.8% -2.8% 10.7% 0.0% -5.0%
0
50
100
150
200
250
300
350
400
Visi
tors
Country where the visitor company is based
There was a increase in the number of visitors from Brazil, Canada, China (incl HK), Japan and Italy; all other countries had less representatives in 2012 than in 2011 besides France remained stable
Americas Asia & Australasia
Europe
Source: Indaba registration database
12
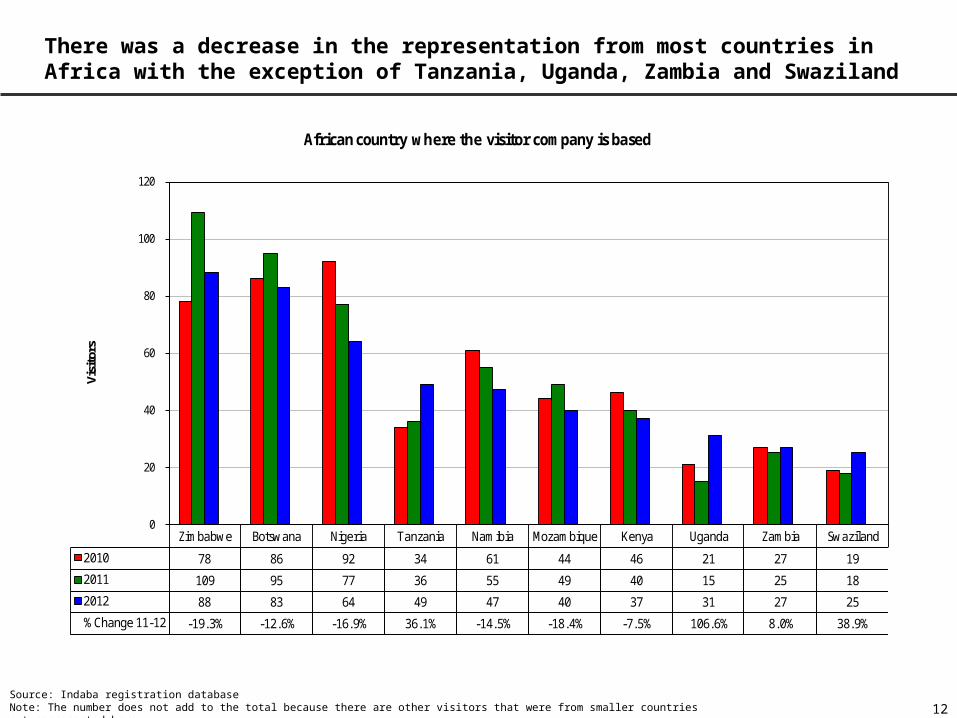
There was a decrease in the representation from most countries in Africa with the exception of Tanzania, Uganda, Zambia and Swaziland
Zimbabwe Botswana Nigeria Tanzania Namibia Mozambique Kenya Uganda Zambia Swaziland
2010 78 86 92 34 61 44 46 21 27 19
2011 109 95 77 36 55 49 40 15 25 18
2012 88 83 64 49 47 40 37 31 27 25
% Change 11-12 -19.3% -12.6% -16.9% 36.1% -14.5% -18.4% -7.5% 106.6% 8.0% 38.9%
0
20
40
60
80
100
120
Visi
tors
African country where the visitor company is based
Source: Indaba registration databaseNote: The number does not add to the total because there are other visitors that were from smaller countries not represented here
13
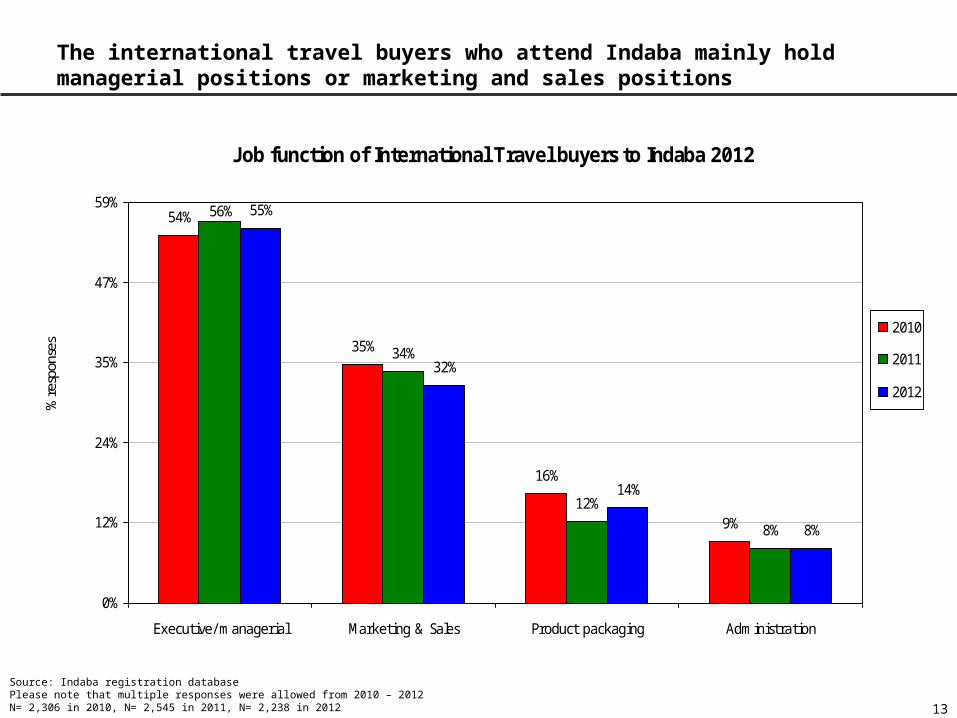
The international travel buyers who attend Indaba mainly hold managerial positions or marketing and sales positions
Job function of International Travel buyers to Indaba 2012
54%
35%
16%
9%
34%
12%
8%
55%
32%
14%
8%
56%
0%
12%
24%
35%
47%
59%
Executive/ managerial Marketing & Sales Product packaging Administration
% re
spon
ses
2010
2011
2012
Source: Indaba registration databasePlease note that multiple responses were allowed from 2010 – 2012N= 2,306 in 2010, N= 2,545 in 2011, N= 2,238 in 2012
14
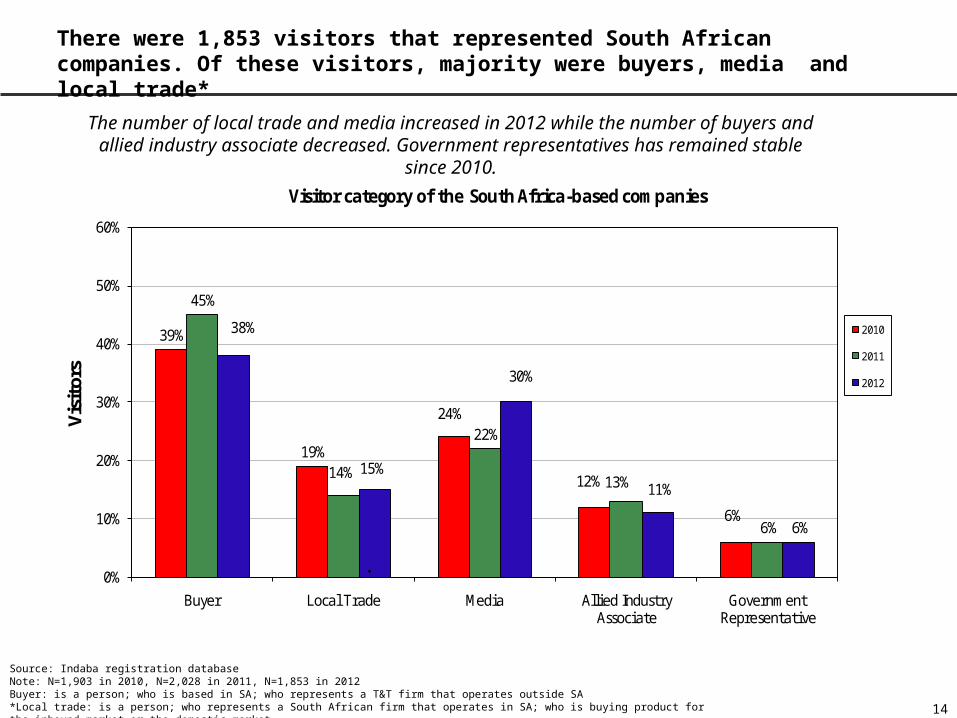
There were 1,853 visitors that represented South African companies. Of these visitors, majority were buyers, media and local trade*
39%
19%
24%
12%
6%
45%
14%
22%
13%
6%
38%
15%
30%
11%
6%
0%
10%
20%
30%
40%
50%
60%
Buyer Local Trade Media Allied Industry Associate
Government Representative
Vis
itor
s
Visitor category of the South Africa-based companies
2010
2011
2012
.
Source: Indaba registration database Note: N=1,903 in 2010, N=2,028 in 2011, N=1,853 in 2012Buyer: is a person; who is based in SA; who represents a T&T firm that operates outside SA*Local trade: is a person; who represents a South African firm that operates in SA; who is buying product for the inbound market or the domestic market
The number of local trade and media increased in 2012 while the number of buyers and allied industry associate decreased. Government representatives
has remained stable since 2010.
15
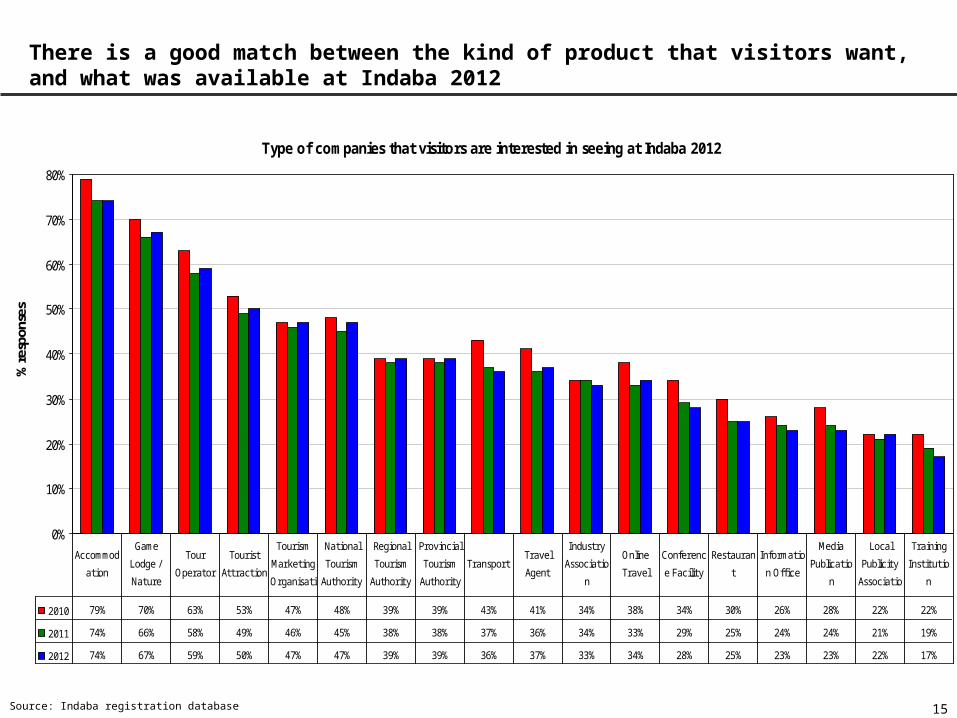
There is a good match between the kind of product that visitors want, and what was available at Indaba 2012
Type of companies that visitors are interested in seeing at Indaba 2012
0%
10%
20%
30%
40%
50%
60%
70%
80%
% re
spon
ses
2010 79% 70% 63% 53% 47% 48% 39% 39% 43% 41% 34% 38% 34% 30% 26% 28% 22% 22%
2011 74% 66% 58% 49% 46% 45% 38% 38% 37% 36% 34% 33% 29% 25% 24% 24% 21% 19%
2012 74% 67% 59% 50% 47% 47% 39% 39% 36% 37% 33% 34% 28% 25% 23% 23% 22% 17%
Accommod
ation
Game
Lodge /
Nature
Tour
Operator
Tourist
Attraction
Tourism
Marketing
Organisati
National
Tourism
Authority
Regional
Tourism
Authority
Provincial
Tourism
Authority
TransportTravel
Agent
Industry
Associatio
n
Online
Travel
Conferenc
e Facility
Restauran
t
Informatio
n Office
Media
Publicatio
n
Local
Publicity
Associatio
Training
Institutio
n
Source: Indaba registration database
16
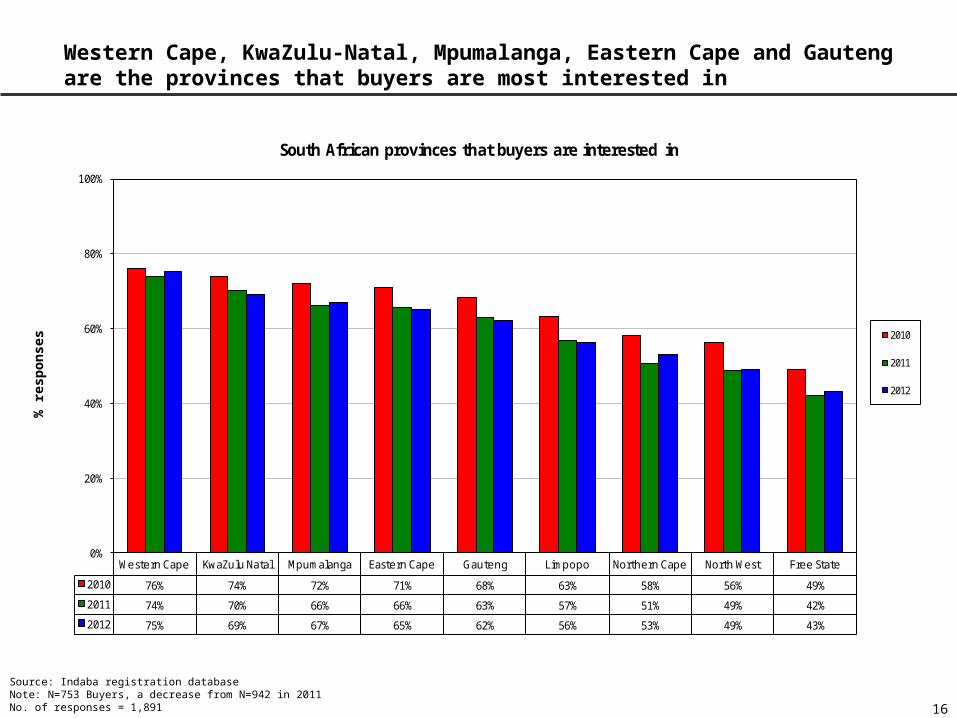
Western Cape, KwaZulu-Natal, Mpumalanga, Eastern Cape and Gauteng are the provinces that buyers are most interested in
Western Cape KwaZulu Natal Mpumalanga Eastern Cape Gauteng Limpopo Northern Cape North West Free State
2010 76% 74% 72% 71% 68% 63% 58% 56% 49%
2011 74% 70% 66% 66% 63% 57% 51% 49% 42%
2012 75% 69% 67% 65% 62% 56% 53% 49% 43%
0%
20%
40%
60%
80%
100%
South African provinces that buyers are interested in
2010
2011
2012
Source: Indaba registration databaseNote: N=753 Buyers, a decrease from N=942 in 2011No. of responses = 1,891
% r
esp
on
ses
17
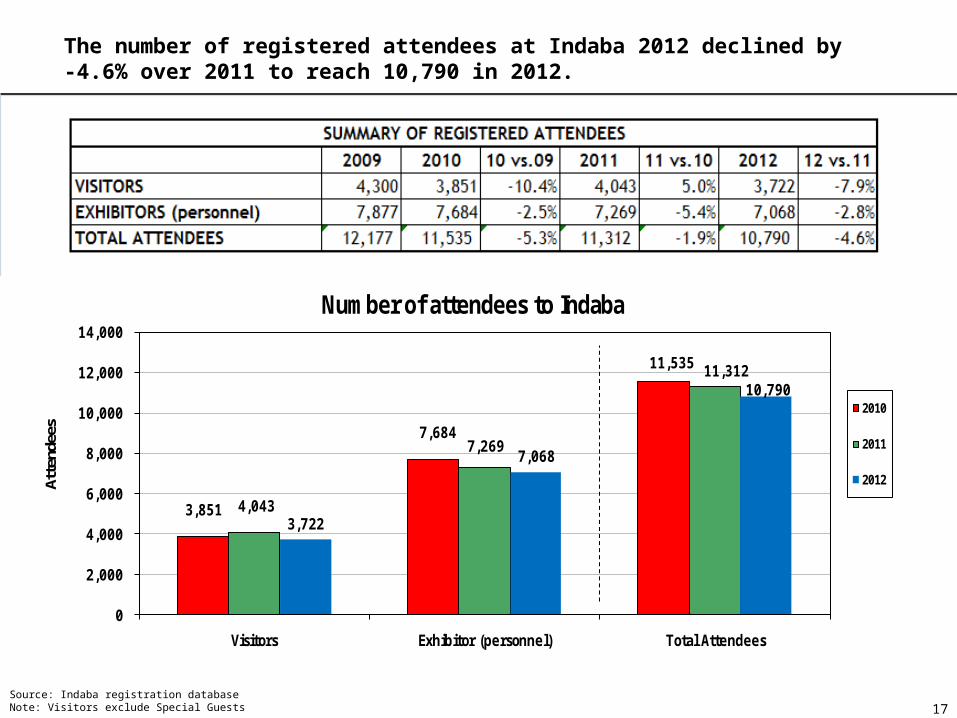
The number of registered attendees at Indaba 2012 declined by -4.6% over 2011 to reach 10,790 in 2012.
3,851
7,684
11,535
4,043
7,269
11,312
3,722
7,068
10,790
0
2,000
4,000
6,000
8,000
10,000
12,000
14,000
Visitors Exhibitor (personnel) Total Attendees
Atte
ndee
s
Number of attendees to Indaba
2010
2011
2012
Source: Indaba registration databaseNote: Visitors exclude Special Guests
18
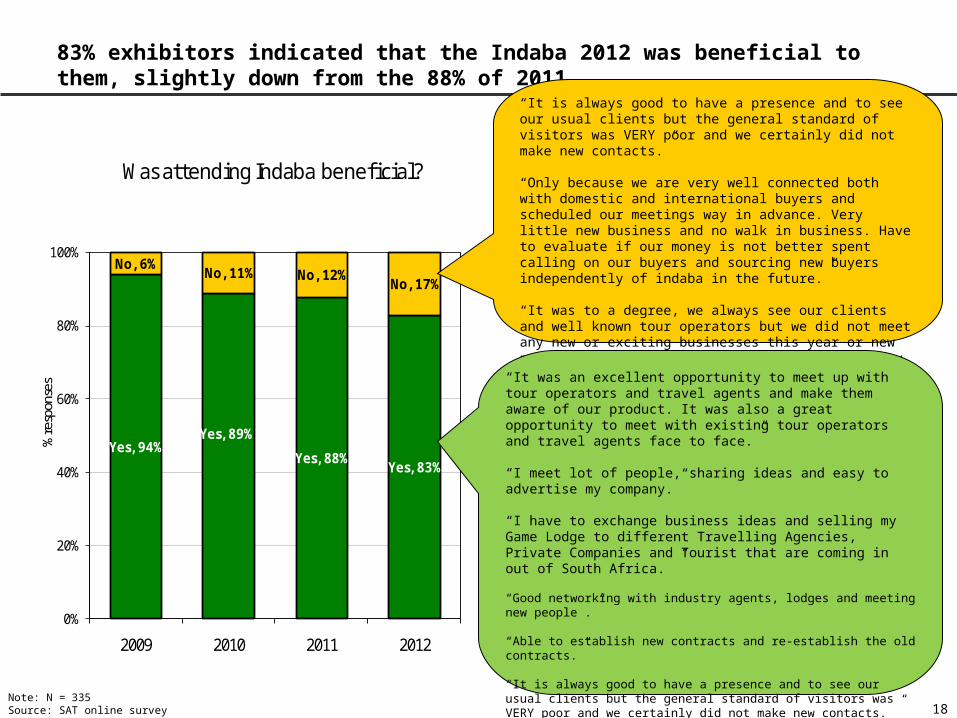
83% exhibitors indicated that the Indaba 2012 was beneficial to them, slightly down from the 88% of 2011
Yes, 94%Yes, 89%
Yes, 88%Yes, 83%
No, 6%No, 11% No, 12%
No, 17%
0%
20%
40%
60%
80%
100%
2009 2010 2011 2012
% re
spon
ses
Was attending Indaba beneficial?
“It is always good to have a presence and to see our usual clients but the general standard of visitors was VERY poor and we certainly did not make new contacts.” “Only because we are very well connected both with domestic and international buyers and scheduled our meetings way in advance. Very little new business and no walk in business. Have to evaluate if our money is not better spent calling on our buyers and sourcing new buyers independently of indaba in the future.”
“It was to a degree, we always see our clients and well known tour operators but we did not meet any new or exciting businesses this year or new product. Less people were exhibiting and Tuesday was completely dead - no business done whatsoever after a very busy 3 days.”
“It was an excellent opportunity to meet up with tour operators and travel agents and make them aware of our product. It was also a great opportunity to meet with existing tour operators and travel agents face to face.”
“I meet lot of people, sharing ideas and easy to advertise my company.”
“I have to exchange business ideas and selling my Game Lodge to different Travelling Agencies, Private Companies and Tourist that are coming in out of South Africa. ”
“Good networking with industry agents, lodges and meeting new people .”
“Able to establish new contracts and re-establish the old contracts.”
“It is always good to have a presence and to see our usual clients but the general standard of visitors was VERY poor and we certainly did not make new contacts. ”
“we made new possible relationships with other people of which some of them we already started working with them.”
Note: N = 335Source: SAT online survey
19
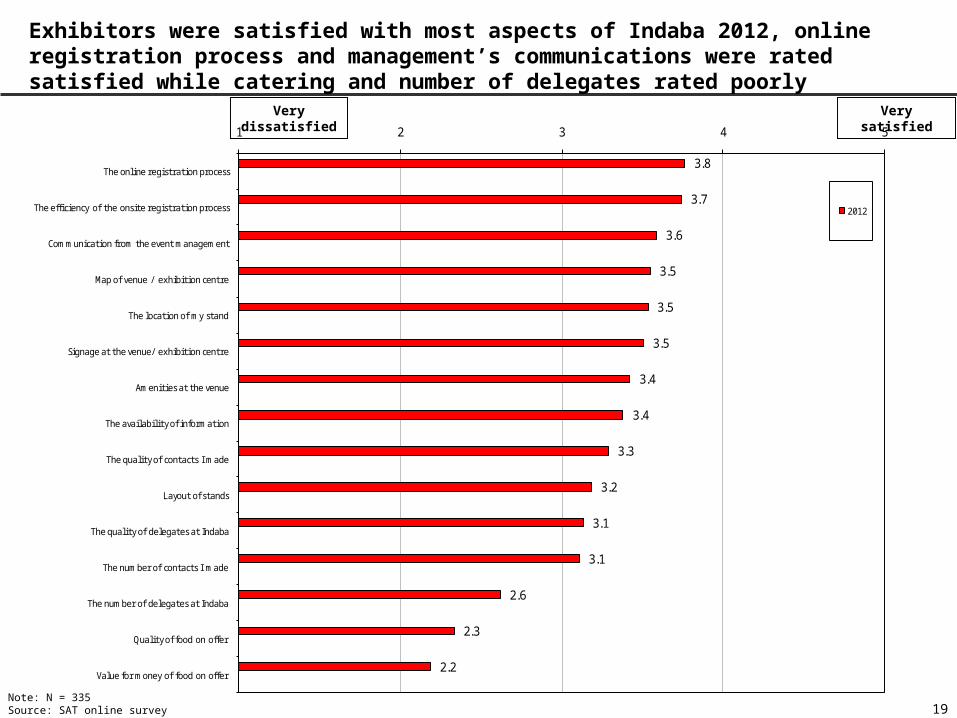
Exhibitors were satisfied with most aspects of Indaba 2012, online registration process and management’s communications were rated satisfied while catering and number of delegates rated poorly
3.8
3.7
3.6
3.5
3.5
3.5
3.4
3.4
3.3
3.2
3.1
3.1
2.6
2.3
2.2
1 2 3 4 5
The online registration process
The efficiency of the onsite registration process
Communication from the event management
Map of venue / exhibition centre
The location of my stand
Signage at the venue/ exhibition centre
Amenities at the venue
The availability of information
The quality of contacts I made
Layout of stands
The quality of delegates at Indaba
The number of contacts I made
The number of delegates at Indaba
Quality of food on offer
Value for money of food on offer
2012
Very dissatisfied
Very satisfied
Note: N = 335Source: SAT online survey
20
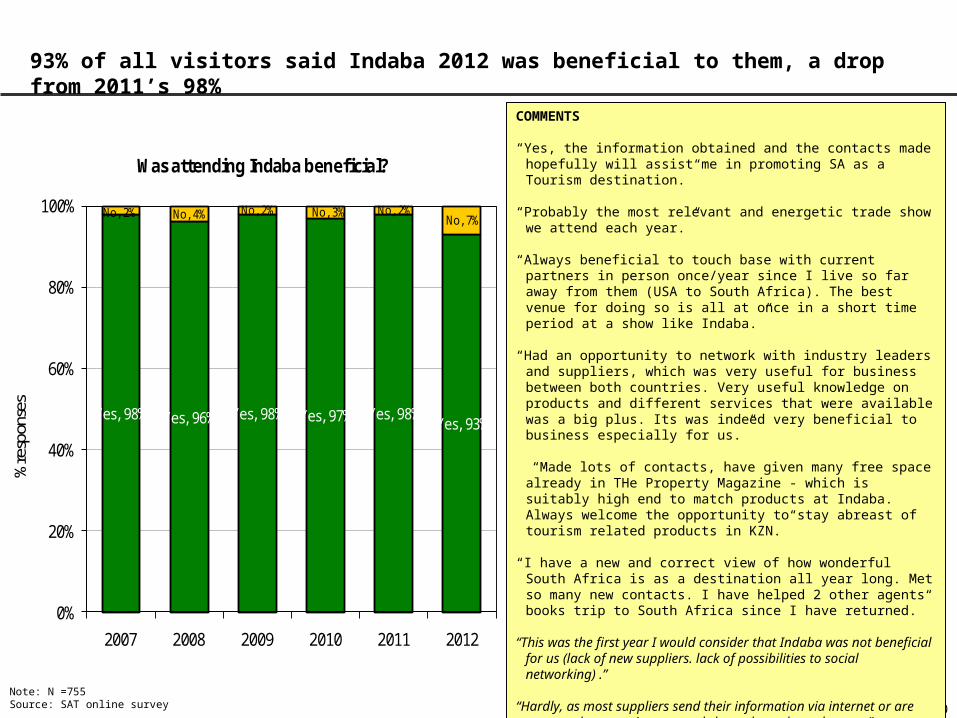
93% of all visitors said Indaba 2012 was beneficial to them, a drop from 2011’s 98%
Yes, 98% Yes, 96% Yes, 98% Yes, 97% Yes, 98%Yes, 93%
No, 2% No, 4% No, 2% No, 3% No, 2%No, 7%
0%
20%
40%
60%
80%
100%
2007 2008 2009 2010 2011 2012
% re
spon
ses
Was attending Indaba beneficial?
Note: N =755Source: SAT online survey
COMMENTS
“Yes, the information obtained and the contacts made hopefully will assist me in promoting SA as a Tourism destination.”
“Probably the most relevant and energetic trade show we attend each year.”
“Always beneficial to touch base with current partners in person once/year since I live so far away from them (USA to South Africa). The best venue for doing so is all at once in a short time period at a show like Indaba.”
“Had an opportunity to network with industry leaders and suppliers, which was very useful for business between both countries. Very useful knowledge on products and different services that were available was a big plus. Its was indeed very beneficial to business especially for us.”
“Made lots of contacts, have given many free space already in THe Property Magazine - which is suitably high end to match products at Indaba. Always welcome the opportunity to stay abreast of tourism related products in KZN.”
“I have a new and correct view of how wonderful South Africa is as a destination all year long. Met so many new contacts. I have helped 2 other agents books trip to South Africa since I have returned.”
“This was the first year I would consider that Indaba was not beneficial for us (lack of new suppliers. lack of possibilities to social networking) .”
“Hardly, as most suppliers send their information via internet or are met at other occasions or workshops throughout the year.”
21
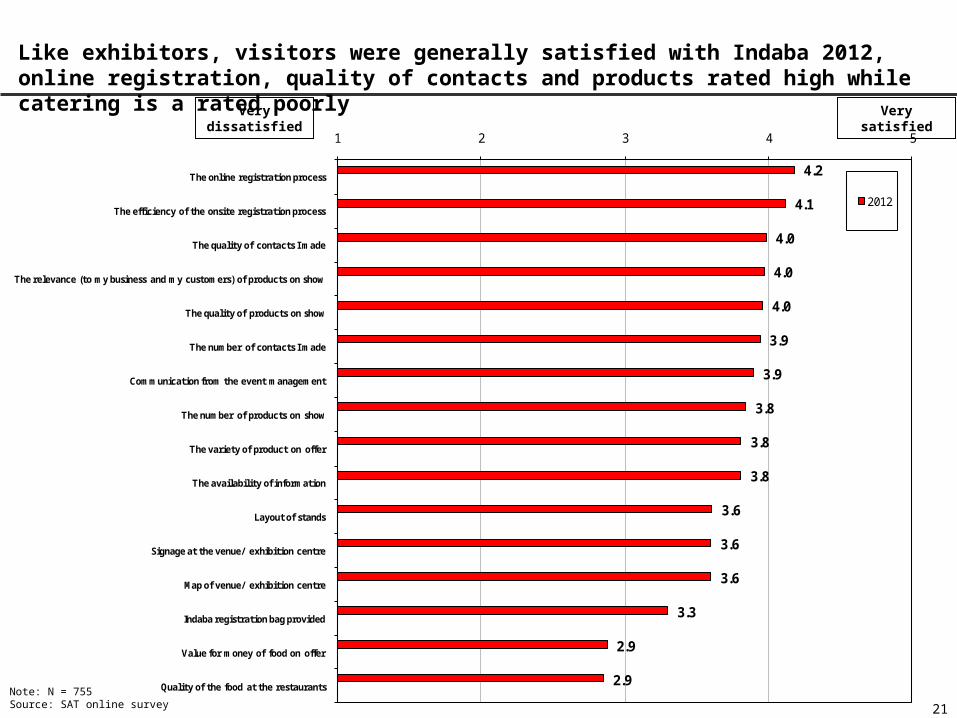
Like exhibitors, visitors were generally satisfied with Indaba 2012, online registration, quality of contacts and products rated high while catering is a rated poorly
4.2
4.1
4.0
4.0
4.0
3.9
3.9
3.8
3.8
3.8
3.6
3.6
3.6
3.3
2.9
2.9
1 2 3 4 5
The online registration process
The efficiency of the onsite registration process
The quality of contacts I made
The relevance (to my business and my customers) of products on show
The quality of products on show
The number of contacts I made
Communication from the event management
The number of products on show
The variety of product on offer
The availability of information
Layout of stands
Signage at the venue/ exhibition centre
Map of venue/ exhibition centre
Indaba registration bag provided
Value for money of food on offer
Quality of the food at the restaurants
2012
Very dissatisfied
Very satisfied
Note: N = 755Source: SAT online survey
INDABA 2013
Theme and Messaging
Keep 2012 Theme :
Partnering to win - Shaping our future together
Detailed messaging will be circulated later.
22
Slide no. 23 © South African Tourism 2012
Exhibitors at INDABA 2013
• Increase the Quantity and Quality of exhibitors who:
have attended INDABA previously and do not attend anymore
have not attended INDABA previously and meet the entry criteria
Slide no. 24 © South African Tourism 2012
Increase Quantity and Quality of Exhibitors at INDABA 2013• Create value Adds for exhibitors:
Daily Speed Marketing Sessions
Provide an exhibitor workshop to discuss key tourism trends
Enhance the online diary and match making process
Review and improve the entry criteria and enforce this at time of registration
• Competitive product mix to showcase SA’s diverse offering
Set up “experience” based pavilions e.g. Culture and Heritage will be introduced in 2013
• Keep the stand cost the same as 2012. There will be no increase in stand costs for INDABA 2013. Indaba 2013 will be a three day show from 11 -13 May 2013 and the cost saving will be passed on to exhibitors.
Slide no. 25 © South African Tourism 2012
International Buyers at INDABA 2013
• Increase the Quantity and Quality of buyers who:
have stopped attending INDABA
are new and who represent the emerging markets
represent niche markets, e.g. golf etc
Slide no. 26 © South African Tourism 2012
Increase Quantity of Buyers at INDABA 2013
• SA Tourism to host more buyers. In 2012, 200 buyers were hosted, SAT will review the target for 2013 based on Budget.
• Create an affordable INDABA Travel package for buyers that is easy to purchase.
• Enhance the Marketing Plan by
Marketing INDABA at all SAT and Stakeholder Roadshows/ trade shows.
Online marketing – direct and through tactical campaigns Trade publications barter agreeements Communicating to buyers the value proposition of INDABA
• Form an effective partnership with provinces/ industry to increase the number of hosted buyers
• Partner with Airlines in order for them to host an agreed target of buyers
Slide no. 27 © South African Tourism 2012
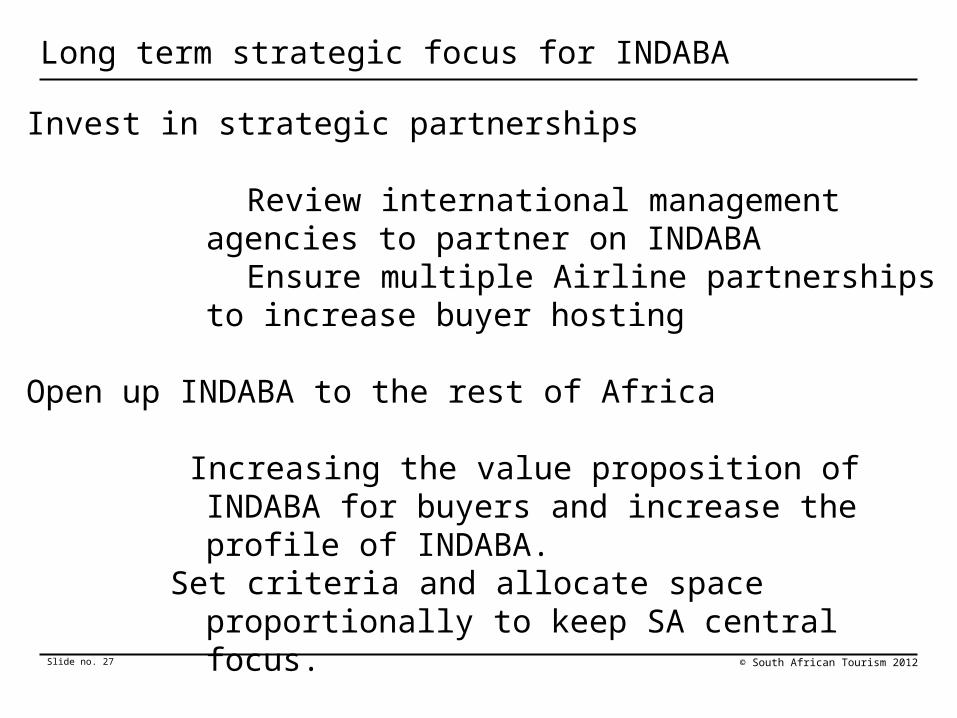
Long term strategic focus for INDABA
Invest in strategic partnerships
Review international management agencies to partner on INDABA
Ensure multiple Airline partnerships to increase buyer hosting
Open up INDABA to the rest of Africa
Increasing the value proposition of INDABA for buyers and increase the profile of INDABA.
Set criteria and allocate space proportionally to keep SA central focus.
Slide no. 28 © South African Tourism 2012
Thank you
Contact Person for INDABA at SA Tourism [email protected]