Embed Size (px)
Citation preview
Independent Petroleum Association of America (IPAA) Oil & Gas Investment Symposium (OGIS) Toronto
Investor Presentation
June 5, 2014
NYSE: PVA
Forward-Looking Statements / Oil and Gas Reserves and Definitions
1
Forward-Looking Statements Certain statements contained herein that are not descriptions of historical facts are “forward-looking” statements within the meaning of Section 27A of the Securities Act of 1933, as amended, and Section 21E of the Securities Exchange Act of 1934, as amended. Because such statements include risks, uncertainties and contingencies, actual results may differ materially from those expressed or implied by such forward-looking statements. These risks, uncertainties and contingencies include, but are not limited to, the following: the volatility of commodity prices for oil, natural gas liquids and natural gas; our ability to develop, explore for, acquire and replace oil and gas reserves and sustain production; our ability to generate profits or achieve targeted reserves in our development and exploratory drilling and well operations; any impairments, write-downs or write-offs of our reserves or assets; the projected demand for and supply of oil, natural gas liquids and natural gas; reductions in the borrowing base under our revolving credit facility; our ability to contract for drilling rigs, supplies and services at reasonable costs; our ability to obtain adequate pipeline transportation capacity for our oil and gas production at reasonable cost and to sell the production at, or at reasonable discounts to, market prices; the uncertainties inherent in projecting future rates of production for our wells and the extent to which actual production differs from estimated proved oil and gas reserves; drilling and operating risks; our ability to compete effectively against oil and gas companies; our ability to successfully monetize select assets and repay our debt; leasehold terms expiring before production can be established; environmental liabilities that are not covered by an effective indemnity or insurance; the timing of receipt of necessary regulatory permits; the effect of commodity and financial derivative arrangements; our ability to maintain adequate financial liquidity and to access adequate levels of capital on reasonable terms; the occurrence of unusual weather or operating conditions, including force majeure events; our ability to retain or attract senior management and key technical employees; counterparty risk related to their ability to meet their future obligations; changes in governmental regulations or enforcement practices, especially with respect to environmental, health and safety matters; uncertainties relating to general domestic and international economic and political conditions; and other risks set forth in our filings with the Securities and Exchange Commission (SEC). Additional information concerning these and other factors can be found in our press releases and public periodic filings with the SEC. Many of the factors that will determine our future results are beyond the ability of management to control or predict. Readers should not place undue reliance on forward-looking statements, which reflect management’s views only as of the date hereof. We undertake no obligation to revise or update any forward-looking statements, or to make any other forward-looking statements, whether as a result of new information, future events or otherwise. Oil and Gas Reserves Effective January 1, 2010, the SEC permits oil and gas companies, in their filings with the SEC, to disclose not only “proved” reserves, but also “probable” reserves and “possible” reserves. As noted above, statements of reserves are only estimates and may not correspond to the ultimate quantities of oil and gas recovered. Investors are urged to consider closely the disclosure in PVA’s Annual Report on Form 10-K for the fiscal year ended December 31, 2013, which is available from PVA at Four Radnor Corporate Center, Suite 200, Radnor, PA 19087 (Attn: Investor Relations). You can also obtain this report from the SEC by calling 1-800-SEC-0330 or from the SEC’s website at www.sec.gov. Definitions Proved reserves are those quantities of oil and gas which, by analysis of geosciences and engineering data, can be estimated with reasonable certainty to be economically producible from a given date forward, from known reservoirs, and under existing economic conditions, operating methods and government regulation before the time at which contracts providing the right to operate expire, unless evidence indicates that renewal is reasonably certain, regardless of whether the estimate is a deterministic estimate or probabilistic estimate. Probable reserves are those additional reserves that are less certain to be recovered than proved reserves, but which are as likely than not to be recoverable (there should be at least a 50% probability that the quantities actually recovered will equal or exceed the proved plus probable reserve estimates). Possible reserves are those additional reserves that are less certain to be recoverable than probable reserves (there should be at least a 10% probability that the total quantities actually recovered will equal or exceed the proved plus probable plus possible reserve estimates). “3P” reserves refer to the sum of proved, probable and possible reserves. Estimated ultimate recovery (EUR) is the sum of reserves remaining as of a given date and cumulative production as of that date. EUR is a measure that by its nature is more speculative than estimates of reserves prepared in accordance with SEC definitions and guidelines and accordingly is less certain.
Penn Virginia Today
2
• Contiguous and high‐quality acreage position in the Eagle Ford Shale
• Approximately 86,800 net acres with over 1,500 remaining drilling locations; nearly a 15-year drilling inventory
• Continue to high-grade and increase acreage footprint
• Recent operational success
• Recent Upper Eagle Ford results has confirmed stacked potential
• Currently drilling premium acreage in the “Beer Quad” area
• Significant oil focus – current 2014E oil production growth guidance of greater than 65%
• Operational excellence and decreasing well costs
• Pad drilling and “zipper fracs” have increased efficiencies and improved well results
• Experienced team manages aggressive growth strategy
• Portfolio optimization focusing on Eagle Ford growth
• Recently announced Selma Chalk divestiture for approximately $73 MM
Eagle Ford Shale Will Drive Continued Growth
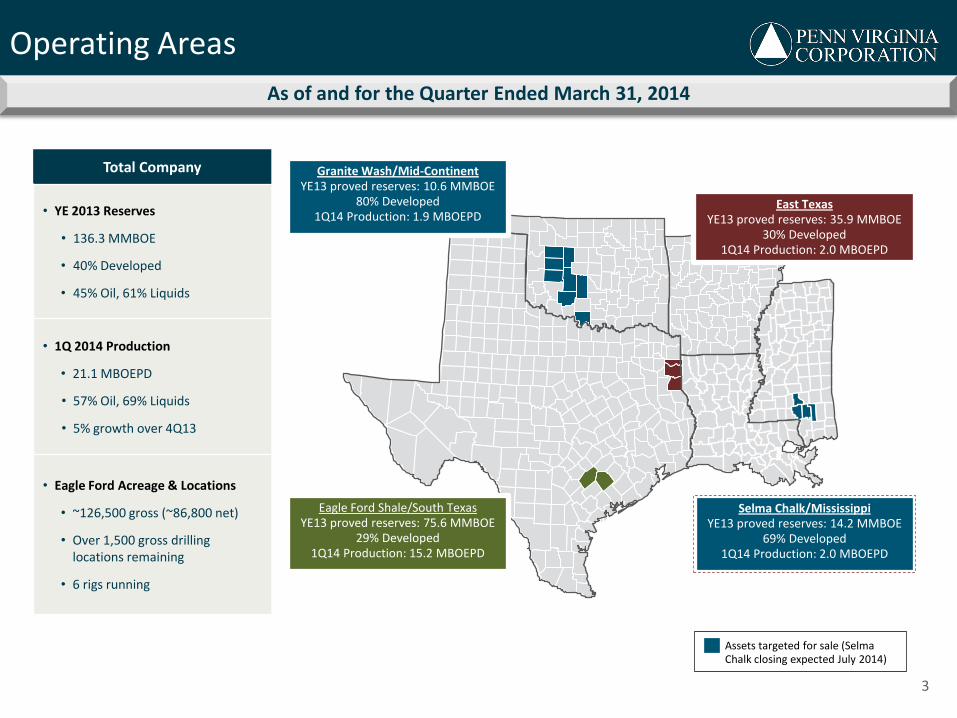
Operating Areas
3
Granite Wash/Mid-Continent YE13 proved reserves: 10.6 MMBOE
80% Developed 1Q14 Production: 1.9 MBOEPD
Eagle Ford Shale/South Texas YE13 proved reserves: 75.6 MMBOE
29% Developed 1Q14 Production: 15.2 MBOEPD
Selma Chalk/Mississippi YE13 proved reserves: 14.2 MMBOE
69% Developed 1Q14 Production: 2.0 MBOEPD
East Texas YE13 proved reserves: 35.9 MMBOE
30% Developed 1Q14 Production: 2.0 MBOEPD
As of and for the Quarter Ended March 31, 2014
Assets targeted for sale (Selma Chalk closing expected July 2014)
Total Company
• YE 2013 Reserves
• 136.3 MMBOE
• 40% Developed
• 45% Oil, 61% Liquids
• 1Q 2014 Production
• 21.1 MBOEPD
• 57% Oil, 69% Liquids
• 5% growth over 4Q13
• Eagle Ford Acreage & Locations
• ~126,500 gross (~86,800 net)
• Over 1,500 gross drilling locations remaining
• 6 rigs running
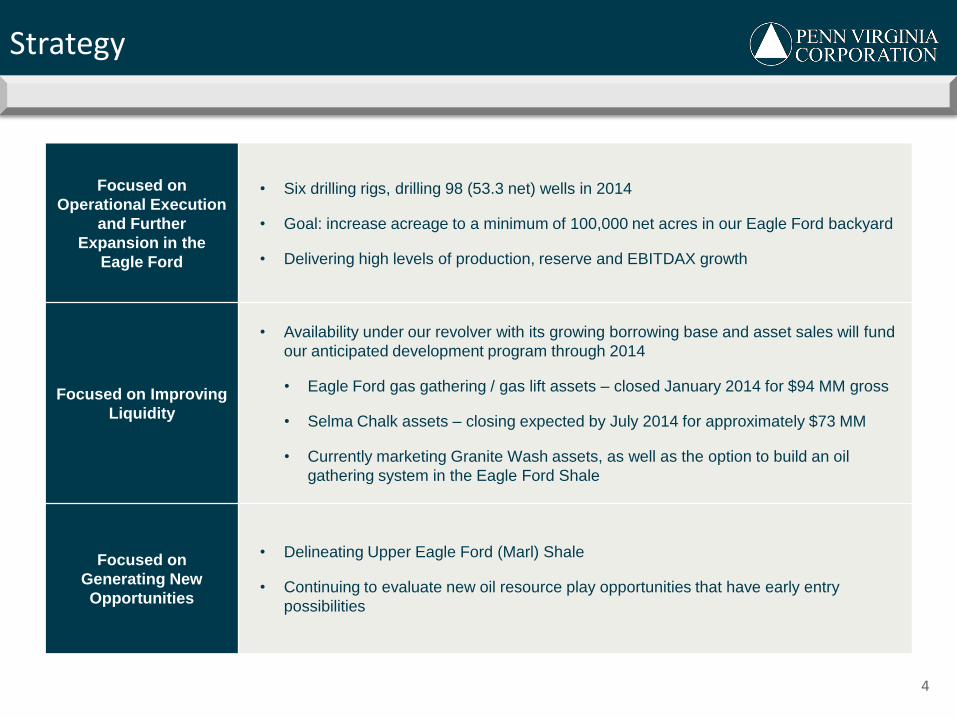
Strategy
4
Focused on
Operational Execution
and Further
Expansion in the
Eagle Ford
• Six drilling rigs, drilling 98 (53.3 net) wells in 2014
• Goal: increase acreage to a minimum of 100,000 net acres in our Eagle Ford backyard
• Delivering high levels of production, reserve and EBITDAX growth
Focused on Improving
Liquidity
• Availability under our revolver with its growing borrowing base and asset sales will fund
our anticipated development program through 2014
• Eagle Ford gas gathering / gas lift assets – closed January 2014 for $94 MM gross
• Selma Chalk assets – closing expected by July 2014 for approximately $73 MM
• Currently marketing Granite Wash assets, as well as the option to build an oil
gathering system in the Eagle Ford Shale
Focused on
Generating New
Opportunities
• Delineating Upper Eagle Ford (Marl) Shale
• Continuing to evaluate new oil resource play opportunities that have early entry
possibilities
0
5,000
10,000
15,000
20,000
25,000
30,000
2012 2013 2014E 2015E
BO
EPD
Eagle Ford Shale Mid-Continent Cotton Valley
Haynesville Shale Mississippi
5
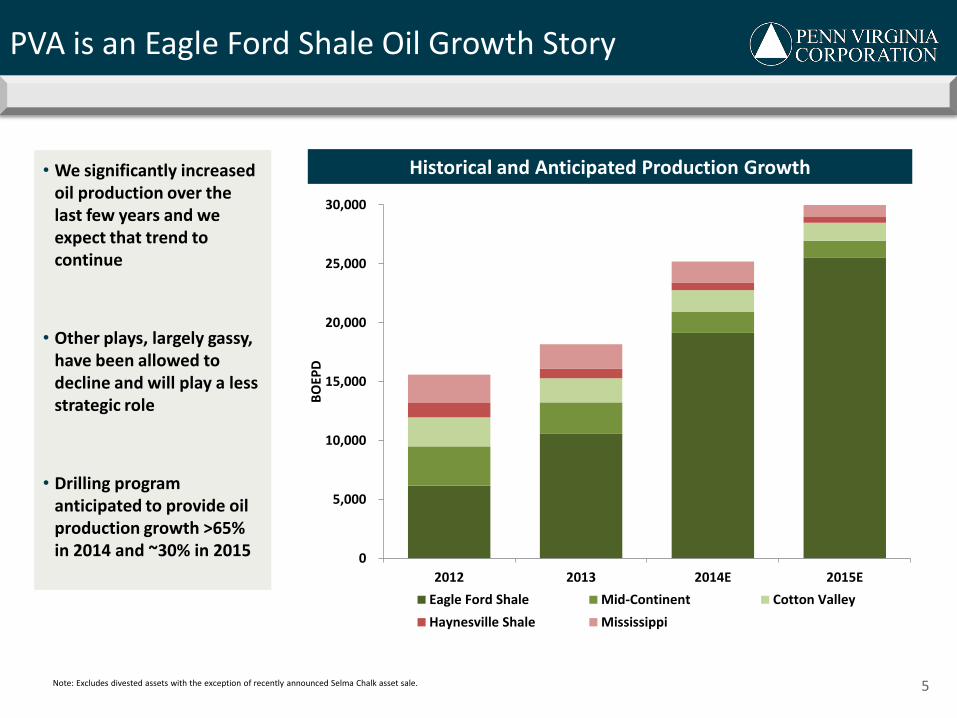
PVA is an Eagle Ford Shale Oil Growth Story
Note: Excludes divested assets with the exception of recently announced Selma Chalk asset sale.
• We significantly increased oil production over the last few years and we expect that trend to continue
• Other plays, largely gassy, have been allowed to decline and will play a less strategic role
• Drilling program anticipated to provide oil production growth >65% in 2014 and ~30% in 2015
Historical and Anticipated Production Growth
0
10
20
30
40
50
60
70
80
Year-End 2011 Year-End 2012 Mid-Year 2013 Year-End 2013
MM
BO
E
Growth in Eagle Ford Shale Proved Reserves
Crude Oil NGLs Natural Gas
$0
$20
$40
$60
$80
$100
$120
$MM
Growth in Eagle Ford Shale Revenues
Crude Oil NGLs Natural Gas
0
2
4
6
8
10
12
14
MB
OEP
D
Growth in Eagle Ford Shale Production
Crude Oil NGLs Natural Gas
6
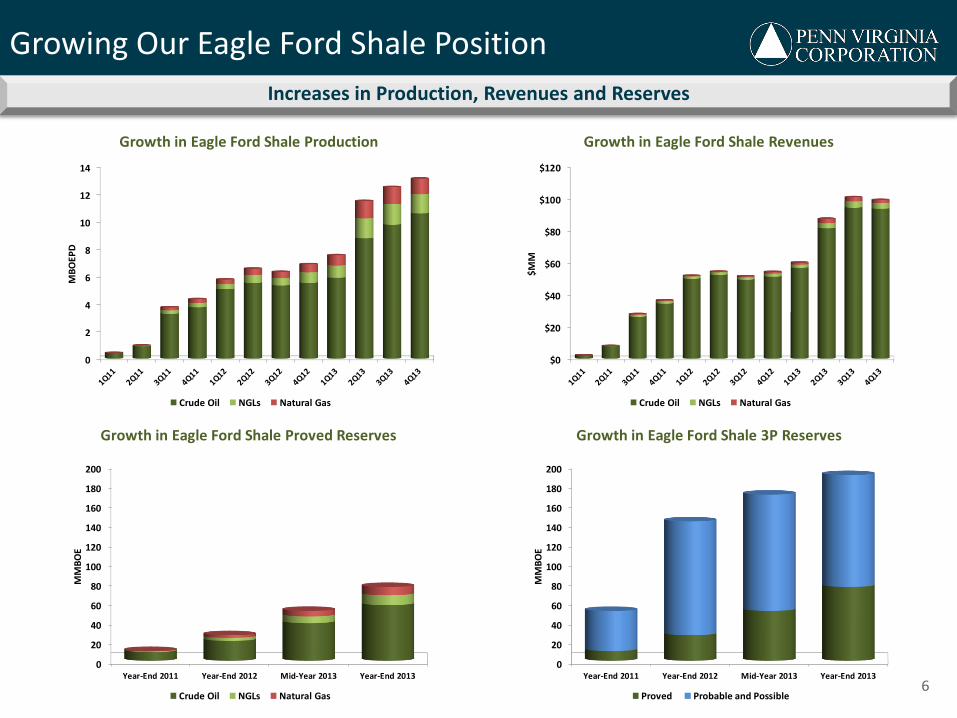
Growing Our Eagle Ford Shale Position
Increases in Production, Revenues and Reserves
0
20
40
60
80
100
120
140
160
180
200
Year-End 2011 Year-End 2012 Mid-Year 2013 Year-End 2013
MM
BO
E
Growth in Eagle Ford Shale Proved Reserves
Crude Oil NGLs Natural Gas
0
20
40
60
80
100
120
140
160
180
200
Year-End 2011 Year-End 2012 Mid-Year 2013 Year-End 2013
MM
BO
E
Growth in Eagle Ford Shale 3P Reserves
Proved Probable and Possible
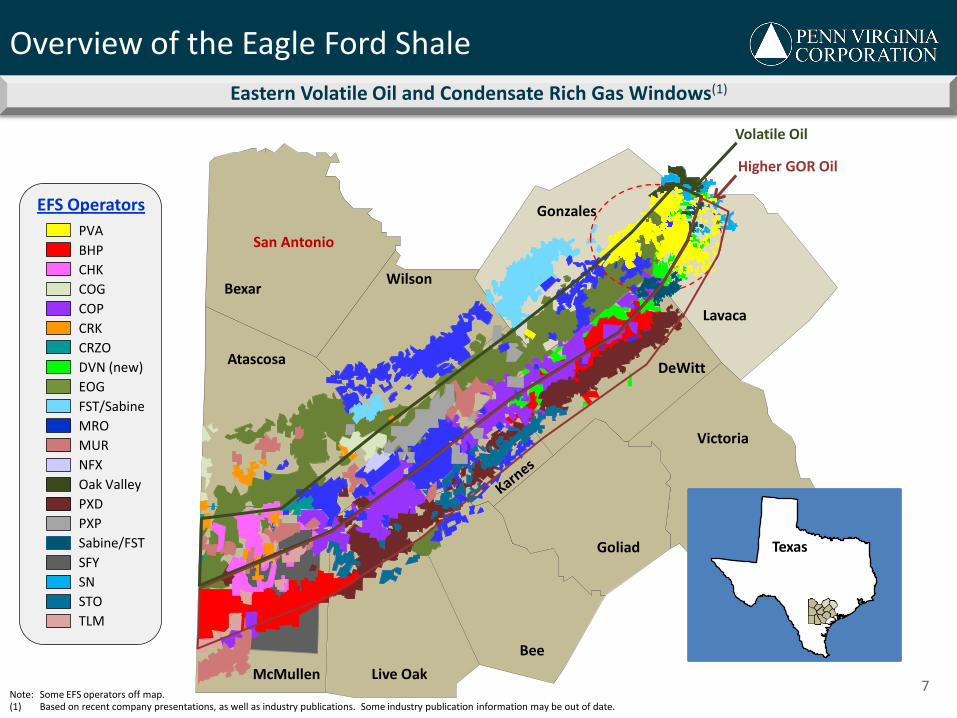
Note: Some EFS operators off map. (1) Based on recent company presentations, as well as industry publications. Some industry publication information may be out of date.
Eastern Volatile Oil and Condensate Rich Gas Windows(1)
7
Overview of the Eagle Ford Shale
Victoria
Goliad
Bee
Live Oak McMullen
Wilson
Atascosa
Bexar
San Antonio
Texas
Volatile Oil
Higher GOR Oil
Gonzales
Lavaca
DeWitt
PVA
BHP
CHK
COG
COP
CRK
CRZO
DVN (new)
EOG
FST/Sabine
MRO
MUR
NFX
Oak Valley
PXD
PXP
Sabine/FST
SFY
SN
STO
TLM
EFS Operators
8
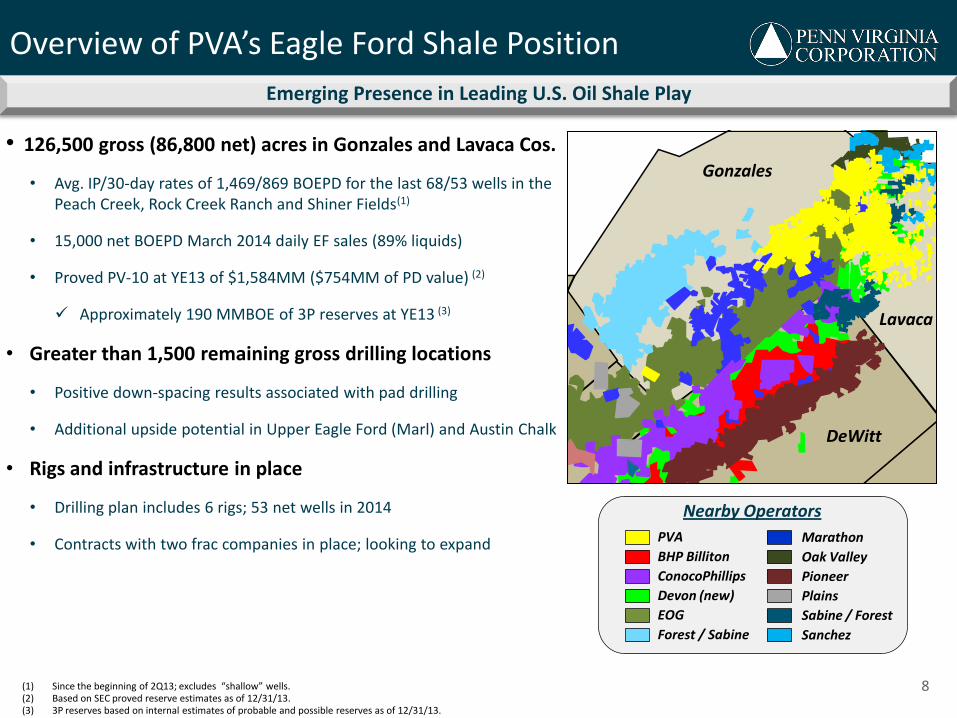
Overview of PVA’s Eagle Ford Shale Position
Emerging Presence in Leading U.S. Oil Shale Play
• 126,500 gross (86,800 net) acres in Gonzales and Lavaca Cos.
• Avg. IP/30-day rates of 1,469/869 BOEPD for the last 68/53 wells in the Peach Creek, Rock Creek Ranch and Shiner Fields(1)
• 15,000 net BOEPD March 2014 daily EF sales (89% liquids)
• Proved PV-10 at YE13 of $1,584MM ($754MM of PD value) (2)
Approximately 190 MMBOE of 3P reserves at YE13 (3)
• Greater than 1,500 remaining gross drilling locations
• Positive down-spacing results associated with pad drilling
• Additional upside potential in Upper Eagle Ford (Marl) and Austin Chalk
• Rigs and infrastructure in place
• Drilling plan includes 6 rigs; 53 net wells in 2014
• Contracts with two frac companies in place; looking to expand
(1) Since the beginning of 2Q13; excludes “shallow” wells. (2) Based on SEC proved reserve estimates as of 12/31/13. (3) 3P reserves based on internal estimates of probable and possible reserves as of 12/31/13.
PVA
BHP Billiton
ConocoPhillips
Devon (new)
EOG
Forest / Sabine
Nearby Operators
Marathon
Oak Valley
Pioneer
Plains
Sabine / Forest
Sanchez
Gonzales
Lavaca
DeWitt
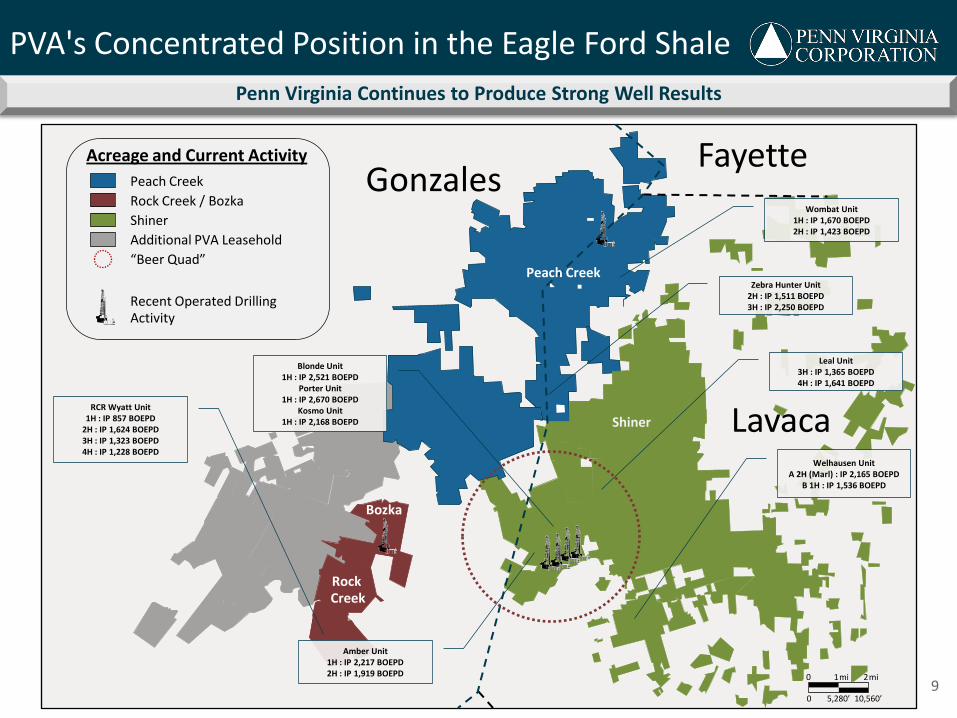
PVA's Concentrated Position in the Eagle Ford Shale
Fayette
Lavaca
Gonzales
0 1 2 mi mi
0 5,280’ 10,560’
Peach Creek
Rock Creek / Bozka
Shiner
Additional PVA Leasehold
“Beer Quad”
Recent Operated Drilling Activity
Shiner
Rock Creek
9
Peach Creek
Wombat Unit 1H : IP 1,670 BOEPD 2H : IP 1,423 BOEPD
Leal Unit 3H : IP 1,365 BOEPD 4H : IP 1,641 BOEPD
Welhausen Unit A 2H (Marl) : IP 2,165 BOEPD
B 1H : IP 1,536 BOEPD
Zebra Hunter Unit 2H : IP 1,511 BOEPD 3H : IP 2,250 BOEPD
RCR Wyatt Unit 1H : IP 857 BOEPD
2H : IP 1,624 BOEPD 3H : IP 1,323 BOEPD 4H : IP 1,228 BOEPD
Amber Unit 1H : IP 2,217 BOEPD 2H : IP 1,919 BOEPD
Penn Virginia Continues to Produce Strong Well Results
Acreage and Current Activity
Bozka
Blonde Unit 1H : IP 2,521 BOEPD
Porter Unit 1H : IP 2,670 BOEPD
Kosmo Unit 1H : IP 2,168 BOEPD
10
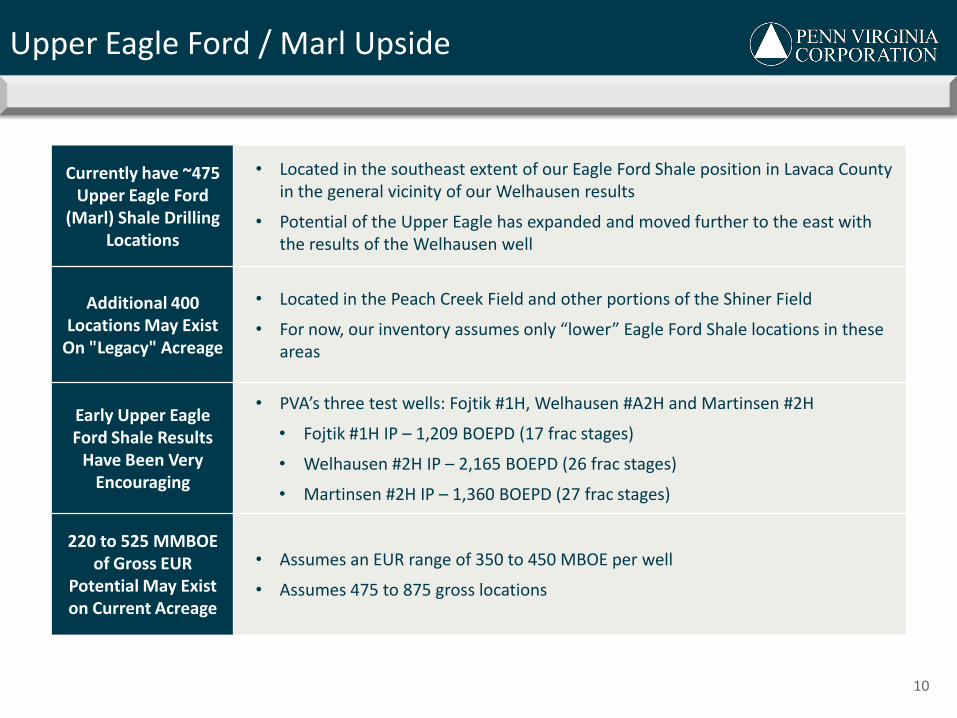
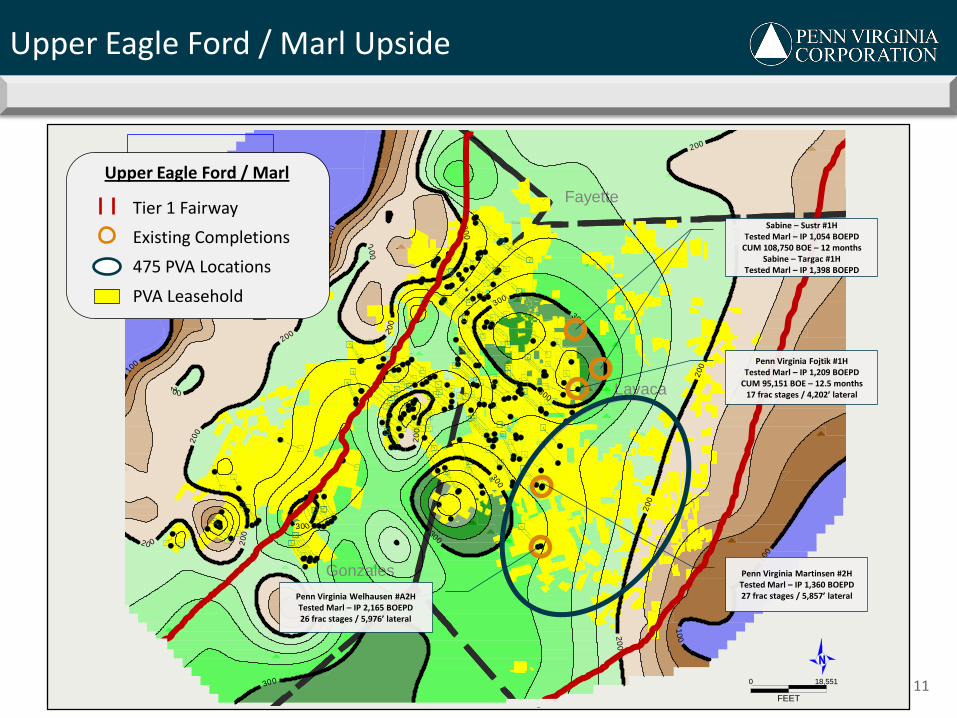
Currently have ~475 Upper Eagle Ford
(Marl) Shale Drilling Locations
• Located in the southeast extent of our Eagle Ford Shale position in Lavaca County in the general vicinity of our Welhausen results
• Potential of the Upper Eagle has expanded and moved further to the east with the results of the Welhausen well
Additional 400 Locations May Exist
On "Legacy" Acreage
• Located in the Peach Creek Field and other portions of the Shiner Field
• For now, our inventory assumes only “lower” Eagle Ford Shale locations in these areas
Early Upper Eagle Ford Shale Results
Have Been Very Encouraging
• PVA’s three test wells: Fojtik #1H, Welhausen #A2H and Martinsen #2H
• Fojtik #1H IP – 1,209 BOEPD (17 frac stages)
• Welhausen #2H IP – 2,165 BOEPD (26 frac stages)
• Martinsen #2H IP – 1,360 BOEPD (27 frac stages)
220 to 525 MMBOE of Gross EUR
Potential May Exist on Current Acreage
• Assumes an EUR range of 350 to 450 MBOE per well
• Assumes 475 to 875 gross locations
Upper Eagle Ford / Marl Upside
Lavaca
Lavaca
Gonzales
Fayette
Lavaca
Gonzales
00
1
100
10
0
100
100
00
2
20
0
200
00
2
200
200
20 0 20
0
200
200
200
20
0
00
2
00
2
00
2
300
300
003
300
003
300
003
300
CANNONADE RANCH1
CANNONADE RANCH2
SCHRADER-THIEDE1
LAVENDER-THIEDE1
GONZO HUNTER1H
SOUTHERN HUNTER1H
GARDNER ET AL1H
GONZO NORTH1H
HAWN HOLT2H
HAWN HOLT1H
BOZKA1H
HAWN HOLT4H
HAWN HOLT6H
HAWN HOLT9H
HAWN HOLT10H
HAWN HOLT13H
HAWN HOLT7H
HAWN HOLT3H
HAWN HOLT5H
HAWN HOLT8H
HAWN HOLT12H
HAWN HOLT11H
MUNSON RANCH1H
MUNSON RANCH3H
MILLER1H
DICKSON-ALLEN1H
DICKSON-ALLEN2H
HAWN HOLT15H
GARDNER ET AL2H
CANNONADE RANCH NORTH1H
SOUTHERN HUNTER2H
SCHAEFER R L1H
SCHAEFER R L1H
GONZO NORTH2H
SCHAEFER R L3HST1
SCHAEFER R L3H
CANNONADE RANCH3H
SCHAEFER R L2H
MUNSON RANCH2H_PLT
MUNSON RANCH5H
MUNSON RANCH7H
MUNSON RANCH4H
MUNSON RANCH8H
HAWN DICKSON1H
MUNSON RANCH6H
MUNSON RANCH9H
ROCK CREEK 1H1H
ROCK CREEK2H
ROCK CREEK RANCH3H
ROCK CREEK RANCH4H
SHINER RANCH1H
FOREMAN D UNIT1H
HENNING UNIT1H
ROCK CREEK RANCH5H
ROCK CREEK RANCH6H
ROCK CREEK RANCH7H
ROCK CREEK RANCH8H
ROCK CREEK RANCH9H
ROCK CREEK RANCH10H
GEO HUNTER1H
FURRH1H
ORYX HUNTER1H
FURRH2H
SABLE HUNTER1H
KUDU HUNTER1H
SNIPE HUNTER1H
HAWG HUNTER1H
LEOPARD HUNTER1H
HIPPO HUNTER1H
KUDU HUNTER2H
LEOPARD HUNTER2H
ORYX HUNTER2H
EFFENBERGER1H
VANA UNIT1H
LEOPARD HUNTER3H
HIPPO HUNTER2H
SCHACHERL1H
MUNSON RANCH2H
SCHACHERL UNIT1H
VANA1H
SRALLA1H
MCCREARY1V
MOOSE HUNTER1H
SNIPE HUNTER2H
HENNING UNIT2H
ROCK CREEK RANCH11H
GARDNER ET AL1H
MCCREARY1H
MOOSE HUNTER2H
ELK HUNTER1H
ELK HUNTER2H
FURRH3H
ELK HUNTER3H
MOOSE HUNTER3H
PAVLICEK1H
TARGAC UNIT1H
FREYTAG1H
SMITH1H
NEUSE UNIT1H
LEAL1H
KLEIHEGE1H
TECHNIK1H
MATIAS1H
HILL1H
GARZA KODAK1H
MILLER UN 22H
MILLER UN 21H
PAVLICEK2H
PAVLICEK5H
DUBOSE2H
KLEIHEGE2H
DUBOSE UNIT 21H
CANNONADE RANCH17H
CANNONADE RANCH18H
CANNONADE RANCH19H
RCR-WYATT3H
RCR-WYATT1H
RCR-WYATT4H
JOSEPH SIMPER1H
DOUGLAS RAAB1H
HINZE1H
OTHOLD UNIT1H
MARTINSEN UNIT3H
VANA4H
VANA3H
SCHACHERL-VANA (A)1H
SCHACHERL2H
EFFENBERGER4H
EFFENBERGER-SCHACHERL (A)4H
BERGER-SIMPER2H
BERGER-SIMPER1H
TECHNIK7H
TECHNIK2H
KUSAK2H
BERTHA1H
ZEBRA HUNTER1H
RHINO HUNTER1H
ADDAX HUNTER1H
ADDAX HUNTER2H
ADDAX HUNTER3H
BARRAZA UNIT1H
KUSAK UNIT1H
ARLEDGE RANCH1H
WASHINGTON R UNIT1H
RAAB UNIT1H
BUFFALO HUNTER1H
GONZO SOUTH1H
MARTINSEN UNIT1H
FOJTIK UNIT1H
HEFE HUNTER1H
PILSNER HUNTER1H
NETARDUS UNIT1H
DUBOSE2HST1
PLATYPUS HUNTER1H
STAG HUNTER1H
GEO HUNTER1H
STAG HUNTER2H
EFFENBERGER5H
RCRS HINTON1H
RCRS HINTON3H
RCR-WYATT2H
SCHACHERL_ST12H
GONZO HUNTER2H
GONZO HUNTER3H
GONZO HUNTER4H
BONGO HUNTER1H
MOOSE HUNTER4H
BONGO NORTH1H
BONGO NORTH2H
J.BERGER UNIT1H
NETARDUS UNIT1H
FURRH1H
CANNONADE RANCH SOUTH18HST2
MILLER1H
BLONDE1H
KOSMO1H
PILSNER HUNTER2H
PILSNER HUNTER3H
PILSNER HUNTER4H
PILSNER HUNTER5H
ZEBRA HUNTER3H
RHINO HUNTER7H
RHINO HUNTER6H
AMBER2H
AMBER1H
WELHAUSEN BB1H
WELHAUSEN AA2H
RCRS HINTON2HST2
PORTER1HST2
KUSAK UNIT3HST1
LEAL3HST1
HILL2HST1
ZEBRA HUNTER2HST1
LEAL4HST1
MARTINSEN2HST1
KLEIHEGE3HST2(3)
EAGLE_FORD_REGIONAL - Eagle Ford Trend MAP
FEET
0 18,551
PETRA 5/30/2014 4:12:58 PM
Upper Eagle Ford / Marl Upside
11
Tier 1 Fairway
Existing Completions
475 PVA Locations
PVA Leasehold
Upper Eagle Ford / Marl
Penn Virginia Martinsen #2H Tested Marl – IP 1,360 BOEPD 27 frac stages / 5,857’ lateral Penn Virginia Welhausen #A2H
Tested Marl – IP 2,165 BOEPD 26 frac stages / 5,976’ lateral
Penn Virginia Fojtik #1H Tested Marl – IP 1,209 BOEPD
CUM 95,151 BOE – 12.5 months 17 frac stages / 4,202’ lateral
Sabine – Sustr #1H Tested Marl – IP 1,054 BOEPD
CUM 108,750 BOE – 12 months Sabine – Targac #1H
Tested Marl – IP 1,398 BOEPD
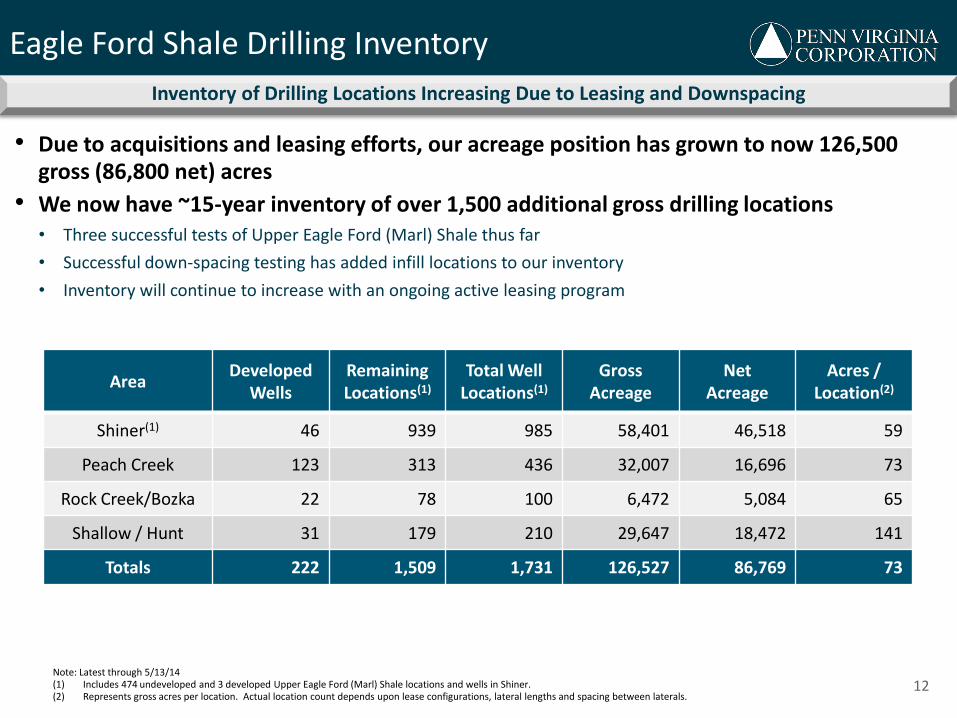
• Due to acquisitions and leasing efforts, our acreage position has grown to now 126,500 gross (86,800 net) acres
• We now have ~15-year inventory of over 1,500 additional gross drilling locations • Three successful tests of Upper Eagle Ford (Marl) Shale thus far
• Successful down-spacing testing has added infill locations to our inventory
• Inventory will continue to increase with an ongoing active leasing program
12
Area Developed
Wells Remaining Locations(1)
Total Well Locations(1)
Gross Acreage
Net Acreage
Acres / Location(2)
Shiner(1) 46 939 985 58,401 46,518 59
Peach Creek 123 313 436 32,007 16,696 73
Rock Creek/Bozka 22 78 100 6,472 5,084 65
Shallow / Hunt 31 179 210 29,647 18,472 141
Totals 222 1,509 1,731 126,527 86,769 73
Note: Latest through 5/13/14 (1) Includes 474 undeveloped and 3 developed Upper Eagle Ford (Marl) Shale locations and wells in Shiner. (2) Represents gross acres per location. Actual location count depends upon lease configurations, lateral lengths and spacing between laterals.
Eagle Ford Shale Drilling Inventory
Inventory of Drilling Locations Increasing Due to Leasing and Downspacing
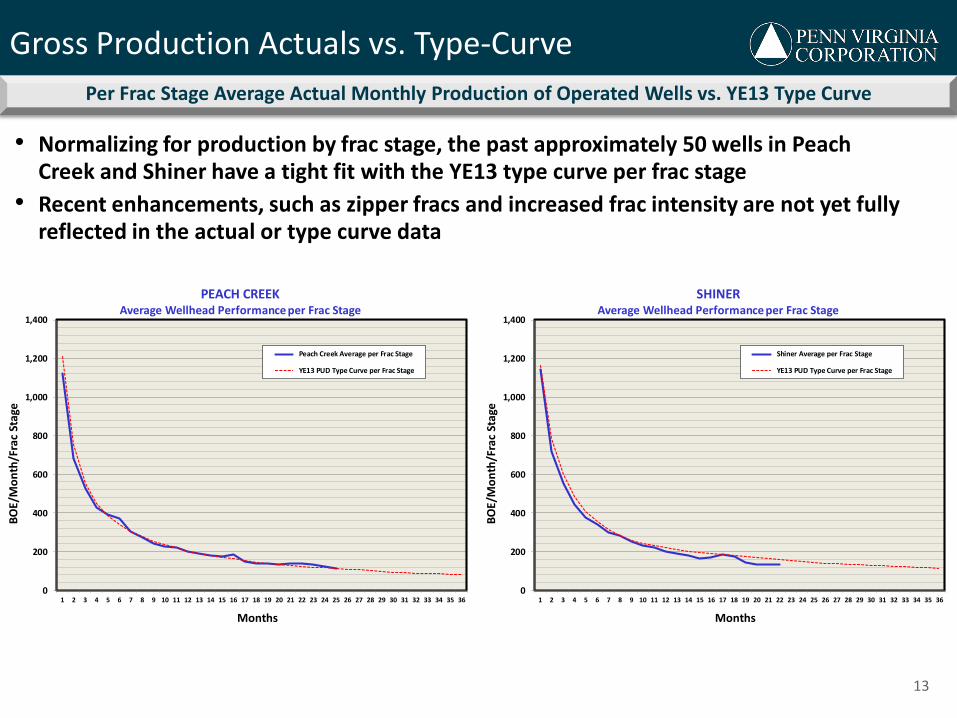
Gross Production Actuals vs. Type-Curve
Per Frac Stage Average Actual Monthly Production of Operated Wells vs. YE13 Type Curve
13
0
200
400
600
800
1,000
1,200
1,400
1 2 3 4 5 6 7 8 9 10 11 12 13 14 15 16 17 18 19 20 21 22 23 24 25 26 27 28 29 30 31 32 33 34 35 36
BO
E/M
on
th/F
rac
Stag
e
Months
PEACH CREEKAverage Wellhead Performance per Frac Stage
Peach Creek Average per Frac Stage
YE13 PUD Type Curve per Frac Stage
0
200
400
600
800
1,000
1,200
1,400
1 2 3 4 5 6 7 8 9 10 11 12 13 14 15 16 17 18 19 20 21 22 23 24 25 26 27 28 29 30 31 32 33 34 35 36
BO
E/M
on
th/F
rac
Stag
e
Months
SHINERAverage Wellhead Performance per Frac Stage
Shiner Average per Frac Stage
YE13 PUD Type Curve per Frac Stage
• Normalizing for production by frac stage, the past approximately 50 wells in Peach Creek and Shiner have a tight fit with the YE13 type curve per frac stage
• Recent enhancements, such as zipper fracs and increased frac intensity are not yet fully reflected in the actual or type curve data
Notes: (1) Based on YE13 type curve per outside reservoir engineering firm. Terminal declines of 12% in both Peach Creek and Shiner begin at 7.8 years and are higher than internal terminal decline estimates. (2) Gross EUR assumes 13.1 MBOE of EUR per frac stage in Peach Creek (11.3 thousand barrels of oil (MBO), 1.0 MBO of NGLs and 133 Mcf of gas) and 17.9 BOE per frac stage in Shiner (11.5 MBO, 3.4 MBO of NGLs and 489 Mcf of gas). (3) Assumes a flat $80 or $100 per barrel WTI oil price. (4) Capital cost plus before tax PV-10 divided by capital cost.
0
10
20
30
40
50
60
70
80
90
100
40 50 60 70 80 90 100 110 120
Rat
e o
f R
etu
rn B
FIT
-%
WTI Oil Price (Flat) - $/Bbl
SHINER FIELDPre-Tax Rate of Return Sensitivities; Assumes $9.2MM D&C Cost
$9.2MM EUR: 484 MBOE
$4.00/MMBtu HH Gas Price (Flat)
0
10
20
30
40
50
60
70
80
90
100
40 50 60 70 80 90 100 110 120
Rat
e o
f R
etu
rn B
FIT
-%
WTI Oil Price (Flat) - $/Bbl
PEACH CREEK FIELDPre-Tax Rate of Return Sensitivities; Assumes $8.4MM D&C Cost
$8.4MM EUR: 367 MBOE
$4.00/MMBtu HH Gas Price (Flat)
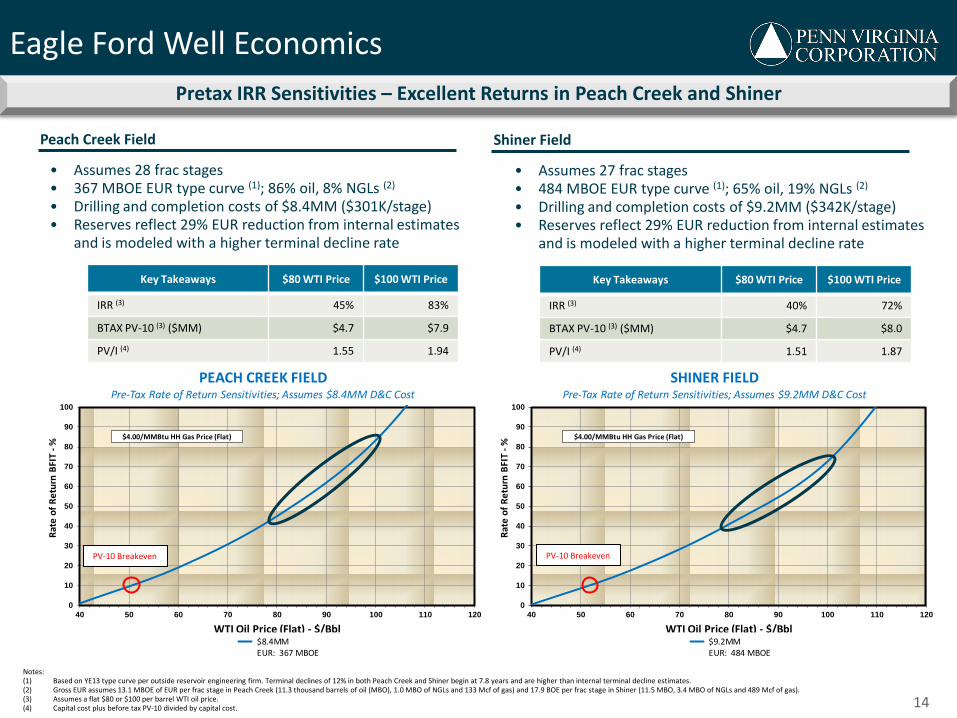
Eagle Ford Well Economics
Pretax IRR Sensitivities – Excellent Returns in Peach Creek and Shiner
14
Peach Creek Field
• Assumes 28 frac stages • 367 MBOE EUR type curve (1); 86% oil, 8% NGLs (2)
• Drilling and completion costs of $8.4MM ($301K/stage) • Reserves reflect 29% EUR reduction from internal estimates
and is modeled with a higher terminal decline rate
Shiner Field
• Assumes 27 frac stages • 484 MBOE EUR type curve (1); 65% oil, 19% NGLs (2)
• Drilling and completion costs of $9.2MM ($342K/stage) • Reserves reflect 29% EUR reduction from internal estimates
and is modeled with a higher terminal decline rate
Key Takeaways $80 WTI Price $100 WTI Price
IRR (3) 40% 72%
BTAX PV-10 (3) ($MM) $4.7 $8.0
PV/I (4) 1.51 1.87
Key Takeaways $80 WTI Price $100 WTI Price
IRR (3) 45% 83%
BTAX PV-10 (3) ($MM) $4.7 $7.9
PV/I (4) 1.55 1.94
PV-10 Breakeven PV-10 Breakeven
15
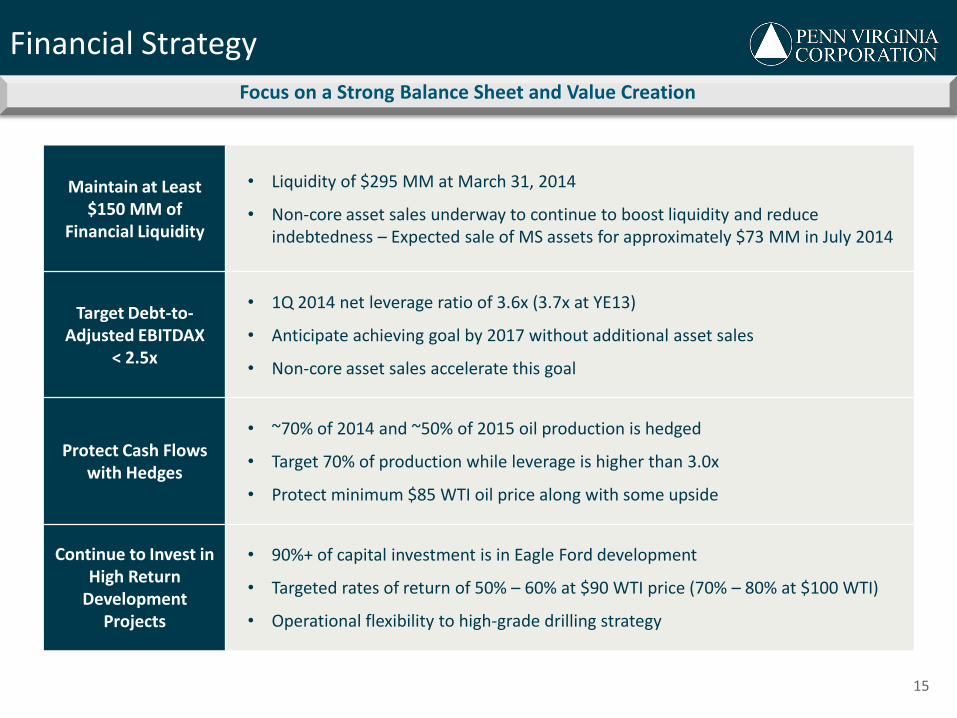
Maintain at Least $150 MM of
Financial Liquidity
• Liquidity of $295 MM at March 31, 2014
• Non-core asset sales underway to continue to boost liquidity and reduce indebtedness – Expected sale of MS assets for approximately $73 MM in July 2014
Target Debt-to-Adjusted EBITDAX
< 2.5x
• 1Q 2014 net leverage ratio of 3.6x (3.7x at YE13)
• Anticipate achieving goal by 2017 without additional asset sales
• Non-core asset sales accelerate this goal
Protect Cash Flows with Hedges
• ~70% of 2014 and ~50% of 2015 oil production is hedged
• Target 70% of production while leverage is higher than 3.0x
• Protect minimum $85 WTI oil price along with some upside
Continue to Invest in High Return
Development Projects
• 90%+ of capital investment is in Eagle Ford development
• Targeted rates of return of 50% – 60% at $90 WTI price (70% – 80% at $100 WTI)
• Operational flexibility to high-grade drilling strategy
Financial Strategy
Focus on a Strong Balance Sheet and Value Creation
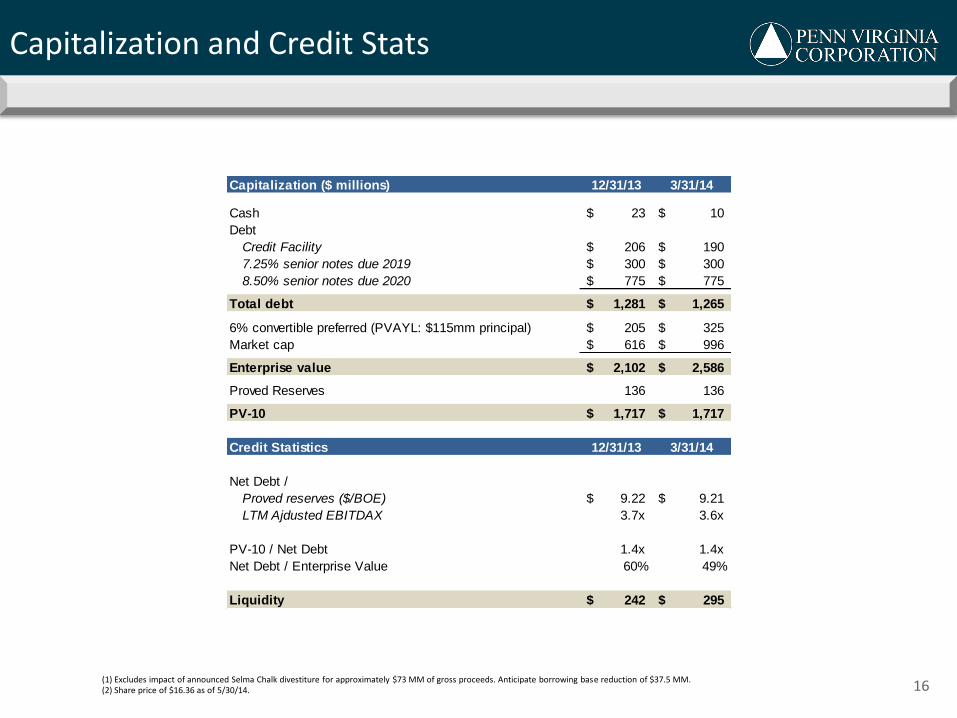
Capitalization and Credit Stats
16 (1) Excludes impact of announced Selma Chalk divestiture for approximately $73 MM of gross proceeds. Anticipate borrowing base reduction of $37.5 MM. (2) Share price of $16.36 as of 5/30/14.
Capitalization ($ millions) 12/31/13 3/31/14
Cash 23$ 10$
Debt
Credit Facility 206$ 190$
7.25% senior notes due 2019 300$ 300$
8.50% senior notes due 2020 775$ 775$
Total debt 1,281$ 1,265$
6% convertible preferred (PVAYL: $115mm principal) 205$ 325$
Market cap 616$ 996$
Enterprise value 2,102$ 2,586$
Proved Reserves 136 136
PV-10 1,717$ 1,717$
Credit Statistics 12/31/13 3/31/14
Net Debt /
Proved reserves ($/BOE) 9.22$ 9.21$
LTM Ajdusted EBITDAX 3.7x 3.6x
PV-10 / Net Debt 1.4x 1.4x
Net Debt / Enterprise Value 60% 49%
Liquidity 242$ 295$
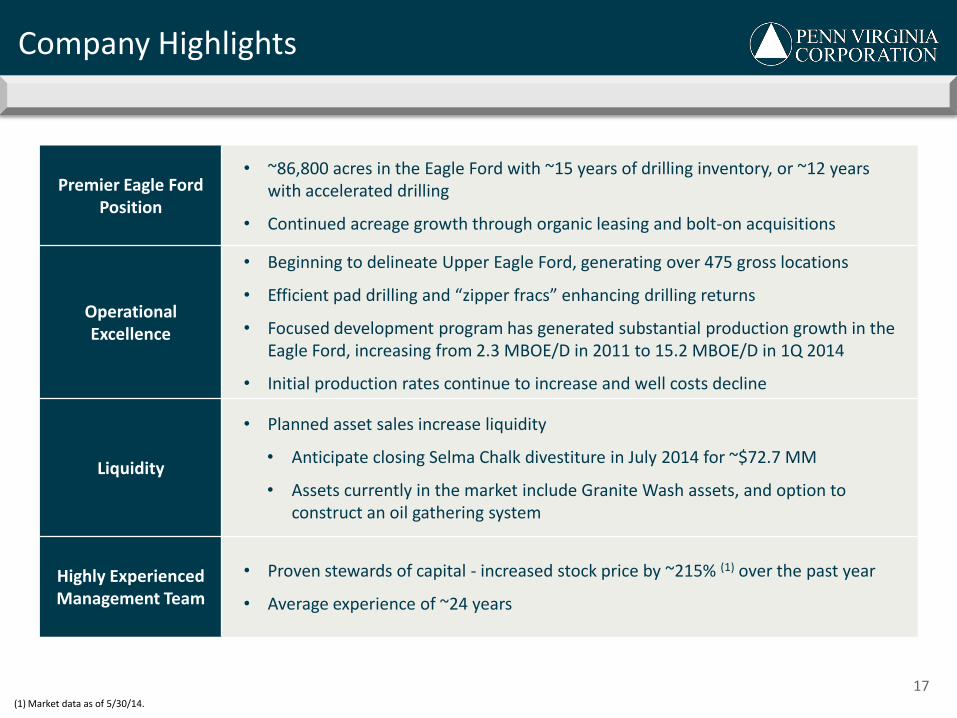
Company Highlights
17
Premier Eagle Ford Position
• ~86,800 acres in the Eagle Ford with ~15 years of drilling inventory, or ~12 years with accelerated drilling
• Continued acreage growth through organic leasing and bolt-on acquisitions
Operational Excellence
• Beginning to delineate Upper Eagle Ford, generating over 475 gross locations
• Efficient pad drilling and “zipper fracs” enhancing drilling returns
• Focused development program has generated substantial production growth in the Eagle Ford, increasing from 2.3 MBOE/D in 2011 to 15.2 MBOE/D in 1Q 2014
• Initial production rates continue to increase and well costs decline
Liquidity
• Planned asset sales increase liquidity
• Anticipate closing Selma Chalk divestiture in July 2014 for ~$72.7 MM
• Assets currently in the market include Granite Wash assets, and option to construct an oil gathering system
Highly Experienced Management Team
• Proven stewards of capital - increased stock price by ~215% (1) over the past year
• Average experience of ~24 years
(1) Market data as of 5/30/14.
18
Appendix
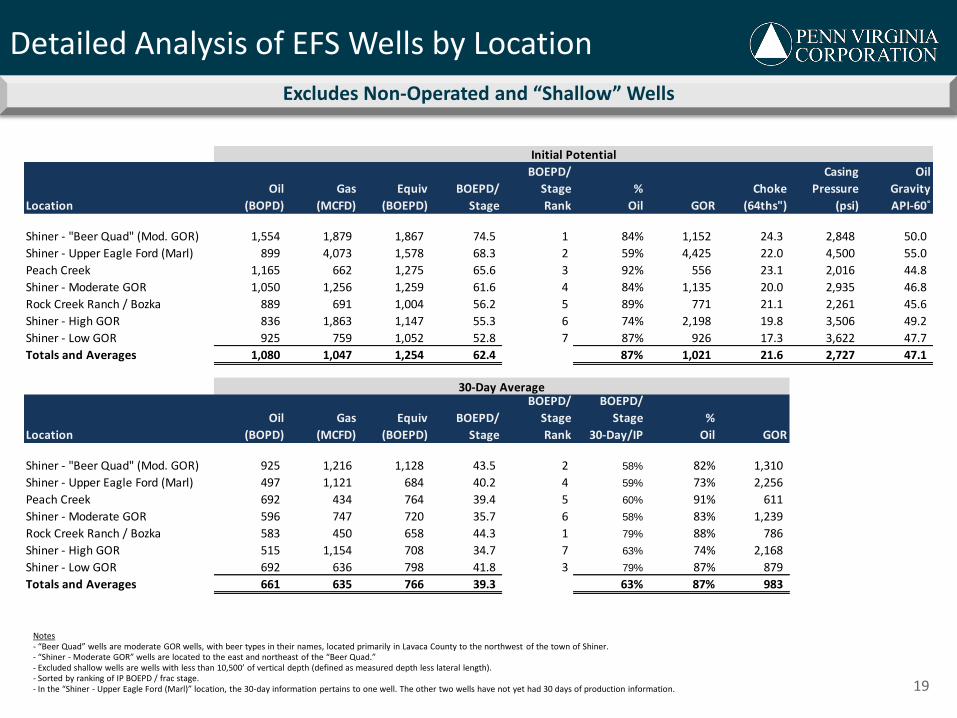
Casing Oil
Oil Gas Equiv % Choke Pressure Gravity
Location (BOPD) (MCFD) (BOEPD) Rank Oil GOR (64ths") (psi) API‐60˚
Shiner - "Beer Quad" (Mod. GOR) 1,554 1,879 1,867 74.5 1 84% 1,152 24.3 2,848 50.0
Shiner - Upper Eagle Ford (Marl) 899 4,073 1,578 68.3 2 59% 4,425 22.0 4,500 55.0
Peach Creek 1,165 662 1,275 65.6 3 92% 556 23.1 2,016 44.8
Shiner - Moderate GOR 1,050 1,256 1,259 61.6 4 84% 1,135 20.0 2,935 46.8
Rock Creek Ranch / Bozka 889 691 1,004 56.2 5 89% 771 21.1 2,261 45.6
Shiner - High GOR 836 1,863 1,147 55.3 6 74% 2,198 19.8 3,506 49.2
Shiner - Low GOR 925 759 1,052 52.8 7 87% 926 17.3 3,622 47.7
Totals and Averages 1,080 1,047 1,254 62.4 87% 1,021 21.6 2,727 47.1
Oil Gas Equiv %
Location (BOPD) (MCFD) (BOEPD) Rank 30-Day/IP Oil GOR
Shiner - "Beer Quad" (Mod. GOR) 925 1,216 1,128 43.5 2 58% 82% 1,310
Shiner - Upper Eagle Ford (Marl) 497 1,121 684 40.2 4 59% 73% 2,256
Peach Creek 692 434 764 39.4 5 60% 91% 611
Shiner - Moderate GOR 596 747 720 35.7 6 58% 83% 1,239
Rock Creek Ranch / Bozka 583 450 658 44.3 1 79% 88% 786
Shiner - High GOR 515 1,154 708 34.7 7 63% 74% 2,168
Shiner - Low GOR 692 636 798 41.8 3 79% 87% 879
Totals and Averages 661 635 766 39.3 63% 87% 983
BOEPD/
Stage
Initial Potential
BOEPD/
Stage
30-Day Average
BOEPD/
Stage
BOEPD/
Stage
BOEPD/
Stage
Detailed Analysis of EFS Wells by Location
19
Excludes Non-Operated and “Shallow” Wells
Notes - “Beer Quad” wells are moderate GOR wells, with beer types in their names, located primarily in Lavaca County to the northwest of the town of Shiner. - “Shiner - Moderate GOR” wells are located to the east and northeast of the “Beer Quad.” - Excluded shallow wells are wells with less than 10,500’ of vertical depth (defined as measured depth less lateral length). - Sorted by ranking of IP BOEPD / frac stage. - In the “Shiner - Upper Eagle Ford (Marl)” location, the 30-day information pertains to one well. The other two wells have not yet had 30 days of production information.
Detailed Analysis of EFS Wells by Location
20
Excludes Non-Operated and “Shallow” Wells
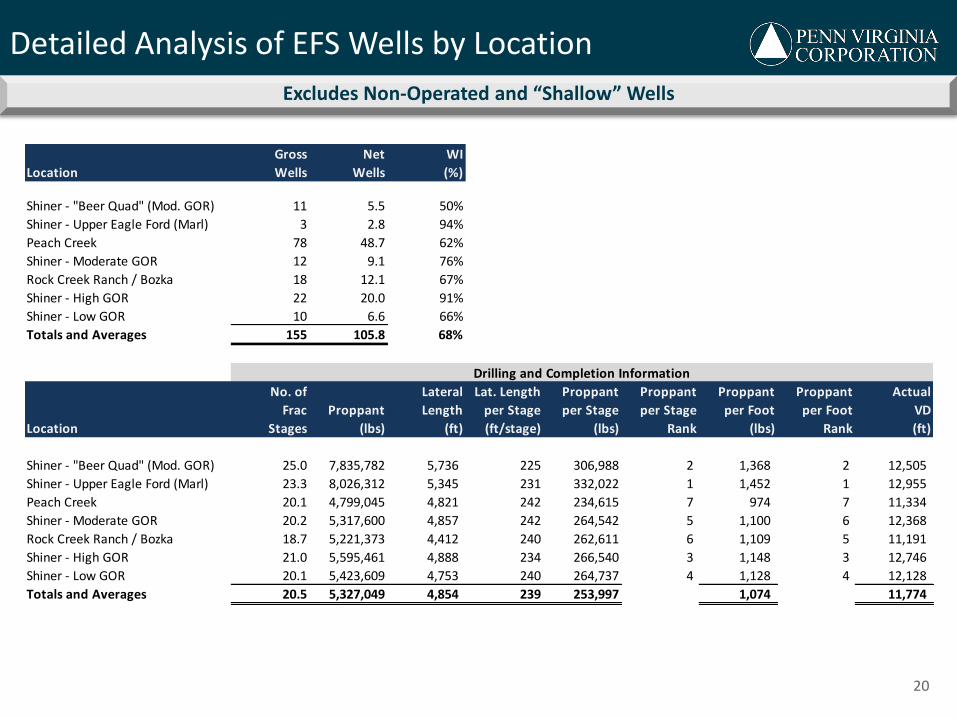
Gross Net WI
Location Wells Wells (%)
Shiner - "Beer Quad" (Mod. GOR) 11 5.5 50%
Shiner - Upper Eagle Ford (Marl) 3 2.8 94%
Peach Creek 78 48.7 62%
Shiner - Moderate GOR 12 9.1 76%
Rock Creek Ranch / Bozka 18 12.1 67%
Shiner - High GOR 22 20.0 91%
Shiner - Low GOR 10 6.6 66%
Totals and Averages 155 105.8 68%
No. of Lateral Lat. Length Actual
Frac Proppant Length per Stage VD
Location Stages (lbs) (ft) (ft/stage) (lbs) Rank (lbs) Rank (ft)
Shiner - "Beer Quad" (Mod. GOR) 25.0 7,835,782 5,736 225 306,988 2 1,368 2 12,505
Shiner - Upper Eagle Ford (Marl) 23.3 8,026,312 5,345 231 332,022 1 1,452 1 12,955
Peach Creek 20.1 4,799,045 4,821 242 234,615 7 974 7 11,334
Shiner - Moderate GOR 20.2 5,317,600 4,857 242 264,542 5 1,100 6 12,368
Rock Creek Ranch / Bozka 18.7 5,221,373 4,412 240 262,611 6 1,109 5 11,191
Shiner - High GOR 21.0 5,595,461 4,888 234 266,540 3 1,148 3 12,746
Shiner - Low GOR 20.1 5,423,609 4,753 240 264,737 4 1,128 4 12,128
Totals and Averages 20.5 5,327,049 4,854 239 253,997 1,074 11,774
Proppant
per Foot
Proppant
per Stage
Proppant
per Stage
Drilling and Completion Information
Proppant
per Foot

0
15
30
45
60
75
90
105
120
135
150
40 50 60 70 80 90 100 110 120
Rat
e o
f R
etu
rn B
FIT
-%
WTI Oil Price (Flat) - $/Bbl
SHINER FIELDPre-Tax Rate of Return Sensitivities; Assumes $9.2MM D&C Cost
$9.2MM EUR: 680 MBOE
$4.00/MMBtu HH Gas Price (Flat)
0
15
30
45
60
75
90
105
120
135
150
40 50 60 70 80 90 100 110 120
Rat
e o
f R
etu
rn B
FIT
-%
WTI Oil Price (Flat) - $/Bbl
PEACH CREEK FIELDPre-Tax Rate of Return Sensitivities; Assumes $8.4MM D&C Cost
$8.4MM EUR: 520 MBOE
$4.00/MMBtu HH Gas Price (Flat)$4.00/MMBtu HH Gas Price (Flat)
21
Internal Well Economics
Notes: (1) Based on latest internal type curve. Terminal declines of 5% in both Peach Creek and Shiner, as opposed to 12% terminal decline per outside reservoir engineering report. Internal type curves represent management's best estimates of type curves and may differ from those of our third-party reserve engineers. Financial reporting reserves are based on the type curves of our third-party reserve engineers. Both the internal type curves and those of our third-party reserve engineers are estimates based on limited data. There can be no assurance that actual production will conform with either set of type curves. (2) Gross EUR assumes 18.5 MBOE of EUR per frac stage in Peach Creek (15.9 MBO of oil, 1.4 MBO of NGLs and 188 Mcf of gas) and 25.2 BOE per frac stage in Shiner (16.2 MBO, 4.8 MBO of NGLs and 687 Mcf of gas). (3) Assumes a flat $80 or $100 per barrel WTI oil price. (4) Capital cost plus before tax PV-10 divided by capital cost.
Pretax IRR Sensitivities – Superior Returns in Peach Creek and Shiner
Peach Creek Field
• Assumes 28 frac stages • 520 MBOE EUR type curve (1); 86% oil, 8% NGLs (2)
• Drilling and completion costs of $8.4MM ($301K/stage) • Internal reserves 40% higher than YE13 third-party reserves
Shiner Field
• Assumes 27 frac stages • 680 MBOE EUR type curve (1); 65% oil, 19% NGLs (2)
• Drilling and completion costs of $9.2MM ($342K/stage) • Internal reserves 40% higher than YE13 third-party reserves
Key Takeaways $80 WTI Price $100 WTI Price
IRR (3) 61% 118%
BTAX PV-10 (3) ($MM) $7.7 $11.7
PV/I (4) 1.83 2.27
Key Takeaways $80 WTI Price $100 WTI Price
IRR (3) 69% 136%
BTAX PV-10 (3) ($MM) $7.5 $11.4
PV/I (4) 1.88 2.35
PV-10 Breakeven PV-10 Breakeven
Full-Year 2014 Guidance Table
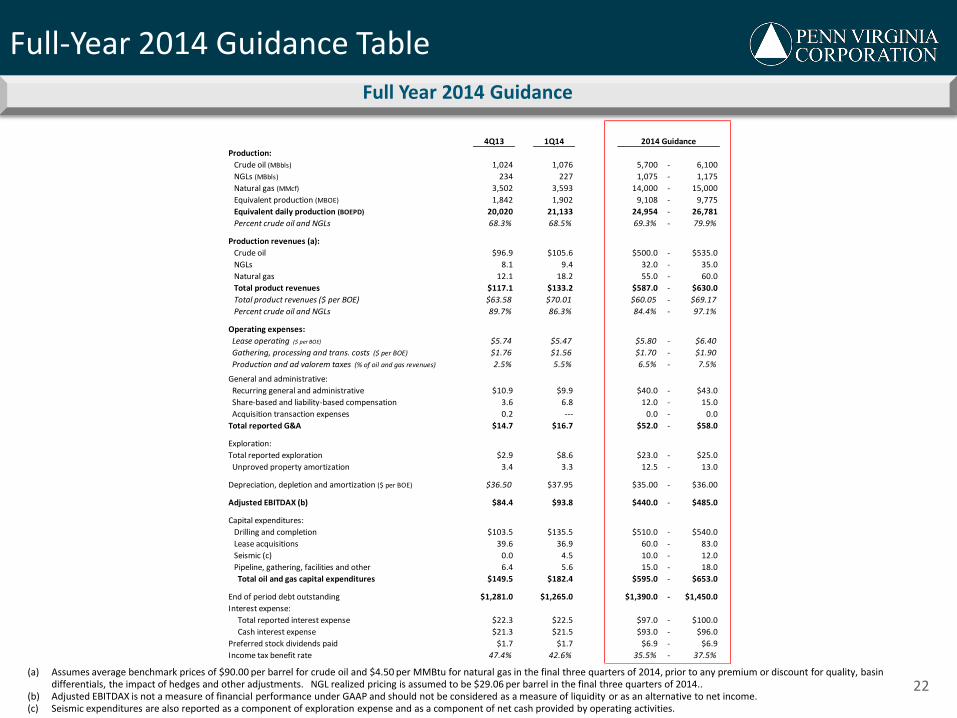
22 (a) Assumes average benchmark prices of $90.00 per barrel for crude oil and $4.50 per MMBtu for natural gas in the final three quarters of 2014, prior to any premium or discount for quality, basin
differentials, the impact of hedges and other adjustments. NGL realized pricing is assumed to be $29.06 per barrel in the final three quarters of 2014.. (b) Adjusted EBITDAX is not a measure of financial performance under GAAP and should not be considered as a measure of liquidity or as an alternative to net income. (c) Seismic expenditures are also reported as a component of exploration expense and as a component of net cash provided by operating activities.
Full Year 2014 Guidance
4Q13 1Q14
Production:
Crude oil (MBbls) 1,024 1,076 5,700 - 6,100
NGLs (MBbls) 234 227 1,075 - 1,175
Natural gas (MMcf) 3,502 3,593 14,000 - 15,000
Equivalent production (MBOE) 1,842 1,902 9,108 - 9,775
Equivalent daily production (BOEPD) 20,020 21,133 24,954 - 26,781
Percent crude oil and NGLs 68.3% 68.5% 69.3% - 79.9%
Production revenues (a):
Crude oil $96.9 $105.6 $500.0 - $535.0
NGLs 8.1 9.4 32.0 - 35.0
Natural gas 12.1 18.2 55.0 - 60.0
Total product revenues $117.1 $133.2 $587.0 - $630.0
Total product revenues ($ per BOE) $63.58 $70.01 $60.05 - $69.17
Percent crude oil and NGLs 89.7% 86.3% 84.4% - 97.1%
Operating expenses:
Lease operating ($ per BOE) $5.74 $5.47 $5.80 - $6.40
Gathering, processing and trans. costs ($ per BOE) $1.76 $1.56 $1.70 - $1.90
Production and ad valorem taxes (% of oil and gas revenues) 2.5% 5.5% 6.5% - 7.5%
General and administrative:
Recurring general and administrative $10.9 $9.9 $40.0 - $43.0
Share-based and liability-based compensation 3.6 6.8 12.0 - 15.0
Acquisition transaction expenses 0.2 --- 0.0 - 0.0
Total reported G&A $14.7 $16.7 $52.0 - $58.0
Exploration:
Total reported exploration $2.9 $8.6 $23.0 - $25.0
Unproved property amortization 3.4 3.3 12.5 - 13.0
Depreciation, depletion and amortization ($ per BOE) $36.50 $37.95 $35.00 - $36.00
Adjusted EBITDAX (b) $84.4 $93.8 $440.0 - $485.0
Capital expenditures:
Drilling and completion $103.5 $135.5 $510.0 - $540.0
Lease acquisitions 39.6 36.9 60.0 - 83.0
Seismic (c) 0.0 4.5 10.0 - 12.0
Pipeline, gathering, facilities and other 6.4 5.6 15.0 - 18.0
Total oil and gas capital expenditures $149.5 $182.4 $595.0 - $653.0
End of period debt outstanding $1,281.0 $1,265.0 $1,390.0 - $1,450.0
Interest expense:
Total reported interest expense $22.3 $22.5 $97.0 - $100.0
Cash interest expense $21.3 $21.5 $93.0 - $96.0
Preferred stock dividends paid $1.7 $1.7 $6.9 - $6.9
Income tax benefit rate 47.4% 42.6% 35.5% - 37.5%
2014 Guidance
$4.10 $4.10
$4.50 $4.50
$0.00
$1.50
$3.00
$4.50
$6.00
0
5
10
15
20
2Q14 3Q14 4Q14 1Q15
MM
Btu
pe
r D
ay (
00
0s)
We
ighte
d A
vg. Floo
rs and
Swap
s ($/M
MB
tu)
Weighted Swap Price by Quarter
$93.54 $92.67 $92.92 $90.11 $90.11 $89.19 $89.19
$95.24 $93.39 $93.58 $92.50 $92.50 $91.88 $91.88
$30
$40
$50
$60
$70
$80
$90
$100
$110
0
2,000
4,000
6,000
8,000
10,000
12,000
14,000
16,000
2Q14 3Q14 4Q14 1Q15 2Q15 3Q15 4Q15
Bar
rels
pe
r D
ay
We
ighte
d A
vg. Floo
rs and
Swap
s ($/B
bl.)
Weighted Average Floor /Swap Price by Quarter
Weighted Average Ceiling /Swap Price by Quarter
Crude Oil Hedges (Swaps and Collars)(1) Natural Gas Hedges (Swaps and Collars)(1)
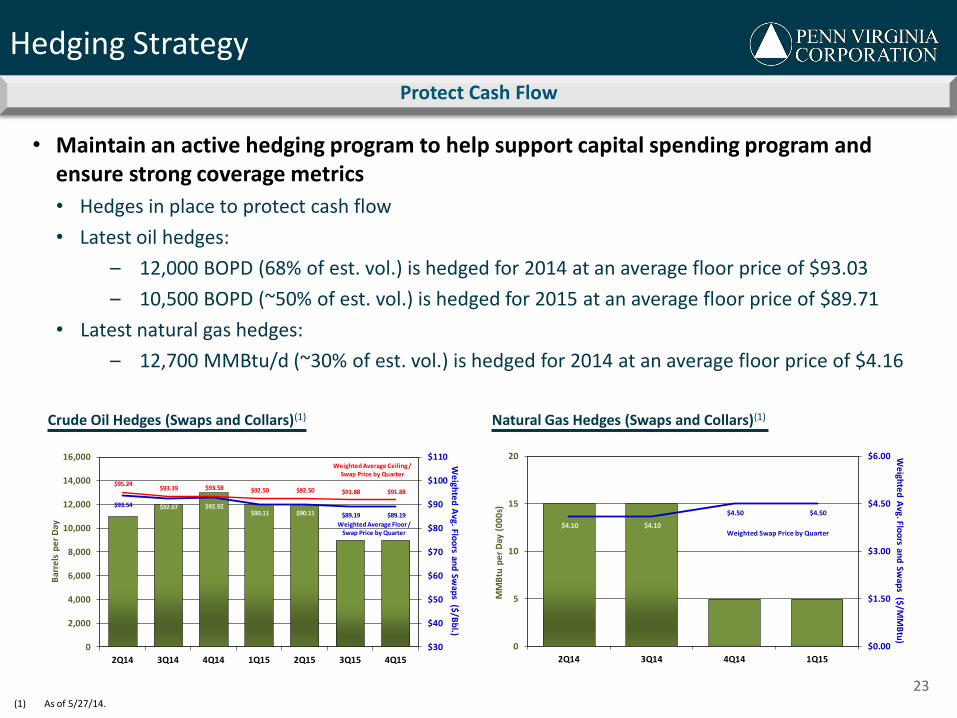
• Maintain an active hedging program to help support capital spending program and ensure strong coverage metrics
• Hedges in place to protect cash flow
• Latest oil hedges:
– 12,000 BOPD (68% of est. vol.) is hedged for 2014 at an average floor price of $93.03
– 10,500 BOPD (~50% of est. vol.) is hedged for 2015 at an average floor price of $89.71
• Latest natural gas hedges:
– 12,700 MMBtu/d (~30% of est. vol.) is hedged for 2014 at an average floor price of $4.16
23
(1) As of 5/27/14.
Protect Cash Flow
Hedging Strategy
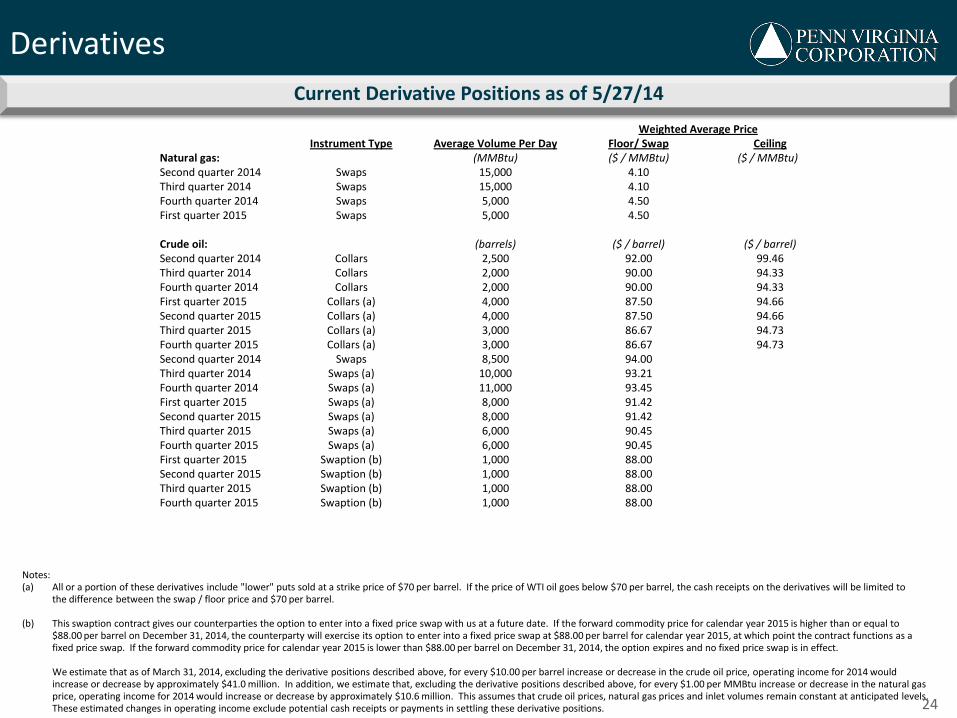
Current Derivative Positions as of 5/27/14
Notes: (a) All or a portion of these derivatives include "lower" puts sold at a strike price of $70 per barrel. If the price of WTI oil goes below $70 per barrel, the cash receipts on the derivatives will be limited to the difference between the swap / floor price and $70 per barrel. (b) This swaption contract gives our counterparties the option to enter into a fixed price swap with us at a future date. If the forward commodity price for calendar year 2015 is higher than or equal to $88.00 per barrel on December 31, 2014, the counterparty will exercise its option to enter into a fixed price swap at $88.00 per barrel for calendar year 2015, at which point the contract functions as a fixed price swap. If the forward commodity price for calendar year 2015 is lower than $88.00 per barrel on December 31, 2014, the option expires and no fixed price swap is in effect. We estimate that as of March 31, 2014, excluding the derivative positions described above, for every $10.00 per barrel increase or decrease in the crude oil price, operating income for 2014 would increase or decrease by approximately $41.0 million. In addition, we estimate that, excluding the derivative positions described above, for every $1.00 per MMBtu increase or decrease in the natural gas price, operating income for 2014 would increase or decrease by approximately $10.6 million. This assumes that crude oil prices, natural gas prices and inlet volumes remain constant at anticipated levels. These estimated changes in operating income exclude potential cash receipts or payments in settling these derivative positions. 24
Derivatives
Weighted Average Price Instrument Type Average Volume Per Day Floor/ Swap Ceiling Natural gas: (MMBtu) ($ / MMBtu) ($ / MMBtu) Second quarter 2014 Swaps 15,000 4.10 Third quarter 2014 Swaps 15,000 4.10 Fourth quarter 2014 Swaps 5,000 4.50 First quarter 2015 Swaps 5,000 4.50 Crude oil: (barrels) ($ / barrel) ($ / barrel) Second quarter 2014 Collars 2,500 92.00 99.46 Third quarter 2014 Collars 2,000 90.00 94.33 Fourth quarter 2014 Collars 2,000 90.00 94.33 First quarter 2015 Collars (a) 4,000 87.50 94.66 Second quarter 2015 Collars (a) 4,000 87.50 94.66 Third quarter 2015 Collars (a) 3,000 86.67 94.73 Fourth quarter 2015 Collars (a) 3,000 86.67 94.73 Second quarter 2014 Swaps 8,500 94.00 Third quarter 2014 Swaps (a) 10,000 93.21 Fourth quarter 2014 Swaps (a) 11,000 93.45 First quarter 2015 Swaps (a) 8,000 91.42 Second quarter 2015 Swaps (a) 8,000 91.42 Third quarter 2015 Swaps (a) 6,000 90.45 Fourth quarter 2015 Swaps (a) 6,000 90.45 First quarter 2015 Swaption (b) 1,000 88.00 Second quarter 2015 Swaption (b) 1,000 88.00 Third quarter 2015 Swaption (b) 1,000 88.00 Fourth quarter 2015 Swaption (b) 1,000 88.00
Non-GAAP Reconciliation
25
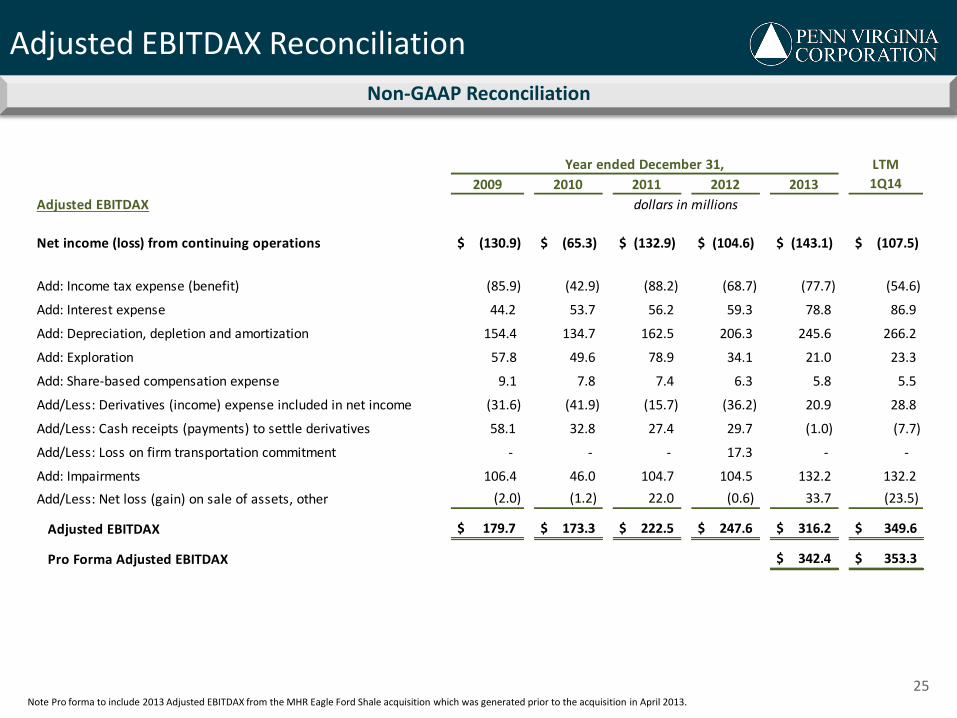
Adjusted EBITDAX Reconciliation
Note Pro forma to include 2013 Adjusted EBITDAX from the MHR Eagle Ford Shale acquisition which was generated prior to the acquisition in April 2013.
2009 2010 2011 2012 2013
Adjusted EBITDAX
Net income (loss) from continuing operations $ (130.9) $ (65.3) $ (132.9) $ (104.6) $ (143.1) $ (107.5)
Add: Income tax expense (benefit) (85.9) (42.9) (88.2) (68.7) (77.7) (54.6)
Add: Interest expense 44.2 53.7 56.2 59.3 78.8 86.9
Add: Depreciation, depletion and amortization 154.4 134.7 162.5 206.3 245.6 266.2
Add: Exploration 57.8 49.6 78.9 34.1 21.0 23.3
Add: Share-based compensation expense 9.1 7.8 7.4 6.3 5.8 5.5
Add/Less: Derivatives (income) expense included in net income (31.6) (41.9) (15.7) (36.2) 20.9 28.8
Add/Less: Cash receipts (payments) to settle derivatives 58.1 32.8 27.4 29.7 (1.0) (7.7)
Add/Less: Loss on firm transportation commitment - - - 17.3 - -
Add: Impairments 106.4 46.0 104.7 104.5 132.2 132.2
Add/Less: Net loss (gain) on sale of assets, other (2.0) (1.2) 22.0 (0.6) 33.7 (23.5)
Adjusted EBITDAX $ 179.7 $ 173.3 $ 222.5 $ 247.6 $ 316.2 $ 349.6
Pro Forma Adjusted EBITDAX $ 342.4 $ 353.3
dollars in millions
Year ended December 31, LTM
1Q14
26
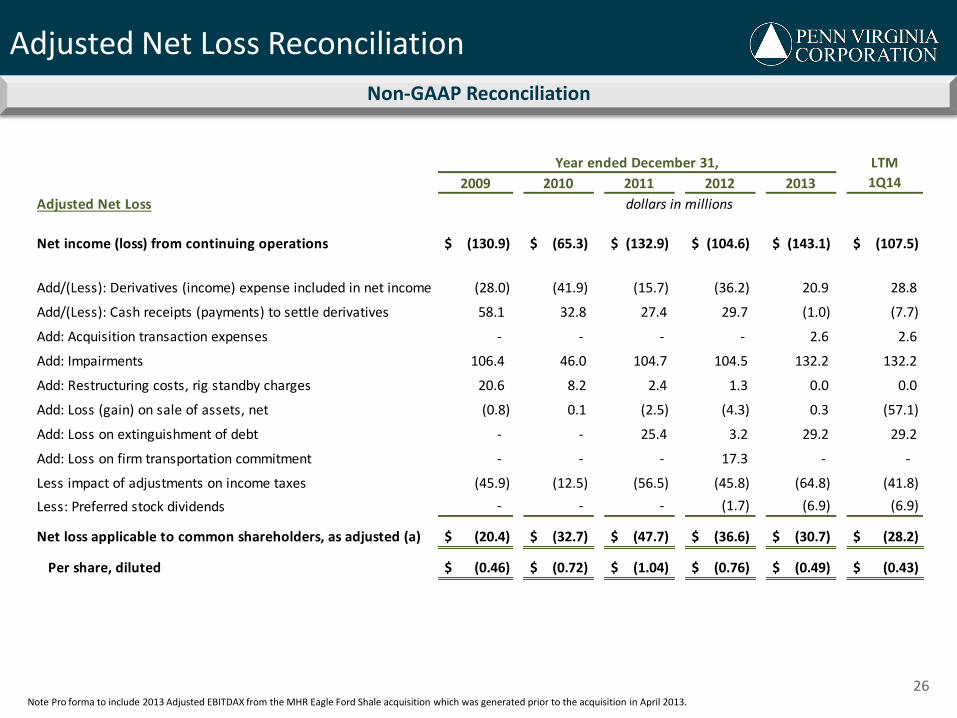
Adjusted Net Loss Reconciliation
Non-GAAP Reconciliation
Note Pro forma to include 2013 Adjusted EBITDAX from the MHR Eagle Ford Shale acquisition which was generated prior to the acquisition in April 2013.
2009 2010 2011 2012 2013
Adjusted Net Loss
Net income (loss) from continuing operations $ (130.9) $ (65.3) $ (132.9) $ (104.6) $ (143.1) $ (107.5)
Add/(Less): Derivatives (income) expense included in net income (28.0) (41.9) (15.7) (36.2) 20.9 28.8
Add/(Less): Cash receipts (payments) to settle derivatives 58.1 32.8 27.4 29.7 (1.0) (7.7)
Add: Acquisition transaction expenses - - - - 2.6 2.6
Add: Impairments 106.4 46.0 104.7 104.5 132.2 132.2
Add: Restructuring costs, rig standby charges 20.6 8.2 2.4 1.3 0.0 0.0
Add: Loss (gain) on sale of assets, net (0.8) 0.1 (2.5) (4.3) 0.3 (57.1)
Add: Loss on extinguishment of debt - - 25.4 3.2 29.2 29.2
Add: Loss on firm transportation commitment - - - 17.3 - -
Less impact of adjustments on income taxes (45.9) (12.5) (56.5) (45.8) (64.8) (41.8)
Less: Preferred stock dividends - - - (1.7) (6.9) (6.9)
Net loss applicable to common shareholders, as adjusted (a) $ (20.4) $ (32.7) $ (47.7) $ (36.6) $ (30.7) $ (28.2)
Per share, diluted $ (0.46) $ (0.72) $ (1.04) $ (0.76) $ (0.49) $ (0.43)
dollars in millions
Year ended December 31, LTM
1Q14